Abstract
While TCRαβ+ CD8α+ CD8β− intraepithelial lymphocytes (CD8αα IEL) differentiate from thymic IEL precursors (IELp) and contribute to gut homeostasis, the transcriptional control of their development remains poorly understood. Here we showed that mouse thymocytes deficient for the transcription factor LRF failed to generate TCRαβ+ CD8αα IEL, and their CD8β-expressing counterparts, despite giving rise to thymus and spleen CD8αβ+ T cells. LRF-deficient IELp failed to migrate to the intestine and to protect against T cell-induced colitis, and had impaired expression of the gut homing integrin α4β7. Single-cell RNA sequencing found LRF necessary for the expression of genes characteristic of the most mature IELp, including Itgb7, encoding the β7 subunit of α4β7. Chromatin immunoprecipitation and gene regulatory network analyses both defined Itgb7 as an LRF target. Our study identifies LRF as an essential transcriptional regulator of IELp maturation in the thymus and subsequent migration to the intestinal epithelium.
Introduction
Intraepithelial lymphocytes (IEL) are long-lived resident T cells that are scattered along the intestinal epithelium1,2. IEL are thought to maintain epithelial barrier function by initializing host defenses against pathogens and regulating immune cell activation. IEL are highly diverse, comprising γδ T cells and conventional and unconventional TCRαβ-expressing T cells. Conventional TCRαβ cells express either CD4 or CD8, the latter as heterodimers CD8α and CD8β subunits (CD8αβ+ αβ T cells). In contrast, unconventional TCRαβ IEL express CD8α homodimers, hence their designation as CD8αα cells, and neither CD4 nor CD8β1–3; because CD8α is required for CD8β surface expression, all CD8+ cells are CD8α+ and there is no “CD8ββ” cell.
Conventional TCRαβ IEL are derived from naïve T cells following recognition of foreign antigens, as suggested by their reduced number in germ-free and protein antigen-free mice4. In contrast, unconventional CD8αα IEL recognize self-antigens. These cells are derived from double-positive (CD4+CD8αβ+) thymocytes that, upon signaling by high-affinity MHC or MHC-like ligands, differentiate into double-negative (CD4−CD8α−) IEL precursors (IELp)1,2,5–11. IELp differentiation is associated with the upregulation of CD5, CD69, PD-1, and the pro-apoptotic factor Bim6,10. After thymic egress, IELp home to the intestinal mucosa in a manner dependent on the expression of integrin α4β7 dimers12–14. Once in the intestinal mucosal, signals from TGFβ and retinoic acid are thought to cause the terminal differentiation of IEL15–17; this notably includes expression of CD8α and integrin αE (CD103) and down-regulation of integrin α4, resulting in the formation of epithelial-homing αEβ7 dimers, and migration to the epithelial layer13,14,18. Signaling by IL-15 and activation of the aryl-hydrocarbon receptor (AHR) by indole-derived microbial metabolites promote intraintestinal IEL terminal differentiation and their maturation and survival17,19,20. Unlike for other agonist selected T cells, e.g. iNKT or Treg cells, no lineage-defining transcription factor has been identified for unconventional IEL. Although T-bet and Runx3 drive IEL-associated gene expression, these factors are not specific to unconventional IEL20,21.
The present study started with the serendipitous observation that the transcription factor LRF22 is needed for CD8+ IEL development. LRF belongs to a subfamily of zinc finger transcription factors characterized by the presence of an amino-terminal BTB-POZ domain, which also includes Plzf and Bcl623,24, and is a close paralog of Thpok25,26, which is required for the development of CD4+ T cells. Since LRF is expressed in both CD4+ and CD8+ T cells27, we examined the potential role of LRF in CD8+ T cell development. We found that, although LRF is largely dispensable for the development of CD8+ T cells in the thymus and peripheral lymphoid organs, it is required for the formation of CD8+ TCRαβ IEL populations, both CD8α+ CD8β+ and CD8α+ CD8β−. Mechanistically, LRF controls IELp migration to the intestinal epithelium and their expression of α4β7 integrin dimers. Leveraging single-cell RNA sequencing (scRNAseq) to characterize the gene expression programs of thymic IELp, we define the impact of LRF on their differentiation.
Results
LRF is needed for the development of TCRαβ+CD8+ IEL
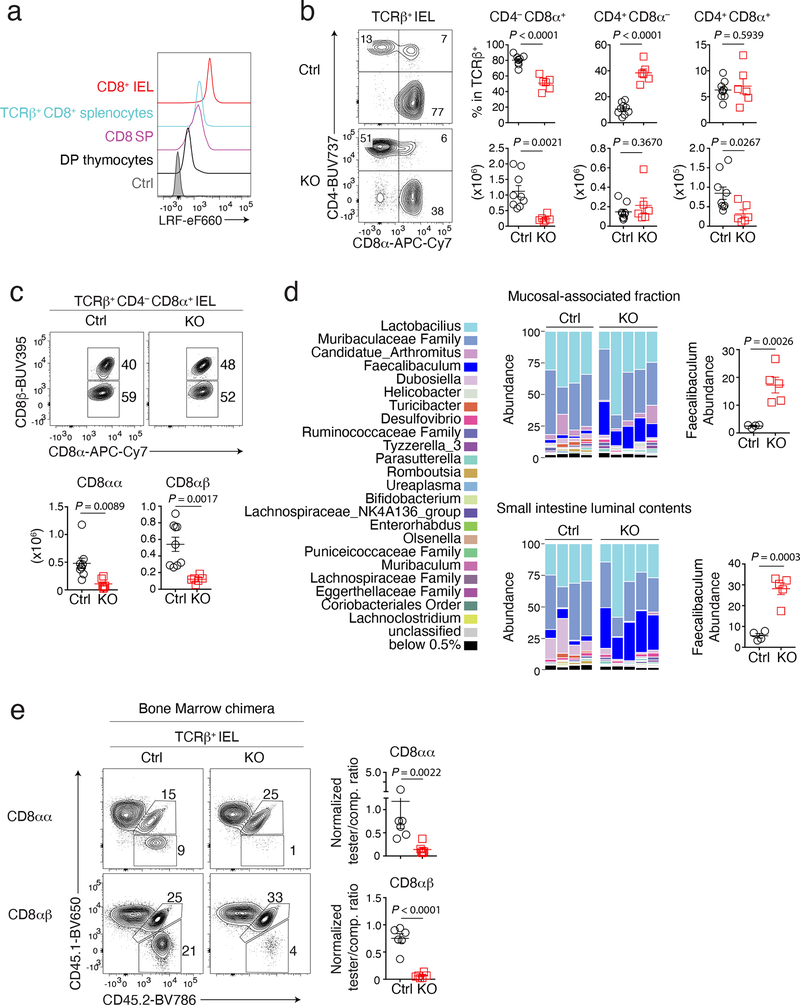
Although dispensable for CD4+ T cell development, LRF serves redundantly with Thpok to maintain the integrity of the CD4+ T cell lineage27,28. Unlike Thpok, whose expression is CD4+-lineage-specific25,26, LRF is expressed in both conventional CD4+ and CD8+ thymocytes and T cells (Fig. 1a and Extended Data Fig. 1a)27,28, raising the question whether it contributes to CD8+ T cell development. To address this, and because LRF is needed for embryonic development29,30, we inactivated the gene encoding LRF (Zbtb7a, called Lrf hereafter) in CD4+CD8+ (DP) thymocytes, using Cd4-Cre to delete Lrf “floxed” alleles (Lrffl). We examined CD8+ T cell numbers in Cd4-Cre Lrffl/fl (hereafter LRF KO) mice and Cre-negative Lrffl/fl mice as controls. While LRF deletion had modest effects on CD8+ T cell numbers in the thymus, spleen, and mesenteric lymph nodes (mLN) (Extended Data Fig. 1b), it strongly reduced the frequency and numbers of TCRαβ+ CD4−CD8+ IEL in the small intestine (Fig. 1b). Expression of CD8β distinguishes two CD8+ IEL subsets: CD8α+ CD8β+ (CD8αβ) and CD8α+ CD8β− (CD8αα). We found that Lrf disruption reduced both subsets (Fig. 1c). Since IEL are thought to be important for intestinal immune homeostasis, we assessed LRF KO mice for barrier permeability and bacterial dysbiosis. Using serum levels of soluble CD14 as a marker of barrier integrity31, we found no evidence of increased permeability in LRF KO mice (Extended Data Fig. 1c). In contrast, 16S sequencing of the small intestine microbiota showed significant differences between Ctrl and LRF KO mice, including an increased frequency of Faecalibaculum in KO mice (Fig. 1d and Extended Data Fig. 1d), supporting the conclusion that LRF was important for gut homeostasis.
Figure 1. LRF is needed for IEL development.
(a) Stacked histograms show LRF expression in indicated wild-type cells and in TCRβ+ CD4−CD8+ splenocytes from LRF KO mice as a control (grey-shaded). Data are from one experiment representative of two.
(b) Contour plots on the left show CD8α vs. CD4 expression on TCRβ+ IEL from Ctrl and LRF KO mice. Graphs (right) show the percentage (top) and absolute number (bottom) of TCRβ+ cells in indicated IEL subsets. Data pooled from four independent experiments with a total of 9 Ctrl and 6 LRF KO mice; each symbol represents one mouse.
(c) Flow cytometric expression of CD8α vs. CD8β in TCRβ+ CD4−CD8α+ IEL from Ctrl and LRF KO mice (top). The bottom graphs show the total number of CD4− CD8α+ CD8β− (CD8αα, left) and CD4− CD8α+ CD8β+ (CD8αβ, right) IEL. Data pooled from three independent experiments with a total of 9 Ctrl and 6 LRF KO mice, each symbol represents one mouse.
(d) Graph shows microbiota distribution (percent of total species) in the small intestine mucosal-associated fraction (top) and luminal contents (bottom) from Ctrl (n = 4) and LRF KO (n = 5) mice. Data are from one experiment representative of two, each column represents one mouse. Graphs on the right show the percentage of Faecalibaculum in indicated conditions.
(e) Expression of CD45.1 vs. CD45.2 in CD8αα (top) and CD8αβ (bottom) IEL from irradiated CD45.1+ host mice reconstituted with CD45.2+ tester (either Ctrl or LRF KO, n = 6 per group) and CD45.1+CD45.2+ competitor (comp.) bone marrow mixed with a 1:1 ratio. Graphs (right) show tester/competitor ratios in IEL subsets, normalized to tester/competitor ratio of B220+ splenocytes in the same mouse. Data pooled from two independent experiments, totaling 6 mice per group. Each symbol represents one mouse.
(b, c, d and e): Error bars indicate standard error of the mean (SEM). P values are from two-tailed unpaired t-test.
Intra-cellular staining and flow cytometry showed that half of the residual CD8αα IEL of LRF KO mice had retained LRF expression (Extended Data Fig. 1e). Thus, to better evaluate the impact of LRF on IEL, we assessed CD8αα and CD8αβ IEL in mixed chimeras generated by reconstituting lethally irradiated CD45.1+ host mice with a 1:1 mix of tester (either control or LRF KO) CD45.2+ and wild-type competitor CD45.1+CD45.2+ bone marrow. Eight-twelve weeks after reconstitution, LRF KO cells failed to contribute to CD8+ IEL populations (whether CD8αα or CD8αβ) in chimeric mice, unlike control cells (Fig. 1e). LRF deletion similarly affected CD4+CD8α+ IEL, but had a lesser impact on CD4+CD8− IEL (Extended Data Fig. 1f), possibly because the latter, but not the former, express Thpok which can serve redundantly with LRF in T cells27,28,32. Importantly, LRF deletion had no significant effect on CD8+ spleen T cell populations (Extended Data Fig. 1g). We concluded from these experiments that LRF is cell-intrinsically required for the development or accumulation of all subsets of CD8+ IEL.
LRF promotes IEL precursor migration to the gut epithelium.
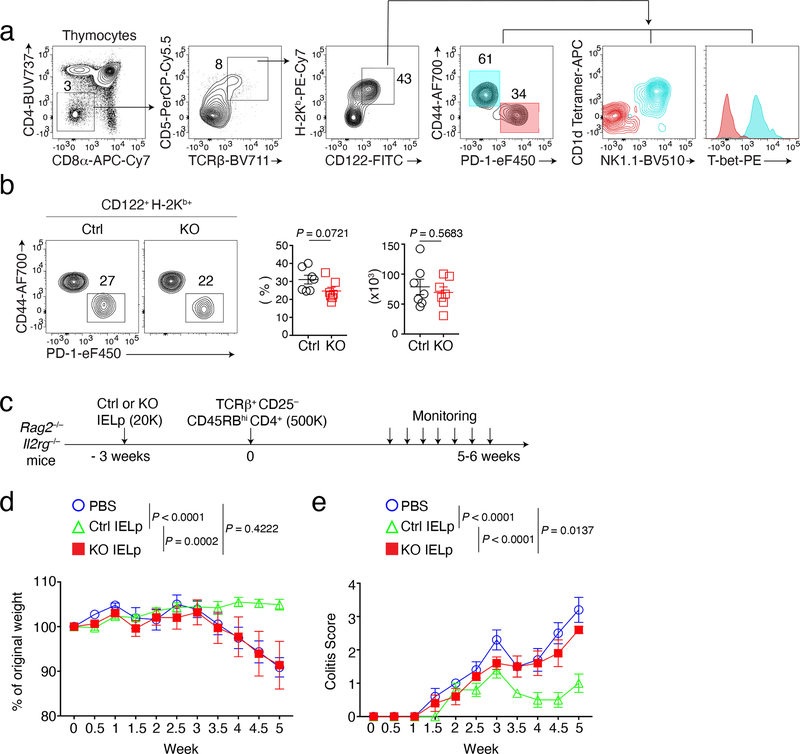
Before further exploring the mechanisms of LRF functions in CD8+ IEL, we considered how these cells develop. CD4+CD8α+ IEL derive from MHC II-restricted CD4+CD8− cells which express Thpok, notably Treg32,33; because of the overlapping functions of Thpok and LRF27,28, we did not consider these cells further. CD4− CD8αβ IEL are thought to differentiate from conventional naïve MHC I-restricted CD8αβ T cells reactive against gut antigens1,2, as do lamina propria CD4− CD8αβ T cells, whose numbers were also reduced in LRF KO mice (Extended Data Fig. 1h); little is known about how these cells acquire intestinal epithelial-homing properties, complicating analyses of LRF functions in their development. In contrast, CD8αα IEL derive from thymic precursors (IELp) with avidity for self-MHC or MHC-like ligands1,2,7,8,10,11,34–36. We considered that this previously characterized developmental sequence, distinct from that of conventional CD8αβ cells, would facilitate analyses of LRF functions. Thus, we focused on the impact of LRF on CD8αα IEL development. IELp are found among TCRαβ+ CD25− CD4−CD8− (DN) thymocytes expressing markers of high-intensity TCR signaling (CD5hi PD-1hi) and maturation (CD122+ H-2Kb+)6,9,10. Within this population, gating out CD44hi cells excluded most CD1d-tetramer-reactive iNKT cells, and a subset of T-bethi cells with little or no IEL precursor activity in the adult thymus9,37 (Fig. 2a). We thus defined IELp as TCRαβ+ CD5hi PD-1hi CD122+ H-2Kb+ CD44lo DN thymocytes, both for analytical and purification purposes. These cells expressed more LRF than DP or conventional SP thymocytes (Extended Data Fig. 2a).
Figure 2. LRF is required for IELp immune regulatory functions.
(a) Gating strategy for analysis of thymic IELp. Cyan and red color represent CD44+ cells and IELp respectively.
(b) Flow cytometry analysis of IELp from Ctrl and LRF KO mice (n = 7 per group). Representative contour plots (left) show expression of CD44 vs. PD-1 on CD4− CD8α− TCRβ+ CD5+ H-2Kb+ CD122+ cells in the thymus from Ctrl and LRF KO mice. Graphs show the percentage (middle) of IELp (CD44− PD-1+ cells) among CD4−CD8− TCRβ+ CD5+ H-2Kb+ CD122+ thymocytes and the absolute number (right, each symbol represents one mouse) of IELp. Data pooled from five independent experiments.
(c) Schematic of adoptive transfer colitis experiments in Rag2–/–Il2rg-–/– mice. K indicates 1000 cells.
(d, e) Rag2–/–Il2rg-–/– mice were adoptively transferred with TCRβ+ CD4+ CD25−CD45RBhi splenocytes from C57BL/6 mice 3 weeks after receiving either PBS, Ctrl IELp or LRF KO IELp at time 0, as schematized in (c)(n=5 per group). Graphs show changes in body weight (d) and colitis scores (e) post CD4+ T cell transfer. Data are from one experiment representative of two (n=5 per group in each experiment).
Error bars indicate standard error of the mean (SEM). P values are from two-tailed unpaired t-test (b) or two-way ANOVA (d, e).
Ctrl and LRF KO mice had similar numbers of thymic IELp (Fig. 2b) and KO IELp were not outcompeted by wild-type competitors in mixed bone marrow chimera (Extended Data Fig. 2b). Using adoptive transfer experiments (Fig. 2c), we compared the ability of Ctrl and LRF KO IELp to control intestinal inflammation generated by introducing naïve CD4+ T cells into Rag2-Il2rg deficient mice, which lack lymphocytes and lymphoid cells. Consistent with previous results38, colitis was significantly attenuated by transfer of Ctrl IELp, as assessed by weight loss or colitis score (Fig. 2d,e). In contrast, transfer of LRF KO IELp failed to improve symptoms and revert weight loss. Thus, the contribution of CD8αα IEL to intestinal homeostasis requires LRF.
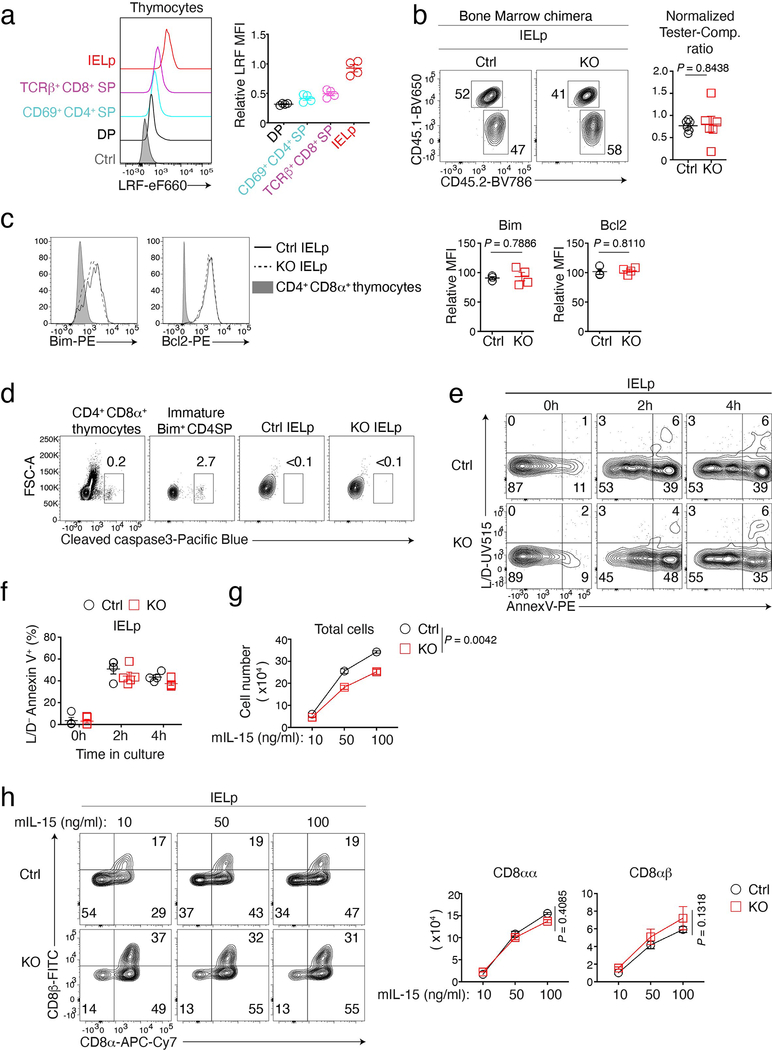
Given these results, we examined if LRF affects IELp survival, proliferation, or differentiation. Expression of anti-apoptotic Bcl2 and pro-apoptotic Bim was not affected by LRF deletion (Extended Data Fig. 2c), whereas staining for activated Caspase 3 or Annexin V binding, two markers of apoptosis, found no evidence for reduced survival of KO over Ctrl IELp (Extended Data Fig. 2d–f). This was consistent with the balanced ratio of KO and competitor IELp in mixed bone marrow chimeras (Extended Data Fig. 2b). We next cultured purified Ctrl and LRF KO thymic IELp for 4 days in the presence of IL-15, which promotes IELp proliferation and differentiation19–21. Ctrl IELp proliferated and generated CD8αα and CD8αβ cells (Extended Data Fig. 2g, h), consistent with previous reports, and this was not significantly affected by LRF deletion.
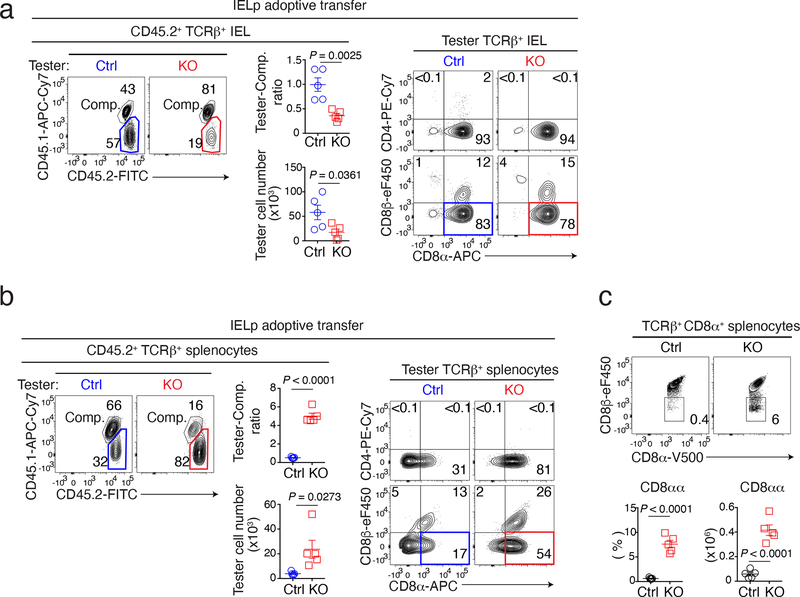
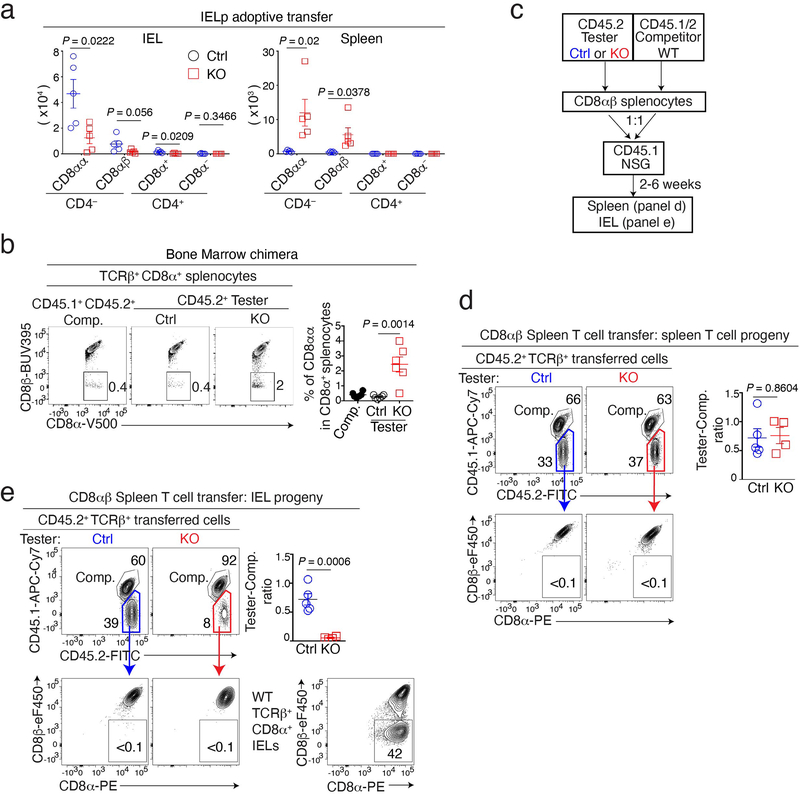
Given that LRF was necessary for IELp function but dispensable for their development, we speculated that it promoted IELp migration to or retention in the gut. To assess this possibility, we mixed (1:1 ratio) allelically marked tester (either Ctrl or LRF KO, CD45.1− CD45.2+) and wild-type competitor (CD45.1+CD45.2+) IELp, and adoptively transferred them into NSG host mice, which lack lymphoid cells. We compared the contribution of Ctrl and KO IELp to the IEL population of host mice, 2–6 weeks after transfer. When co-transferred with wild-type competitor IELp, Ctrl tester IELp contributed equally to the mature IEL population and primarily became CD8αα T cells (Fig. 3a and Extended Data Fig. 3a). Although LRF KO IELp also gave rise to CD8αα IEL, they were outcompeted by wild-type cells (Fig. 3a and Extended Data Fig. 3a). Unlike Ctrl IELp, KO IELp generated a sizable population of TCRαβ+ CD8αα cells in the spleen (Fig. 3b and Extended Data Fig. 3a). Accordingly, we found ectopic TCRαβ+ CD8αα cells in the spleen of LRF KO mice (Fig. 3c) and in the LRF KO component of mixed bone marrow chimeras (Extended Data Fig. 3b).
Figure 3. LRF is required for IELp gut homing.
(a, b) Contour plots show CD45.1 vs. CD45.2 expression (left) or CD8α vs. CD4 or CD8β expression (right panels) in TCRβ+ CD45.2+ IEL (a) and splenocytes (b) from NSG host mice transferred with a 1:1 mix of CD45.2+ tester (either Ctrl or LRF KO, n = 5 per group) and CD45.1+CD45.2+ wild-type competitor IELp. Summary graphs (middle, each symbol represents one mouse) show tester/competitor ratios (top) and absolute number of CD45.2+ tester cells (bottom) in IEL (a) and spleen (b). Data are from one experiment representative of two.
(c) Contour plots show CD8α vs. CD8β expression on TCRβ+ CD8α+ splenocytes from Ctrl and LRF KO mice (top). Bottom graphs show the percentage (left) of CD8αα cells in TCRβ+ CD8α+ splenocytes and absolute number (right) of CD8αα cells. Data pooled from three independent experiments with a total of 5 mice per group. Each symbol represents one mouse.
Error bars indicate standard error of the mean (SEM). P values (a-c) are from two-tailed unpaired t-test.
This supported the idea that LRF KO IELp were diverted from the gut to the spleen while acquiring CD8α expression. However, it was also conceivable that the LRF KO CD8αα spleen T cells found in unmanipulated mice derived from conventional CD8αβ T cells rather than from IELp. To address this, we adoptively transferred either LRF KO or Ctrl CD8αβ splenocytes into NSG mice, together with wild-type competitors (Extended Data Fig. 3c). Ctrl and LRF KO conventional CD8αβ splenocytes similarly gave rise to spleen T cells, which were CD8αβ but not CD8αα (Extended Data Fig. 3d). In contrast, transferred LRF KO CD8αβ splenocytes only minimally contributed to IEL populations, contrary to their Ctrl counterparts (Extended Data Fig. 3e). This supported the conclusion that LRF was important for gut homing of both CD8αα and CD8αβ IEL. Regardless of genotype, CD8αβ splenocytes had no CD8αα progeny.
LRF is required for integrin α4β7 expression on IELp
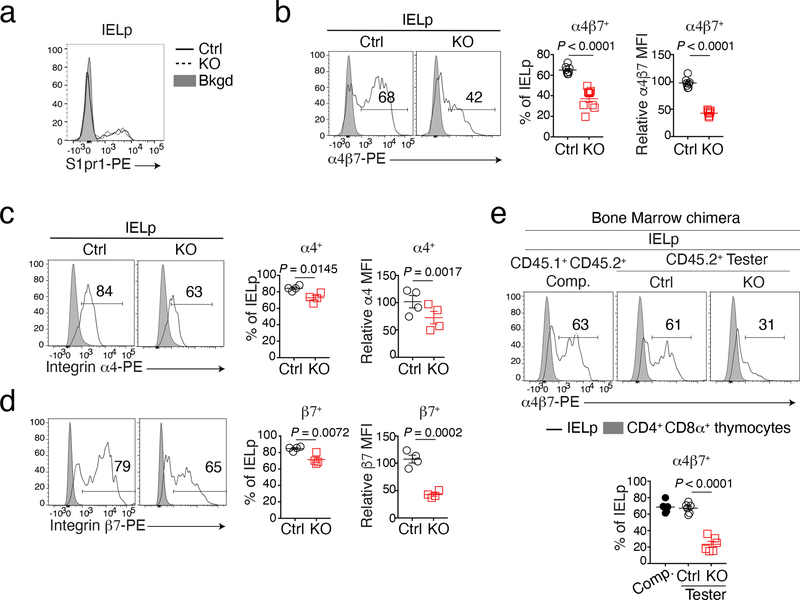
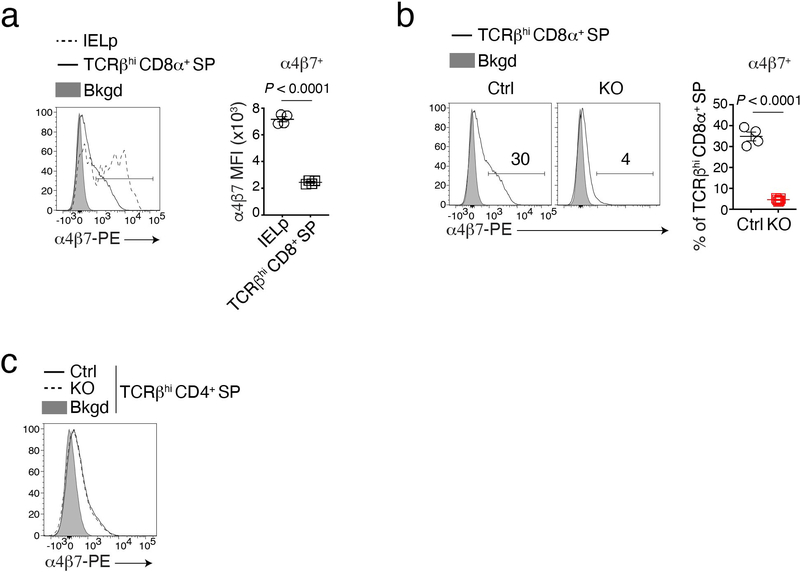
The preceding findings supported the conclusion that LRF disruption did not prevent IELp differentiation into CD8αα cells, but impaired their gut homing and diverted them to the spleen. IELp homing to the intestinal epithelium notably requires S1pr1, enabling thymic egress39, the α4β7 integrin dimer, promoting trafficking to the gut12,14, and two molecules directing epithelial homing, CCR9 and a dimer of integrins αE (CD103) and β7 (αEβ7)13,14,18. Of these, S1pr1 and integrins α4 and β7 are expressed in thymic IELp, whereas CD103 and CCR9 are thought to be induced in the gut mucosa by retinoic acid and TGFβ15–17. Flow cytometry found similar expression of S1pr1 in Ctrl and LRF KO thymic IELp (Fig. 4a). In contrast, IELp expression of α4β7 was impaired in LRF KO mice (Fig. 4b). Staining for each subunit showed a more pronounced effect of LRF on β7 than on α4 (Fig. 4c,d). The LRF requirement for proper α4β7 expression was also observed in bone marrow chimeras (Fig. 4e), indicating that it is cell intrinsic, and on conventional CD8+ SP thymocytes even though these expressed less α4β7 than IELp (Extended Data Fig. 4a,b). α4β7 expression was minimal on CD4+ SP thymocytes (Extended Data Fig. 4c). It was not affected by LRF, possibly because these cells, unlike IELp16 and CD8+ SP thymocytes, expressed Thpok. These findings suggested that LRF is important for expression of integrin α4β7.
Figure 4. LRF is required for α4β7 expression on IELp.
(a) Histogram shows the expression of S1pr1 on IELp from Ctrl (black solid line) and LRF KO (black dashed line) mice. Gray-shaded histogram (Bkgd) shows background of PE fluorochrome signal in IELp from Ctrl mice for which the primary S1pr1 antibody was omitted from the staining mix. Data are from one experiment representative of two, each with one mouse per genotype.
(b-d) Histogram overlays (left) show staining of Ctrl and LRF KO IELp with antibodies specific for the α4β7 integrin dimer (b), or for its α4 (c) or β7 subunits (d). Gray shaded histogram shows the same staining on wild-type CD4+CD8+ thymocytes. Graphs on the right show the percentage of cells gated in histograms (left) and indicated protein expression (mean fluorescence intensity, MFI, right); MFI is computed on cells expressing each protein (left plot bracket) and expressed relative to that in IELp from wild type C57BL/6 mice, set at 100 in each experiment. Data pooled from two independent experiments with a total of 4 mice per group. Each symbol represents one mouse.
(e) Histograms show expression of α4β7 dimers in indicated IELp from bone marrow chimera analyzed in Fig. 1e. Graph (bottom) shows the percentage of α4β7+ cells among IELp. Data pooled from two independent experiments with a total of 6 mice per group. Each symbol represents one mouse.
Error bars indicate standard error of the mean (SEM). P values are from two-tailed unpaired t-test (b, d and e) or two-way ANOVA (c).
LRF promotes IELp maturation in thymus
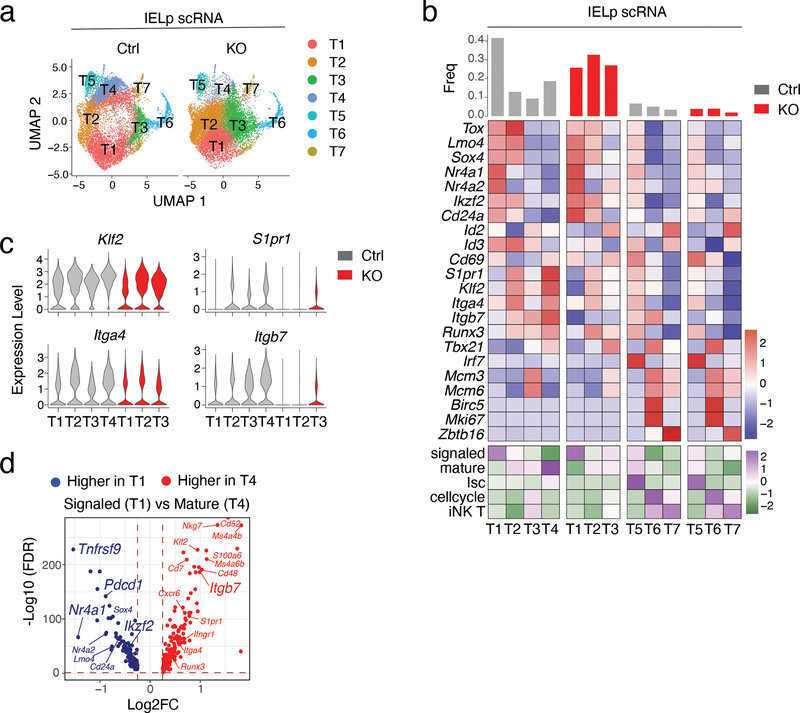
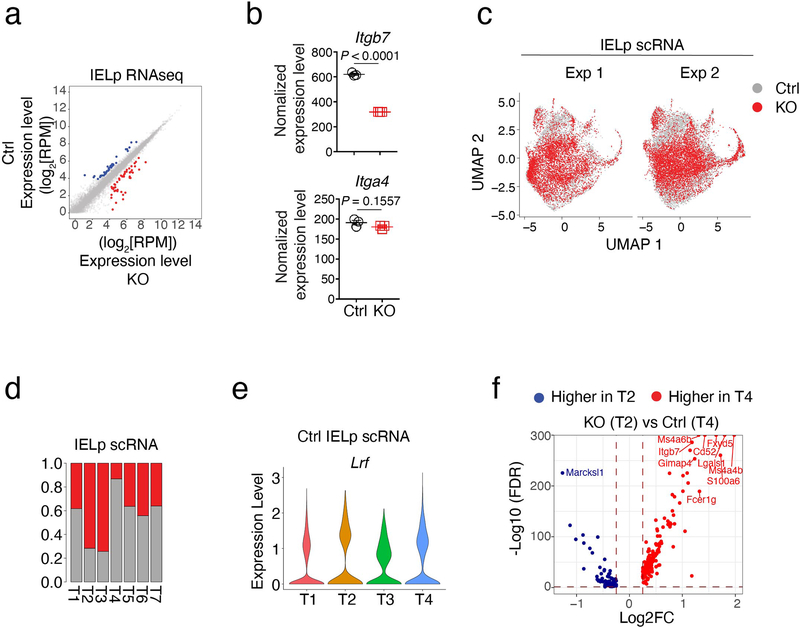
To assess the impact of LRF on Itga4 and Itgb7 (encoding integrins α4 and β7, respectively) and identify other possible LRF targets, we performed RNA sequencing (RNAseq) on purified IELp populations from Ctrl and LRF KO mice. Unexpectedly, LRF disruption had a minimal effect on the IELp transcriptome, with no obvious pattern among differentially expressed genes (Extended Data Fig. 5a). The effect of LRF deletion on Itgb7 was modest, and there was no effect on Itga4 (Extended Data Fig. 5b). Because surface expression of α4β7 on IELp was not unimodal (Fig. 4b), we considered that the impact of LRF on IELp would be better analyzed by single-cell RNAseq (scRNAseq). Using 10x Genomics Chromium, we performed two separate experiments, each capturing Ctrl and LRF KO cells purified in parallel. We used Seurat to integrate and analyze the combined data set of 10,229 Ctrl and 12,232 LRF KO cells (Supplementary Table 1). UMAP analysis showed cells segregating by genotype rather than by experimental replicate, confirming proper integration (Extended Data Fig. 5c). Unsupervised clustering identified seven main cell clusters, each projecting to a different area of the UMAP plot (Fig. 5a and Extended Data Fig. 5d). Expression of known genes assigned three small clusters found in both genotypes and that we did not consider further (Fig. 5b, right two panels): (i) Cluster T (thymic) 5, which showed evidence of type I interferon-induced signaling, as was previously identified among conventional thymocytes40,41, (ii) Cluster T7, which expressed Zbtb16, encoding the transcription factor PLZF42,43 characteristic of iNK T cells, and (iii) Cluster T6, scoring high for cell cycle markers, including Mki67; this cluster also expressed Tbx21 (Fig. 5b), suggesting that it comprised post-selection cells unrelated to the main IELp developmental pathway.
Figure 5. Impact of LRF on the IELp transcriptome.
(a-d) scRNAseq of thymic IELp.
(a) UMAP analysis of Ctrl and LRF KO IELp, displayed separately by genotype. Each dot is a cell and is color-coded by cluster (T1-T7), as defined in (b).
(b) Expression of selected genes (top, blue-red scale) and signature scores (bottom, green-purple scale) among IELp clusters defined on the integrated set of cells from both genotypes. The top bar graph indicates the frequency of cells in each cluster within the indicated genotype. Genotype-specific components of clusters T1-T4 (left two panels) and T5-T7 (right panels) are displayed separately. Gene expression values and signature scores are row z-scored on all clusters; color scales are indicated at the bottom right of each panel. Signaled, mature, Isc, cell-cycling, iNK T gene signature include genes with higher (FDR<0.05, Log2FC >0.25) expression in each of Ctrl clusters T1, T4, T5, T6, or T7, respectively, compared with all the other Ctrl cells.
(c) Violin plots show gene expression levels in selected clusters from indicated genotype.
(d) Volcano plot showing differentially expressed genes (FDR<0.05, |Log2FC| >0.25) between signaled (T1) and mature (T4) Ctrl IELp. The x-axis represents the mature over signaled average Log2 fold change (Log2FC); the y-axis shows -Log10 transformed FDR (adjusted p-value). Blue and red symbols indicate genes preferentially expressed in signaled and mature IELp, respectively. p-values were returned by Seurat FindMarkers function using a Wilcoxon Rank Sum test.
We then examined the Ctrl components of clusters T1-T4, which all had similar Lrf expression (Extended Data Fig. 5d,e). Cluster T1, (~43% of Ctrl IELp, Fig. 5b, leftmost panel), showed high expression of Nr4a1 (encoding the transcription factor Nur77), a target of TCR signaling44; thus, we referred to Cluster T1 as a signaled cluster. Cluster T4, accounting for ~19% of Ctrl IELp, showed high-level expression of Klf2, S1pr1, and of Itga4 and Itgb7 (Fig. 5b,c), indicating that it included the most mature IELp; accordingly, expression of Cd24a, a marker of immature thymocytes, was highest in Cluster T1 and lowest in Cluster T4 (Fig. 5b). Altogether, 151 genes showed higher expression in the signaled cluster T1 than in the mature cluster T4, including Nr4a1, Ikzf2, Pdcd1, and Tnfrsf9 (encoding 4–1BB), whereas 205 were expressed higher in T4 than T1 (Fig. 5d, Supplementary Table 2). Additionally, we computed signaled and mature signatures including genes preferentially expressed in either cluster T1 or T4, compared to all other groups combined (Supplementary Table 3). Clusters T2 and T3 showed intermediate scores for these signatures, and for expression of Cd24a (Fig. 5b).
We next compared the contribution of Ctrl and LRF KO cells to clusters T1-T4. Whereas the signaled cluster T1 was almost equally shared between both genotypes, LRF KO cells were largely excluded from mature cluster T4 (Extended Data Fig. 5d). Both genotypes contributed to clusters T2 and T3. Within each of clusters T1-T3, there was little genotype-specific difference in gene expression or signature scores, except for lower expression of Itgb7 in KO cells across all clusters (Fig. 5b, left two panels, and 5c). Since the most mature cluster T4 had no KO component, we estimated the impact of LRF on IELp gene expression by comparing Ctrl cluster T4 to LRF KO cluster T2, in which signaled and mature signatures were the closest to T4 (Fig. 5b, bottom). This identified 190 genes expressed higher in Ctrl T4 than in KO T2, and 72 genes with the opposite pattern; we considered these sets as our best estimate of LRF-dependent and -repressed genes, respectively (Extended Data Fig. 5f and Supplementary Table 4). We conclude from these findings that LRF is needed for the differentiation of mature IELp, and for Itgb7 expression at all stages of their differentiation.
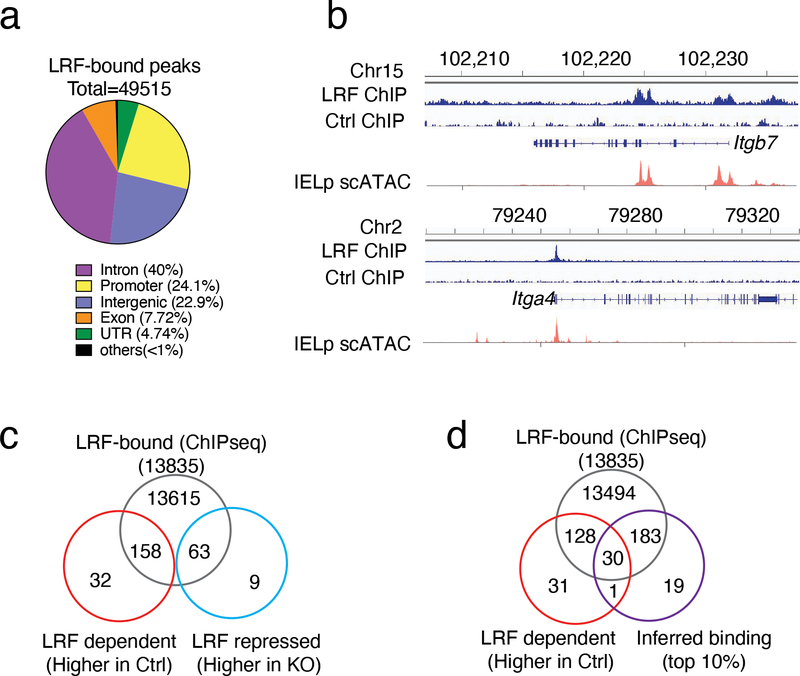
The impact on Itgb7 expression in thymic IELp suggested that it was mediated, at least in part, by LRF binding to the Itgb7 locus. We thus mapped LRF genomic binding sites (Fig. 6a and Supplementary Table 5) using an in vivo biotinylation and streptavidin pull-down and deep sequencing approach45 (ChIPseq). These experiments, performed on activated T cells because of limiting numbers of IEL or IELp, showed LRF recruitment to Itga4 and Itgb7 (Fig. 6b, blue traces). To verify that these sites mapped to areas of chromatin accessible to transcription factor binding in IELp, we performed single cell ATAC sequencing (scATACseq) on Ctrl IELp, using the 10x Genomics platform. Data analysis with the Signac extension of Seurat identified accessible regions of Itga4 and Itgb7 mapping to LRF ChIPseq peaks (Fig. 6b, red traces).
Figure 6. LRF binds the Itgb7 locus.
(a, b) LRF ChIP-seq in activated CD4+ T cells from Rosa26BirA+ mice transduced with LrfBio retrovirus (LRF ChIP) or empty retrovirus (Thy1.1 expressing, Ctrl ChIP).
(a) Pie chart shows the genome-wide distribution of LRF ChIPseq binding sites in activated T cells.
(b) Peaks show LRF binding sites in Itgb7 and Itga4 genes. For each gene, bottom tracks (scATAC) show chromatin accessibility in IELp.
(c) Venn diagrams show overlap between the sets of LRF-binding genes (ChIPseq, top), and genes preferentially expressed in Ctrl (LRF-dependent, bottom left) or LRF KO (LRF-repressed genes, bottom right) IELp, as defined in Extended Data Fig. 5f.
(d) Venn diagrams show intersection between the sets of LRF-binding genes (ChIPseq), scRNAseq-defined LRF-dependent genes (defined in Extended Data Fig. 5f) and the top 10% genes inferred as LRF targets by CellOracle.
In addition to Itga4 and Itgb7, most LRF-controlled genes (defined in Extended Data Fig. 5f and Supplementary Table 4) contained ChIPseq-defined LRF binding sites (Fig. 6c), consistent with direct transcriptional control. However, ChIPseq identified 49,515 sites bound by LRF, most of which within or near 13,835 genes (Fig. 6a,c and Supplementary Table 5), i.e. many more than LRF-dependent genes. Thus, we sought independent evidence to support the involvement of LRF DNA binding in expression of Itgb7 and other genes it controls. Given the number and size of LRF binding regions within or near Itgb7 (Fig. 6b), we adopted a computational approach. We used CellOracle46, a machine learning suite that estimates transcription factor contribution to target gene expression from analyses of DNA binding motifs and of scRNAseq and scATACseq data. Because our CellOracle analysis did not rely on ChIPseq, we reasoned that it would provide ChIPseq-independent evidence to support conclusions on direct control. We performed the CellOracle analysis on the transcriptome of the LRF-dependent cluster T4 and the IELp scATACseq data, and focused on the top 10% (233) genes inferred to be positively regulated by LRF (Fig. 6d and Supplementary Table 6). Of these, 213 (92%) had LRF ChIPseq binding, and were thus defined as LRF targets by both biochemical and computational approaches. Thirty such genes were LRF-dependent (i.e. were expressed higher in Ctrl cluster T4 than in KO cluster T2, as defined in Extended Data Fig. 5f), including Itgb7, which ranked within the top 15 targets scored by CellOracle (Fig. 6d and Supplementary Tables 6, 7). Thus, two independent approaches support the conclusion that LRF promotes Itgb7 expression at least in part by direct binding.
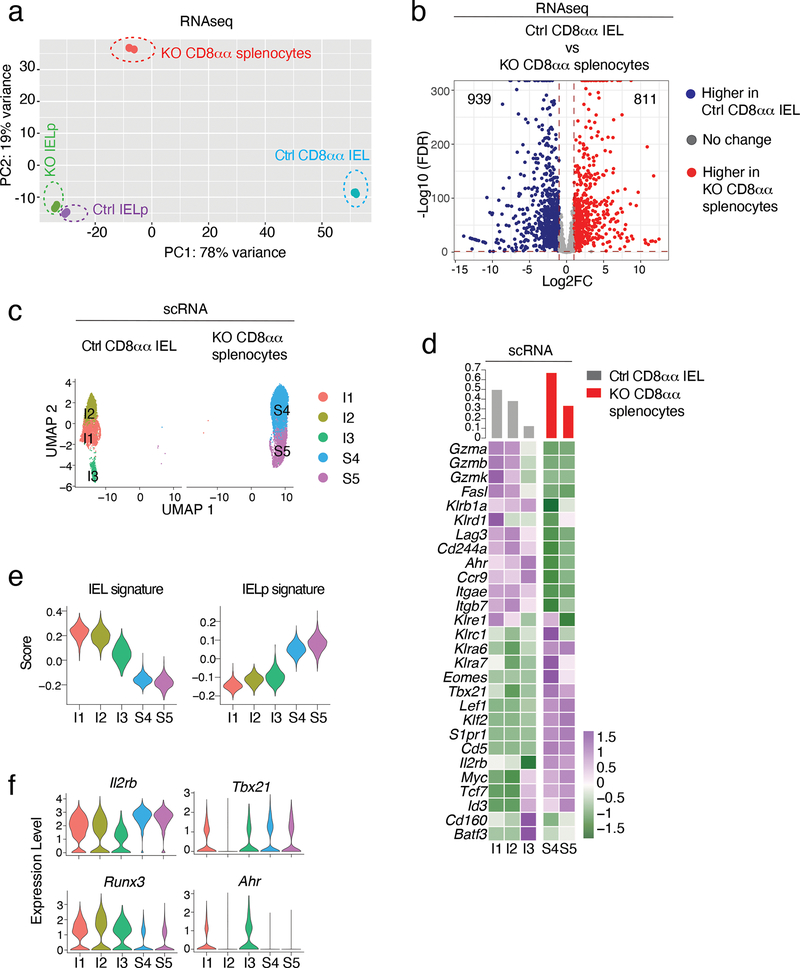
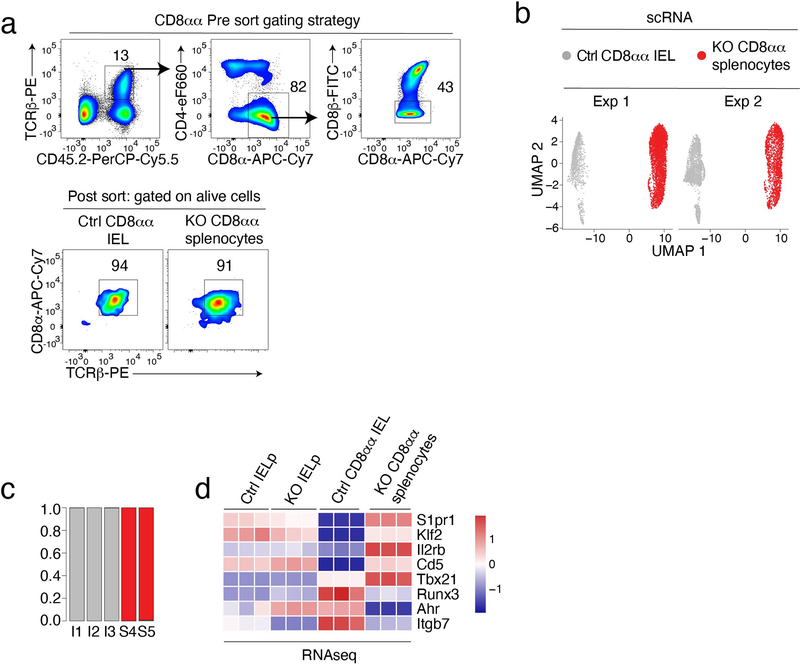
Last, to assess the impact of LRF on IELp post-thymic progeny, we compared the transcriptome of Ctrl CD8αα IEL and LRF KO CD8αα splenocytes. RNAseq on sorted populations, performed in parallel with IELp (Extended Data Fig. 5a), showed broader differences between genotypes in post-thymic CD8αα T cells than in IELp, with 1750 genes preferentially expressed in either post-thymic population (Fig. 7a,b and Supplementary Table 8). Despite these differences, we speculated that intermediate differentiation states may be common to both genotypes. To address this, we performed scRNAseq on Ctrl CD8αα IEL and LRF KO CD8αα spleen T cells (Extended Data Fig. 6a–c), which we analyzed using the same procedure as for IELp. Contrary to the hypothesis, Ctrl and KO cells were sharply demarcated in UMAP and clustering analyses (Fig. 7c,d and Extended Data Fig. 6b,c), with no detectable shared cluster. Using signatures defined on Ctrl cells (population RNAseq, Supplementary Table 9), we found that LRF KO CD8αα splenocytes had not implemented the CD8αα IEL transcriptome (Fig. 7e and Supplementary Table 10). Compared to wild-type CD8αα IEL, LRF KO CD8αα spleen T cells expressed at least as much Il2rb and Tbx21 (Fig. 7f), indicating that the differentiation block did not result from impaired IL-15 signaling20,21. However, LRF KO CD8αα spleen T cells expressed less Ahr and Runx3 than Ctrl IEL (Fig. 7f); both genes promote CD8αα IEL development or maintenance and are induced by intestinal nutrients or microbial products17,47, or TGFβ16. These findings, and similar observations on bulk RNAseq data (Extended Data Fig. 6d), suggested that the transcriptomic differences between Ctrl CD8αα IEL and LRF KO CD8αα spleen T cells were at least in part caused by their distinct location. This supported the conclusion that LRF contributes to CD8αα IEL differentiation in part by promoting IELp homing to the gut.
Figure 7. LRF is needed for acquisition of the mature IEL transcriptome.
(a, b) Population RNAseq of Ctrl and KO IELp and CD8αα post-thymic T cells.
(a) PCA plot. (b) Volcano plot showing differentially expressed genes (FDR<0.05, |Log2FC| >1) between Ctrl CD8αα IEL and LRF KO CD8αα spleen T cells. Blue and red symbols indicate genes preferentially expressed in Ctrl and KO cells, respectively. p-value calculated using a Wald test.
(c-f) scRNAseq of Ctrl CD8αα IEL and KO CD8αα spleen T cells. Analyses shown were performed on integrated data from two separate experiments (two replicates per genotype).
(c) UMAP plot, displayed per genotype. Each dot represents a cell and is color-coded by cluster.
(d) Heatmap shows row-standardized expression of selected genes among clusters (below heatmap, color scale at bottom right). For each genotype, the top bar graph indicates the frequency of cells in each cluster relative to the total number of cells with that genotype.
(e) IEL and IELp signature score across clusters from each genotype. The signatures include genes with expression either higher (IEL signature) or lower (IELp signature) in IEL than IELp (FDR <0.01, |Log2FC| >2, Supplementary Table 9).
(f) Violin plots show expression of indicated genes across clusters.
Discussion
The present study demonstrates that LRF, in addition to its role in hematopoietic cell differentiation24, controls IELp late differentiation and gut homing and thereby contributes to intestinal homeostasis. LRF notably promotes expression of integrin α4β7, which is essential for immune cell migration to the intestine12,14. This impact of LRF on α4β7 is unlike that of other CD8αα IEL-expressed transcription factors, including T-bet and Runx3, which drive IEL cytolytic differentiation notably in response to IL-1520,21. Rather, the effect on α4β7 contributes to direct IELp to the intestinal mucosa, where additional migration cues, including upregulation of CD103 (integrin αE) and of the chemokine receptor CCR9, result in migration to and retention within the epithelial layer13,18.
In IELp, LRF directs a maturation program extending beyond integrins α4 and β7. However, LRF is needed neither for the initial steps of IELp differentiation nor for the survival of these cells. Additionally, unlike Klf2 and S1pr139, LRF is not necessary for IELp egress from the thymus, as LRF-deficient CD8αα cells did not accumulate in the thymus and were located within secondary lymphoid organs. The impact of LRF deletion on CD8αβ T cell gut homing supports the idea that the effect of LRF on α4β7 is not specific of CD8αα cells.
Previous scRNAseq studies41,48–51 had identified IELp subsets in the human and mouse thymus. Among the IELp characterized in the present study, the most mature cluster (T4) roughly matched the Sig-4 cluster identified in our recent study of αβ lineage thymocytes41, whereas clusters T1-T3 correspond to that of a cluster (Sig-3) positioned upstream in the developmental trajectory. Together with these previous results, the present study identifies transcriptomic features of the main biologically-identified IELp population9,37, referred to as “Type A”, that comprises cortical thymocytes with short intrathymic residency time. scRNAseq clustering separates this population into signaled and more mature subsets, identifies transcriptomic properties of these subsets, and shows that LRF is needed for their developmental progression. These cells are distinct from another population with IEL precursor potential. Such “Type B” cells have post-proliferation and effector-like properties, including expression of CD44 and of the transcription factor T-bet, are located in the thymic medulla, and have little or no IEL precursor activity in the adult thymus37.
Our study identified transcriptomic differences between CD8αα IEL and their intrathymic precursors (IELp). It reinforces the idea that gut-specific environmental factors are essential for proper IEL differentiation. In addition to direct effects of LRF on gene expression, the transcriptomic differences between wild-type CD8αα IEL and their LRF-deficient splenic counterparts appear to involve intestinal environmental cues, including those driving expression of transcription factors Runx3 (TGFβ) and Ahr (microbial metabolites). Such differences appear despite appropriate expression of Tbx21 (encoding T-bet), a target of IL-15 signals, in LRF-deficient cells; this supports the idea that the unique transcriptome of CD8αα IEL results from the integration of IL-15 signals (e.g. T-bet expression), and gut-specific cues. We also noted heterogeneity among wild-type CD8αα IEL, including a minor cluster with higher expression scores for genes characteristic of cells with precursor potential (including Tcf7, Myc, or Id3). Future studies will examine if such cells contribute to the clonal expansion previously shown to characterize CD8αα IEL subsets6.
Despite the partially overlapping functions of Thpok and LRF in CD4+ T cells27,28, our study highlights that these proteins serve distinct functions. Whereas Runx3 repression is a critical component of Thpok functions in CD4+ SP thymocytes and naïve T cells28,52, LRF did not repress Runx3 in CD8αα IEL. This is in line with the fact that activated Th1 CD4+ effector T cells co-express both Thpok and Runx3, unlike thymocytes and naïve CD4+ T cells. However, whereas Thpok is essential to represses the cytotoxic program in activated Th1 cells28,45, LRF was necessary (although perhaps not directly supporting) for cytotoxic gene expression in CD8αα IEL. Future studies will examine which other factors or signals account for the context-dependent functions of Thpok and LRF.
In summary, we identify LRF as a novel node in the transcriptional network controlling the fate of IELp. LRF does not serve as an IEL lineage-committing factor, as its paralog Thpok does for CD4+ T cells, or as a specification factor driving initial IELp differentiation. Rather, it is necessary for the terminal maturation of IELp, and thereby their homing to the gut.
Methods
Mice
CD45.1, CD45.2 C57BL/6 mice were purchased from Charles River Laboratories. NOD-scid IL2RGammanull (NSG) animals were obtained from the National Cancer Institute (Frederick, MD). Rag2-Il2rg double knockout mice were purchased from Envigo. Mice carrying Rosa26BirA53 (obtained from Ming Li, Memorial Sloan Kettering Cancer Center) or floxed alleles for Lrf (obtained from P.P. Pandolfi)29,30 or Zbtb7b54 (encoding Thpok) were previously described. Cd4-cre mice55 were from Taconic. Mice were housed in a specific pathogen-free facility under a 12h light/dark cycle at 22 ± 2 °C temperature with 70% of humidity, and analyzed between 6 and 20 weeks of age unless described otherwise. Age and sex matched mice from both sexes were used in experiments. All animal experiments were approved by the NCI Animal Care and Use Committee.
Retroviral vectors and Retroviral transduction
To express a biotin-tagged LRF, a sequence encoding LRF was amplified from MSCV-Puro-LRF-IRES-GFP29 using conventional PCR techniques and the following oligonucleotides (synthesized by IDT) LRF-F(EcoR1): 5’-CCGGAATTCATGGCTGGCGGCGTGGACGG-3’. LRF-R(Sph1): 5’-ACATGCATGCTGGTTGCGAAGTTACCCTCGG-3’. The PCR amplified LRF cDNA sequence was inserted into the retroviral vector pMRX-Thpokbio-tag-IRES-Thy1.145,56,57, encoding biotinylation-tagged (GLNDIFEAQKIEWHE) Thpok, using EcoR1/Shp1 restriction enzyme sites to replace the Thpok-encoding sequence. Retroviral supernatants were produced by transfecting Plat-E packaging cells58. Retroviral supernatants were used to retrovirally transduce activated T cells as described57.
Cell Preparations and Flow Cytometry
Thymocytes, splenocytes, and mLN lymphocytes were prepared as described59. For IEL preparation, the small intestine was dissected and Peyer’s patches were excised. Intestines were cut longitudinally and then transversally into 1 cm pieces. These were suspended in Hank’s balanced salt solution (HBSS) supplemented with 5 mM EDTA (Invitrogen, Cat: 15–575-020) and 0.145 mg/ml DTT (Millipore Sigma, Cat: 10708984001) at 37°C for 20 min and vortexed repeatedly to separate lymphocytes from the epithelial sheaths. Cell aliquots were pooled, concentrated, passed over nylon wool columns, centrifuged on a 30% Percoll (GE Healthcare, Cat: 17–0891-01) gradient, and the IEL were recovered from the bottom. The remaining intestinal tissue were further minced and were resuspended in 20ml of RPMI1640 containing 0.1mg/ml of Liberase (Sigma, Cat: 5401020001) at 37°C for 30 min. The tissue suspension was passed through a 70 μm cell strainer and lamina propria lymphocytes were pelleted by centrifugation at 1500 rpm.
Following isolation, cells were first blocked with anti-FcγRIII/FcγRII (unconjugated, 2.4G2) and then stained for flow cytometry as previously described28,45,57. The following antibodies were used for staining. Clones: CD4 (BUV737, clone GK1.5, 612761,BD Bioscience, 1:200), CD4 (PE-Cyanine7, clone GK1.5, 25–0041-82, eBioscience, 1:200), CD4 (eFluor 660, clone GK1.5, 50–164-28, eBioscience, 1:200), CD4 (Alexa Fluor 700, clone GK1.5, 56–0041-82, eBioscience, 1:200), CD8α (PE, clone 53–6.7, 12–0081-82, Invitrogen, 1:200), CD8α (PE-Cyanine7, clone 53–6.7, 25–0081-82, eBioscience,1:200), CD8α (APC-eFluor 780, clone 53–6.7, 47–0081-82, eBioscience,1:200), CD8α (V500, clone 53–6.7, 560778, BD Bioscience,1:200), CD8α (APC, clone 53–6.7, 553035, BD Bioscience,1:200), CD8β (eFluor 450, clone H35–17.2, 48–0083-82, eBioscience, 1:200), CD8β (BUV395, clone H35–17.2, 740278, BD Bioscience,1:200), CD8β (FITC, clone H35–17.2, 11–0083-82, eBioscience, 1:200), CD44 (Alexa Fluor 700, clone IM7, 56–0441-82, Invitrogen, 1:200), PD-1 (eFluor 450, clone J43, 48–9985-82, eBioscience, 1:200), CD5 (PerCP-Cyanine5.5, clone 53–7.3, A15859, Invitrogen, 1:200), H-2Kb (PE-Cyanine7, clone AF6–88.5.53, 25–5958-82, Invitrogen, 1:200), CD122 (FITC, clone TM-Beta 1, 50–974-6, eBioscience, 1:200), TCRβ (PE, H57–597, 12–5961-82, Invitrogen, 1:200), TCRβ (BV711, clone H57–597, 563135, BD Bioscience,1:200), CD45.2 (BV786, clone 104, 563686, BD Bioscience,1:200), CD45.2 (FITC, clone 104, 11–0454-82, eBioscience, 1:200), CD45.2 (PerCP-Cy5.5, clone 104, BDB552950, BD Bioscience, 1:200), CD45.1 (BV650, clone A20, 563754, BD Bioscience, 1:200), CD45.1 (APC-eFluor 780, clone A20, 47–0453-82, Invitrogen, 1:200), S1pr1 (713412, clone MAB7089, R&D systems, 2ug/1×106 cells), CD49d (PE, clone RI-2, 12–0492-82, eBioscience, 1:200), α4β7 (PE, clone DATK-32, 120605, Biolegend, 1:200), β7 (PE, clone M293, BDB557498, BD Bioscience, 1:200), T-bet (PE, clone 4B10, 12–5825-82, eBioscience, 1:100), LRF (eFluor 660, clone 13E9, 50–3309-80, eBioscience, 1:200), Bim (PE, clone C34C5, 12186, Cell Signaling, 1:20), Cleaved Caspase-3 (Pacific Blue, clone D3-E9, 8788, Cell Signaling, 1:10), Bcl2 (PE, clone 3F11, 563096, BD Bioscience, 5μl/test). For S1pr1 staining, thymocytes were labeled with 2 μg Rat IgG2 anti-mS1pr1 per 1×10⁶ cells for 30 min at 4°C. The cells were then labeled with anti-rat IgG-PE (clone R1–12D10, 12–4812-82, ThermoFisher, 1:50) for 25 min on ice; anti-rat IgG-PE was pre-blocked with 1% normal mouse serum (24–5555, eBioscience, 1:100). For LRF, Bcl2 and T-bet intra-cellular staining, the cells were fixed for 4 hrs. or overnight with Foxp3-staining kit (ThermoFisher, Cat: 00–5523-00), then stained with the antibodies for 60 min at 4°C. Intracellular staining for Bim was performed as previously described41.
Flow cytometry data were acquired on LSR Fortessa cytometers with FACSDiva software (v8.0, BD Biosciences) and analyzed with FlowJo (v10.5.0, BD Biosciences) software. Dead cells and doublets were excluded by LiveDead staining (Invitrogen, Cat: L23105) and forward scatter height by width gating, respectively. Purification of lymphocytes by cell sorting was performed on a FACSAria or FACS Fusion (BD Biosciences).
Gut permeability test
Serum CD14 was measured using the Mouse CD14 Quantikine ELISA Kit (R&D systems, Cat: MC140) according to the manufacturer’s instructions and measured in duplicates with infinite 200 (Tecan) at 450nm.
Bone marrow chimeras and adoptive transfer studies
Bone marrow chimera were generated as described45. Briefly, bone marrow cells were isolated from the femurs and tibias of CD45 disparate animals, T cell-depleted with Mouse Pan T (Thy1.2) Dynabeads (ThermoFisher, Cat: 11443D), mixed at a 1:1 ratio, and injected into lethally irradiated (900 rad) host mice. Host mice were analyzed 8–12 weeks post-transplant.
For IELp adoptive transfers, thymocytes were isolated from CD45 disparate animals, IELp-enriched by depletion of CD8+ and/or CD4+ cells with Untouched Mouse CD4 or CD8 Cells Kits (Invitrogen, Cat: 11415D, 11417D) following the manufacturer’s directions. Following kit depletion, cell suspensions were stained and then purified by flow cytometric sorting as CD4− CD8α− TCRβ+ CD5+ CD122+ H-2Kb+ CD44− PD-1+. Between 25,000 and 50,000 IELp were injected into the tail vein of each NSG recipient. For conventional CD8αβ+ splenocyte adoptive transfers, 500,000 flow-sorted TCRβ+CD4− CD8α+ CD8β+ splenocytes were transferred into NSG recipients by tail vein injection. Recipient mice were analyzed two to six weeks post-transfer.
In vitro differentiation
Sorted IELp (4×10⁴) were cultured in RPMI supplemented with the indicated concentrations of IL-15 (Peprotech, Cat: 210–15), 10% FCS, 10 mM Hepes, 80 uM 2-Mercaptoethanol, 8 mg/ml Glutamine, 100 U/ml Penicillin, and 100 ug/ml Streptomycin in 96-well microtiter plates for 4 days9.
Microbiome sequencing
Ctrl and KO mice littermates were separated by genotype after weaning and thereafter co-housed based on genotype for 4.5 weeks. The lumen of the small intestine and the mucosal-associated fraction were collected as previously described60,61. DNA was extracted from the lumen of the small intestine and the mucosal-associated fraction using Qiagen Magattract Powermicrobiome DNA.RNA EP kit on Eppendorf automated liquid handing system. For sequencing of 16S rDNA amplicon libraries were prepared from sample DNA and sequenced with dual-index amplification and sequencing approach using the v4 region of the 16S ribosomal RNA gene (16S rRNA) on the Illumina MiSeq Platform62. Prior to analysis, sequences were trimmed with BBDuk v38.34 (BBMap-Bushnell B.). The counts of amplicon sequence variants (ASVs) were performed with DADA2 R package v1.1063,64 using the Nephele microbiome analysis platform. Taxonomic classification of the ASVs was done using the rdp algorithm implemented in DADA2 and the SILVA 16S database v132. For the mucosal-associated fraction, a sequence attributed to mouse mitochondrial DNA was filtered from the results.
Population RNA-seq
Total RNA was extracted from sorted Ctrl and LRF KO IELp, Ctrl CD8αα IEL, and LRF KO CD8αα spleen T cells (40,000 cells each) using the RNeasy Plus Micro kit (QIAGEN, Cat: 74034). RNA samples with an RNA integrity number (RIN) > 8 (Agilent bioanalyzer) were processed with SMARTer Ultra Low Input reagent (Takara) and Nextera XT DNA (Illumina) library preparation kits. Libraries were sequenced with paired-end reads of 126 bp on Illumina NextSeq (Illumina) to reach 50 million read pairs per sample. For each cell subset and genotype, data are derived from two distinct mice with separate processing from cell sorting to RNA extraction; one RNA sample was further split into two technical replicates before library construction. Raw RNAseq fastq reads were trimmed with Trimmomatic (v4.1.4)65 and aligned to the mouse genome (mm10) using STAR (v. 2.4.0h)66,67. Gene-assignment and count of RNA reads were performed with HTseq68. Further analyses were performed with R software and differentially expressed genes were identified using DESeq2 (v1.20) using the Wald test (FDR < 0.1)69. Gene expression is shown as count per million (CPM) after normalization relative to total gene-assigned reads for each sample.
ScRNA-Seq
IELp, CD8αα IEL and CD8αα splenocytes of either genotype were sorted from Ctrl (Cd4-cre− Lrffl/fl) or LRF KO mice and loaded onto a 10x Chromium platform to generate cDNAs carrying cell- and transcript-specific barcodes using Chromium Next GEM Single Cell Reagent Kits, either 5’ v1.1 chemistry (experiment E2) or 3’ v2 chemistry (other experiments). ScRNA-seq libraries were generated according to the manufacture’s protocol. IELp libraries were sequenced on multiple runs of Illumina NextSeq using paired-end 26×98 bp or 26×57 bp and resulted in at least 40,000 reads/cell. CD8αα IEL and CD8αα splenocytes libraries were sequenced on NextSeq 550 (HighOutput Kit V2.5, 75 cycle, parameter: R1: 26bp, I1: 8bp and R2: 55 bp).
Single-cell sequencing files were processed, and count matrixes extracted using the Cell Ranger Single Cell Software Suite (v1.3.1, v5.0.0 & v6.0.0). Further analyses were performed in R (4.1.1) using the Seurat package (4.0.4 & 4.0.5)70,71.
Data were pre-processed by removing genes expressed in fewer than 3 cells and excluding cells expressing fewer than 1000 (5’ v1.1 Chemistry) or 500 (3’ v2 Chemistry), or more than 5000 genes, or more than 5% mitochondrial genes. Raw unique molecular identifier (UMI) counts were normalized and log-transformed with the NormalizeData function. Linear dimension reduction (PCA) was performed based on the highly variable genes for each pre-processed dataset. Datasets were integrated using the Seurat integration method with the FindIntegrationAnchors and IntegrateData functions. Clustering was performed on the full set of cells. Clusters representing less than 3 % of cells were omitted from UMAP and further analyses, with the exception of IELp cluster T7 included because of its typical features.
Cluster-specific gene expression signatures and differential gene expression were defined from Ctrl IELp or IEL data using the FindAllMarkers or FindMarkers functions, with default settings, selecting only positively enriched genes [FDR (adjusted p value)>0.05, Log2FC>0.25]. Gene signature scores were calculated on regressed datasets (regression of the number of UMI and percentages of mitochondrial genes with ScaleData function) using the AddModuleScore function. The average expression level of each gene in each cluster was calculated using AverageExpression function. Scaled expression data of marker genes were used for creating the heatmaps.
ChIP-Seq
Splenic CD4+ T cells from Rosa26BirA mice were enriched using Dynabeads Untouched Mouse CD4 cells kit (Invitrogen) and stimulated with plate-bound anti-CD3 (clone 145–2C11, Cat: BE0001–1, BioXcell, 1 μg/mL), anti-CD28 (clone 37.51, Cat: BE0015–1, BioXcell, 3 μg/mL) and IL-12 (10ng/mL, Peprotech, Cat: 212–12) for 3 days and then with IL-2 (100ng/mL, Peprotech, Cat: 210–12) for another day. One day after activation, cells were transduced with pMRX-LRFbio-tag-IRES-Thy1.1 (LrfBio) retrovirus, or with a control retrovirus expressing Thy1.1 only. Transduced (Thy1.1+) CD4+ T cells were sorted and processed for ChIP-seq as described45,57. Briefly, cells were cross-linked with 1% formaldehyde for 5 min at 37°C and fragmented by sonication. Then the fragments were immunoprecipitated with M280 Streptavidin beads (Invitrogen, Cat: 11205D) at 4°C for 2 hours and purified by QIAquick PCR purification kit (QIAGEN, Cat: 28104). The resulting ChIP DNA fragments were sequenced (75bp paired-end reads) on a NextSeq sequencer (Illumina). Raw fastq reads were aligned to the mouse genome (mm10) using Bowtie2 (v2.3.4)72 on the National Institutes of Health high-performance computing Biowulf cluster and filtered with Samtools (v1.6), using -q 20. Peak calling was performed with MACS2 (v2.2.5)73,74 comparing the ChIP samples from the LRFBio chromatin to the EV chromatin (narrow peak, qvalue < 0.05) and annotated by Homer (v4.1.0)75. IntersectBed (2.27.0) was applied to find peaks shared between two independent experiments.
Single-cell ATACseq
IELp from Ctrl (Cd4-Cre− Lrffl/fl) were sorted, and nuclei were isolated before transposition at 37oC for 1 hour and subsequently loaded onto the 10x Chromium controller. Libraries were generated using the V1 Chromium Single Cell ATAC Solution according to the manufacturer’s instructions. Libraries were sequenced on multiple runs of Illumina NextSeq using paired-end 50×50bp to reach at least 14,000 unique fragments/cell. Single-cell sequencing files were processed, and count matrixes were extracted using the Cell Ranger ATACseq Software (v1.2.0). Further analyses were performed in R using the Seurat (v4.0.4) and Signac (v1.4.0) packages70,71. Data were pre-processed by removing cells with less than 4,000 or more than 50,000 fragments, nucleosome signal higher than 2, or TSS enrichment lower than 2. Dimensional reduction was performed using the LSI algorithm and data was integrated using Seurat with the FindIntegrationAnchors and IntegrateEmbeddings functions. Afterwards, the peak traces were visualized by ConveragePlot function.
Cell transfer colitis
IELp (20,000) were sorted from Ctrl (Cd4-Cre− Lrffl/fl) or LRF KO mice and injected into the tail vein of Rag2–/– Il2rg–/– recipients, which were intraperitoneally injected three weeks later with 500,000 flow-sorted TCRβ+ CD25− CD4+ CD45RBhi splenocytes from C57BL/6 mice. Mice were monitored for body weight and clinical signs of colitis twice every week after CD4+ T cell transfer for 6 weeks. Colitis score was the sum of diarrhea score (0 – normal;1 - slightly loose feces; 2 - loose feces; 3 - semi-liquid stool; 4 - liquid stool) and rectal bleeding score (0 = no blood in stool; 1- blood visible in stool; 2 - extensive blood in stool;3 - extensive blood in stool and blood around the anus). Mice were euthanized if their body weight loss reached 20% or colitis score reached 4.
Gene regulatory network inference
The gene regulatory network inference was performed as described in41. Briefly, Seurat-analyzed IELp scATAC data were converted using SeuratWrapper command as.cell_data_set, followed by the make_cicero_cds command from Cicero. The Seurat-analyzed IELp scRNA data were converted into the AnnData format using the CellOracle API command seuratToAnndata. To generate the LRF gene regulatory network, we fed the CellOracle pipeline (v0.7.1)46 with Seurat normalized transcriptomic data from Ctrl scRNAseq cluster 4 (LRF-dependent) and Ctrl scATACseq data. LRF target genes were defined as those predicted to be positively regulated by LRF, using a Bonferroni-corrected p value of less than 0.1; the 10% of these genes (as ranked in order of decreasing β coefficient value) were selected for further analyses.
Statistical analysis
No statistical methods were used to pre-determine sample sizes, but our sample sizes are similar to those reported in previous publications9,21,76. Data distribution was assumed to be normal, but this was not formally tested. Neither randomization nor blinded experiments were performed in this study because the study design involved genotyping of the mice. No data was excluded. Except for deep-sequencing data, statistical significance was calculated with GraphPad Prism 7.0. Unpaired two-sided Student’s t-test was used except where otherwise indicated in figure legends. Error bars are presented as mean ± SEM. Statistical significance annotation is denoted in figure legends. Information on sample size, experimental replicates, and statistics are included in the figure legends. In deep sequencing analyses, False Discovery Rate (FDR) is given as the adjusted p-value.
Data availability
All sequence data reported in this paper are publicly available on Gene Expression Omnibus (GEO), from accession numbers GSE149993; GSE149943; GSE149985, GSE186164, GSE186291 for LRF ChIP-seq, RNA-seq, single-cell RNA-seq, and scATACseq, respectively. All data sets generated and/or analyzed during the current study are presented in this published article, including source data files related to figures. All the other relevant data are available upon request.
Code availability
No custom code was developed in the study. Flow cytometry, statistical and bioinformatics analyses were performed using publicly available software packages, as indicated in Methods.
Extended Data
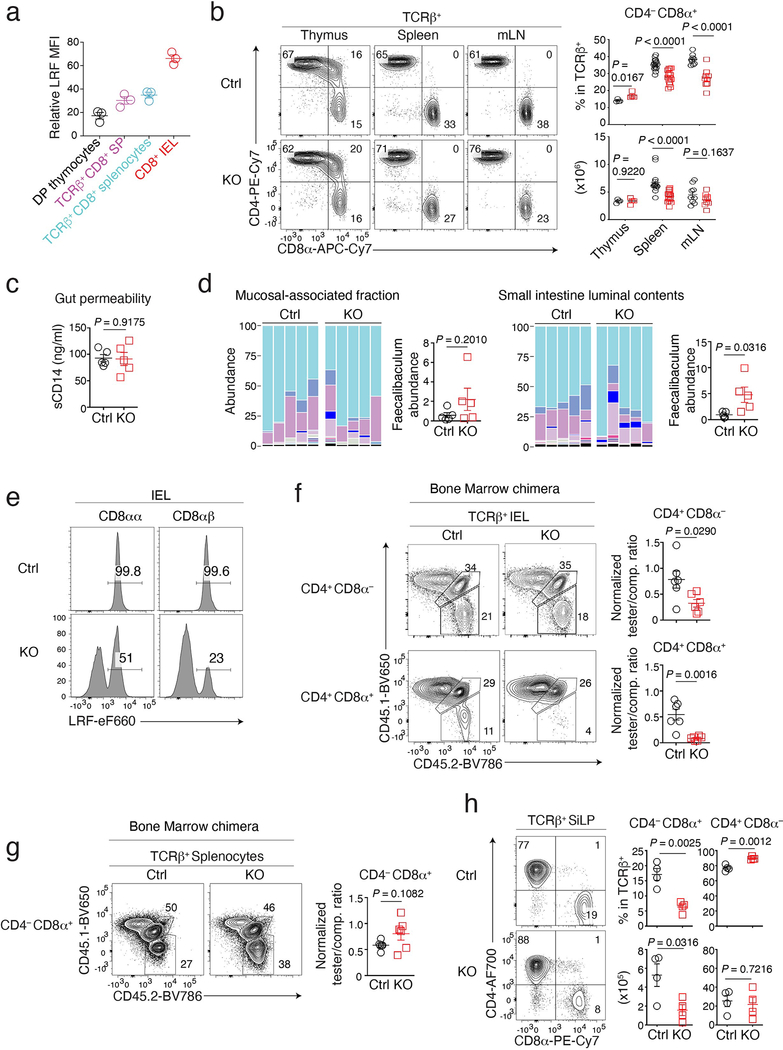
Extended Data Fig. 1. Characterization of LRF KO mice.
(a) LRF expression (MFI) of indicated cells in Fig. 1a relative to LRF MFI in LRF-KO CD8+ splenocytes, set to 1. Data summarizes two independent experiments with a total of three mice.
(b) (left) CD8α vs. CD4 expression on TCRβ+ cells in thymus, spleen, and mLN from Ctrl and LRF KO mice.(right) Number (bottom) and percentage (among TCRαβ+ cells) of CD4−CD8α+ T cells. Data summarizes five independent experiments with a total of 4 (thymus), 16 (spleen), and 9 (mLN) mice of each genotype.
(c) Serum concentration of soluble CD14 (sCD14) in Ctrl (n =5) and LRF KO (n =5) mice. Data summarizes two independent experiments.
(d) Microbial communities in the small intestine luminal contents and mucosal-associated fraction from Ctrl (n = 5) and LRF KO (n = 5) mice. Data are from one experiment representative of two (the other being shown in Fig. 1d), each column representing one mouse. Color code as in Fig. 1d.
(e) Expression of intra-cellular LRF in indicated IEL from Ctrl and LRF KO mice.
(f, g) (left) Expression of CD45.2 vs. CD45.1 in TCRβ+ CD4+ CD8α− and CD4+ CD8α+ IEL (f), and CD4−CD8α+ splenocytes (g) from bone marrow chimera analyzed in Fig. 1e. (right) Tester/competitor ratios in indicated subsets, normalized to tester/competitor ratio of B220+ splenocytes. Data summarizes two independent experiments with a total of 6 mice per group. In (f), tester-competitor ratios (average ± SEM) were 0.78 ± 0.082 (Ctrl) and 0.33 ± 0.031 (KO) for CD4+CD8α− IEL, and 0.54 ± 0.043 (Ctrl) and 0.09 ± 0.008 (KO) for CD4+CD8α+ IEL.
(h) (left) CD8α vs. CD4 expression on lamina propria TCRβ+ cells from Ctrl and LRF KO mice. (right) Percentage (top) and absolute number (bottom) of CD4+ and CD8+ cells among TCRβ+ cells. Data summarizes four independent experiments with a total of 4 mice per genotype.
Error bars indicate standard error of the mean (SEM). P values are from two-tailed unpaired t-test (b, c, d, f, g and h). (a-d, f-h): Each symbol represents one mouse.
Extended Data Fig. 2. Development of LRF KO IELp.
(a) LRF expression in indicated subsets from Cd4cre+ Thpokfl/fl mice (to exclude cross reactive staining of Thpok by the LRF antibody). LRF KO TCRβ+ CD4−CD8+ splenocytes are shown as a control (grey-shaded). Data are from one experiment representative of two with 4 mice total. Graph (right) summarizes LRF expression (MFI) of indicated cells relative to that in wild-type IELp (analyzed as reference in each experiment), set to 1.
(b) CD45.2 vs. CD45.1 expression in IELp from bone marrow chimera analyzed in Fig. 1e. Graphs (right) show tester/competitor ratios in IELp normalized to tester/competitor ratio of B220+ splenocytes and summarize two independent experiments totaling 6 mice per group.
(c) Overlaid expression of Bim (left) and Bcl2 (right) in gated Ctrl and LRF KO IELp. Graphs (right) show the indicated protein expression (MFI) in IELp relative to that in IELp from wild type mice, set at 100 in each experiment. Data summarizes two independent experiments totaling 3 Ctrl and 4 LRF KO mice.
(d) Contour plots show cleaved Caspase3 levels vs. FSC in wild-type CD4+CD8α+ or immature Bim+ CD4+ SP (Bim+ CD4+ CD8− CD69+ MHC-I−) thymocytes, and in Ctrl and LRF KO IELp. Data are from one experiment representative of two with a total of 3 Ctrl mice and 4 LRF KO mice.
(e, f) Staining for extra-cellular annexin V and cell viability (L/D) on Ctrl and LRF KO IELp after in vitro culture for 0h, 2h or 4h (e). Graph (f) summarizes the percent of L/D−Annexin V+ cells among IELp, from 4 Ctrl and 5 LRF KO mice analyzed in two independent experiments.
(g, h) Total numbers of (g), and CD8α vs. CD8β expression by (h, left), Ctrl and LRF KO IELp after 4-day in vitro culture with the indicated IL-15 concentration. Right graph in (h) shows numbers of CD8αα and CD8αβ cells. Data is from three determinations for each genotype, acquired in two independent experiments
Error bars indicate standard error of the mean (SEM). P values are from two-tailed unpaired t-test (b, c) or two-way ANOVA (g, h). (a-c, f-h) Each symbol in graphs represents one mouse.
Extended Data Fig. 3. Impact of LRF on IELp homing.
(a) Graph shows the absolute number of the indicated TCRβ+ tester cells (Ctrl or LRF KO) among IEL or spleen T cells analyzed in Fig. 3ab. Data are from one experiment (5 mice per group) representative of two.
(b) CD8α vs. CD8β expression on TCRαβ+ CD8α+ splenocytes from bone marrow chimera analyzed in Fig. 1e. Graph (right) shows the percentage of CD8αα cells among TCRαβ+ CD8α+ splenocytes. Data pooled from two independent experiments with a total of 6 mice per group. Each symbol represents one mouse.
(c-e) NSG host mice were adoptively transferred with a 1:1 mixture of CD45.2+ tester (either Ctrl or LRF KO) and CD45.1+CD45.2+ competitor CD8αβ splenocytes, and analyzed one week after transfer. Data are from one experiment (5 Ctrl and 4 KO mice) representative of two.
(c) Schematic of the experiment
(d, e) Top contour plots show CD45.2 vs. CD45.1 expression in TCRβ+ CD45.2+ splenocytes (d) and IEL (e). Colored boxes define Ctrl (blue) and KO (red) testers populations assessed for CD8α vs. CD8β expression in bottom contour plots. Top right graphs show tester/competitor ratios in each organ. Each symbol represents one mouse. Bottom right panel in (e) shows CD8α vs. CD8β expression on CD8α+ IEL from an unmanipulated C57BL/6 (WT) mouse.
Error bars indicate standard error of the mean (SEM). P values (a, b, d, e) are from two-tailed unpaired t-test.
Extended Data Fig. 4. Effect of LRF on thymocyte α4β7 expression.
(a) Histogram overlays show the expression of α4β7 on wild-type IELp and conventional CD8+ SP thymocytes cells. Gray-shaded histogram (Bkgd) shows background of PE fluorochrome signal in IELp from Ctrl mice for which the primary α4β7 antibody was omitted from the staining mix. Right graphs show protein expression (MFI), computed on cells expressing each protein (left plot bracket).
(b) Histogram (left) shows the expression of α4β7 on TCRβhiCD8α+ SP thymocytes from Ctrl or LRF KO mice, displayed as in (a). Graph (right) shows the percentage of α4β7+ cells among TCRβhi CD8α+ SP thymocytes.
(c) Expression of α4β7 on Ctrl (solid line) and LRF KO (dashed line) TCRβhiCD4+ SP thymocytes, displayed as in (a). (a-c) Data are from one experiment (4 mice per group) representative of two. Each symbol in summary graphs represents one mouse.
Error bars indicate standard error of the mean (SEM). P values (a, b) are from two-tailed unpaired t-test.
Extended Data Fig. 5. Control of IELp gene expression by LRF.
(a-b) Population RNAseq of thymic IELp.
(a) Scatter plots compare gene expression (Log2 values, full gene set) in Ctrl vs. KO IELp. Genes with two-fold or greater differential expression between genotypes (and FDR<0.01) are shown in blue or red.
(b) RNAseq expression levels (counts per million) of Itgb7 and Itga4 genes in IELp from Ctrl and KO mice. Error bars indicate SEM. P values are from two-tailed unpaired t-test.
(c-f) ScRNAseq of thymic IELp from Ctrl and KO mice.
(c) UMAP analysis of IELp, performed as in Fig. 5a, displayed separately for each experiment and color-coded by genotype.
(d) Bar plots indicate the Ctrl (gray) vs. LRF KO (red) genotype distribution of IELp clusters referred to in Fig. 5a,b.
(e) Violin plot shows the expression of Lrf in indicated clusters from Ctrl IELp.
(f) Volcano plot showing differentially expressed genes (FDR<0.05, |Log2FC| >0.25) between Ctrl T4 (mature) and LRF KO T2 (intermediate) IELp clusters. Blue and red symbols indicate genes preferentially expressed in KO and Ctrl IELp, respectively.
Extended Data Fig. 6. Control of IEL gene expression by LRF.
(a-d) scRNAseq of CD8αα IEL from Ctrl and CD8αα splenocytes from KO mice.
(a) Top plots show sorting strategy for CD8αα splenocytes and CD8αα IEL purification. Bottom graphs show the purity of indicated sorted subsets used for scRNAseq analyses (Fig. 7c–f).
(b) UMAP plot of Ctrl CD8αα IEL and KO CD8αα splenocytes, as in Fig. 7c, displayed separately for each experiment and color-coded by genotype.
(c) Bar plots indicate the Ctrl (gray) vs. LRF KO (red) genotype distribution of CD8αα clusters referred to in Fig. 7c–f.
(d) Heatmap shows row-standardized expression of selected genes among triplicate RNAseq samples from the indicated populations (color scale at right).
Supplementary Material
Acknowledgments
We thank Poorani Subramanian (Office of Cyber Infrastructure and Computational Biology, NIAID) for assistance with microbiome analyses, the CCR Flow Cytometry Core, the NIH High performance computing cluster, and the NIAID microbiome program for assistance, and W.J. Chen, J. Brenchley and M.S. Vacchio for critical reading of the manuscript. This work was supported by the Intramural Research Program of the National Cancer Institute, Center for Cancer Research (CCR), National Institutes of Health, and by the Intramural Research Program of the National Institute of Allergy and Infectious Diseases. The CCR Single Cell Analysis Facility is funded by the Frederick National Laboratory for Cancer Research, Contract 75N91019D00024. Sequencing was performed with the CCR Genomics Core.
Footnotes
Competing Interests Statement
The authors declare no competing interests.
References
- 1.McDonald BD, Jabri B & Bendelac A Diverse developmental pathways of intestinal intraepithelial lymphocytes. Nat Rev Immunol 18, 514–525 (2018). [DOI] [PMC free article] [PubMed] [Google Scholar]
- 2.Cheroutre H, Lambolez F & Mucida D The light and dark sides of intestinal intraepithelial lymphocytes. Nat Rev Immunol 11, 445–456 (2011). [DOI] [PMC free article] [PubMed] [Google Scholar]
- 3.Goodman T & Lefrancois L Expression of the gamma-delta T-cell receptor on intestinal CD8+ intraepithelial lymphocytes. Nature 333, 855–858 (1988). [DOI] [PubMed] [Google Scholar]
- 4.Di Marco Barros R et al. Epithelia Use Butyrophilin-like Molecules to Shape Organ-Specific gammadelta T Cell Compartments. Cell 167, 203–218 e217 (2016). [DOI] [PMC free article] [PubMed] [Google Scholar]
- 5.Ruscher R & Hogquist KA Development, ontogeny, and maintenance of TCRalphabeta(+) CD8alphaalpha IEL. Curr Opin Immunol 58, 83–88 (2019). [DOI] [PMC free article] [PubMed] [Google Scholar]
- 6.McDonald BD, Bunker JJ, Ishizuka IE, Jabri B & Bendelac A Elevated T cell receptor signaling identifies a thymic precursor to the TCRalphabeta(+)CD4(−)CD8beta(−) intraepithelial lymphocyte lineage. Immunity 41, 219–229 (2014). [DOI] [PMC free article] [PubMed] [Google Scholar]
- 7.Pobezinsky LA, Angelov GS, Tai X, Jeurling S, Van Laethem F, Feigenbaum L, Park JH & Singer A Clonal deletion and the fate of autoreactive thymocytes that survive negative selection. Nat Immunol 13, 569–578 (2012). [DOI] [PMC free article] [PubMed] [Google Scholar]
- 8.McDonald BD, Bunker JJ, Erickson SA, Oh-Hora M & Bendelac A Crossreactive alphabeta T Cell Receptors Are the Predominant Targets of Thymocyte Negative Selection. Immunity 43, 859–869 (2015). [DOI] [PMC free article] [PubMed] [Google Scholar]
- 9.Ruscher R, Kummer RL, Lee YJ, Jameson SC & Hogquist KA CD8alphaalpha intraepithelial lymphocytes arise from two main thymic precursors. Nat Immunol 18, 771–779 (2017). [DOI] [PMC free article] [PubMed] [Google Scholar]
- 10.Mayans S, Stepniak D, Palida S, Larange A, Dreux J, Arlian B, Shinnakasu R, Kronenberg M, Cheroutre H & Lambolez F alphabetaT cell receptors expressed by CD4(−)CD8alphabeta(−) intraepithelial T cells drive their fate into a unique lineage with unusual MHC reactivities. Immunity 41, 207–218 (2014). [DOI] [PMC free article] [PubMed] [Google Scholar]
- 11.Leishman AJ, Gapin L, Capone M, Palmer E, MacDonald HR, Kronenberg M & Cheroutre H Precursors of functional MHC class I- or class II-restricted CD8alphaalpha(+) T cells are positively selected in the thymus by agonist self-peptides. Immunity 16, 355–364 (2002). [DOI] [PubMed] [Google Scholar]
- 12.Berlin C, Berg EL, Briskin MJ, Andrew DP, Kilshaw PJ, Holzmann B, Weissman IL, Hamann A & Butcher EC Alpha 4 beta 7 integrin mediates lymphocyte binding to the mucosal vascular addressin MAdCAM-1. Cell 74, 185–195 (1993). [DOI] [PubMed] [Google Scholar]
- 13.Cepek KL, Shaw SK, Parker CM, Russell GJ, Morrow JS, Rimm DL & Brenner MB Adhesion between epithelial cells and T lymphocytes mediated by E-cadherin and the alpha E beta 7 integrin. Nature 372, 190–193 (1994). [DOI] [PubMed] [Google Scholar]
- 14.Wagner N, Lohler J, Kunkel EJ, Ley K, Leung E, Krissansen G, Rajewsky K & Muller W Critical role for beta7 integrins in formation of the gut-associated lymphoid tissue. Nature 382, 366–370 (1996). [DOI] [PubMed] [Google Scholar]
- 15.El-Asady R, Yuan R, Liu K, Wang D, Gress RE, Lucas PJ, Drachenberg CB & Hadley GA TGF-{beta}-dependent CD103 expression by CD8(+) T cells promotes selective destruction of the host intestinal epithelium during graft-versus-host disease. J Exp Med 201, 1647–1657 (2005). [DOI] [PMC free article] [PubMed] [Google Scholar]
- 16.Konkel JE, Maruyama T, Carpenter AC, Xiong Y, Zamarron BF, Hall BE, Kulkarni AB, Zhang P, Bosselut R & Chen W Control of the development of CD8alphaalpha+ intestinal intraepithelial lymphocytes by TGF-beta. Nat Immunol 12, 312–319 (2011). [DOI] [PMC free article] [PubMed] [Google Scholar]
- 17.Li Y, Innocentin S, Withers DR, Roberts NA, Gallagher AR, Grigorieva EF, Wilhelm C & Veldhoen M Exogenous stimuli maintain intraepithelial lymphocytes via aryl hydrocarbon receptor activation. Cell 147, 629–640 (2011). [DOI] [PubMed] [Google Scholar]
- 18.Schon MP et al. Mucosal T lymphocyte numbers are selectively reduced in integrin alpha E (CD103)-deficient mice. J Immunol 162, 6641–6649 (1999). [PubMed] [Google Scholar]
- 19.Lai YG, Hou MS, Hsu YW, Chang CL, Liou YH, Tsai MH, Lee F & Liao NS IL-15 does not affect IEL development in the thymus but regulates homeostasis of putative precursors and mature CD8 alpha alpha+ IELs in the intestine. J Immunol 180, 3757–3765 (2008). [DOI] [PubMed] [Google Scholar]
- 20.Klose CS, Blatz K, d’Hargues Y, Hernandez PP, Kofoed-Nielsen M, Ripka JF, Ebert K, Arnold SJ, Diefenbach A, Palmer E & Tanriver Y The transcription factor T-bet is induced by IL-15 and thymic agonist selection and controls CD8alphaalpha(+) intraepithelial lymphocyte development. Immunity 41, 230–243 (2014). [DOI] [PubMed] [Google Scholar]
- 21.Reis BS, Hoytema van Konijnenburg DP, Grivennikov SI & Mucida D Transcription factor T-bet regulates intraepithelial lymphocyte functional maturation. Immunity 41, 244–256 (2014). [DOI] [PMC free article] [PubMed] [Google Scholar]
- 22.Davies JM, Hawe N, Kabarowski J, Huang QH, Zhu J, Brand NJ, Leprince D, Dhordain P, Cook M, Morriss-Kay G & Zelent A Novel BTB/POZ domain zinc-finger protein, LRF, is a potential target of the LAZ-3/BCL-6 oncogene. Oncogene 18, 365–375 (1999). [DOI] [PubMed] [Google Scholar]
- 23.Ellmeier W & Taniuchi I The role of BTB-zinc finger transcription factors during T cell development and in the regulation of T cell-mediated immunity. Curr Top Microbiol Immunol 381, 21–49 (2014). [DOI] [PubMed] [Google Scholar]
- 24.Maeda T Regulation of hematopoietic development by ZBTB transcription factors. Int J Hematol 104, 310–323 (2016). [DOI] [PMC free article] [PubMed] [Google Scholar]
- 25.He X, He X, Dave VP, Zhang Y, Hua X, Nicolas E, Xu W, Roe BA & Kappes DJ The zinc finger transcription factor Th-POK regulates CD4 versus CD8 T-cell lineage commitment. Nature 433, 826–833 (2005). [DOI] [PubMed] [Google Scholar]
- 26.Sun G, Liu X, Mercado P, Jenkinson SR, Kypriotou M, Feigenbaum L, Galera P & Bosselut R The zinc finger protein cKrox directs CD4 lineage differentiation during intrathymic T cell positive selection. Nat Immunol 6, 373–381 (2005). [DOI] [PubMed] [Google Scholar]
- 27.Carpenter AC, Grainger JR, Xiong Y, Kanno Y, Chu HH, Wang L, Naik S, dos Santos L, Wei L, Jenkins MK, O’Shea JJ, Belkaid Y & Bosselut R The transcription factors Thpok and LRF are necessary and partly redundant for T helper cell differentiation. Immunity 37, 622–633 (2012). [DOI] [PMC free article] [PubMed] [Google Scholar]
- 28.Vacchio MS, Wang L, Bouladoux N, Carpenter AC, Xiong Y, Williams LC, Wohlfert E, Song KD, Belkaid Y, Love PE & Bosselut R A ThPOK-LRF transcriptional node maintains the integrity and effector potential of post-thymic CD4+ T cells. Nat Immunol 15, 947–956 (2014). [DOI] [PMC free article] [PubMed] [Google Scholar]
- 29.Maeda T, Hobbs RM, Merghoub T, Guernah I, Zelent A, Cordon-Cardo C, Teruya-Feldstein J & Pandolfi PP Role of the proto-oncogene Pokemon in cellular transformation and ARF repression. Nature 433, 278–285 (2005). [DOI] [PubMed] [Google Scholar]
- 30.Maeda T, Merghoub T, Hobbs RM, Dong L, Maeda M, Zakrzewski J, van den Brink MR, Zelent A, Shigematsu H, Akashi K, Teruya-Feldstein J, Cattoretti G & Pandolfi PP Regulation of B versus T lymphoid lineage fate decision by the proto-oncogene LRF. Science 316, 860–866 (2007). [DOI] [PMC free article] [PubMed] [Google Scholar]
- 31.Tabung FK, Birmann BM, Epstein MM, Martinez-Maza O, Breen EC, Wu K & Giovannucci EL Influence of Dietary Patterns on Plasma Soluble CD14, a Surrogate Marker of Gut Barrier Dysfunction. Curr Dev Nutr 1 (2017). Doi: 10.3945/cdn.117.001396 [DOI] [PMC free article] [PubMed] [Google Scholar]
- 32.Mucida D et al. Transcriptional reprogramming of mature CD4(+) helper T cells generates distinct MHC class II-restricted cytotoxic T lymphocytes. Nat Immunol 14, 281–289 (2013). [DOI] [PMC free article] [PubMed] [Google Scholar]
- 33.Sujino T, London M, Hoytema van Konijnenburg DP, Rendon T, Buch T, Silva HM, Lafaille JJ, Reis BS & Mucida D Tissue adaptation of regulatory and intraepithelial CD4(+) T cells controls gut inflammation. Science 352, 1581–1586 (2016). [DOI] [PMC free article] [PubMed] [Google Scholar]
- 34.Lambolez F, Kronenberg M & Cheroutre H Thymic differentiation of TCR alpha beta(+) CD8 alpha alpha(+) IELs. Immunol Rev 215, 178–188 (2007). [DOI] [PubMed] [Google Scholar]
- 35.Yamagata T, Mathis D & Benoist C Self-reactivity in thymic double-positive cells commits cells to a CD8 alpha alpha lineage with characteristics of innate immune cells. Nat Immunol 5, 597–605 (2004). [DOI] [PubMed] [Google Scholar]
- 36.Gangadharan D, Lambolez F, Attinger A, Wang-Zhu Y, Sullivan BA & Cheroutre H Identification of pre- and postselection TCRalphabeta+ intraepithelial lymphocyte precursors in the thymus. Immunity 25, 631–641 (2006). [DOI] [PubMed] [Google Scholar]
- 37.Ruscher R, Lee ST, Salgado OC, Breed ER, Osum SH & Hogquist KA Intestinal CD8alphaalpha IELs derived from two distinct thymic precursors have staggered ontogeny. J Exp Med 217 (2020). [DOI] [PMC free article] [PubMed] [Google Scholar]
- 38.Poussier P, Ning T, Banerjee D & Julius M A unique subset of self-specific intraintestinal T cells maintains gut integrity. J Exp Med 195, 1491–1497 (2002). [DOI] [PMC free article] [PubMed] [Google Scholar]
- 39.Odumade OA, Weinreich MA, Jameson SC & Hogquist KA Krüppel-Like Factor 2 Regulates Trafficking and Homeostasis of γδ T Cells. The Journal of Immunology 184, 6060–6066 (2010). [DOI] [PMC free article] [PubMed] [Google Scholar]
- 40.Xing Y, Wang X, Jameson SC & Hogquist KA Late stages of T cell maturation in the thymus involve NF-kappaB and tonic type I interferon signaling. Nat Immunol 17, 565–573 (2016). [DOI] [PMC free article] [PubMed] [Google Scholar]
- 41.Chopp LB, Gopalan V, Ciucci T, Ruchinskas A, Rae Z, Lagarde M, Gao Y, Li C, Bosticardo M, Pala F, Livak F, Kelly MC, Hannenhalli S & Bosselut R An Integrated Epigenomic and Transcriptomic Map of Mouse and Human alphabeta T Cell Development. Immunity 53, 1182–1201 e1188 (2020). [DOI] [PMC free article] [PubMed] [Google Scholar]
- 42.Kovalovsky D, Uche OU, Eladad S, Hobbs RM, Yi W, Alonzo E, Chua K, Eidson M, Kim HJ, Im JS, Pandolfi PP & Sant’Angelo DB The BTB-zinc finger transcriptional regulator PLZF controls the development of invariant natural killer T cell effector functions. Nat Immunol 9, 1055–1064 (2008). [DOI] [PMC free article] [PubMed] [Google Scholar]
- 43.Savage AK, Constantinides MG, Han J, Picard D, Martin E, Li B, Lantz O & Bendelac A The transcription factor PLZF directs the effector program of the NKT cell lineage. Immunity 29, 391–403 (2008). [DOI] [PMC free article] [PubMed] [Google Scholar]
- 44.Moran AE, Holzapfel KL, Xing Y, Cunningham NR, Maltzman JS, Punt J & Hogquist KA T cell receptor signal strength in Treg and iNKT cell development demonstrated by a novel fluorescent reporter mouse. J Exp Med 208, 1279–1289 (2011). [DOI] [PMC free article] [PubMed] [Google Scholar]
- 45.Ciucci T, Vacchio MS, Gao Y, Tomassoni Ardori F, Candia J, Mehta M, Zhao Y, Tran B, Pepper M, Tessarollo L, McGavern DB & Bosselut R The Emergence and Functional Fitness of Memory CD4(+) T Cells Require the Transcription Factor Thpok. Immunity 50, 91–105 e104 (2019). [DOI] [PMC free article] [PubMed] [Google Scholar]
- 46.Kamimoto K, Hoffmann CM & Morris SA CellOracle: Dissecting cell identity via network inference and in silico gene perturbation. bioRxiv, 2020.2002.2017.947416 (2020). [DOI] [PMC free article] [PubMed] [Google Scholar]
- 47.Cervantes-Barragan L, Chai JN, Tianero MD, Di Luccia B, Ahern PP, Merriman J, Cortez VS, Caparon MG, Donia MS, Gilfillan S, Cella M, Gordon JI, Hsieh CS & Colonna M Lactobacillus reuteri induces gut intraepithelial CD4(+)CD8alphaalpha(+) T cells. Science 357, 806–810 (2017). [DOI] [PMC free article] [PubMed] [Google Scholar]
- 48.Kernfeld EM, Genga RMJ, Neherin K, Magaletta ME, Xu P & Maehr R A Single-Cell Transcriptomic Atlas of Thymus Organogenesis Resolves Cell Types and Developmental Maturation. Immunity 48, 1258–1270 e1256 (2018). [DOI] [PMC free article] [PubMed] [Google Scholar]
- 49.Hummel JF, Zeis P, Ebert K, Fixemer J, Konrad P, Schachtrup C, Arnold SJ, Grun D & Tanriver Y Single-cell RNA-sequencing identifies the developmental trajectory of C-Myc-dependent NK1.1(−) T-bet(+) intraepithelial lymphocyte precursors. Mucosal Immunol 13, 257–270 (2020). [DOI] [PMC free article] [PubMed] [Google Scholar]
- 50.Park JE et al. A cell atlas of human thymic development defines T cell repertoire formation. Science 367 (2020). [DOI] [PMC free article] [PubMed] [Google Scholar]
- 51.Le J, Park JE, Ha VL, Luong A, Branciamore S, Rodin AS, Gogoshin G, Li F, Loh YE, Camacho V, Patel SB, Welner RS & Parekh C Single-Cell RNA-Seq Mapping of Human Thymopoiesis Reveals Lineage Specification Trajectories and a Commitment Spectrum in T Cell Development. Immunity 52, 1105–1118 e1109 (2020). [DOI] [PMC free article] [PubMed] [Google Scholar]
- 52.Egawa T & Littman DR ThPOK acts late in specification of the helper T cell lineage and suppresses Runx-mediated commitment to the cytotoxic T cell lineage. Nat Immunol 9, 1131–1139 (2008). [DOI] [PMC free article] [PubMed] [Google Scholar]
- 53.Driegen S, Ferreira R, van Zon A, Strouboulis J, Jaegle M, Grosveld F, Philipsen S & Meijer D A generic tool for biotinylation of tagged proteins in transgenic mice. Transgenic Res 14, 477–482 (2005). [DOI] [PubMed] [Google Scholar]
- 54.Wang L, Wildt KF, Castro E, Xiong Y, Feigenbaum L, Tessarollo L & Bosselut R The zinc finger transcription factor Zbtb7b represses CD8-lineage gene expression in peripheral CD4+ T cells. Immunity 29, 876–887 (2008). [DOI] [PMC free article] [PubMed] [Google Scholar]
- 55.Lee PP et al. A critical role for Dnmt1 and DNA methylation in T cell development, function, and survival. Immunity 15, 763–774 (2001). [DOI] [PubMed] [Google Scholar]
- 56.Saitoh T, Nakano H, Yamamoto N & Yamaoka S Lymphotoxin-beta receptor mediates NEMO-independent NF-kappaB activation. FEBS Lett 532, 45–51 (2002). [DOI] [PubMed] [Google Scholar]
- 57.Vacchio MS et al. A Thpok-Directed Transcriptional Circuitry Promotes Bcl6 and Maf Expression to Orchestrate T Follicular Helper Differentiation. Immunity 51, 465–478 e466 (2019). [DOI] [PMC free article] [PubMed] [Google Scholar]
- 58.Morita S, Kojima T & Kitamura T Plat-E: an efficient and stable system for transient packaging of retroviruses. Gene Ther 7, 1063–1066 (2000). [DOI] [PubMed] [Google Scholar]
- 59.Carpenter AC, Kim JK & Bosselut R Purification of Thymocyte and T Cell Subsets. Methods Mol Biol 1323, 87–97 (2016). [DOI] [PMC free article] [PubMed] [Google Scholar]
- 60.Molloy MJ, Grainger JR, Bouladoux N, Hand TW, Koo LY, Naik S, Quinones M, Dzutsev AK, Gao JL, Trinchieri G, Murphy PM & Belkaid Y Intraluminal containment of commensal outgrowth in the gut during infection-induced dysbiosis. Cell Host Microbe 14, 318–328 (2013). [DOI] [PMC free article] [PubMed] [Google Scholar]
- 61.Fonseca DM et al. Microbiota-Dependent Sequelae of Acute Infection Compromise Tissue-Specific Immunity. Cell 163, 354–366 (2015). [DOI] [PMC free article] [PubMed] [Google Scholar]
- 62.Kozich JJ, Westcott SL, Baxter NT, Highlander SK & Schloss PD Development of a dual-index sequencing strategy and curation pipeline for analyzing amplicon sequence data on the MiSeq Illumina sequencing platform. Appl Environ Microbiol 79, 5112–5120 (2013). [DOI] [PMC free article] [PubMed] [Google Scholar]
- 63.Callahan BJ, McMurdie PJ, Rosen MJ, Han AW, Johnson AJ & Holmes SP DADA2: High-resolution sample inference from Illumina amplicon data. Nat Methods 13, 581–583 (2016). [DOI] [PMC free article] [PubMed] [Google Scholar]
- 64.Callahan BJ, McMurdie PJ & Holmes SP Exact sequence variants should replace operational taxonomic units in marker-gene data analysis. ISME J 11, 2639–2643 (2017). [DOI] [PMC free article] [PubMed] [Google Scholar]
- 65.Bolger AM, Lohse M & Usadel B Trimmomatic: a flexible trimmer for Illumina sequence data. Bioinformatics 30, 2114–2120 (2014). [DOI] [PMC free article] [PubMed] [Google Scholar]
- 66.Dobin A, Davis CA, Schlesinger F, Drenkow J, Zaleski C, Jha S, Batut P, Chaisson M & Gingeras TR STAR: ultrafast universal RNA-seq aligner. Bioinformatics 29, 15–21 (2013). [DOI] [PMC free article] [PubMed] [Google Scholar]
- 67.Mudge JM & Harrow J Creating reference gene annotation for the mouse C57BL6/J genome assembly. Mamm Genome 26, 366–378 (2015). [DOI] [PMC free article] [PubMed] [Google Scholar]
- 68.Anders S, Pyl PT & Huber W HTSeq--a Python framework to work with high-throughput sequencing data. Bioinformatics 31, 166–169 (2015). [DOI] [PMC free article] [PubMed] [Google Scholar]
- 69.Love MI, Huber W & Anders S Moderated estimation of fold change and dispersion for RNA-seq data with DESeq2. Genome Biol 15, 550 (2014). [DOI] [PMC free article] [PubMed] [Google Scholar]
- 70.Stuart T, Butler A, Hoffman P, Hafemeister C, Papalexi E, Mauck WM 3rd, Hao Y, Stoeckius M, Smibert P & Satija R Comprehensive Integration of Single-Cell Data. Cell 177, 1888–1902 e1821 (2019). [DOI] [PMC free article] [PubMed] [Google Scholar]
- 71.Hao Y et al. Integrated analysis of multimodal single-cell data. Cell 184, 3573–3587.e3529 (2021). [DOI] [PMC free article] [PubMed] [Google Scholar]
- 72.Langmead B & Salzberg SL Fast gapped-read alignment with Bowtie 2. Nat Methods 9, 357–359 (2012). [DOI] [PMC free article] [PubMed] [Google Scholar]
- 73.Liu T Use model-based Analysis of ChIP-Seq (MACS) to analyze short reads generated by sequencing protein-DNA interactions in embryonic stem cells. Methods Mol Biol 1150, 81–95 (2014). [DOI] [PubMed] [Google Scholar]
- 74.Zhang Y, Liu T, Meyer CA, Eeckhoute J, Johnson DS, Bernstein BE, Nusbaum C, Myers RM, Brown M, Li W & Liu XS Model-based analysis of ChIP-Seq (MACS). Genome Biol 9, R137 (2008). [DOI] [PMC free article] [PubMed] [Google Scholar]
- 75.Heinz S, Benner C, Spann N, Bertolino E, Lin YC, Laslo P, Cheng JX, Murre C, Singh H & Glass CK Simple combinations of lineage-determining transcription factors prime cis-regulatory elements required for macrophage and B cell identities. Mol Cell 38, 576–589 (2010). [DOI] [PMC free article] [PubMed] [Google Scholar]
- 76.Jiang W, Wang X, Zeng B, Liu L, Tardivel A, Wei H, Han J, MacDonald HR, Tschopp J, Tian Z & Zhou R Recognition of gut microbiota by NOD2 is essential for the homeostasis of intestinal intraepithelial lymphocytes. J Exp Med 210, 2465–2476 (2013). [DOI] [PMC free article] [PubMed] [Google Scholar]
Associated Data
This section collects any data citations, data availability statements, or supplementary materials included in this article.
Supplementary Materials
Data Availability Statement
All sequence data reported in this paper are publicly available on Gene Expression Omnibus (GEO), from accession numbers GSE149993; GSE149943; GSE149985, GSE186164, GSE186291 for LRF ChIP-seq, RNA-seq, single-cell RNA-seq, and scATACseq, respectively. All data sets generated and/or analyzed during the current study are presented in this published article, including source data files related to figures. All the other relevant data are available upon request.


