

Abstract
Introduction/Aims
In comparative studies, treatment effects are typically evaluated at a specific time point. When data are collected periodically, an alternative, clinically meaningful approach could be used to assess the totality of treatment effects. We applied a well‐developed analytical procedure for evaluating longitudinal treatment effects using North Star Ambulatory Assessment (NSAA) data for illustration.
Methods
The NSAA comprises 17 scorable items/outcomes that measure changes in motor function. Using NSAA data from the published ataluren phase 3, randomized, placebo‐controlled trial (NCT01826487), cumulative counts of failures to perform each item (transition from 2/1 [able/impaired] to 0 [unable]) were collected at specified time points for each patient over 48 wk. Treatment group‐wise mean cumulative item failure count curves were constructed, comparing ataluren versus placebo and deflazacort versus prednisone/prednisolone among placebo‐treated patients. The steeper the curve, the worse the outcome. A clinically meaningful summary of the between‐group difference was provided for each comparison.
Results
The curve was uniformly steeper for placebo than ataluren after 16 wk and for prednisone/prednisolone than deflazacort after 8 wk. The two curves in each comparison continued to diverge thereafter, indicating sustained treatment benefits over time. Using a unique analytical approach, cumulative failure rates were reduced, on average, by 27% for ataluren versus placebo (rate ratio, 0.73; 95% confidence interval [CI], 0.55–0.97; p = .027) and 28% for deflazacort versus prednisone/prednisolone (rate ratio, 0.72; 95% CI, 0.53–0.96; p = .028).
Discussion
Unlike fixed‐time analyses, this analytical approach enabled demonstration of cumulative, longitudinal treatment effects over time using repeatedly measured NSAA observations.
Keywords: Duchenne muscular dystrophy, efficacy, motor function, outcome measure, treatment
Abbreviations
- 6MWD
6‐min walk distance
- ACT DMD
Ataluren Confirmatory Trial in Duchenne Muscular Dystrophy
- CI
confidence interval
- DMD
Duchenne muscular dystrophy
- ITT
intent‐to‐treat
- LWYY
Lin, Wei, Yang and Ying
- nmDMD
nonsense mutation Duchenne muscular dystrophy
- NSAA
North Star Ambulatory Assessment
1. INTRODUCTION
Investigative studies typically assess efficacy and safety of new treatments by measuring changes in outcome measures at fixed time points. However, this approach does not utilize multiple outcome data, often collected repeatedly at pre‐specified time points during studies, to evaluate cumulative, longitudinal treatment effects. Instead of depending on a single endpoint, the totality of evidence for treatment effects could be considered in comparative studies assessing new treatments.
Duchenne muscular dystrophy (DMD) is a progressive neuromuscular disease, 1 caused by mutations in the DMD gene.2, 3 Approximately 10%‐15% of patients have a nonsense mutation, 4 causing an in‐frame premature stop codon and formation of nonfunctional dystrophin protein. 5
Standard of care for DMD patients includes corticosteroid treatment with deflazacort, prednisone, or prednisolone. 6 Ataluren, a mutation‐specific therapy, promotes readthrough of an in‐frame premature stop codon caused by a nonsense DMD mutation.5, 7 In the ataluren phase 3 trial (Study 020; Ataluren Confirmatory Trial in Duchenne Muscular Dystrophy [ACT DMD]; NCT01826487), patients with nonsense mutation DMD (nmDMD) receiving ataluren or placebo and corticosteroids performed the North Star Ambulatory Assessment (NSAA), 8 a validated, clinical scale comprising 17 outcomes/items with three response categories (2/1/0) that measure motor function and disease progression (Supporting Information Figure S1, which is available online).9, 10 For this progressive disease, evaluating disease burden by measuring the totality of evidence from multiple outcome data over time per patient could be highly informative. We present a unique analytical approach to assess longitudinal, cumulative treatment effects over time, using Study 020 NSAA data for patients who received ataluren versus placebo and deflazacort versus prednisone/prednisolone as illustrative examples. 8
2. METHODS
2.1. Study design and patients
Study 020 was a randomized, double‐blind, placebo‐controlled, phase 3 trial of ataluren, consisting of 2‐wk screening and 48‐wk treatment (1:1 randomization, placebo:ataluren [40 mg/kg/day]). 8 Ambulatory boys aged 7–16 y with dystrophinopathy and confirmed nmDMD were enrolled between March 26, 2013 and August 26, 2014. Inclusion and exclusion criteria are reported elsewhere 8 and in the Supporting Information Appendix S1. The trial was approved by local regulatory authorities and institutional review boards of each site. Parents/guardians provided written informed consent (patients provided written assent when appropriate) before study participation.
2.2. Study assessments
Patients were assessed using the NSAA at screening, baseline and every 8 wk until treatment end between March 26, 2013 and August 20, 2015. 8
2.3. Statistical analyses
2.3.1. Analysis populations
Patients in the intent‐to‐treat (ITT) population included all randomized patients with a valid baseline and at least one valid, post‐baseline 6‐min walk distance (6MWD) value.
2.3.2. Cumulative loss of function of NSAA items
This analysis used data representing cumulative failure to perform NSAA items in patients at multiple time points (six visits) over 48 wk. Failure to perform an item was defined as a score transition from 2 or 1 to 0 at evaluation. For individual patients, we show examples of the cumulative number of failures across all 17 items over 48 weeks in Supporting Information Figure S2. Only post‐baseline failures were considered in the present analysis. For each treatment group, we then constructed the mean of all such patients' individual curves, reflecting the average cumulative number of failures over time (Figures 1 and 2). The higher the curve, the worse the study treatment effect. To quantify the group difference, we assumed that the ratio of two corresponding underlying group‐wise curves was constant over time, and used the Lin, Wei, Yang and Ying (LWYY) analytic method 11 to estimate this constant ratio. This summary measure can also be interpreted as the ratio of the intensities of occurrences of failures over time. Originally used to analyze multiple failure‐time data for the same failure type, the LWYY method has been utilized in cardiovascular and sickle cell anemia studies,12, 13 in both cases demonstrating cumulative treatment benefits over time. The LWYY method has not yet been applied to studies of progressive neuromuscular diseases, for which the method could provide unique insights into disease burden and response to treatment by assessing the totality of multiple clinical outcomes over time.
FIGURE 1.
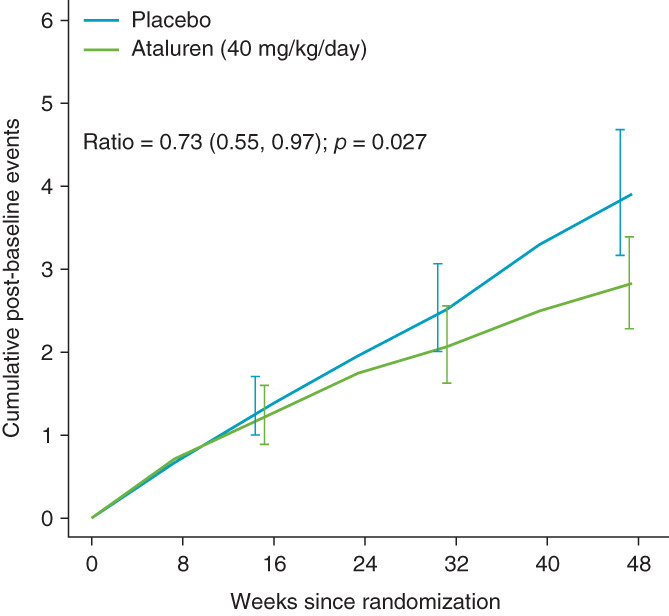
Group‐wise mean cumulative counts of lost NSAA functions (failures) at each visit over 48 wk for patients in study 020 receiving placebo (n = 114) or ataluren (40 mg/kg/day; n = 114) in the overall ITT population. Error bars represent the 95% pointwise confidence intervals
FIGURE 2.

Group‐wise mean cumulative counts of lost NSAA functions (failures) at each visit over 48 wk for patients in study 020 receiving placebo and prednisone/prednisolone (n = 61) or placebo and deflazacort (n = 53) in the overall ITT population. Error bars represent the 95% pointwise CI
Here, the procedure was generalized to handle different failure types. This methodology assumes that the ratio of the two group‐wise curves is constant over time and estimates this ratio. If this assumption is not plausible, the resulting estimate reflects an averaged ratio between the two curves over time. The lower the ratio, the greater the treatment effect. If a patient discontinued (placebo = 3 [deflazacort = 2; prednisone/prednisolone = 1]; ataluren = 4), the cumulative failure number was censored upon discontinuation.
3. RESULTS
3.1. ACT DMD study population
Of 230 patients (placebo = 115; ataluren = 115; as‐treated population), 228 were included in the ITT population (placebo = 114; ataluren = 114). 8 Of 114 placebo‐treated patients, 53 were receiving deflazacort and 61 prednisone/prednisolone. 14 Baseline demographics and patient characteristics were comparable between groups (Supporting Information Appendix S1).8, 14 The proportion of patients able to perform each NSAA item at baseline was similar between placebo and ataluren groups and between deflazacort and prednisone/prednisolone groups of the placebo arm (ITT population). 8 Mean (SD) total NSAA scores at baseline were 21.9 (8.0) and 22.2 (7.8) for placebo and ataluren groups, respectively, and 23.0 (9.0) and 20.9 (7.0) for deflazacort and prednisone/prednisolone groups, respectively.8, 14
3.2. Cumulative counts of lost NSAA functions at each visit over 48 weeks
Every patient in the ITT population (n = 228) was assessed for each NSAA item (placebo, 1938 items [deflazacort, 901 items; prednisone/prednisolone, 1037 items]; ataluren, 1938 items). 8 Curves for the group‐wise mean cumulative number of failures over 48 wk for placebo and ataluren groups are shown in (Figure 1). The placebo curve was steeper than that for ataluren after week 16 and continued to diverge until the end of treatment. The LWYY method was utilized to quantify the difference between the two group‐wise curves (i.e., the treatment effect). 11 The mean cumulative NSAA failure count at week 48 was 3.90 and 2.82 for placebo and ataluren groups, respectively. Over the study, a reduction of 27% in the mean cumulative failure rate was observed in ataluren‐treated versus placebo‐treated patients (rate ratio, 0.73; 95% confidence interval [CI], 0.55–0.97; p = .027).
Cumulative curves for placebo‐treated patients who received deflazacort or prednisone/prednisolone revealed a steeper curve for prednisone/prednisolone than for deflazacort, beginning at week 8, after which the curves continued to diverge (Figure 2). The LWYY method demonstrated that the mean cumulative NSAA failure count at week 48 was 2.75 and 3.84 for deflazacort and prednisone/prednisolone, respectively. The mean cumulative failure rate reduced by 28% in deflazacort‐treated versus prednisone/prednisolone‐treated patients over the study (rate ratio, 0.72; 95% CI, 0.53–0.96; p = .028). Although cumulative failure rate ratios at individual time points may not significantly differ between treatments (group‐wise 95% confidence intervals overlap in the figures), the LWYY procedure considers all time points to demonstrate the totality of treatment effects.
Using a different analytical procedure, the rate ratios of the concurrent failure number at each time point decreased from 1.05 to 0.54 for ataluren versus placebo and from 0.71 to 0.55 for deflazacort versus prednisone/prednisolone from visit one to six (Supporting Information Tables S1 and S2). The mean of these ratios over time was 0.72 and 0.71 respectively, suggesting robust long‐term treatment benefits.
4. DISCUSSION
The LWYY approach investigated here expands on published fixed‐time analyses as a new clinically meaningful approach to evaluating NSAA data in clinical trials. A previous ACT DMD post hoc single time point analysis showed that patients receiving ataluren experienced a 31% reduced risk of loss of function, measured by the ability to perform each NSAA item (ataluren‐treated patients lost 12.9% of functions; placebo‐treated patients lost 18.8% of functions; risk ratio, 0.687; 95% CI, 0.516–0.914; P = .010), compared with placebo after 48 weeks. 8 Here, we show that the cumulative NSAA item failure rate was significantly reduced by 27% in ataluren‐treated compared with placebo‐treated patients. We also analyzed data from placebo‐treated patients who received deflazacort or prednisone/prednisolone: the number of cumulative NSAA item failures was significantly reduced by 28% in patients receiving deflazacort relative to patients receiving prednisone/prednisolone. The methodology presented here demonstrates broad utility and practical use in enabling the observation of cumulative treatment effects, using NSAA data from DMD patients as illustrative examples.
The typical methodology for assessing treatment effects in investigative studies involves measuring changes in outcome measures from one fixed time point to another, usually from baseline to study end. The unique approach presented here answers a different clinical question by investigating the longitudinal profile of the treatment effect over time, rather than evaluating the effect at a single, fixed time point only. For progressive diseases like DMD, evaluating the totality of evidence from multiple outcome data over time using this approach complements traditional fixed time point analyses and offers clinically meaningful insights into disease burden and the temporal nature of treatment effects.
Work is in progress to develop an appropriate method to analyze cumulative gain of function in young DMD patients in whom maturational improvements may mask treatment effects.
4.1. Conclusions
Analyses of temporal data using the approach presented here demonstrated longitudinal, cumulative treatment effects over time, measured by the NSAA. This method could shape the design of future clinical studies, as well as clinically meaningful outcome measures, for patients with progressive neuromuscular disorders such as DMD.
CONFLICT OF INTEREST
Craig M. McDonald has acted as a consultant on clinical trials of DMD for Astellas, Capricor, Catabasis, Edgewise Therapeutics, Epirium Bio (formerly Cardero Therapeutics), FibroGen, Italfarmaco, Pfizer, PTC Therapeutics, Santhera Pharmaceuticals and Sarepta Therapeutics. He has received research support for clinical trials from Capricor, Catabasis, Italfarmaco, Pfizer, PTC Therapeutics, Santhera Pharmaceuticals and Sarepta Therapeutics. Lee‐Jen Wei has acted as a consultant for Johnson and Johnson, Merck and co., Pfizer, PTC Therapeutics and Sarepta Therapeutics. Kevin M. Flanigan has acted as a consultant for Apic Bio, Audentes Therapeutics, Dynacure, Italfarmaco, Marathon Pharmaceuticals, PTC Therapeutics, Santhera Pharmaceuticals, Sarepta Therapeutics, Tivorsan Pharmaceuticals, and 4D Molecular Therapeutics; has been a clinical trial investigator for Abeona Therapeutics, Akashi Therapeutics BioMarin and Sarepta Therapeutics; has received grants from Beauhawks Foundation and CureDuchenne; and has received royalty payment from Audentes Therapeutics. Gary Elfring and Panayiota Trifillis are employees of PTC Therapeutics. Francesco Muntoni has received consulting fees from AveXis, Biogen, Dyne Therapeutics, Capricor, Catabasis, Novartis, Pfizer, PTC Therapeutics, Roche, Santhera Pharmaceuticals, Sarepta Therapeutics and Wave Therapeutics, and is supported by the National Institute of Health Research Biomedical Research Centre at Great Ormond Street Hospital for Children NHS Foundation Trust and University College London. Medical writing and editorial support were funded by PTC Therapeutics Ltd.
ETHICAL APPROVAL
We confirm that we have read the Journal's position on issues involved in ethical publication and affirm that this report is consistent with those guidelines.
Supporting information
Appendix S1: Supplementary Information.
Figure S1 The North Star Ambulatory Assessment
Figure S2 Exemplary curves depicting the cumulative counts of lost North Star Ambulatory Assessment (NSAA) functions (failures) at each visit over 48 weeks for three hypothetical patients.
For example, patient #1 (blue line) had 7 failures at baseline and then experienced an additional 8 failures cumulatively over time up to Week 40, at which point this patient was lost to follow‐up. Patient #2 (green line) had 1 failure at baseline and accumulated a further 6 failures up to Week 48. Patient #3 (red line) had 0 failures at baseline and completed the study at Week 48 with 2 cumulative failures
Table S1 The observed average rate ratios of mean numbers of new North Star Ambulatory Assessment (NSAA) failures at each visit for patients receiving placebo or ataluren (40 mg/kg/day)
Table S2 The observed average rate ratios of mean numbers of new North Star Ambulatory Assessment (NSAA) failures at each visit for patients treated with placebo who were receiving prednisone/prednisolone or patients treated with placebo who were receiving deflazacort
ACKNOWLEDGMENTS
We thank the patients and their families for their participation in this study. We also thank the individuals involved in the conduct of this study and the collection of data, particularly the ACT DMD (Study 020) study group, principal investigators and study coordinators. Medical writing and editorial support were provided by Luci Witcomb, PhD, and Emily Colbeck, PhD, of PharmaGenesis London, London, UK. This study was funded by PTC Therapeutics, Inc.
APPENDIX A.
The Clinical Evaluator Training Group
Lindsay N. Alfano (Center for Gene Therapy, Nationwide Children's Hospital, Columbus, OH, USA); Michelle Eagle (Atom International, Gateshead, UK); Erik K. Henricson (University of California Davis Health, Sacramento, CA, USA); Meredith K. James (The John Walton Muscular Dystrophy Research Centre, Newcastle upon Tyne, UK); Linda Lowes (Center for Gene Therapy, Nationwide Children's Hospital, Columbus, OH, USA); Anna Mayhew (MRC Centre for Neuromuscular Diseases, Newcastle University, Newcastle upon Tyne, UK); Elena S. Mazzone (Department of Pediatric Neurology, Catholic University, Rome, Italy); Leslie Nelson (University of Texas Southwestern Medical Center, Dallas, TX, USA); Kristy J. Rose (Gait Analysis Laboratory of New South Wales, The Children's Hospital at Westmead, Sydney, NSW, Australia).
The ACT DMD Study Group
Hoda Z. Abdel‐Hamid (UPMC Children's Hospital of Pittsburgh, Pittsburgh, PA, USA); Susan D. Apkon (Seattle Children's Hospital, Seattle, WA, USA); Richard J. Barohn (University of Kansas Medical Center, Kansas City, KS, USA); Enrico Bertini (Bambino Gesù Children's Research Hospital, Rome, Italy); Russell J. Butterfield (Department of Neurology and Pediatrics, University of Utah, Salt Lake City, UT, USA); Craig Campbell (Schulich School of Medicine and Dentistry, Western University, Ontario, Canada); Brigitte Chabrol (Pediatric Medicine Unit, Hospital Timone, Marseille, France); Jong‐Hee Chae (Seoul National University Children's Hospital, Seoul, South Korea); Giacomo Pietro Comi (Department of Pathophysiology and Transplantation, IRCCS Foundation Ca'Granda, Ospedale Maggiore Policlinico, Dino Ferrari Centre, University of Milan, Milan, Italy); Anne Connolly (Nationwide Children's Hospital, Ohio, USA); Basil T. Darras (Boston Children's Hospital, Harvard Medical School, Boston, MA, USA); Jahannaz Dastgir (Goryeb Children's Hospital, Morristown, NJ, USA); Isabelle Desguerre (Hospital for Sick Children, Robert Debré Building, Paris, France); Raul G. Escobar (Neurology Unit, Division of Pediatrics, Medical School, The Pontifical Catholic University of Chile, Santiago, Chile); Erika Finanger (Oregon Health & Science University, Portland, OR, USA); Nathalie Goemans (University Hospital Leuven (UZ Leuven), Leuven, Belgium); Michela Guglieri (Institute of Genetic Medicine and the International Centre for Life, Newcastle University, Newcastle upon Tyne, UK); Peter Heydemann (Rush University Medical Center, Chicago, IL, USA); Imelda Hughes (Royal Manchester Children's Hospital, Manchester, UK); Susan T. Iannaccone (University of Texas Southwestern Medical Center, Dallas, TX, USA); Pierre‐Yves Jeannet (Lausanne University Hospital, Lausanne, Switzerland); Kristi J. Jones (Institute for Neuroscience and Muscle Research, The Children's Hospital at Westmead, Westmead, NSW, Australia); Anna Kamińska (Medical University of Warsaw, Warsaw, Poland); Peter Karachunski (Department of Neurology, University of Minnesota, Minneapolis, MN, USA); Janbernd Kirschner (Center for Pediatric and Adolescent Medicine, University Hospital Freiburg, Freiburg, Germany); Martin Kudr (Department of Pediatric Neurology, Charles University, 2nd Faculty of Medicine, Motol University Hospital, Prague, Czech Republic); Timothy Lotze (Texas Children's Hospital, Houston, TX, USA); Jean K. Mah (Alberta Children's Hospital, University of Calgary, Calgary, AB, Canada); Katherine Mathews (Department of Pediatrics, Division of Pediatric Neurology, University of Iowa Stead Family Children's Hospital, Iowa City, IA, USA); Eugenio Mercuri (Bambino Gesù Children's Research Hospital, Rome, Italy); Wolfgang Müller‐Felber (Dr. von Hauner Children's Hospital, Munich, Germany); Andrés Nascimento Osorio (Hospital Sant Joan de Déu, Universidad de Barcelona, CIBER, ISCIII, Barcelona, Spain); Yoram Nevo (Hadassah Medical Center, Mount Scopus, Jerusalem, Israel); Julie Parsons (Children's Hospital Colorado, University of Colorado School of Medicine, Aurora, CO, USA); Yann Péréon (Reference Centre for Neuromuscular Disorders, CHU Nantes, Nantes, France); Alexandra Prufer de Queiroz Campos Araújo (Department of Pediatrics, School of Medicine, UFRJ, Rio de Janeiro, Brazil); James B. Renfroe (Child Neurology Center of Northwest Florida, Gulf Breeze, FL, USA); Maria Bernadete Dutra de Resende (Department of Pediatric Neurology, Faculty of Medicine, University of São Paulo, São Paulo, Brazil); Monique Ryan (The Royal Children's Hospital, Parkville, VIC, Australia); Ulrike Schara (University of Essen, Essen, Germany); Perry B. Shieh (University of California, Los Angeles, CA, USA); Thomas Sejersen (Karolinska University Hospital, Karolinska Institutet, Stockholm, Sweden); Kathryn Selby (Division of Neurology, British Columbia Children's Hospital, Vancouver, BC, Canada); Gihan Tennekoon (The Children's Hospital of Philadelphia, Division of Neurology, Philadelphia, PA, USA); Haluk Topaloglu (Hacettepe Children's Hospital, Ankara, Turkey); Ricardo Erazo Resende (Hospital Luis Calvo Mackenna, Santiago de Chile, Chile); Már Tulinius (Gothenburg University, Queen Silvia Children's Hospital, Gothenburg, Sweden); Juan Vilchez (University and Polytechnic Hospital of La Fe, CIBERER, Valencia, Spain); Giuseppe Vita (AOU Policlinico G Martino, Nemo Sud Clinical Centre, University of Messina, Messina, Italy); Thomas Voit (UCL Great Ormond Street Institute of Child Health, London, UK); Petr Vondráček (University Hospital Brno, Brno, Czech Republic); Brenda Wong (Cincinnati Children's Hospital Medical Center, Cincinnati, OH, USA).
McDonald CM, Wei L‐J, Flanigan KM, et al. Evaluating longitudinal therapy effects via the North Star Ambulatory Assessment . Muscle & Nerve. 2021;64:614–619. 10.1002/mus.27396
Members of the The ACT DMD Clinical Evaluator Training Group and The ACT DMD Study Group are listed in the Appendix.
Funding information PTC Therapeutics, Inc
DATA AVAILABILITY STATEMENT
The data that support the findings of this study are available from the corresponding author upon reasonable request.
REFERENCES
- 1. Bushby K, Finkel R, Birnkrant DJ, et al. Diagnosis and management of Duchenne muscular dystrophy, part 1: diagnosis, and pharmacological and psychosocial management. Lancet Neurol. 2010;9(1):77‐93. [DOI] [PubMed] [Google Scholar]
- 2. Aartsma‐Rus A, Ginjaar IB, Bushby K. The importance of genetic diagnosis for Duchenne muscular dystrophy. J Med Genet. 2016;53(3):145‐151. [DOI] [PMC free article] [PubMed] [Google Scholar]
- 3. Hoffman EP, Brown RH Jr, Kunkel LM. Dystrophin: the protein product of the Duchenne muscular dystrophy locus. Cell. 1987;51(6):919‐928. [DOI] [PubMed] [Google Scholar]
- 4. Pichavant C, Aartsma‐Rus A, Clemens PR, et al. Current status of pharmaceutical and genetic therapeutic approaches to treat DMD. Mol Ther. 2011;19(5):830‐840. [DOI] [PMC free article] [PubMed] [Google Scholar]
- 5. Peltz SW, Morsy M, Welch EM, Jacobson A. Ataluren as an agent for therapeutic nonsense suppression. Annu Rev Med. 2013;64:407‐425. [DOI] [PMC free article] [PubMed] [Google Scholar]
- 6. Birnkrant DJ, Bushby K, Bann CM, et al. Diagnosis and management of Duchenne muscular dystrophy, part 1: diagnosis, and neuromuscular, rehabilitation, endocrine, and gastrointestinal and nutritional management. Lancet Neurol. 2018;17(3):251‐267. [DOI] [PMC free article] [PubMed] [Google Scholar]
- 7. European Medicines Agency . Translarna™ summary of product characteristics. Accessed February 11, 2021 www.ema.europa.eu/documents/product-information/translarna-epar-product-information_en.pdf
- 8. McDonald CM, Campbell C, Torricelli RE, et al. Ataluren in patients with nonsense mutation Duchenne muscular dystrophy (ACT DMD): a multicentre, randomised, double‐blind, placebo‐controlled, phase 3 trial. Lancet. 2017;390(10101):1489‐1498. [DOI] [PubMed] [Google Scholar]
- 9. Mazzone ES, Messina S, Vasco G, et al. Reliability of the North Star Ambulatory Assessment in a multicentric setting. Neuromuscul Disord. 2009;19(7):458‐461. [DOI] [PubMed] [Google Scholar]
- 10. Scott E, Eagle M, Mayhew A, et al. Development of a functional assessment scale for ambulatory boys with Duchenne muscular dystrophy. Physiother Res Int. 2012;17(2):101‐109. [DOI] [PubMed] [Google Scholar]
- 11. Lin DY, Wei LJ, Yang I, Ying Z. Semiparametric regression for the mean and rate functions of recurrent events. J R Statist Soc B. 2000;62(4):711‐730. [Google Scholar]
- 12. Mogensen UM, Gong J, Jhund PS, et al. Effect of sacubitril/valsartan on recurrent events in the prospective comparison of ARNI with ACEI to determine impact on global mortality and morbidity in heart failure trial (PARADIGM‐HF). Eur J Heart Fail. 2018;20(4):760‐768. [DOI] [PMC free article] [PubMed] [Google Scholar]
- 13. Niihara Y, Miller ST, Kanter J, et al. A phase 3 trial of l‐glutamine in sickle cell disease. N Engl J Med. 2018;379(3):226‐235. [DOI] [PubMed] [Google Scholar]
- 14. Shieh PB, McIntosh J, Jin F, et al. Deflazacort versus prednisone/prednisolone for maintaining motor function and delaying loss of ambulation: a post HOC analysis from the ACT DMD trial. Muscle Nerve. 2018;58(5):639‐645. [DOI] [PMC free article] [PubMed] [Google Scholar]
Associated Data
This section collects any data citations, data availability statements, or supplementary materials included in this article.
Supplementary Materials
Appendix S1: Supplementary Information.
Figure S1 The North Star Ambulatory Assessment
Figure S2 Exemplary curves depicting the cumulative counts of lost North Star Ambulatory Assessment (NSAA) functions (failures) at each visit over 48 weeks for three hypothetical patients.
For example, patient #1 (blue line) had 7 failures at baseline and then experienced an additional 8 failures cumulatively over time up to Week 40, at which point this patient was lost to follow‐up. Patient #2 (green line) had 1 failure at baseline and accumulated a further 6 failures up to Week 48. Patient #3 (red line) had 0 failures at baseline and completed the study at Week 48 with 2 cumulative failures
Table S1 The observed average rate ratios of mean numbers of new North Star Ambulatory Assessment (NSAA) failures at each visit for patients receiving placebo or ataluren (40 mg/kg/day)
Table S2 The observed average rate ratios of mean numbers of new North Star Ambulatory Assessment (NSAA) failures at each visit for patients treated with placebo who were receiving prednisone/prednisolone or patients treated with placebo who were receiving deflazacort
Data Availability Statement
The data that support the findings of this study are available from the corresponding author upon reasonable request.