Abstract
CO2‐neutral fuels are a way to cleaner and more sustainable mobility. Utilization of bio‐syngas via Fischer‐Tropsch (FT) synthesis represents an interesting route for the production of tailormade biofuels. Recent developments in FT catalyst research led to olefin‐enriched products, enabling the synthesis of alcohol‐enriched fuels by reductive hydroformylation of the C=C bond. Several alcohols have already proven to be suitable fuel additives with favorable combustion behavior. Here, a hydroformylation‐hydrogenation sequence of FT‐olefin‐paraffin mixtures was investigated as a potential route to alcohols. A liquid‐liquid biphasic system with a rhodium/3,3’,3’’‐phosphanetriyltris(benzenesulfonic acid) trisodium salt (TPPTS) catalyst system was chosen for effective catalyst recycling. After optimizing reaction conditions with a model substrate consisting of 1‐octene and n‐heptane the conversion of an actual olefin‐containing C5‐C10 FT product fraction to alcohols in continuously operated processes for 37 h was achieved with a total turnover number of 23679.
Keywords: alkenes, biphasic catalysis, hydroformylation, renewable resources, synthetic fuels
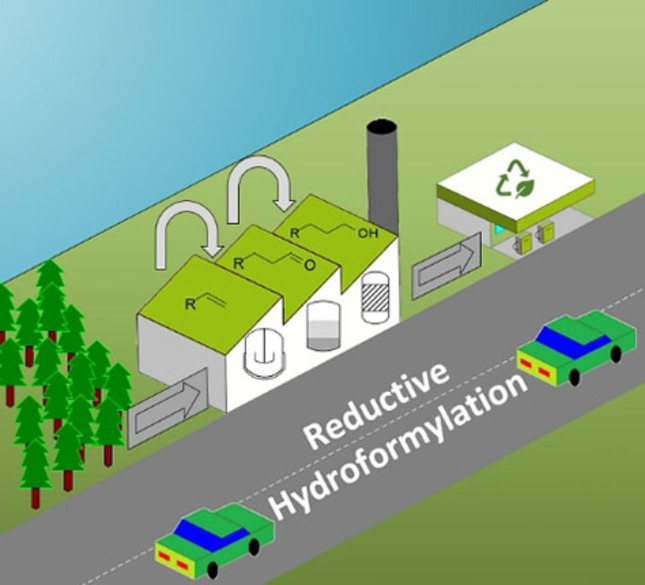
Reductive hydroformylation: This work presents a two‐step hydroformylation and hydrogenation sequence for the synthesis of alcohols for synthetic fuels. An olefin‐paraffin mixture from C5 to C10 is converted in a single reaction mixture with efficient multiphase catalyst recycling in continuous flow. Alcohols are synthesized without intermediate purification of the aldehyde intermediates.
Introduction
Synthetic fuels represent a chance to reduce carbon dioxide emissions in the current fleet of vehicles[ 1 , 2 , 3 ] and can act as a bridging technology, facilitating the ongoing use of current infrastructure. Various different molecules represent possible fuel candidates.[ 2 , 4 , 5 ] Using the gained degrees of freedom in the synthesis of fuels, tailor‐made properties are possible, for example, by introducing oxygen into the fuel matrix to inhibit soot emissions. [6] One potential carbon‐neutral pathway to a diesel‐type drop‐in fuel is the Fischer‐Tropsch (FT) reaction with bio‐derived syngas, for example, from the gasification of biomass (Figure 1). [7] For a diesel‐type fuel, only the C11+ hydrocarbon fraction of the FT product is applicable, albeit not meeting the current EN590 requirements without additives. [8] Olefin‐enriched liquid FT synthetic hydrocarbons can be produced using either conventional iron carbide catalysts [9] or recently developed cobalt catalysts without CO2 side‐production.[ 10 , 11 ] This enables the C5‐C10 liquid FT product fraction to be upgraded, for example, by chemical conversion to alcohols. Several alcohols, such as n‐octanol, have already been studied in terms of engine influences and showed favorable combustion properties while aiding to reach requirements for drop‐in capability.[ 3 , 12 , 13 , 14 , 15 ]
Figure 1.
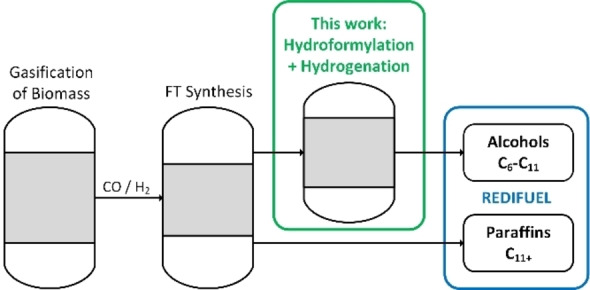
Overall process concept.
Hydroformylation and subsequent hydrogenation (Scheme 1) represent a pathway further utilizing bio‐syngas for the production of primary alcohols via aldehyde intermediates.[ 16 , 17 ] Hydroformylation of medium‐ to long‐chain alkenes has been extensively studied since the discovery of the reaction by Otto Roelen in 1938. [18] One major step in the development of hydroformylation processes is represented by the Ruhrchemie‐Rhône‐Poulenc process for the hydroformylation of the short‐chain olefin propene and its effective multiphase recycling of the expensive rhodium catalyst.[ 19 , 20 , 21 ] Applying the water‐based recycling concept to higher olefins has been investigated by several research groups in the past.[ 22 , 23 , 24 , 25 , 26 , 27 , 28 , 29 ] These investigations usually focus on a single olefin, predominantly used as pure substrate phase.
Scheme 1.
FT product hydroformylation and hydrogenation.
To approach the goal of a lean access to the bioderived alcohols for a diesel blend, C5‐C10 cuts of FT mixtures consisting of olefins and paraffins with varying chain length are converted in this manuscript. Using these as a hydroformylation substrate requires a catalytic process that tolerates the presence of paraffins and potential other impurities, such as oxygenates. [8] Furthermore, the catalyst is required to convert a mixture of different olefins with varying water solubility under the same reaction conditions. To develop a sustainable and economically viable fuel production process, a stable catalyst system has to be developed as well as high once‐through yields, so as to avoid energy‐intensive separation steps to achieve economically viable production of drop‐in biofuels.
Results and Discussion
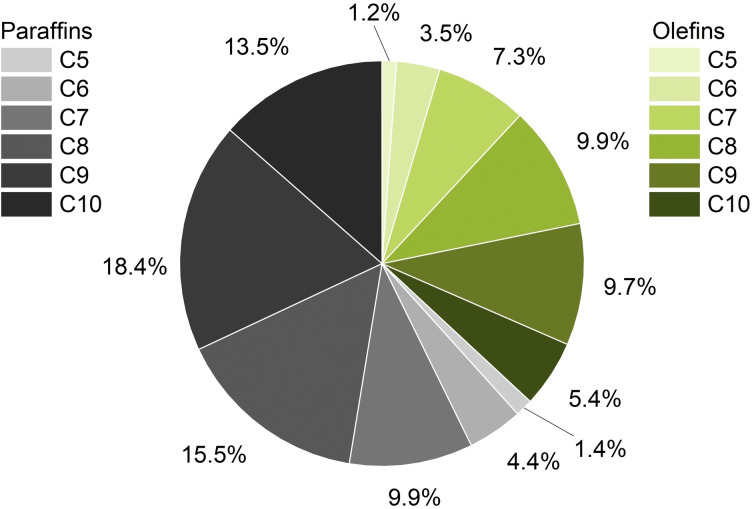
To develop a two‐stage system for the conversion of the C5‐C10 olefin cut to alcohols the hydroformylation is investigated first. The catalyst system is optimized and applied in a miniplant setup in the following. A C5‐C10 cut yielded from FT experiments operated with renewable syngas yielded from gasification of biomass, carried out in the context of the REDIFUEL project, is evaluated in terms of reactivity and its influence on catalyst stability. Afterwards, the hydrogenation of the continuous‐flow product mixture is investigated. As a start, a surrogate substrate consisting of 1‐octene and n‐heptane was used to mimic the FT mixture. Given the composition of the FT mixture (Figure 2), the chosen components represent the average over the chain length distribution.
Figure 2.
Composition of the FT mixture.
The applied hydroformylation catalyst system consists of rhodium and 3,3’,3’’‐phosphanetriyltris(benzenesulfonic acid) trisodium salt (TPPTS) as ligand. Several other metals have been applied in hydroformylation, [30] such as ruthenium, [31] but rhodium is by far the most active metal to this day. TPPTS was chosen as ligand since more elaborate bidentate ligands, such as SulfoXantphos, usually increase the regioselectivity while decreasing the catalytic activity. [32] Regioselectivity is of minor importance in this system aiming for fuel production, hence the high activity of a Rh/TPPTS system was utilized to develop an economically feasible process.
Batch hydroformylation
In order to determine suitable reaction conditions for the hydroformylation of an olefin‐paraffin substrate mixture, several batch experiments were conducted. The reaction network of the hydroformylation reaction is depicted in Scheme 2. The substrate α‐olefins can react to either linear 1 or branched 2 aldehydes by the addition of syngas to the C=C bond.
Scheme 2.
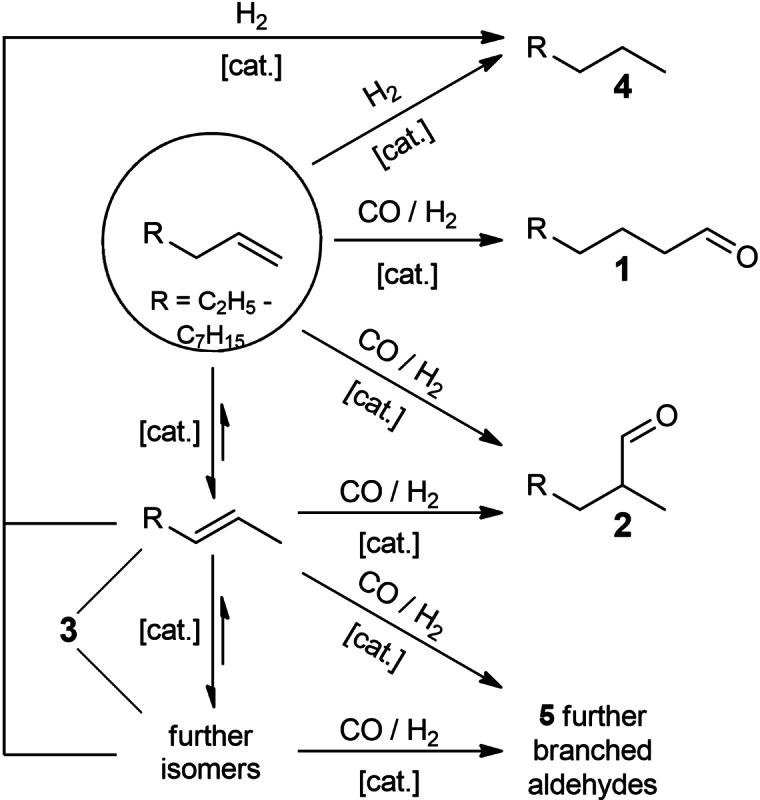
Hydroformylation reaction network.
Furthermore, the olefin can be isomerized, yielding internal olefins 3. Depending on the catalyst type and reaction conditions, hydrogenation of the olefin takes place, generating the corresponding paraffin 4. The hydroformylation of an internal olefin produces further branched aldehydes 5. The ratio between 1 and branched 2+5 aldehydes is predominantly determined by the ligand system; this regioselectivity is commonly known as linear/branched (l/b) ratio.
First the influence of catalyst and ligand concentration were investigated (Table 1). A rhodium concentration of 0.5 mol m−3 as well as a molar ratio between rhodium and TPPTS of 10 (Table 1, entry 1.1) was used, which were previously applied in the conversion of pure 1‐octene. [23]
Table 1.
Variation of catalyst and ligand concentration.[a]
|
Entry |
c cat [mol m−3] |
c TPPTS [mol m−3] |
T [°C] |
p [MPa] |
X [%] |
Y Ald [%] |
S Ald [%] |
l/b ratio |
TOF[b] [h−1] |
STY[c] [kg m−3 h−1] |
Rh loss[d] [ppm] |
|---|---|---|---|---|---|---|---|---|---|---|---|
|
1.1 |
0.5 |
5 |
80 |
8 |
16 |
12 |
74 |
2.1 |
770 |
21.9 |
4 (8 %) |
|
1.2 |
0.25 |
2.5 |
80 |
8 |
18 |
13 |
73 |
2.1 |
1649 |
23.5 |
7 (28 %) |
|
1.3 |
0.5 |
2.5 |
80 |
8 |
98 |
72 |
73 |
2.0 |
4580 |
130.3 |
39 (79 %) |
|
1.4 |
0.5 |
10 |
80 |
8 |
3 |
2 |
71 |
2.2 |
128 |
3.6 |
<2 (<4 %) |
|
1.5 |
1 |
10 |
80 |
8 |
7 |
5 |
77 |
2.1 |
165 |
9.4 |
<2 (<2 %) |
[a] Conditions: t=1.5 h, pH=5.5, ϕorg=0.6, V R=100 mL, n=1725 min−1. [b] Turnover frequency, TOF=n prod/(n Rh×t R). [c] Space‐time yield. [d] Leaching: ICP‐OES.
Reducing the catalyst concentration by a factor of two led to similar results in terms of yield, but the catalyst leaching increased significantly from 8 to 28 % (entry 1.2). Only reducing the concentration of TPPTS led to full conversion and 72 % aldehyde yield (entry 1.3).
This behavior was most probably caused by a shift of the catalytic complex to rhodium carbonyl species, which operated in the organic phase, as indicated by the high rhodium leaching of 79 %; catalyst recycling was ineffective under these conditions.
With increased ligand excess, regioselectivity increases slightly (entry 1.4), while the reaction rate is significantly lowered. Increasing the concentration of the catalyst metal while maintaining the metal/ligand ratio led to inhibition of the reaction (entry 1.5). This is caused by a salting‐out effect or a shift of the catalyst to inactive complexes, according to literature.[ 18 , 23 , 33 ] For both experiments with a ligand concentration of 10 mol m−3, the rhodium leaching was at the inductively coupled plasma optical emission spectroscopy (ICP‐OES) detection limit, further supporting the assumption that an inactive, saturated catalyst species is formed under these conditions. As a result, all following experiments have been conducted with a catalyst concentration of 0.5 mol m−3 (which equals 51 ppm of rhodium in the aqueous phase) and a ligand concentration of 5 mol m−3.
As it would be expected, increasing the reaction temperature increases reaction rates. Because of the activation energy difference, the formation of isomerized olefins 3 is favored at higher temperatures. Hence, the selectivity to aldehydes decreases with increasing temperature (Table 2, entries 2.1–2.3). At 120 °C, the highest aldehyde yield of 41 % has been achieved in conjunction with 92 % conversion of the olefin (entry 2.2). However, the l/b ratio decreases because hydroformylation of internal olefins occurs. Increasing the temperature to 140 °C decreases the l/b ratio and aldehyde yields (entry 2.3). High temperature led to high isomerization rates, which are detrimental to hydroformylation. The lower available concentration of 1‐octene causes the observed decrease of aldehyde yield.
Table 2.
Variation of temperature and pressure.[a]
|
Entry |
c cat [mol m−3] |
c TPPTS [mol m−3] |
T [°C] |
p [MPa] |
X [%] |
Y Ald [%] |
S Ald [%] |
l/b ratio |
TOF[b] [h−1] |
STY [kg m−3 h−1] |
|---|---|---|---|---|---|---|---|---|---|---|
|
2.1 |
0.5 |
5 |
100 |
8 |
62 |
32 |
52 |
2.6 |
2057 |
58.5 |
|
2.2 |
0.5 |
5 |
120 |
8 |
92 |
41 |
45 |
1.5 |
2631 |
74.8 |
|
2.3 |
0.5 |
5 |
140 |
8 |
86 |
24 |
28 |
0.9 |
1502 |
42.7 |
|
2.4 |
0.5 |
5 |
80 |
10 |
17 |
13 |
76 |
2.0 |
818 |
23.3 |
|
2.5 |
0.5 |
5 |
80 |
12 |
15 |
12 |
79 |
1.9 |
738 |
21.0 |
[a] Conditions: t=1.5 h, pH=5.5, ϕorg=0.6, V R=100 mL, n=1725 min−1. [b] TOF=n prod/(n Rh×t R).
A separation of a mixture of C5‐C10‐olefins and paraffins is challenging because of similar thermophysical properties. Furthermore, the latter are inert and would accumulate in the process, so recycling of unconverted substrate is not feasible. If not recycled, leftover olefins will be hydrogenated to paraffins in the second reaction step regardless of the double bond position. Hence, the olefin isomerization is of minor importance in this system and increasing the once‐through‐yield of the reaction is more appropriate in this case. Because the reaction reaches over 85 % olefin conversion at temperatures above 120 °C, the possibility of increasing the selectivity by higher syngas pressures was investigated. Increased pressure increases the concentration of the gaseous substrates in both liquid reaction phases.[ 23 , 34 ] However, carbon monoxide represents a competing ligand, hence increasing the CO concentration can cause the formation of various carbonyl complexes. If saturated complexes are formed, reduced overall reaction rates can be observed. [35] Additionally, replacement of all TPPTS ligands by carbonyl groups forms a highly active catalyst that is no longer immobilized in the aqueous phase. [35]
While the rate of isomerization decreases at increased pressures, the hydroformylation at the same time benefits from increased concentrations of the gaseous substrates. Similar aldehyde yields at all investigated pressures in conjunction with lower isomerization rates led to higher chemoselectivity towards aldehydes (entries 2.4 and 2.5). By combining the effects of increased pressures and elevated reaction temperature, a higher once‐trough yield could be achievable.
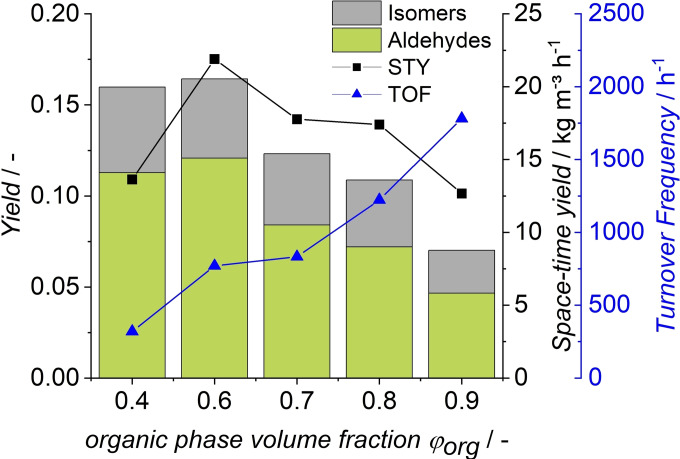
In liquid‐liquid biphasic hydroformylation of long‐chain olefins, the reaction is assumed to occur on the phase interface. [36] Hence, the interfacial area is of particular interest in this system and is dependent on the reactor type, energy input, and the amount of dispersed aqueous phase present in the reaction. As it has already been observed in a similar system, [24] higher aqueous phase volume and the induced increase of interfacial area led to higher yields (Figure 3). However, with an increase in catalyst phase, the substrate volume in the reactor is reduced. Hence, not only yield is evaluated in these experiments, but also space‐time yield (STY) and turnover frequency (TOF) are of interest.
Figure 3.
Variation of phase fractions. Conditions: cRh=0.5 mol , cTPPTS=5 mol , t=1.5 h, T=80 °C, p=8 MPa, pH=5.5, VR=100 mL, n=1725 min−1.
While the organic substrate volume increases with high values of ϕorg, lower aldehyde yields and STY were observed. The highest yield was achieved at ϕorg=0.6. Further increasing the amount of catalyst phase (ϕorg=0.4) led to comparable yields. However, the decreased organic volume decreases productivity (STY) and catalyst activity. Catalytic productivity (TOF) increases with higher values of ϕorg, but the overall reaction rates are lower because less catalyst is present in the system. Accordingly, an organic phase volume fraction of 0.6 was chosen for all following experiments because of the highest space‐time (21.9 kg m−3 h−1) and reaction yield (12 %).
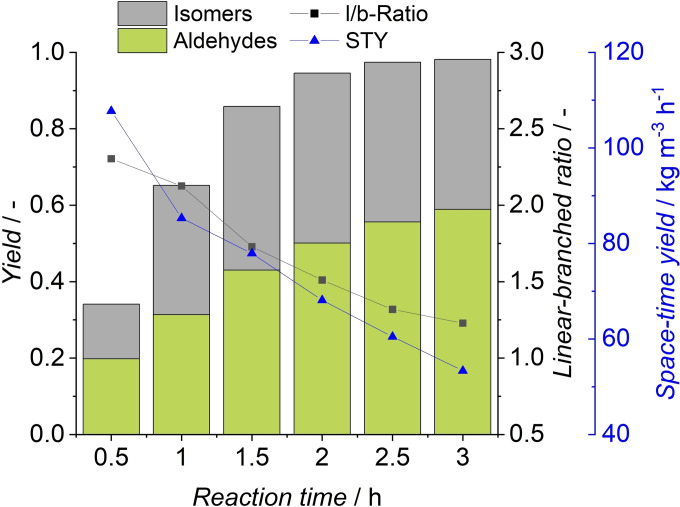
In a yield‐time experiment with the model substrate, the determined reaction conditions (10 MPa, 120 °C) were combined. After 90 min, 43 % aldehyde yield was reached, without full olefin conversion (Figure 4). This result underlines the synergetic effect of inhibiting the isomerization with increased pressures while maintaining similar hydroformylation rates through elevated temperatures.
Figure 4.
Model substrate yield‐time experiment. Conditions: cRh=0.5 mol m−3 aq, cTPPTS=5 mol , T=120 °C, p=10 MPa, pH=5.5, ϕorg=0.6, VR=115 mL, n=1725 min−1.
After 3 h, full conversion of 1‐octene was observable (Figure 4). At full conversion, approximately 60 % of the olefins were converted to aldehydes, representing the highest yield of all experiments. As a result, a STY of 77.9 kg m−3 h−1 and an average TOF of 2739 h−1 were achieved after the previously used batch reaction time of 1.5 h. These values are the highest of all our batch experiments with low catalyst leaching. Furthermore, an initial TOF (0.5 h) of 3787 h−1 was measured, which is a comparably high value for stirred‐tank reactors,[ 24 , 32 ] even though this is a system diluted by paraffins.
Increasing the reaction time to 3 h led to slow formation of additional branched aldehydes 5, as indicated by a decrease in l/b ratio. Since predominantly isomerized olefins 3 are present at high 1‐octene conversion, hydroformylation of internal olefins occurs, as already discussed for temperatures above 120 °C. Hence, the space‐time for the continuous experiments has been set to 2 h to maximize STY and suppress the hydroformylation of internal olefins.
For the experiment with actual olefin‐paraffin mixture from FT synthesis, a temperature of 100 °C has been chosen to suppress the hydroformylation of internal olefins even further.
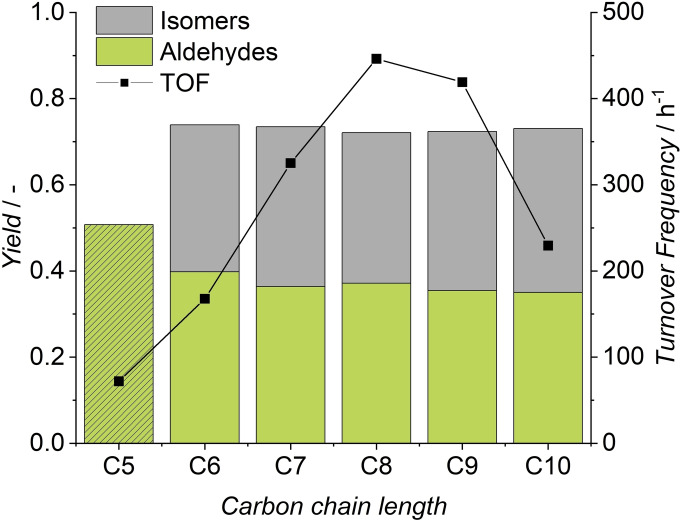
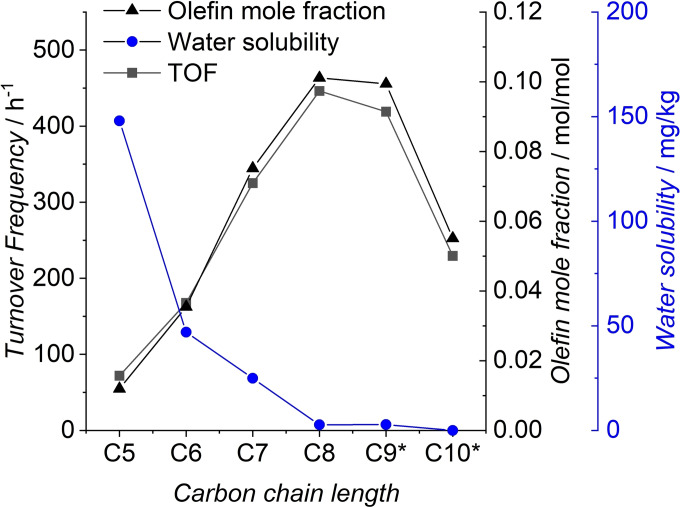
One major goal of these investigations was to convert C5‐C10 olefin‐paraffin mixtures to aldehydes under the same process conditions in a single reaction mixture. This was achieved, as the results in Figure 5 show a successful conversion of all present olefins. The achieved individual yields after 1.5 h (between 35 and 40 %) are comparable to the results of experiments with model substrate 1‐octene. Since the solubility in the aqueous phase and hence the accessibility of the catalyst decreases by orders of magnitude (Figure 6) with increasing carbon chain length,[ 37 , 38 ] the similar yields seem counter‐intuitive.
Figure 5.
Olefin cut as substrate. Conditions: cRh=0.5 mol , cTPPTS=5 mol , T=120 °C, p=10 MPa, pH=5.5, VR=100 mL, ϕorg=0.6, t=1.5 h, n=1725 min−1.
Figure 6.
TOF vs. olefin concentration and water solubility (* missing water solubility data replaced by paraffin).
By calculating the TOF, different reaction speeds for all olefins become visible. However, no correlation between olefin solubility and TOF is present (Figure 6). This leads to the assumption that, as already suggested for similar reaction systems, the reaction seems to occur on the liquid‐liquid interface. [36] In this system, the olefin concentration in the substrate is different for each carbon chain length. Several published kinetic rate expressions for the hydroformylation of long‐chain olefins suggest a first‐order dependence of the reaction rate in regard to olefin concentration.[ 23 , 25 , 39 , 40 , 41 ]
Accordingly, Figure 6 shows a good fit of the individual olefin concentration in the FT mixture and the corresponding TOF. Hence, low olefin concentrations will decrease the reaction rate, indicating further optimization potential by increasing the olefin selectivity of the FT catalyst.
Continuously operated hydroformylation
The largest influence on the reaction was observed for increased temperatures and higher syngas pressures. Since both parameters influence catalytic stability, continuous flow experiments were conducted at 100 and 120 °C as well as 6 and 10 MPa.
A miniplant consisting of a continuously stirred tank reactor in conjunction with a phase separation vessel has been designed and installed (Figure 7). A more detailed description of the setup can be found in the Supporting Information.
Figure 7.
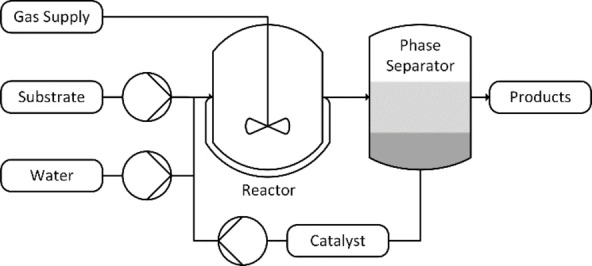
Simplified pilot plant flow diagram.
When first applying a combination of mild reaction conditions (100 °C, 6 MPa) in the continuous‐flow setup, the reaction achieved 93 % conversion at the end of phase 1 (batch start‐up of the reactor). However only 40 % selectivity to aldehydes was observed during this experiment, resulting in 38 % aldehyde yield after 3 h (Figure 8). At the end of batch phase 2 (conversion of initial substrate amount in the decanter), yield and conversion do not reach the same values for conversion and yield because of a higher amount of organic phase in the phase separator compared to the reactor.
Figure 8.
Experimental results in continuous flow. Conditions: cRh=0.5 mol m−3 aq, cTPPTS=5 mol , T=100 °C, p=6 MPa, pH=5.5, ϕorg=0.6, n=2000 min−1 , VR=115 mL, VF=35 mL h−1.
During continuous operation in phase 3, a steady decrease of the reaction rate was observed (Figure 8). This was caused by water loss into the product stream, as observed through the window of the reaction vessel. A possible explanation for the observed water loss is the surfactant‐like structure of the formed aldehyde, enabling water to be soluble in the organic product phase. A simulation using Aspen Properties suggested the water content of the product to be 0.5 wt% at 45 % yield. In the experiments, a water flow of 0.5 mL h−1 led to a constant aqueous phase volume in the reactor. Detailed information on the simulation is available in the Supporting Information. Losing water over the course of the miniplant operation led to two unfavorable changes of the reaction system: (1) assuming no catalyst leaching, the catalyst concentration will increase to values that showed inhibitory behavior in batch experiments; (2) the interfacial area decreases, inhibiting the reaction further. Consequently, replenishment of the aqueous phase volume led to partial restoration of the lost activity (phase 4 in Figure 8), proving the water loss to be at least partially responsible for the observed deactivation. Hence, for all following experiments, a precise dosing pump for a continuous feed of water was implemented to circumvent this deactivation phenomenon. Furthermore, ICP‐OES measurements of the product phase showed rhodium leaching of below the detection limit of 2 ppm.
To achieve higher once‐through yields, higher selectivity to aldehydes is necessary. Batch experiments had shown increasing selectivity to aldehydes at higher syngas pressure.
Applying 10 MPa of syngas pressure increased the aldehyde selectivity to an average of 62 % (Figure 9), which is in accordance with the previously discussed batch experiments. While the olefin isomerization is suppressed at higher syngas pressures, the aldehyde yields increased slightly to 41 % at 66 % conversion of 1‐octene in phase 1. In phase 2, the high amount of organic phase in the phase separator once again led to lower yields compared to phase 1. During continuous operation (phase 3), decrease of reaction rates can still be observed (Figure 9). This can be ascribed to the lower space‐time of 2 h compared to 3 h of batch reaction time. In order to achieve higher once‐through yields, full conversion of the olefin is desired.
Figure 9.
Continuous‐flow experiment with increased syngas pressure. Conditions: cRh=0.5 mol , cTPPTS=5 mol , T=100 °C, p=10 MPa, pH=5.5, ϕorg=0.6, n=2000 min−1, VR=115 mL, VF=35 mL h−1.
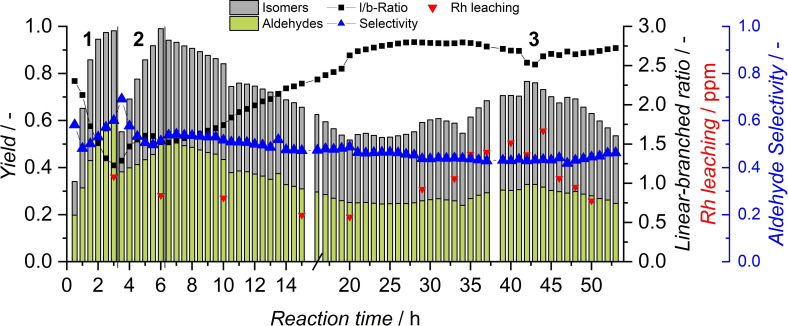
Hence, the combination of 10 MPa and 120 °C has been investigated to reach higher conversion in conjunction with increased aldehyde selectivity (Figure 10). In accordance with the temperature influence observed in batch experiments, almost full conversion within the first 2 h of batch start‐up was achieved (phase 1). A decrease of l/b ratio at high conversion, caused by hydroformylation of internal olefins, can once again be observed. During the transition between batch and continuous mode (phases 2 and 3), this effect disappears because of the addition of fresh 1‐octene, which is only partially converted during continuous operation. In this experiment, the miniplant was operated for a total of 53 h without the addition of catalyst or ligand; a total turnover number (total moles of aldehydes produced by one mole of catalyst, TTON) of 68419 was achieved. By adding a water make‐up stream, near steady‐state operation with the model substrate was achieved. After 30 h, the catalyst phase started to lose color, indicating the loss of catalyst, which is commonly caused by minor oxygen content or peroxides [42] in the substrate, resulting in continuous deactivation of the ligand. This is also observable in increased rhodium leaching after 30 h.
Figure 10.
Continuous‐flow experiment with increased temperature and pressure. Conditions: cRh=0.5 mol , cTPPTS=5 mol , T=120 °C, p=10 MPa, pH=5.5, ϕorg=0.6, n=2000 min−1 , VR=115 mL, VF=35 mL h−1. Leaching: ICP‐MS.
The displayed leaching values were obtained in more sensitive ICP‐MS measurements.
If TPPTS is oxidized and loses its coordination abilities, the catalyst species shifts towards carbonyl complexes. These are highly active but no longer immobilized in the aqueous phase. Between hours 30 to 45, increased activity was observable (Figure 10). This was most probably caused by carbonyl complexes which operated in the organic phase before leaching out of the system. In a potential production process, this could be avoided by feeding additional TPPTS to the reaction, potentially with the already present water feed.
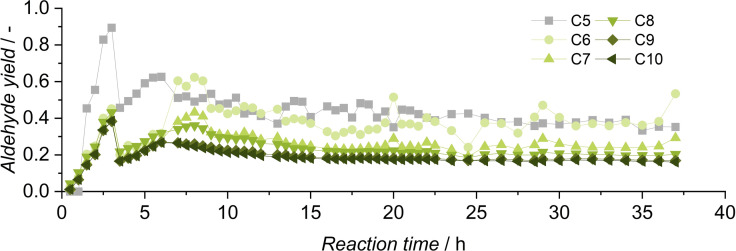
After investigating the stability of the catalyst in continuous operation with the model substrate, the pilot plant was operated with a C5‐C10 FT cut containing olefins (Figure 11). Because of the already existent complexity of the FT feed stream consisting of twelve components and the additional formation of at least twelve different aldehydes, 100 °C reaction temperature was chosen for the continuous operation with the FT product mixture.
Figure 11.
Continuous‐flow experiment with olefin cut as substrate. Conditions: cRh=0.5 mol , cTPPTS=5 mol , T=100 °C, p=10 MPa, pH=5.5, ϕorg=0.6, n=2000 min−1 , VR=115 mL, VF=25 mL h−1.
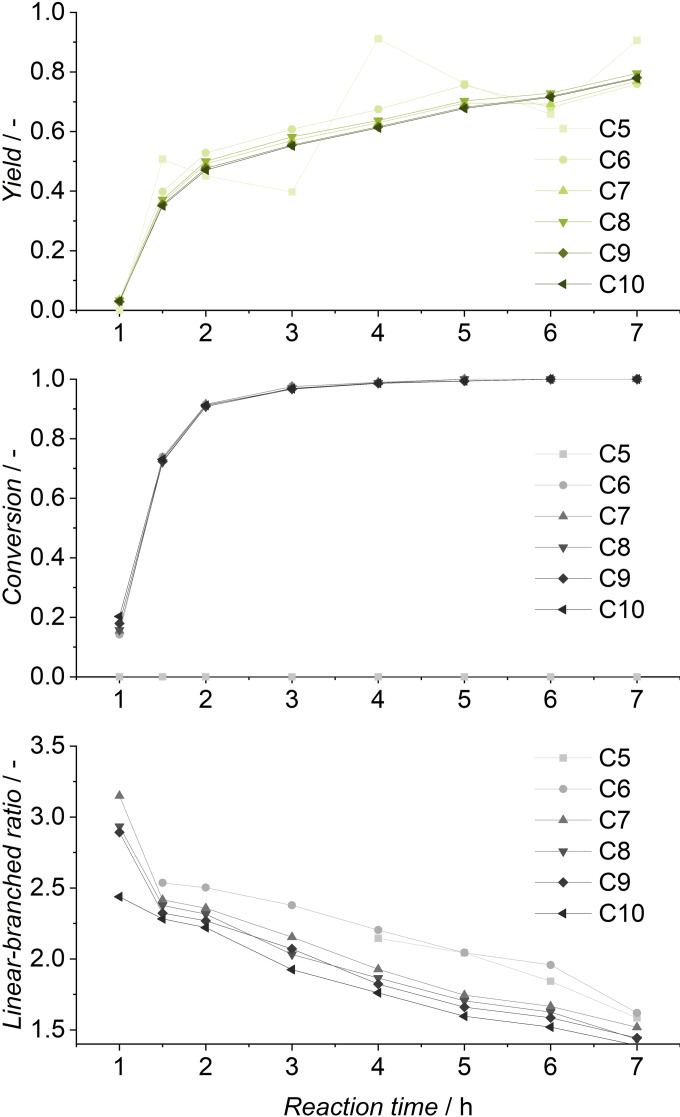
In this experiment, once again successful conversion of all olefins in continuous operation was achieved. Because of a decreased olefin content compared to the model substrate, aldehyde yields are lower, reaching 20 % in steady state. A total miniplant operation of 37 h resulted in a TTON of 23679. The miniplant was in steady state for over 20 h of continuous‐flow operation, which demonstrates the stability of the catalyst during operation with the FT cut. To investigate the possibility of increased yields by longer reaction times, a yield‐time experiment was conducted. During this experiment, aldehyde yields of 78 % were reached after 7 h (Figure 12). The reaction reaches over 90 % conversion after 2 h, but at this point, only 50 % aldehyde yield was observed.
Figure 12.
Yield, conversion, and l/b‐ratio of FT mixture yield‐time experiment. Conditions: cRh=0.5 mol , cTPPTS=5 mol , T=100 °C, p=10 MPa, pH=5.5, ϕorg=0.6, n=1725 min−1, VR=100 mL.
In the following, the reaction rate decreases because the 1‐octene concentration in the reaction mixture is low, resulting in the hydroformylation of internal olefins, as indicated by a decreasing linear‐branched ratio. Even at >99 % conversion, the reaction continues to form further aldehydes, so with increased reaction time, even quantitative aldehyde yields could be achievable.
Continuously operated hydrogenation
Ultimately, the proposed fuel additives are alcohols. To avoid any residual olefins and aldehydes, quantitative hydrogenation of all C=C and C=O bonds in the mixture is necessary. Since a non‐chemoselective hydrogenation is possible with established heterogeneous catalysts, a Raney‐Nickel‐type catalyst was used. To prove the feasibility for a fuel production process, the experiments were carried out using a continuous‐flow setup as well. A detailed description of the used equipment and catalyst can be found in the Supporting Information.
The product from continuous hydroformylation experiments has been used without any intermediate purification in order to simulate a direct feed from the hydroformylation step to the hydrogenation reactor. Furthermore, the same catalyst cartridge has been used over 10 h in multiple experiments, which indicates the stability of the hydrogenation.
Preliminary experiments at 50 °C and a weight‐hourly‐space‐velocity (WHSV) of 26.6 h−1 resulted in only partial hydrogenation of leftover olefins (1‐octene and various isomers) and aldehydes. As it would be expected, the hydrogenation of the olefin double bond occurs faster compared to the carbonyl moiety reduction (Table 3). After increasing the temperature to 100 °C and halving the feed volume flow (WHSV=13.3 h−1), all olefins and aldehydes were converted for all carbon chain lengths, demonstrating the feasibility of the chosen approach. After hydrogenation, the mixture only contains only C6‐C11 alcohols and the already present C5‐C10 paraffins, now allowing for product separation, leading to the desired alcohol mixture for potential fuel additives. [43]
Table 3.
Experimental hydrogenation results.
|
T [°C] |
WHSV[a] [h−1] |
Yield C=C reduction |
Yield C=O reduction |
|---|---|---|---|
|
50 |
26.6 |
0.6 |
0.3 |
|
100 |
13.3 |
>0.99 |
>0.99 |
[a] WHSV=m Feed [mg h−1]/m catalyst [mg].
Conclusion
In this work, we determined reaction conditions for the hydroformylation and hydrogenation of Fischer‐Tropsch (FT)‐derived olefin‐paraffin mixtures. With this kind of substrate, the main challenge is represented by achieving high once‐through conversion of olefins to aldehydes. Since separation of unconverted substrates is either impossible for wide chain length distributions or at least requires energy‐intensive processes, recycling the substrate is not feasible.
At 120 °C, high reaction rates for both hydroformylation and isomerization were observed; high pressures of 10 MPa led to increased selectivity by suppressing the isomerization. The combination of these reaction parameters resulted in up to 60 % aldehyde yield in 90 min of reaction time. Furthermore, by investigating catalyst and ligand concentration as well as the effect of different organic phase fractions, insights on the reaction and catalyst behavior have been gained, further supporting the assumption of film reactivity.
After optimizing all mentioned parameters with a surrogate substrate, an actual FT cut was applied in batch reactions and continuous operation. Olefins of different carbon chain lengths from C5 to C10 have been successfully converted to aldehydes in a single reaction. By operating a miniplant for up to 57 h without the addition of catalyst or ligand, the process was proven robust and stable. The applied liquid‐liquid biphasic recycling technique led to low rhodium leaching values of <2 ppm.
The reaction mixtures produced in hydroformylation experiments, consisting of aldehydes, olefins, and paraffins, were successfully converted to an alcohol‐paraffin‐mixture by continuous‐flow hydrogenation.
Hence, the hydroformylation and subsequent hydrogenation of olefin cuts represents a promising route for upgrading bio‐syngas‐derived fuels with alcohols. These investigations showed further optimization potential in increasing the olefin share of the substrate, which will lead to increased reactions rates and a higher alcohol content of the final product.
Experimental Section
Chemicals
1‐octene (99+%), 1‐heptanol (98 %), and [Rh(acac)(CO)2] (98.5 %) were obtained from Acros Organics, n‐heptane (99+%) and 2‐propanol (99+%) were acquired from Carl Roth GmbH & Co. KG. 3,3’,3’’‐Phosphanetriyltris(benzenesulfonic acid) trisodium salt (TPPTS) was kindly donated by OXEA (now OQ Chemicals GmbH) as aqueous solution, which was evaporated to dryness (98 %, obtained by 31P NMR spectroscopy). Ultrapure water was prepared by a Merck Milli‐Q® IQ purification system (TOC<3 ppb, conductivity <0.055 μS cm−1). Carbon monoxide (99.997 %) and hydrogen (99.999 %) were obtained from Westfalen AG. The FT mixture used was produced in experiments in context of the REDIFUEL project by VTT Technical Research Centre of Finland Ltd using a cobalt‐based FT catalyst designed at the Spanish Research Council to achieve high selectivities to C5‐C10 liquid α‐olefins. Distillation to separate the C5‐C10 fraction was carried out by Neste Oy.
Experimental procedure
The potential oxygen content of 1‐octene, n‐heptane, and Milli‐Q water was removed by purging with argon before use. In hydrogenation experiments, the miniplant product was used without any additional purification. All liquid components were weighed using standard Schlenk technique. The catalyst precursor [Rh(acac)(CO)2] and TPPTS were prepared in an oxygen‐ and water‐free glovebox and then dissolved in Milli‐Q water by stirring for 1 h. The reactor was then filled with the catalyst and substrate solutions under argon counterflow with a syringe. Subsequently, the reactor was closed and pressurized with carbon monoxide and hydrogen before it was electrically heated to reaction temperature. During heating, a stirring rate of 100 min−1 was applied to allow for sufficient heat transfer. When reaction temperature was reached, the stirring rate was increased to 1725 (batch) or 2000 min−1 (miniplant) to start the reaction. The miniplant has been filled using the same procedure. By purging the miniplant with argon three times before any experiment, minimal oxygen contamination was assured. At the beginning of any continuous flow experiment, the reactor has been operated in batch mode for 3 h, followed by a loop operation of reactor and decanter for another 3 h. Subsequently, the feed pumps were started and the product outlet was opened to a collection vessel.
Experimental setup
Batch experiments have been conducted using a Parr Instruments 4560 high‐pressure stainless‐steel autoclave in conjunction with a Parr Instruments 4848 Controller for temperature and stirring speed control. A vessel with a net volume of 300 mL with an electrical heating jacket and a 4‐Pitched‐Blade agitator have been used in all experiments. Continuous experiments have been performed using a miniplant setup. The reactor is similar to the one used in the batch experiments with one major modification: a custom‐made 250 mL reaction vessel from Parr Instruments, with a window to observe changes in phase behavior and liquid levels as well as the color of the catalyst phase. A more detailed description of the miniplant can be found in the Supporting Information. Hydrogenation was conducted with a H‐Cube hydrogen generator and control unit as well as a Phoenix Flow Reactor equipped with Raney‐Nickel‐type catalyst, all supplied by ThalesNano. A detailed description of the equipment is supplied in the Supporting Information.
Analytics
Yields were determined by GC. A Shimadzu Nexis GC‐2030 GC with flame‐ionization detector (FID) was used. Samples were injected to the GC via a Shimadzu AOC‐20iPlus injection system in connection with a Shimadzu AOC‐20sPlus Autosampler. A Restek Corp. RTX‐1 polysiloxane column with 30 m length, 0.25 mm internal diameter, and 0.5 μm film thickness was used for separation with hydrogen as carrier gas. For analysis, 1‐heptanol (25 mg) as internal standard was added to withdrawn reaction samples (175 mg). These sample have been further diluted with 2‐propanol (800 mg) before analysis. ICP‐OES measurements were conducted using a PlasmaQuant PQ9000 Elite manufactured by Analytik Jena, ICP‐MS measurements were conducted using a Shimadzu ICPMS‐2030. Digestions were carried out with a CEM Corp. Mars 6.
Conflict of interest
The authors declare no conflict of interest.
Supporting information
As a service to our authors and readers, this journal provides supporting information supplied by the authors. Such materials are peer reviewed and may be re‐organized for online delivery, but are not copy‐edited or typeset. Technical support issues arising from supporting information (other than missing files) should be addressed to the authors.
Supporting Information
Acknowledgements
The project Robust and Efficient processes and technologies for Drop In renewable FUELs for road transport (REDIFUEL) has received funding from the European Union's Horizon 2020 research and innovation programme under Grant Agreement no. 817612. Open Access funding enabled and organized by Projekt DEAL.
S. Püschel, S. Störtte, J. Topphoff, A. J. Vorholt, W. Leitner, ChemSusChem 2021, 14, 5226.
References
- 1. Leitner W., Klankermayer J., Pischinger S., Pitsch H., Kohse-Höinghaus K., Angew. Chem. Int. Ed. 2017, 56, 5412–5452; [DOI] [PubMed] [Google Scholar]; Angew. Chem. 2017, 129, 5500–5544. [Google Scholar]
- 2. Janssen A. J., Kremer F. W., Baron J. H., Muether M., Pischinger S., Klankermayer J., Energy Fuels 2011, 25, 4734–4744. [Google Scholar]
- 3. García A., Monsalve-Serrano J., Villalta D., Zubel M., Pischinger S., Energy Convers. Manage. 2018, 177, 563–571. [Google Scholar]
- 4. Hellier P., Talibi M., Eveleigh A., Ladommatos N., Proc. Inst. Mech. Eng. Part D 2018, 232, 90–105. [Google Scholar]
- 5. Choudhury H. A., Intikhab S., Kalakul S., Khan M., Tafreshi R., Gani R., Elbashir N. O., Energy Fuels 2017, 31, 11266–11279. [Google Scholar]
- 6. Graziano B., Kremer F., Pischinger S., Heufer K. A., Rohs H., SAE Int. J. Fuels Lubr. 2015, 8, 62–79. [Google Scholar]
- 7. Rauch R., Hrbek J., Hofbauer H., Wiley Interdiscip. Rev.: Energy Environ. 2014, 3, 343–362. [Google Scholar]
- 8. de Klerk A., Energy Environ. Sci. 2011, 1177–1205. [Google Scholar]
- 9. Hyun Chun D., Bae Rhim G., Hye Youn M., Deviana D., Eun Lee J., Chan Park J., Jeong H., Top. Catal. 2020, 63, 793–809. [Google Scholar]
- 10. Duyckaerts N., Bartsch M., Trotuş I. T., Pfänder N., Lorke A., Schüth F., Prieto G., Angew. Chem. Int. Ed. 2017, 56, 11480–11484; [DOI] [PubMed] [Google Scholar]; Angew. Chem. 2017, 129, 11638–11642. [Google Scholar]
- 11. Jeske K., Kizilkaya A. C., López-Luque I., Pfänder N., Bartsch M., Concepción P., Prieto G., ACS Catal. 2021, 4784–4798. [DOI] [PMC free article] [PubMed] [Google Scholar]
- 12. Kerschgens B., Cai L., Pitsch H., Heuser B., Pischinger S., Combust. Flame 2016, 163, 66–78. [Google Scholar]
- 13. Cai L., Uygun Y., Togbé C., Pitsch H., Olivier H., Dagaut P., Sarathy S. M., Proc. Combust. Inst. 2015, 35, 419–427. [Google Scholar]
- 14. Graziano B., Schönfeld S., Heuser B., Pelerin D., ATZheavy duty worldwide 2020, 13, 36–41. [Google Scholar]
- 15. Zubel M., Bhardwaj O. P., Heuser B., Holderbaum B., Doerr S., Nuottimäki J., SAE Int. J. Fuels Lubr. 2016, 9, 481–492. [Google Scholar]
- 16. Torres G. M., Frauenlob R., Franke R., Börner A., Catal. Sci. Technol. 2015, 5, 34–54. [Google Scholar]
- 17. Diebolt O., Müller C., Vogt D., Catal. Sci. Technol. 2012, 2, 773–777. [Google Scholar]
- 18. Franke R., Selent D., Börner A., Chem. Rev. 2012, 112, 5675–5732. [DOI] [PubMed] [Google Scholar]
- 19. Cornils B., Kuntz E. G., J. Organomet. Chem. 1995, 502, 177–186. [Google Scholar]
- 20. Kohlpaintner C. W., Fischer R. W., Cornils B., Appl. Catal. A 2001, 221, 219–225. [Google Scholar]
- 21. Beller M., Cornils B., Frohning C. D., Kohlpaintner C. W., J. Mol. Catal. A 1995, 104, 17–85. [Google Scholar]
- 22. Matsinha L. C., Siangwata S., Smith G. S., Makhubela B. C. E., Catal. Rev. Sci. Eng. 2018, 61, 111–133. [Google Scholar]
- 23. Warmeling H., Hafki D., von Söhnen T., Vorholt A. J., Chem. Eng. J. 2017, 326, 298–307. [Google Scholar]
- 24. Warmeling H., Koske R., Vorholt A. J., Chem. Eng. Technol. 2017, 40, 186–195. [Google Scholar]
- 25. Jörke A., Gaide T., Behr A., Vorholt A., Seidel-Morgenstern A., Hamel C., Chem. Eng. J. 2017, 313, 382–397. [Google Scholar]
- 26. Priske M., Wiese K. D., Drews A., Kraume M., Baumgarten G., J. Membr. Sci. 2010, 360, 77–83. [Google Scholar]
- 27. Rösler T., Faßbach T. A., Schrimpf M., Vorholt A. J., Leitner W., Ind. Eng. Chem. Res. 2018, 58, 2421–2436. [Google Scholar]
- 28. Sharma S. K., Jasra R. V., Catal. Today 2015, 247, 70–81. [Google Scholar]
- 29. Wei J. Z., Lang J. W., Fu H. Y., Li R. X., Zheng X. L., Yuan M. L., Chen H., Transition Met. Chem. 2016, 41, 599–603. [Google Scholar]
- 30. Pospech J., Fleischer I., Franke R., Buchholz S., Beller M., Angew. Chem. Int. Ed. 2013, 52, 2852–2872; [DOI] [PubMed] [Google Scholar]; Angew. Chem. 2013, 125, 2922–2944. [Google Scholar]
- 31. Kämper A., Kucmierczyk P., Seidensticker T., Vorholt A. J., Franke R., Behr A., Catal. Sci. Technol. 2016, 6, 8072–8079. [Google Scholar]
- 32. Warmeling H., Janz D., Peters M., Vorholt A. J., Chem. Eng. J. 2017, 330, 585–595. [Google Scholar]
- 33. Bahrmann H., Bogdanovic S., van Leeuwen P. W. N. M., in Aqueous-Phase Organometallic Catalysis, Wiley-VCH, Weinheim, 2004, pp. 391–409. [Google Scholar]
- 34. Purwanto, Deshpande R. M., Chaudhari R. V., Delmas H., J. Chem. Eng. Data 1996, 41, 1414–1417. [Google Scholar]
- 35.A. Börner, R. Franke, Hydroformylation, Wiley-VCH, Weinheim, 2016.
- 36. Warmeling H., Schneider A. C., Vorholt A. J., AIChE J. 2018, 64, 161–171. [Google Scholar]
- 37.D. G. Shaw in Solubility Data Series, International Union Of Pure and Applied Chemistry, 1989.
- 38.D. G. Shaw in Solubility Data Series, International Union Of Pure and Applied Chemistry, 1989.
- 39. Warmeling H., Behr A., Vorholt A. J., Chem. Eng. Sci. 2016, 149, 229–248. [Google Scholar]
- 40. Hentschel B., Kiedorf G., Gerlach M., Hamel C., Seidel-Morgenstern A., Freund H., Sundmacher K., Ind. Eng. Chem. Res. 2015, 54, 1755–1765. [Google Scholar]
- 41. Deshpande R. M., Purwanto, Delmas H., Chaudhari R. V., Ind. Eng. Chem. Res. 1996, 35, 3927–3933. [Google Scholar]
- 42. Gerlach M., Abdul Wajid D., Hilfert L., Edelmann F. T., Seidel-Morgenstern A., Hamel C., Catal. Sci. Technol. 2017, 7, 1465–1469. [Google Scholar]
- 43.B. Heuser, A. Vorholt, G. Prieto, B. Graziano, S. Schönfeld, M. Messagie, G. Cardellini, S. Tuomi, N. Sittinger, R. Hermanns, S. Ramawamy, C. Kanth Kosuru, H. Hoffmann, L. Schulz, J. Yadav, M. Weide, T. Schnorbus. Transport Research Arena 2020, Helskini, Finland, 2020.
Associated Data
This section collects any data citations, data availability statements, or supplementary materials included in this article.
Supplementary Materials
As a service to our authors and readers, this journal provides supporting information supplied by the authors. Such materials are peer reviewed and may be re‐organized for online delivery, but are not copy‐edited or typeset. Technical support issues arising from supporting information (other than missing files) should be addressed to the authors.
Supporting Information


