

Abstract
Purpose
To estimate repeatability and inter‐observer variation of choroidal thickness measurements in myopic Danish children aged 7–14 years using swept‐source optical coherence tomography (SS‐OCT).
Methods
Thirty‐nine children were enrolled. Optical correction was single‐vision spectacles (SVS) or orthokeratology lenses (OKL). Three repeated 7 × 7 mm 3‐dimensional SS‐OCT macula scans and three repeated 9 mm SS‐OCT line scans were collected for each child using a DRI OCT Triton. Choroidal thickness was measured using three different methods: line scan method 1 (LM1), line scan method 2 (LM2) and 3D macula scan method (3DM). Segmentation was adjusted if needed. Coefficients of repeatability (CR) and limits of agreement (LoA) were calculated.
Results
The CRs ranged from 13.4 to 23.9 µm, 14.5 to 26.2 µm and 5.2 to 10.7 µm for LM1, LM2 and 3DM, respectively. The LoA ranged from −22.9 to +31.5 µm, −23.3 to +32.2 µm and −10.2 to +12.4 µm for LM1, LM2 and 3DM, respectively. Segmentation was adjusted in most scans (63%–92%). Mean choroidal thickness ranged from 142.2 ± 47.2 to 253.8 ± 60.9 µm and 190.1 ± 64.0 to 299.0 ± 55.8 µm for the SVS and OKL groups, respectively, measured by 3DM.
Conclusion
The 3DM was the most repeatable method in this paediatric population. It yielded a CR of 10.7 µm, confidence interval 2.4 µm, which makes the minimal detectable difference between two measurements 13.1 µm. Most inter‐observer variation could be explained by the intramethod variation. Segmentation adjustment on 3D macula scans did not increase CR on a group level.
Keywords: choroidal thickness, interrater variation, measurement variation, minimal detectable change, myopia, orthokeratology lenses, repeatability, reproducibility of results, swept‐source optical coherence tomography
Introduction
The world has seen a dramatic increase in myopia. If the trend continues, the worldwide prevalence is expected to reach 50% in 2050. This may lead to an increase in retinal detachment, glaucoma and other diseases associated with high myopia (Holden et al. 2016). Several interventions have been proven to slow the progression of myopia, the most promising being atropine eyedrops and orthokeratology lenses (OKL) (Prousali et al. 2019). Both treatments have shown to increase choroidal thickness by 25 µm after one week for atropine eyedrops and 16 µm after 1 month for OKL (Zhang et al. 2016; Li et al. 2018). In OKL studies, short‐term changes in choroidal thickness have been associated with long‐term changes in axial length (Li et al. 2018). Thus, short‐term changes in choroidal thickness are expected to be a predictor of the treatment efficacy of OKL.
Swept‐source optical coherence tomography (SS‐OCT) scanners have improved visualization of the posterior choroidal boundary, the choroidal–scleral interface (CSI) (Copete et al. 2014). Assessment of longitudinal changes in choroidal thickness poses some difficulties. Firstly, the choroidal thickness is altered by several external factors including physical activity (Sayin et al. 2015), optical blur (Sander et al. 2018), light intensity (Read et al. 2018) and diurnal variation (Zhao et al. 2016; Ulaganathan et al. 2019). Secondly, differentiating between measurement inaccuracies and statistically significant changes in choroidal thickness poses a challenge. The purpose of this study was to address the latter by examining repeatability and inter‐observer variation in a myopic Danish population of children aged 7–14 years. To the best of our knowledge, this is the first study to address the repeatability of choroidal thickness measurements in myopic children using SS‐OCT.
Methods and materials
This study is a sub‐study of the CONTROL study, a randomized 18‐month controlled clinical trial investigating the effect of OKL in preventing myopia progression in Danish children aged 6–12 years. The study has been approved by the Regional Committee on Health Research Ethics and adheres to the tenets of the declaration of Helsinki. The parents of all study subjects signed consent forms during the inclusion process. This sub‐study is a prospective, cross‐sectional, observational study.
Patient inclusion
A total of 60 children were enrolled in the CONTROL study, of which 39 children participated in this study: 17 children from the intervention group (nightly wear of OKL, (Dreamlite®, Procornea, Netherlands)) and 22 children from the control group (single‐vision spectacles). Children completing the 12‐ or 18‐month follow‐up visit in the data collection period were eligible for inclusion. Optical coherence tomography (OCT) scans were made at these follow‐up visits; no baseline OCT data were collected. Therefore, the children were between 7 and 14 years old at the time of the scan. Optical coherence tomography (OCT) scans were obtained between 12 November 2018 and 10 April 2019. All children had low‐to‐moderate myopia.
Scan protocol
The subject’s right eye was scanned by either one of two experienced technicians or by one of the authors (TMJ). All scans were made without cycloplegia on the same device, a DRI OCT Triton (Topcon Inc., Japan) capable of 100 000 A‐scans pr. second with an in‐depth optical resolution of 8 µm and digital resolution of 2.6 µm, using a 1050 nm swept source. Three repeated 9 mm line scans centred on the fovea and using the follow‐up function and three repeated 7 × 7 mm 3D macula scans centred at the fovea using the eye tracking and follow‐up function were collected. In order to control for external factors influencing choroidal thickness prior to the scan, physical activity was limited to walking between examination rooms and the three consecutive scans were performed within 3 min. The scans were obtained under ambient lightning, 5–20 Lux (Metrux 2, Metrawatt, Nürnberg, Germany). Depending on age and patient cooperation, some children kept their eyes focused between scans and some refocused between scans.
The Early Treatment of Diabetic Retinopathy Study (ETDRS) grid was used as an overlay on the 3D macula scans. Acceptable quality was an image quality > 60 for 3D macula scans and >96 for line scans, no missing frames, no missing frames and a correct scan controlled by evaluating the placement on the fundus photograph.
Scan measurement
Repeatability
Choroidal thickness was measured three times using three different methods in order to assess which method showed least variance between three repeated scans. Two methods were chosen for the line scans, and one method was chosen for the 3D macula (3DM) scans. Repeatability was calculated as a coefficient of repeatability.
Inter‐observer variation
Measurements were independently made by two inexperienced medical students (AA and BSS) after thorough instruction by TMJ. These measurements were compared to examine inter‐observer variation, which was calculated as limits of agreement.
All scans were analysed in the proprietary IMAGEnet 6 software v. 1.22.1.14101 (Topcon Inc., Japan). The OCT scans were analysed in order of collection. The auto segmentation feature in IMAGEnet was used to delimit Bruch’s membrane (BM) and the CSI. The segmentation was adjusted using the modify layer function to match the perceived anatomical boundary. The CSI was defined as the hyperreflective line on the boundary between the choroid and sclera, and BM was defined as the hyperreflective layer on the outer retinal boundary (Huynh et al. 2017). In cases of doubt about the segmentation, TMJ was consulted for a second opinion.
Line scan method 1 (LM1) used the automatic measurement between the two segmentation lines (BM and CSI) made by the IMAGEnet software. This measurement is perpendicular to the plane of the scan and does not necessarily measure the shortest distance from BM to CSI (Fig. 1).
Fig. 1.
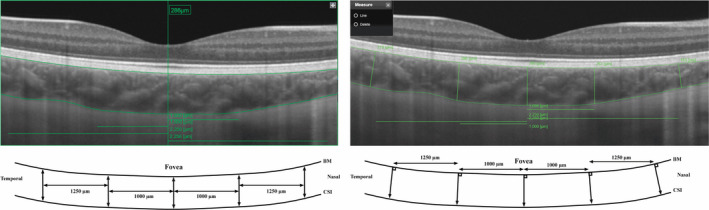
Left: Line scan method 1 with an example of a measurement of fovea. Right: Line scan method 2. BM = Bruch’s membrane, CSI = choroidal–scleral interface.
In line scan method 2 (LM2), the caliper function was used to measure the distance from BM to the CSI perpendicularly to BM (Fig. 1). In both line scan methods, choroidal thickness measurements were made at five different locations (Fig. 1): at the fovea, 1000 µm nasally and temporally from the fovea and at 2250 µm nasally and temporally from the fovea. These locations were chosen to correspond to the centre of the horizontal subfields in the ETDRS grid. Fovea was defined as the deepest point in the central indentation.
The 3DM scans were processed by IMAGEnet to estimate the thickness between the BM and the CSI. An average thickness reading for each of the nine subfields in the ETDRS grid was provided. 3DM choroidal thickness data sets were collected by registering the measurement made by the IMAGEnet software before altering the segmentation. Subsequently, the 3DM scan segmentation was adjusted to match perceived anatomical boundaries. These data were registered for observers AA and BSS, giving a total of three data sets for 3DM: 1. IMAGEnet, 2. AA and 3. BSS.
Statistics
Excel v. 16.24 (Microsoft, WA) and SigmaPlot v. 14 (Systat Software Inc., CA) were used in the statistical analysis. Data were handled as suggested by Bland and Altman (Bland & Altman 2007).
The SVS and OKL groups were pooled for statistical analysis of repeatability and inter‐observer variation.
Repeatability
In brief, to assess independence of the magnitude of the measurements and their differences, the standard deviation of the three repeated measurements for each child was plotted against the mean. This procedure was repeated for every scan location. If a correlation between the mean and standard deviation was suspected, it was tested using Spearman’s rank order test. If a significant correlation was present (Spearman’s test p‐value of <0.05), data were logarithmically transformed in order to eliminate the correlation.
For each method: LM1, LM2 and 3DM, the repeatability for the three repeated scans was assessed using repeatability coefficients, also known as coefficient of repeatability (CR). Coefficient of repeatability (CRs) were calculated as 1.96*sqrt(2)*Sw where Sw was the within‐subject standard deviation. Sw was calculated as the square root of the mean of within‐subject variance. Coefficient of repeatability (CR) describes the interval in which 95% of the differences within subjects is found.
A confidence interval for CR is calculated as 1.96*sqrt(2)*CI of Sw as described by Bartlett and Frost (Bartlett & Frost 2008). A confidence interval for Sw was calculated as Sw/sqrt(2n(m‐1)), where n is the number of subjects, and m is the number of repeated measurements (Bland & Altman 1996).
Inter‐observer variation
To assess the inter‐observer variation, for each of the three methods: LM1, LM2 and 3DM, the correlation between the magnitude of measurements and difference between measurements was examined by plotting the difference against the mean, a so‐called Bland‐Altman plot. For LM1 and LM2, the observers AA and BSS were compared; for 3DM, AA, BSS and IMAGEnet were compared. Ninety‐five per cent limits of agreement (LoA) were calculated using the equal number of replicates method of Bland and Altman (Bland & Altman 2007). In brief, this method involves calculating an adjusted variance of differences using the unadjusted variance of differences and the within‐subject variance of both methods. The advantage of this method is that it allows for a larger measurement error. The LoA calculated by the equal number of replicates method provides information about the expected limits for a single measurement. The LoA is calculated as mean difference ± 1.96 * the adjusted standard deviation of differences. The LoA, therefore, describes the interval in which 95% of all differences will be found.
Confidence intervals for the LoA were calculated as 1.96 * s.e. of the differences.
To test the mean difference between three consecutive scans made by the same observer at different anatomical locations, repeated measures analysis of variance (ANOVA) or repeated measures ANOVA on ranks (depending on normality) was used. When significant to the 5% level, pairwise comparison was made by Tukey’s test or Dunn’s method depending on normality.
Results
Characteristics of the study population are presented in Table 1. One child was excluded from the line scan analysis because of an incorrect scan area on the fundus photograph but was included in the 3DM analysis. Two children were excluded from the 3DM analysis, one due to a blink on the 3DM scan and the other because of lost focus leading to only two 3DM scans. Both were included in the line scan analysis, leaving a total of 38 children in the line scan analysis (LM1 and LM2) and 37 in the 3DM analysis. Mean time from first to last scan in a given child in a given series was 1 min and 11 seconds (standard deviation ± 28 seconds). All scans were performed between 8 am and 12 noon.
Table 1.
Characteristics of the study sample.
| Visual correction, OKL/SVS | 17/22 |
| BCVA, ETDRS letters ± SD (Snellen’s ratio) | 84.5 ± 3.07 (20/20) |
| Gender, Male/Female | 14/25 |
| Refractive error, D (autorefraction in cycloplegia), sph eq ± SD* | −2.73 ± 1.39 |
| Axial length, mm ± SD | 24.41 ± 0.72 |
| Age, years at time of scan, median (25th percentile;75th percentile) | 11.49 (10.32;12.99) |
BCVA = Best corrected visual acuity, D = dioptre, ETDRS = Early Treatment Diabetic Retinopathy Study, OKL = orthokeratology lenses, SD = standard deviation, shp eq = spherical equivalent, SVS = single vision spectacles.
Refractive error for the control group is measured at time of scan. Refractive error for the OKL group, is the shp eq. measured at baseline plus any added spherical power in the lens design.
No data were in need of log‐transformation, and the repeatabilities are based on absolute thickness measurements.
Segmentation error
Assessment of the automatic segmentation revealed inaccuracies in most scans (Fig. 2). The segmentation was adjusted on 72 of the 114 line scans (63%) (AA) and 89 of the 114 line scans (78%) (BSS). The segmentation was adjusted on 104 of 114 3DM scans (91%) (AA) and 105 of 114 3DM scans (92%) (BSS).
Fig. 2.
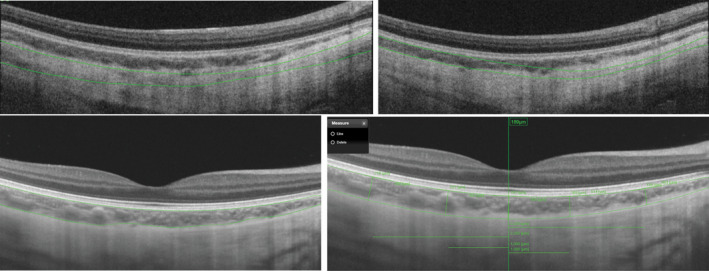
Top: 3D macula scans with automatic segmentation inaccuracies. Bottom left: Line scan with automatic segmentation inaccuracies. Bottom right: Line scans with adjusted segmentation (AA).
Repeatability
The CRs for the three methods are shown in Fig. 3. The CRs of LM1 and LM2 ranged from 13.4 µm to 23.9 µm and from 14.5 µm to 26.2 µm, respectively. Observer BSS had a lower CR than AA. Coefficient of repeatability (CR) was lowest nasally for the 3DM, while the CR for the line scan methods was without a clear trend. The CR of the 3DM scans ranged from 5.2 µm to 10.7 µm (Fig. 3). IMAGEnet consistently had the smallest CR.
Fig. 3.
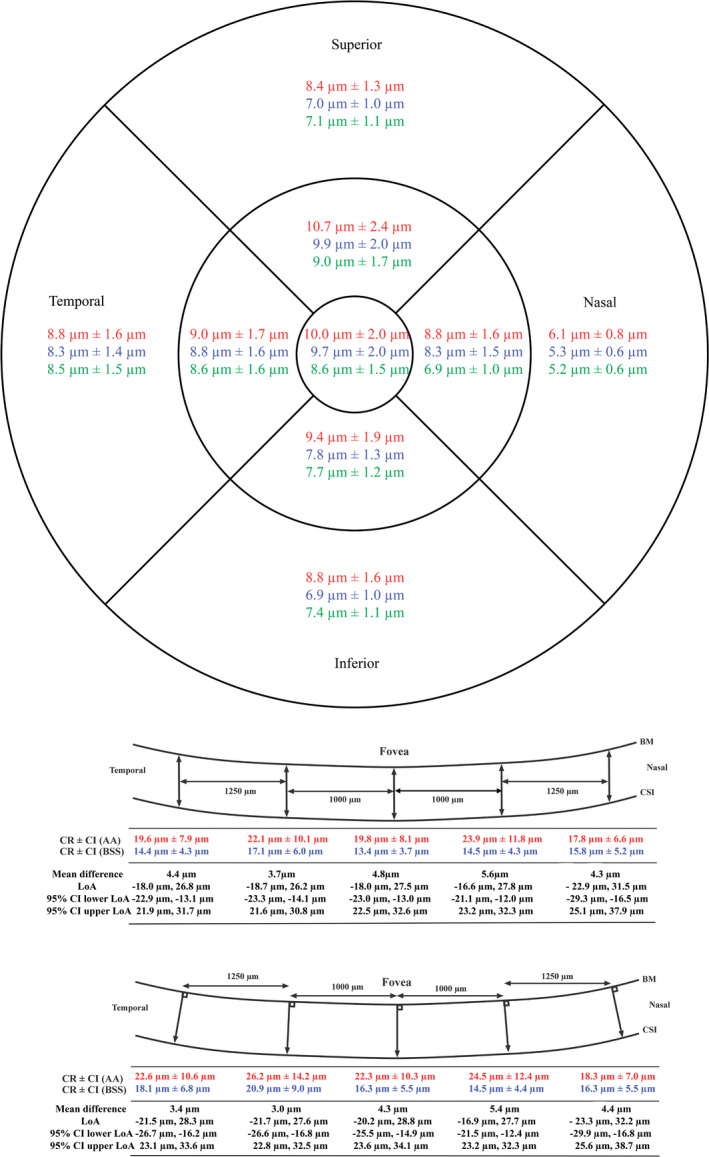
Coefficient of repeatability (CR) ±95% confidence interval (CI) for the three methods. For LM1 and LM2 are also shown mean difference of choroidal thickness measurements between AA and BSS, limits of agreement (LoA), and confidence interval for the LoA. Top: 3DM. Middle: LM1. Bottom: LM2. Red: observer AA. Blue: observer BSS. Green: IMAGEnet. BM = Bruch’s membrane, CSI = choroidal–scleral interface.
Inter‐observer variation
LM1 and LM2 presented a mean difference ranging from 3.7 to 5.6 µm and from 3.0 to 5.4 µm, respectively. The LoA ranged from −22.9 µm to +31.5 µm in LM1 and from −23.3 µm to +32.2 µm in LM2 (Fig. 3). 3DM had a mean difference of 0 µm to 2.0 µm. The LoA ranged from −10.2 µm to +12.4 µm (Fig. 4). Confidence intervals for LoA and CR are available in Figs 3 and 4.
Fig. 4.
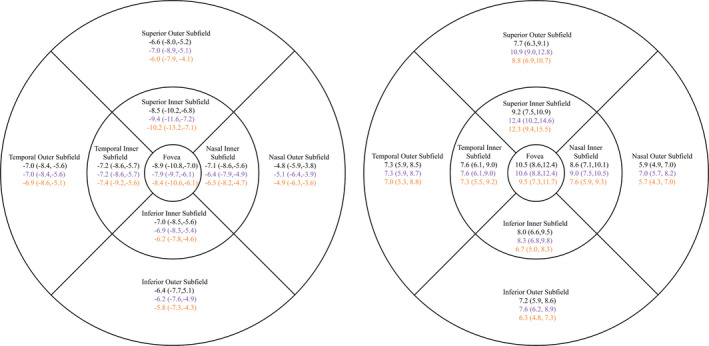
On the left: Lower limit of agreement (LoA) in 3DM (Lower CI95, upper CI95). On the right: Upper LoA (Lower CI95, upper CI95). Black is AA against BSS. Purple is AA against IMAGEnet. Yellow is BSS against IMAGEnet. All values are in µm. LoA is symmetrical around the mean difference.
For LM1 and LM2, there were no significant differences between the mean of three consecutive scans and the scan location for either observer (p ≥ 0.27, repeated measure ANOVA on ranks).
For the 3DM, differences were found for both observers and IMAGEnet only when comparing the nasal outer subfield to other subfields. For both observers and IMAGEnet, the superior inner subfield was significantly different from nasal outer subfield (p ≤ 0.046, Tukey’s test and Dunn’s Method). Further, for both observers the foveal subfield and the nasal inner subfield were significantly different from the nasal outer subfield (p ≤ 0.04, Tukey’s test). In addition, for observer BSS also the temporal inner subfield and inferior inner subfield were significantly different from the nasal outer subfield (p ≤ 0.03, Tukey’s test).
Choroidal thickness
The mean choroidal thickness and standard deviation of each subfield for the three methods are shown in Fig. 5. The choroidal thickness was thinnest nasally when any of the three scan methods was used.
Fig. 5.
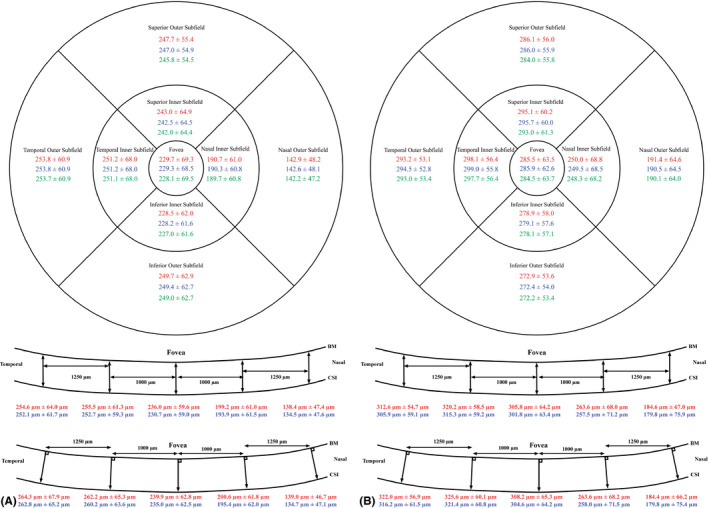
(A) Mean choroidal thickness in µm ± standard deviation in µm for the three methods. Top: 3DM. Middle: LM1. Bottom: LM2. Red: observer AA. Blue: observer BSS. Green: IMAGEnet. BM, Bruch’s membrane; CSI, choroidal–scleral interface. This is for the OKL group. (B) Mean choroidal thickness in µm ± standard deviation in µm for the three methods. Top: 3DM. Middle: LM1. Bottom: LM2. Red: observer AA. Blue: observer BSS. Green: IMAGEnet. BM = Bruch’s membrane, CSI = choroidal–scleral interface. This is for the SVS group.
Discussion
In this study, we have examined short‐term (<3 min) choroidal thickness measurement repeatability from two angles: intraindividual variation, as the coefficient of repeatability, and inter‐observer variation, as limits of agreement. This adds to the existing knowledge on choroidal thickness measurements by allowing for a distinction between measurement variation and true change. We have shown that the inter‐observer variation is low as the coefficient of repeatability accounts for almost all the data variation.
We chose to study three different methods: two line scan methods and one 3DM scan method. The 3DM had a far lower coefficient of repeatability than the line scan methods. We found a 3DM repeatability of between 5.2 and 10.7 µm. No other studies have examined CR in myopic children using a 3D scan protocol like the current study. In comparison, two studies have evaluated CR in other volumetric scans on myopic or healthy subjects. The first study was on myopic children randomly assigned to either SVS or OKL. Enhanced depth imaging OCT with a star scan consisting of six line scans radially centred at the fovea was used. They found CRs of 7.08 and 10.06 µm for SVS and OKL, respectively (Lau et al. 2019). The second study was on healthy young adults using enhanced‐depth imaging OCT centred at the fovea covering 55° × 45° containing 37 horizontal line scans. They found CRs between 2 and 13 µm (95% confidence interval 1–3 and 7–19 µm, respectively) depending on retinal location (Hoseini‐Yazdi et al., 2019b).
The two line scan methods had very similar repeatability. We found the line scan CRs to be between 13 and 26 µm. A study on healthy subjects using enhanced depth imaging OCT found line scan CRs of between 19 µm and 26 µm (Rahman et al. 2011). To our knowledge, no studies have examined the coefficient of repeatability of line scan caliper choroidal thickness measurements using SS‐OCT on myopic children or healthy individuals.
The CR found in this study can be useful when assessing changes in choroidal thickness since CR also describes the minimal detectable difference or the smallest real difference (Vaz et al. 2013). For example, in a clinical setting a child using OKL or atropine eyedrops must show a change in choroidal thickness of 13.1 µm (10.7 + 2.4 µm, see Fig. 3, inner superior field) using the 3D method to conclude a true change in thickness. However, the CR is only applicable when using the same equipment and methodology.
The improved repeatability with 3DM compared to the line scan methods could be attributed to thickness averaging across a larger area. This has previously been suggested. (Hoseini‐Yazdi et al., 2019a).
When human observers are compared to the segmentation made by the IMAGEnet software, the 3DM method revealed small differences between the parties. This raises the question of whether adjusting the segmentation on the scans is a necessary step. It seems to slightly lower the repeatability and slightly increase the thickness. Consequently, time‐consuming segmentation adjustment might not provide additional information in a clinical setting, although differences on an individual level may be difficult to evaluate as some children have had large changes in segmentation, while others have only had minor adjustments.
We chose to include children from both the OKL and the SVS group because neither modality is expected to influence the quality of the OCT scan when not worn. This hypothesis has been confirmed by a study evaluating LoA on choroidal thickness measured by SD‐OCT in myopic children between OKL and SVS subjects at 1 and 6 months after OKL treatment initiation (Li et al. 2017). They found no statistically significant difference between LoA in children using SVS compared to children using OKL.
Myopic eyes are of a slightly more prolate shape than the oblate emmetropic eyes, sometimes with the disc tilted to a substantial angle (Kim et al. 2017). Eyes with high myopia (>6 D spherical equivalent) are sometimes very irregularly shaped (Ohno‐Matsui et al. 2017). Because of these anatomical characteristics, we included the LM2 method where the choroidal thickness was measured perpendicular to BM in order to assess the true choroidal thickness. However, this method was inferior to the 3DM method. The 3DM method does not take into account the tilting of the choroid. It measures a thickness in a straight line from the laser in the OCT apparatus; accordingly, situations may occur where the choroid measurement is too large and thus fails to reflect true thickness.
For the 3DM, significant differences in the mean of the three consecutive scans were found between the nasal outer subfield and five other subfields. The nasal outer subfield is the thinnest subfield and the subfield closest to the optic nerve. These anatomical characteristics might account for the variability and caution should be taken when evaluating longitudinal changes in choroidal thickness at this specific location.
No other studies have reported SS‐OCT‐derived choroidal thickness scans in a myopic paediatric Caucasian population. We have found our data to be very comparable to older SS‐OCT and EDI‐OCT data. In a paediatric myopic Chinese population, subfoveal choroidal thickness was measured to be between 229 µm and 283 µm using SS‐OCT line scans (Xiong et al. 2017). Like other studies, we find a thicker average choroidal thickness in the OKL group than in the SVS group (Li et al. 2017; Jin et al. 2018).
The strengths of this study are the prospective inclusion of patients and the inclusion of resegmented data. The limitations are the lack of blinding of the raters and possible bias when analysing scan numbers 2 and 3 when knowing the result of the first scan. Another limitation is the lack of repeated re‐segmentation by the same observer on the same OCT scan, and as such, we do not know how large a part of the CR is due to observer‐related error.
To limit short‐term changes in choroidal thickness due to external factors, all children in our study followed the same study protocol, physical activity was limited, and illumination during the OCT scans was ambient room lightening. Further, the three consecutive scans were taken as quickly as possible after one another.
Further studies in repeatability and reproducibility should address the variation caused by manually adjusting the segmentation and the possible influence of expertise of the personnel performing the SS‐OCT scanning. Finally, data on intersession repeatability in children using SS‐OCT are needed. These studies should use blinding of the observers and should not analyse the scans in sequence.
In conclusion, we found that 3D macula scans are more repeatable than line scans when measuring choroidal thickness. We also found that the coefficient of repeatability for a 3D macula scan is 10.7 ± 2.4 µm at the least repeatable location. This number can be interpreted as a minimal detectable difference and can be used to monitor treatments that affect choroidal thickness, such as the use of orthokeratology lenses. Finally, this study reveals that adjusting the segmentation made by the IMAGEnet software does not increase repeatability on a group level.
We want to acknowledge statistician Oke Gerke for his help and excellent advice.
References
- Bartlett JW & Frost C (2008): Reliability, repeatability and reproducibility: analysis of measurement errors in continuous variables. Ultrasound Obstet Gynecol 31: 466–475. [DOI] [PubMed] [Google Scholar]
- Bland JM & Altman DG (1996): Measurement error. BMJ 312: 1654. [DOI] [PMC free article] [PubMed] [Google Scholar]
- Bland JM & Altman DG (2007): Agreement between methods of measurement with multiple observations per individual. J Biopharm Stat 17: 571–582. [DOI] [PubMed] [Google Scholar]
- Copete S, Flores‐Moreno I, Montero JA, Duker JS & Ruiz‐Moreno JM (2014): Direct comparison of spectral‐domain and swept‐source OCT in the measurement of choroidal thickness in normal eyes. Br J Ophthalmol 98: 334–338. [DOI] [PubMed] [Google Scholar]
- Holden BA, Fricke TR, Wilson DA et al. (2016): Global prevalence of myopia and high myopia and temporal trends from 2000 through 2050. Ophthalmology 123: 1036–1042. [DOI] [PubMed] [Google Scholar]
- Hoseini‐Yazdi H, Vincent SJ, Collins MJ, Read SA & Alonso‐Caneiro D (2019a): Impact of image averaging on wide‐field choroidal thickness measurements using enhanced‐depth imaging optical coherence tomography. Clin Exp Optom 102: 320–326. [DOI] [PubMed] [Google Scholar]
- Hoseini‐Yazdi H, Vincent SJ, Collins MJ, Read SA & Alonso‐Caneiro D (2019b): Repeatability of wide‐field choroidal thickness measurements using enhanced‐depth imaging optical coherence tomography. Clin Exp Optom 102: 327–334. [DOI] [PubMed] [Google Scholar]
- Huynh E, Chandrasekera E, Bukowska D, McLenachan S, Mackey DA & Chen FK (2017): Past, present, and future concepts of the choroidal scleral interface morphology on optical coherence tomography. Asia Pac J Ophthalmol (Philadelphia. Pa.) 6: 94–103. [DOI] [PubMed] [Google Scholar]
- Jin WQ, Huang SH, Jiang J, Mao XJ, Shen MX & Lian Y (2018): Short term effect of choroid thickness in the horizontal meridian detected by spectral domain optical coherence tomography in myopic children after orthokeratology. Int J Ophthalmol 11: 991–996. [DOI] [PMC free article] [PubMed] [Google Scholar]
- Kim YC, Jung Y, Park HL & Park CK (2017): The Location of the Deepest Point of the Eyeball Determines the Optic Disc Configuration. Sci Rep 7: 5881. [DOI] [PMC free article] [PubMed] [Google Scholar]
- Lau JK, Cheung SW, Collins MJ & Cho P (2019): Repeatability of choroidal thickness measurements with Spectralis OCT images. BMJ Open Ophthalmol 4: e000237. [DOI] [PMC free article] [PubMed] [Google Scholar]
- Li Z, Cui D, Hu Y, Ao S, Zeng J & Yang X (2017): Choroidal thickness and axial length changes in myopic children treated with orthokeratology. Contact Lens Anterior Eye 40: 417–423. [DOI] [PubMed] [Google Scholar]
- Li Z, Hu Y, Cui D, Long W, He M & Yang X (2018): Change in subfoveal choroidal thickness secondary to orthokeratology and its cessation: a predictor for the change in axial length. Acta Ophthalmol 97: e454–e459. [DOI] [PubMed] [Google Scholar]
- Ohno‐Matsui K, Fang Y, Uramoto K, Shinohara K, Yokoi T, Ishida T & Jonas JB (2017): Peri‐dome choroidal deepening in highly myopic eyes with dome‐shaped maculas. Am J Ophthalmol 183: 134–140. [DOI] [PubMed] [Google Scholar]
- Prousali E, Haidich AB, Fontalis A, Ziakas N, Brazitikos P & Mataftsi A (2019): Efficacy and safety of interventions to control myopia progression in children: an overview of systematic reviews and meta‐analyses. BMC Ophthalmol 19: 106. [DOI] [PMC free article] [PubMed] [Google Scholar]
- Rahman W, Chen FK, Yeoh J, Patel P, Tufail A & Da Cruz L (2011): Repeatability of manual subfoveal choroidal thickness measurements in healthy subjects using the technique of enhanced depth imaging optical coherence tomography. Invest Ophthalmol Vis Sci 52: 2267–2271. [DOI] [PubMed] [Google Scholar]
- Read SA, Pieterse EC, Alonso‐Caneiro D et al. (2018): Daily morning light therapy is associated with an increase in choroidal thickness in healthy young adults. Sci Rep 8: 8200. [DOI] [PMC free article] [PubMed] [Google Scholar]
- Sander BP, Collins MJ & Read SA (2018): The interaction between homatropine and optical blur on choroidal thickness. Ophthalmic Physiol Opt 38: 257–265. [DOI] [PubMed] [Google Scholar]
- Sayin N, Kara N, Pekel G & Altinkaynak H (2015): Choroidal thickness changes after dynamic exercise as measured by spectral‐domain optical coherence tomography. Indian J Ophthalmol 63: 445–450. [DOI] [PMC free article] [PubMed] [Google Scholar]
- Ulaganathan S, Read SA, Collins MJ & Vincent SJ (2019): Daily axial length and choroidal thickness variations in young adults: Associations with light exposure and longitudinal axial length and choroid changes. Exp Eye Res 189: 107850. [DOI] [PubMed] [Google Scholar]
- Vaz S, Falkmer T, Passmore AE, Parsons R & Andreou P (2013): The case for using the repeatability coefficient when calculating test‐retest reliability. PLoS One 8: e73990. [DOI] [PMC free article] [PubMed] [Google Scholar]
- Xiong S, He X, Deng J et al. (2017): Choroidal thickness in 3001 Chinese children aged 6 to 19 years using swept‐source OCT. Sci Rep 7: 45059. [DOI] [PMC free article] [PubMed] [Google Scholar]
- Zhang Z, Zhou Y, Xie Z, Chen T, Gu Y, Lu S & Wu Z (2016): The effect of topical atropine on the choroidal thickness of healthy children. Sci Rep 6: 34936. [DOI] [PMC free article] [PubMed] [Google Scholar]
- Zhao M, Yang XF, Jiao X, Lim A, Ren XT, Snellingen T & Liu NP (2016): The diurnal variation pattern of choroidal thickness in macular region of young healthy female individuals using spectral domain optical coherence tomography. Int J Ophthalmol 9: 561–566. [DOI] [PMC free article] [PubMed] [Google Scholar]