

Abstract
In this paper, we extend the use of assurance for a single study to explore how meeting a study's pre‐defined success criteria could update our beliefs about the true treatment effect and impact the assurance of subsequent studies. This concept of conditional assurance, the assurance of a subsequent study conditional on success in an initial study, can be used assess the de‐risking potential of the study requiring immediate investment, to ensure it provides value within the overall development plan. If the planned study does not discharge sufficient later phase risk, alternative designs and/or success criteria should be explored. By transparently laying out the different design options and the risks associated, this allows for decision makers to make quantitative investment choices based on their risk tolerance levels and potential return on investment.
This paper lays out the derivation of conditional assurance, discusses how changing the design of a planned study will impact the conditional assurance of a future study, as well as presenting a simple illustrative example of how this methodology could be used to transparently compare development plans to aid decision making within an organisation.
Keywords: conditional assurance, decision‐making, Bayesian risk mitigation
1. INTRODUCTION
Drug development has historically been considered as a series of independent experiments which are required to be able to learn about an asset and allow it to progress through the various development phases, before finally obtaining regulatory approval and reimbursement. Compounds would only move through to the next stage of development if sufficiently positive data was obtained. However little consideration was given to what achieving this ‘sufficiently positive data’ truly meant, and the impact positive results would have on the probability of success of future studies within the development plan.
O'Hagan et al. 1 first introduced the concept of assurance to pharmaceutical drug development, proposing that all available knowledge of the true treatment effect could be utilised to quantify the predictive probability of success of a proposed study. This knowledge is quantified using a probability distribution which represents the uncertainty around the unknown true drug effect. The use of assurance calculations within GlaxoSmithKline (GSK) to inform the design of studies and communicate probability of success has become common place with practical examples discussed in Crisp et al. 2 Other pharmaceutical companies have also embraced assurance to inform on study design with a growing number of examples being presented in literature. 3 , 4 , 5
Examples of the use of assurance to date, focus on either on a single study 2 or how to define success criteria within a study with the aim of then having a certain level of phase 3 assurance, 3 , 6 taking the yet to be observed results as the prior for the future study. Conditional assurance focuses on the uncertainty around the true drug effect, not just how it impacts the probability of success of the planned study, but how that uncertainty will be updated if the study is successful and the implications for later phase studies.
Conditional assurance as proposed in this paper can be used to think further down the development pathway and ask the question, ‘how will the planned study's success modulate our beliefs around the unknown true treatment effect and therefore impact upon the next studies predicted probability of success?’ It is a conditional assurance of later stage success as it depends on the initial planned study's success. Walley et al. 4 used the concept of updating prior knowledge around the true treatment effect conditional on an outcome, focusing on a single study and with the aim of assessing ‘the ability of the design to separate “active” and “inactive” compounds’. We postulate that this approach can be broadened to quantify how the information being collected in the proposed study will be relevant and so de‐risk future studies, allowing clear communication of a study's value to the overall development plan. This can then be used to compare different clinical development plans and/or decision rules, to ensure all planned studies allow for appropriate discharge of later stage risk, with the ultimate aim of reducing the high levels of late stage attrition observed across the pharmaceutical industry. 7
In this paper, we will describe how conditional assurance is derived, how the design of the initial study will impact the conditional assurance of a subsequent study and illustrate how conditional assurance can be used to compare competing development plans. Our illustrative example will focus on the assurance of the phase 3 programme and how this is modulated conditional on success in previous phases, however the proposed approach is universally applicable to any phase of drug development.
2. METHODOLOGY
2.1. Power
Power is the probability a proposed study will deliver results sufficient to meet the pre‐defined success criteria, conditional on the design assumptions which most importantly include the specification of a single value for the true treatment effect. While the power is useful in assessing a study's ability to make an end of study conclusion under different assumed scenarios, it can only inform on the probability of achieving success if the assumptions about the unknown parameters are correct. While any study can be designed to have 90% power, if there is no reason to believe the assumptions that have gone into the calculation, then the probability of success of the study is not actually 90%; hence, this explains why power is of limited value in portfolio level investment decision‐making.
2.2. Assurance
Assurance, as described by O'Hagan et al. 1 uses the current levels of uncertainty in the true treatment effect to average over the power function to determine a study's probability of success. The uncertainty in the true treatment effect is captured via a prior belief distribution. As this prior is being used to assess the study design rather than necessarily being incorporated in the analysis, we will refer to this prior as the design prior. 1 , 4 A prior that is used in the inferential analysis will be referred to as an analysis prior.
Although O'Hagan coined the term ‘assurance’ with a focus on integrating the uncertainty in the design prior over the power function, this is equivalent to the concept of predictive probability as introduced by Spiegelhalter and Freedman. 8 Spiegelhalter and Freedman framed the concept as the probability of achieving a success criterion integrating over the predictive distribution, where the predictive distribution combines the uncertainty from the design prior and the sampling variability of the study. In the approach taken by O'Hagan, the uncertainty from the sampling variability comes in as part of the power function, which is predictive conditional on a fixed value of the truth Δ. As these two approaches are equivalent, we have included the notation for both approaches below, although will continue to refer to assurance throughout.
Let Δ be the true treatment difference, π D (Δ) our design prior for the true treatment difference, X denote the data which has the likelihood p(X| Δ), the event S 1 be achieving a pre‐defined success criterion, 9 x 1 be the minimal critical value to achieve success, denote the power function, which can also be thought of as the probability of achieving success for a given Δ. The assurance is calculated as 1 , 8 :
| (1) |
The power function is integrated with respect to the design prior for the true treatment effect and is sometimes called an unconditional probability of success as it is unconditional on a specific fixed value for the truth, however it should be noted that the assurance is conditional on the specification of the design prior.
Within the assurance calculation the design prior reflects the totality of the current knowledge about the true treatment effect and should be based on all available relevant internal and/or external data. This includes pre‐clinical or pharmacological data, and information on similar compounds with the same mechanism of action. As the assurance is dependent on this prior distribution, and governance funding may utilise this assurance in their decision making, it is important to ensure the prior distribution accurately and robustly reflects all relevant information available in an auditable and transparent manner. Where expert judgements are elicited this should be done using a formal elicitation framework with clear documentation in order to minimise potential biases in the elicitation process. 10 , 11
2.3. Conditional assurance
Conditional assurance is the predicted assurance of a subsequent study, conditional on the success of an initial study and the design prior. Like assurance it can be calculated by averaging the uncertainty about the true treatment effect over the power function for the subsequent study, but here the uncertainty is based on an updated design posterior which incorporates the fact that the pre‐defined success criteria for the initial study has been met to warrant continuation of development.
Consider a planned study where success will lead to initiation of a subsequent study. Assuming the same endpoint in both studies, the minimum design posterior from the planned study can be calculated using Bayes theorem; combining the likelihood of the observed x 1, p(x 1| Δ), and our design prior, π D (Δ):
This design posterior following the planned study can then be used as the design prior for the subsequent study to calculate the minimum assurance conditional on observing x 1 in the planned study, that is, the minimum conditional assurance.
However, values greater than x 1 would also lead to success in the planned study and for each of these potential observed values X ≥ x 1, there is a potential future design posterior. Updating the design prior with the probability of observing X ≥ x 1 in the planned study ( P(S 1| Δ)), the conditional design posterior is calculated as.
| (2) |
where the denominator in (2) is the assurance of the planned study.
The conditional design posterior is then used to calculate the conditional assurance for the subsequent study. Let the event S 2 be achieving success in the subsequent study and x 2 the minimal critical value to achieve success . The conditional assurance for the subsequent study is calculated as:
| (3) |
The de‐risking of the subsequent trial design can then be quantified as the relative and absolute difference between the conditional assurance and the assurance of the subsequent study, ∫P(S 2| Δ)π D (Δ| S 1)dΔ and ∫P(S 2| Δ)π D (Δ)dΔ, respectively.
3. IMPACT OF THE PLANNED STUDY DESIGN ON THE CONDITIONAL ASSURANCE
When considering conditional assurance, our focus is ensuring the planned study adds value to the development plan and sufficiently de‐risks the later study. Therefore, it is the design of the planned study which we explore in this section. For the subsequent study we will assume the design is fixed, such that the study is appropriately designed given current assumptions, but with the understanding that this may change at the time of designing the study.
Let us assume the data is normally distributed such that P(S 1| Δ) and P(S 2| Δ) can be written using the standard normal cumulative distribution as and , where n 1 and n 2 are the number of subjects per arm in the planned and subsequent studies and σ 2 is the variance of the endpoint, which is assumed to be the same in both studies. Let us assume the design prior is also normally distributed as where n 0 is the effective sample size of the prior, as suggested by Neuenschwander et al. 12
While the predictive distribution for the initial study, , can be used to calculate the assurance and so allows us to take advantage of closed form solutions, 12 the design posterior takes no known form, at least not one these authors can derive for the general case, as
The conditional assurance must therefore be calculated by numerical integration or simulation.
Before discussing the impact of the planned study design on the conditional assurance, we must first assume that n 0 > 0 and as such the design prior is informative. We do this firstly, as there should always be some information that supports the development of a compound, and secondly, in order for assurance and conditional assurance to be useful in decision making we must start from a position of being somewhat informed. Without this assumption the following properties become true, invalidating the approach:
As noted by Carroll 13 as n 0 → 0 the assurance → 0.5, which is equivalent to a fair coin toss and not informative in the decision to invest.
As n 0 → 0 then the , which is an improper distribution and is not integrable.
3.1. Impact of n 1 on conditional assurance
When n 1 is very small P(S1| Δ) is relatively flat over plausible values of Δ, hence π(Δ| S 1) ≈ π(Δ) and the conditional assurance of the subsequent study is approximately equal to the assurance of the subsequent study. That is, the planned study does not inform or de‐risk the subsequent study.
When n 1 is very large P(S1| Δ) tends to a step function with P(S 1| Δ < x 1) ≈ 0 and P(S 1| Δ > x 1) ≈ 1, and so the design posterior tends to the design prior truncated below at x 1. The conditional assurance can be calculated as . Truncating the design prior at x 1 will always increase the density for values greater than x 1 and so . Consequently, conditioning on success in the planned study will always inform and increase the assurance of the subsequent study compared with a development plan that goes straight to the subsequent study.
The shape of the conditional assurance as a function of n 1 will depend on whether the success criteria S 1, and hence x 1, is a function of n 1 or not.
- If S 1 is a function of n 1, for example a significant P‐value, then the conditional assurance is not monotonic but will initially increase before decreasing to (Figure 1), as:
- For small n 1, x 1will be large, which may give a low assurance for the planned study, but if success is achieved it is then predictive of success in the subsequent study increasing the conditional assurance.
- The conditional assurance will continue to increase with n 1until the hurdle for success, x 1, reaches a point where it becomes less informative about the ability to achieve S 2 in the subsequent study, at which point the conditional assurance will begin to decrease. This tipping point for this will depend on the design prior, S 2 and n 2.
- When n 1 is large the conditional assurance plateaus to
If x 1 is a not a function of n 1, but instead some clinically meaningful value that must be observed, then the conditional assurance becomes a monotonically increasing function of n 1. This is because the P(S 1| Δ) pivots around x 1, with P(S 1| Δ = x 1) = 0.5 regardless of sample size. As n 1 increases, the gradient of the power curve increases and so achieving success increases our confidence the true value is above x 1, shifting the weight in the design posterior to be greater than x 1 until the conditional assurance reaches
FIGURE 1.
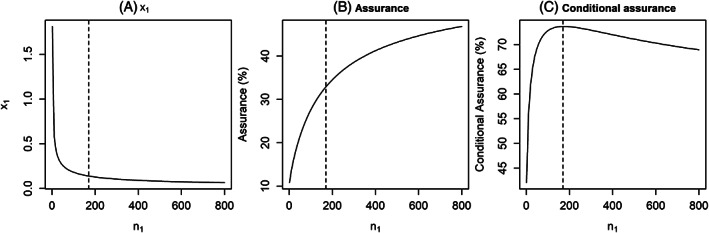
Impact of n 1 on (A) x 1, (B) the assurance of the planned study and (C) the conditional assurance of the subsequent study, assuming σ 2 = 1, μ = 0.05, n 0 = 70, n 2 = 530, x 2 = 0.12 (minimum critical value for a significant P‐value assuming two‐sided 5% alpha). Vertical dashed line represents the n 1 that maximises the conditional assurance
3.2. Impact of S 1 on conditional assurance
As S 1 is linked to x 1, if we were to keep n 1 fixed and vary the success criteria:
For easier to achieve success criteria with a small x 1, the assurance for the planned study will be higher, but the de‐risking of the subsequent study will be smaller.
For harder to achieve success criteria with a larger x 1, the assurance for the planned study will be lower, but the de‐risking of the subsequent study will be larger.
Therefore when setting S 1, consideration should be given to the evidence that is going to be generated and its impact on the probability to achieve to S 2. A study with an easily achievable success criterion may have high assurance, but the value of the study may be questionable and could lead to running the subsequent study without having mitigated much risk. Conversely if the success criterion is challenging to achieve, the study will have low assurance but with high predictive value for the subsequent study. The aim however is not to maximise the conditional assurance, in fact that is of little utility if the likelihood of progressing is very low, but rather to understand the levels of risk associated in each study of the development. Decision makers can therefore make informed decisions about where to spend risk based on what is acceptable to the organisation.
4. ILLUSTRATION OF USE IN A CLINICAL DEVELOPMENT PLAN
In order to illustrate how the conditional assurance can be used in assessing clinical development plans, we have constructed a generic development plan using an effect size to design each phase, where the effect size is defined as the treatment difference/standard deviation of the endpoint and hence we have used a standard deviation of 1. For example, in respiratory study for asthma, a clinically meaningful difference may be 100 mL and the standard deviation of the change from baseline could be assumed to be 400 mL, this would result in an effect size of 0.25.
This illustrative development plan assumes that phase 1 has shown the molecule to be safe and tolerable and incorporates three phases of clinical trials which are part of the commonplace in the pathway to getting a medicine registered (Table 1):
TABLE 1.
Summary of studies considered in our illustrative development plan
| Phase | Total sample size | Design | Success criteria |
|---|---|---|---|
| 2a | 120 | 60 subjects per arm | P(Δ > 0| x, π A ) > 0.8 |
| 2b | 350 | 100 subjects on the top dose and placebo arms, 50 at three intermediate doses. | P(Δ > 0| x, π A ) > 0.9 |
| 3 | 1000 |
Two studies with 250 subjects per arm Each phase 3 has 90% power assuming a true effect size of 0.3 for a two‐sided 5% alpha |
Two studies achieving statistical significance at the two‐sided 5% level. |
Note: π A , the analysis prior, is a vague N(0,10) prior for the treatment difference.
Phase 2a proof of concept study: Two arm placebo controlled parallel group randomised trial with 60 subjects per arm. Success defined as greater than 80% posterior probability that the true difference is >0, using a vague analysis prior N(0,10). Study designed to have 80% power if the true effect size is 30%.
Phase 2b dose response study: Five arm dose response placebo controlled parallel group randomised trial with 100 subjects on the top dose and placebo and 50 subjects per arm on the intermediate doses. Success defined as greater than 90% posterior probability that the true difference is >0, using a vague analysis prior N(0,10). Study designed to have 80% power if the true effect size is 30% at the top dose. For the purposes of the illustration we have focused on the comparison between the top dose and placebo, although dose response modelling could be accounted for here and factored into simulations.
Phase 3: Two identical phase 3 studies with overall phase 3 success defined as both being successful. Both studies are two arm placebo controlled parallel group randomised trials with 250 subjects per arm. Success for an individual phase 3 study is defined as a significant P‐value at the two‐sided 5% level. Each study is designed to have 90% power if the true effect size is 30%.
We are going to consider two possible development plans. One which will include all three phases of development and one which will exclude the phase 2a study in favour of going straight to phase 2b. We will focus on the conditional phase 3 assurance for each development plan and how that is updated based on the predicted success of the earlier phases, quantifying the value of the phase 2a study in de‐risking phase 3.
The design prior for our illustration is a bimodal distribution, which puts 50% weight on a distribution of treatment effects which assumes the compound is efficacious and 50% weight on the compound being ‘placebo like’. This bimodal design prior reflects the uncertainty that the molecule will be clinically effective, as feels appropriate for the early stage of development when it is often unknown whether the pre‐clinical data will translate to clinical benefit for patients. For the purposes of this example the design prior puts 50% weight on a Normal distribution with mean 0 and a SD of 0.01 (the ‘placebo like’ component of the prior) and the remaining 50% weight on a Normal distribution with mean 0.2 and a SD of 0.1 (See Figure 2A).
FIGURE 2.
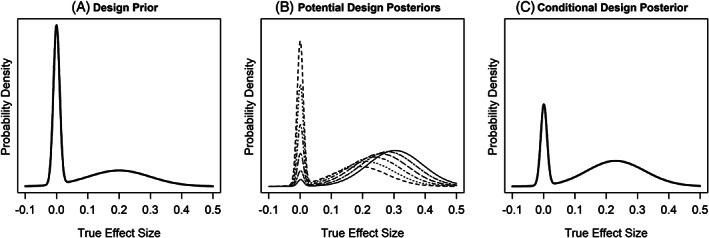
(A) Prior distribution for the true treatment effect size, (B) potential design posteriors based on outcomes from phase 2a that would achieve success, and (C) conditional design posterior
The following results are based on using the integrate function in R (code in Data S1). In order to interrogate the value of each study in the development plan we must first calculate the assurance of all studies based on our current design prior. For our illustrative development plan the assurance for the phase 2a, phase 2b and phase 3 are 39%, 32% and 21%, respectively (top row in Figure 3). The decreasing assurance reflecting the higher hurdles for success for the later phases, as the standard of evidence required increases.
FIGURE 3.
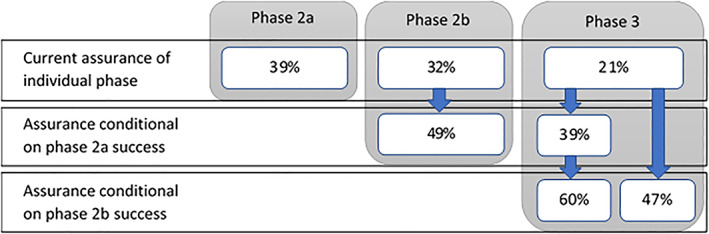
Assurances based on design prior for each phase of development and the evolving assurances conditional on success. For phase 3, left column illustrates the evolving phase 3 conditional assurance as phase 2a and phase 2b are sequentially successful, right column is phase 3 conditional assurance for the development plan that goes straight to phase 2b
Based on our design assumptions and success rule, the critical value that would lead to success for the phase 2a study is 0.15. Figure 2B illustrates several potential design posteriors that would be the result of observing a treatment effect greater than or equal to 0.15 in the phase 2a study. Averaging the design posteriors where our pre‐defined success criteria was achieved over our current design prior gives the conditional design posterior (Figure 2C).
Figure 3 presents the evolution of the assurance values for the phase 2b and phase 3 studies conditional on previous study successes and how each study de‐risks the ultimate large and expensive phase 3 programme:
Based on the design prior (Figure 4A) which reflects the limited knowledge to date, and the proposed phase 3 design, the assurance of phase 3 is 21%.
If success is achieved in the phase 2a study the weight on the placebo like component of the conditional design posterior (Figure 4B) has been reduced, reflecting the updated belief that data from a positive study brings. The impact of this is that the conditional phase 3 assurance goes to 39%.
The additional success of the phase 2b study further down‐weights the belief the compound is placebo like (Figure 4C) and increases the conditional phase 3 assurance from 39% to 60%.
If an accelerated development plan is considered where phase 2b is performed without a phase 2a study, less data will be accumulated during development resulting in greater uncertainty in the conditional design posterior after Phase 2b (Figure 4D). This reflects what is intuitively known; this is a risker strategy. The assurance for phase 3 conditional on phase 2b success in this case is 47%.
FIGURE 4.
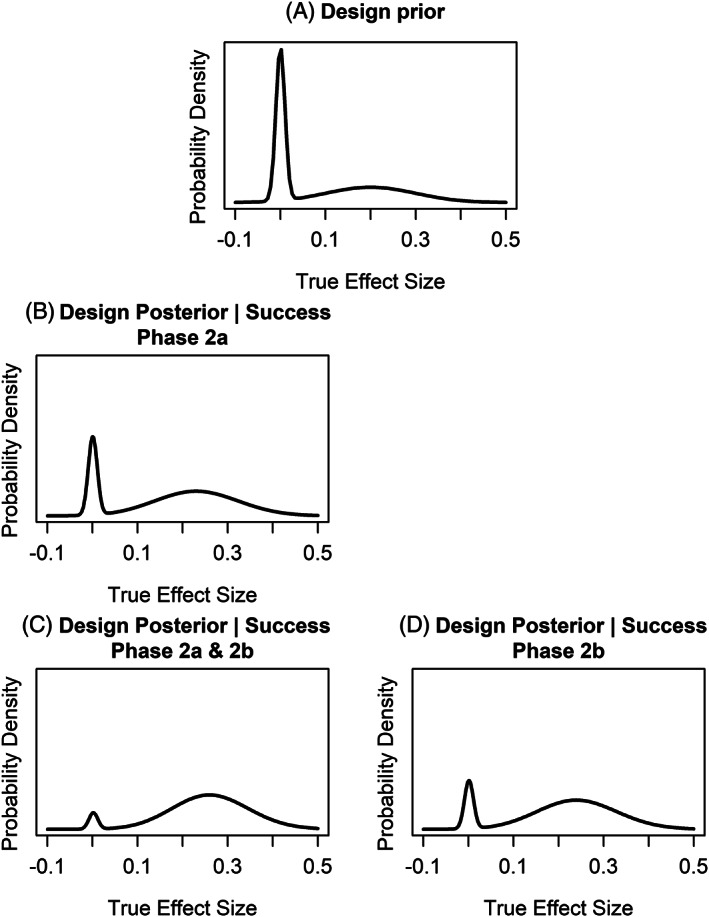
(A) Design prior, (B) design posterior conditional on success in phase 2a, (C) design posterior conditional on success in both the phase 2a and 2b studies, (D) design posterior conditional on success in phase 2b. Left column illustrates the evolving design posteriors as phase 2a and phase 2b are sequentially successful, right column is the design posterior for a development plan that goes straight to phase 2b
Consider the impact of the two development plans side by side in terms of how they will de‐risk phase 3. Based on our current prior belief, success in both the phase 2a and 2b studies, results in a conditional assurance for phase 3 of 60% whereas with only a successful phase 2b study the conditional assurance is 47%. By quantifying the impact on phase 3 success this has allowed us to transparently communicate the increased risk of going straight to phase 2b, which can then be considered alongside the savings in cost and time saved from such an approach and directly feed into the decision‐making process.
When discussing the risk of a development plan it should also be noted that based on our prior beliefs success in two earlier phase studies, phase 2a and 2b, is less likely to occur than success in a single phase 2b study (P(2a) × P(2b|2a) = 39% × 49% = 19% vs P(2b) = 32%, respectively). Therefore, with two phase 2 studies we are less likely to get to phase 3 than with a single phase 2 study, but if we do reach phase 3 it will be with more confidence. It is therefore a question of where an organisation wants to spend risk, in smaller earlier phases to de‐risk later studies or carry the risk into the larger later phases.
If an organisation desires a higher level of confidence before embarking on phase 3, then the earlier phase studies must discharge more risk. Our design prior should encompass all relevant knowledge to date, and so should not be changed to achieve a higher conditional assurance, but the success criteria and sample sizes for the studies can be changed. Higher hurdles for success could be considered that would not only shift the design posterior away from the compound being placebo like, but would also shift the mass of the design posterior to larger more clinically relevant treatment differences. With more stringent success criteria, the probability of success of the earlier studies would be reduced, but the probability of success in the later phases increased. Larger studies could also be considered to mitigate more risk earlier in development.
For this simple hypothetical example, we have assumed the same endpoint, patient population and timepoint and other design features between studies. This is rarely the case across clinical development and so there may be a need to extrapolate the prior distribution to account for study differences. However, by laying out the assurance and conditional assurances, the additional uncertainty arising from the extrapolation will be transparent as a risk in the clinical development plan from the outset and will itself be informative to decision makers. Where translation of endpoints between phases is necessary, we would argue this approach ensures the extrapolation is considered before starting a study; something which will then also be beneficial to the decision‐making process. After all if the relationship between a surrogate endpoint in early development and registrational endpoint is unknown – how will the extrapolation be made at the end of the study and how can we ensure the study appropriately informs on the next stage of development?
A common question that is asked when designing a clinical development plan is what assurance and conditional assurance should be ‘aimed’ at. The answer is there is no such value, as it will depend on the disease area, the unmet medical need and the potential return on investment. While the aim of this approach is to quantify how a study will de‐risk later phase development, that does not mean all the risks can or will be discharged prior to phase 3. In the case of rare diseases, a large phase 2 is not feasible and so a lot of risk may need to be carried into phase 3; that does not mean that investment is not a smart risk to make. In the case of a disease where large replicate phase 3 studies are required for registration and a high level of efficacy is required in order to be competitive, then an organisation may want to spend more earlier in the development plan to build confidence before embarking on phase 3. The important factor is not the values themselves, but the transparency about the reasons to believe and how evidence generation will update our beliefs in order to allow decision makers to make informed judgements.
5. DISCUSSION
In this paper we have introduced the concept of conditional assurance as a tool for transparently discussing quantitative clinical development plan optionality with focus on how each study de‐risks a later phase of development. This approach aims to encourage open discussions regarding how the data being collected will feed into the larger picture and the relevance of that data to the development plan as a whole. Since 2019 this has become an integral part of GSK's Quantitative Decision Making (QDM) framework with development plan optionality and the understanding of risks being presented at governance boards before any study funding decisions are made.
Conditional assurance is a tool to inform decision making and reflects the predictive probability of future study success at the snapshot in time where the immediate investment is being made, before the data has been collected; however the assurance of the subsequent study should always be re‐calculated once we have the actual study data in hand. The actual assurance for the subsequent study will utilise the data from the current study combined with any other relevant information that informs the beliefs about the treatment effect, where we would advise conducting a prior elicitation to combine these sources of information before each stage in development. Hence, like assurance is used to quantify the ability of a design to achieve a successful outcome, conditional assurance is intended to measure a designs ability to de‐risk later phases given our current prior beliefs and the pre‐defined success criteria but is not intended to usurp the data once collected.
This methodology can be implemented early in development and can be extended to predict success many steps down the development pathway. However, the further down the development pathway we predict the more unknowns there are. Therefore, the quantitative value of this approach lessens the further in time we try to predict, however, utilising this approach will layout the logic behind a proposed development plan and can highlight any gaps that exist, which, in itself, can be useful for decision makers at the time of investment.
While there is scope to extend this methodology further and employ utility functions within a Bayesian decision framework to optimise development plans for an individual project 14 or across a portfolio, 15 this would require more assumptions to be made about the many different aspects in the decision making process, for example study costs and time to market. The challenge of employing such approaches then becomes ensuring the additional complexity and assumptions can still be easily communicated to our non‐statistical colleagues in order to influence the decision making. We believe the simplicity of the method proposed here will allow for its widespread application within clinical drug development, more transparent communication with stakeholders which will ultimately lead to better informed decision making across a portfolio.
Supporting information
DATA S1 Supporting information
ACKNOWLEDGEMENTS
We would like to thank Nicky Best, Juan Abellan and Jacquie Christie for their review and input into this paper. We would also like to thank the two reviewers who provided insightful comments to improve the quality of the final manuscript.
Temple JR, Robertson JR. Conditional assurance: the answer to the questions that should be asked within drug development. Pharmaceutical Statistics. 2021;20:1102–1111. 10.1002/pst.2128
DATA AVAILABILITY STATEMENT
All data reported in the paper are illustrative. The code to reproduce the results can be found in the supplementary material. We used the R function RBesT (https://cran.r-project.org/web/packages/RBesT/RBesT.pdf) to calculate the posterior probabilities when using simulation.
REFERENCES
- 1. O'Hagan A, Stevens JW, Campbell MJ. Assurance in clinical trial design. Pharm Stat. 2005;4:187‐201. [Google Scholar]
- 2. Crisp A, Miller S, Thompson D, Best N. Practical experiences of adopting assurance as a quantitative framework to support decision making in drug development. Pharm Stat. 2018;17:317‐328. [DOI] [PubMed] [Google Scholar]
- 3. Sabin T, Matcham J, Bray S, Copas A, Mahesh KB. A quantitative process for enhancing end of phase 2 decisions. Stat Biopharm Res. 2014;6:67‐77. [DOI] [PMC free article] [PubMed] [Google Scholar]
- 4. Walley RJ, Smith CL, Gale JD, Woodward P. Advantages of a wholly Bayesian approach to assessing efficacy in early drug development: a case study. Pharm Stat. 2015;14:205‐215. [DOI] [PubMed] [Google Scholar]
- 5. Wang Y, Fu H, Kulkarni P, Kaiser C. Evaluating and utilizing probability of study success in clinical development. Clin Trials. 2013;10:407‐413. [DOI] [PubMed] [Google Scholar]
- 6. Hong S, Shi L. Predictive power to assist phase 3 go/no go decision based on phase 2 data on a different endpoint. Stat Med. 2012;31:831‐843. [DOI] [PubMed] [Google Scholar]
- 7. Hay M, Thomas DW, Craighead JL, Economides C, Rosenthal J. Clinical development success rates for investigational drugs. Nat Biotechnol. 2014;32:40‐51. [DOI] [PubMed] [Google Scholar]
- 8. Spiegelhalter DJ, Freedman LS. A predictive approach to selecting the size of a clinical trial, based on subjective clinical opinion. Stat Med. 1986;5:1‐13. [DOI] [PubMed] [Google Scholar]
- 9. Frewer P, Mitchell P, Watkins C, Matcham J. Decision‐making in early clinical drug development. Pharm Stat. 2016;15(3):255‐263. [DOI] [PubMed] [Google Scholar]
- 10. O'Hagan A, Buck CE, Daneshkhah A, et al. Uncertain Judgements: Eliciting experts' Probabilities. Chichester: Wiley; 2006. [Google Scholar]
- 11. Dallow N, Best N, Montague T. Better decision making in drug development through adoption of formal prior elicitation. Pharm Stat. 2018;17:301‐316. [DOI] [PubMed] [Google Scholar]
- 12. Neuenschwander B, Capkun‐Niggli G, Branson M, Spiegelhalter DJ. Summarizing historical information on controls in clinical trials. Clin Trials. 2010;7:5‐18. [DOI] [PubMed] [Google Scholar]
- 13. Carroll KJ. Decision making from phase II to phase III and the probability of success: reassured by “assurance”? J Biopharm Stat. 2013;23:1188‐1200. [DOI] [PubMed] [Google Scholar]
- 14. Julious S, Swank D. Moving statistics beyond the individual clinical trial: applying decision science to optimize a clinical development plan. Pharm Stat. 2005;4:37‐46. [Google Scholar]
- 15. Stallard N. Optimal sample sizes for phase II clinical trials and pilot studies. Stat Med. 2012;31(11–12):1031‐1042. [DOI] [PubMed] [Google Scholar]
Associated Data
This section collects any data citations, data availability statements, or supplementary materials included in this article.
Supplementary Materials
DATA S1 Supporting information
Data Availability Statement
All data reported in the paper are illustrative. The code to reproduce the results can be found in the supplementary material. We used the R function RBesT (https://cran.r-project.org/web/packages/RBesT/RBesT.pdf) to calculate the posterior probabilities when using simulation.