

Abstract
Radial expansion is a classic response of roots to a mechanical impedance that has generally been assumed to aid penetration. We analysed the response of maize nodal roots to impedance to test the hypothesis that radial expansion is not related to the ability of roots to cross a compacted soil layer. Genotypes varied in their ability to cross the compacted layer, and those with a steeper approach to the compacted layer or less radial expansion in the compacted layer were more likely to cross the layer and achieve greater depth. Root radial expansion was due to cortical cell size expansion, while cortical cell file number remained constant. Genotypes and nodal root classes that exhibited radial expansion in the compacted soil layer generally also thickened in response to exogenous ethylene in hydroponic culture, that is, radial expansion in response to ethylene was correlated with the thickening response to impedance in soil. We propose that ethylene insensitive roots, that is, those that do not thicken and can overcome impedance, have a competitive advantage under mechanically impeded conditions as they can maintain their elongation rates. We suggest that prolonged exposure to ethylene could function as a stop signal for axial root growth.
Keywords: cell file number, cell size, ethylene, mechanical impedance, radial expansion, root anatomy, root axis
Short abstract
Ethylene‐induced thickening of maize roots is negatively related to the penetration of hard soil.
1. INTRODUCTION
Roots interact dynamically with the highly heterogeneous soil environment and commonly need to withstand abiotic and biotic stresses to acquire water and nutrients. One major constraint to root growth and function is mechanical impedance, or the physical resistance to root penetration imposed by soil (Bennie, 1996; Whalley, Leeds‐Harrison, Clark, & Gowing, 2005). An example of localized mechanically impeding conditions that roots encounter is the presence of harder soil clods or aggregates (Konôpka, Pagès, & Doussan, 2008, 2009). Another example is plough pans created by tillage which are spatially abrupt. Roots unable to penetrate through harder soil strata run the risk of being confined to the upper, less dense soil domains while roots adapted to impeded conditions are able to penetrate through harder layers and would be able to maintain normal plant growth (Barraclough & Weir, 1988; Ehlers, Köpke, Hesse, & Böhm, 1983; Pfeifer et al., 2014). Soil structure itself can facilitate root exploration but could also hinder root growth. Biopores formed by pre‐existing roots can be used to bypass harder soil domains (Athmann, Sondermann, Kautz, & Köpke, 2019; Ehlers et al., 1983; Han et al., 2015; Valentine et al., 2012; Whitmore & Whalley, 2009; Zhou et al., 2021). However, roots can become confined in soil pores restricting soil exploration of the bulk soil (Pankhurst, Pierret, Hawke, & Kirby, 2002; White & Kirkegaard, 2010). As a localized denser region of soil surrounds a root (Helliwell, Sturrock, Miller, Whalley, & Mooney, 2019), a pore formed by previous roots might constrict subsequent roots due to greater impedance in the pore wall. To further explore bulk soil, a root must therefore overcome the resistance posed on it by such a pore wall. In most soils, mechanical impedance increases with soil drying (Gao et al., 2016; Grzesiak, Grzesiak, Hura, Marcińska, & Rzepka, 2013; Whalley et al., 2005; Whitmore & Whalley, 2009). Thus, alternate wetting and drying of soil can therefore temporally impede roots depending on soil matric potential.
Root adaptions to mechanical impedance encompass several strategies. Root tip phenes such as increased production of mucilage and root cap cell sloughing lubricate the root‐soil interface (Boeuf‐Tremblay, Plantureux, & Guckert, 1995; Iijima, Griffiths, & Bengough, 2000; Iijima, Higuchi, & Barlow, 2004). Sharper root tip shape reduces stress at the root tip via a more cylindrical cavity expansion (Bengough, McKenzie, Hallett, & Valentine, 2011; Colombi, Kirchgessner, Walter, & Keller, 2017). Architectural phenes, such as steeper root angles might reduce deflection upon encountering a strong layer (Dexter & Hewitt, 1978). Other phenes such as the presence of root hairs help root tip penetration by anchoring the root into the soil (Bengough, Loades, & McKenzie, 2016). A comprehensive review of root morphological adaptions to mechanical impedance by Potocka and Szymanowska‐Pułka (2018) concluded that adaptations to mechanical impedance are present across different architectural and anatomical scales. However, limited research has been carried out discriminating root anatomical responses among root types in response to mechanical impedance.
Root anatomical variation among maize genotypes is better able to predict the penetration of strong wax layers than root diameter alone (Chimungu, Loades, & Lynch, 2015). Mechanical impedance generally causes radial thickening of roots, including that of maize which we studied here (Bengough & Mullins, 1991; Konôpka et al., 2009; Materechera, Dexter, & Alston, 1991; Moss, Hall, & Jackson, 1988). This form of radial expansion is different from that resulting from secondary growth (Strock, Morrow de la Riva, & Lynch, 2018). Thicker roots buckle less (L. J. Clark, Price, Steele, & Whalley, 2008; Whiteley, Hewitt, & Dexter, 1982), and modelling has found that radial expansion will reduce the stress from the root tip (Bengough et al., 2006; Kirby & Bengough, 2002) while simultaneously pushing particles out of the way so that the root can extend further (Vollsnes, Futsaether, & Bengough, 2010). Root thickening is associated with reduced elongation rates (Bengough & Mullins, 1991; L. J. Clark, Whalley, & Barraclough, 2001; Colombi et al., 2017; Iijima, Kato, & Taniguchi, 2007; Schmidt, Gregory, Grinev, & Bengough, 2013), which ultimately can result in reduced soil exploration. Roots that thicken in response to impedance do so by increasing the dimensions of the cortex (Atwell, 1990; Colombi et al., 2017) or both stele and cortical tissues (Atwell, 1988; Colombi et al., 2017; Hanbury & Atwell, 2005; Iijima et al., 2007; Wilson, Robards, & Goss, 1977). These responses vary among plant species, root type, plant developmental stage, and experimental conditions (Colombi & Walter, 2016). Cortical dimensions change by an increase in the size of cortical cells (Atwell, 1988; Hanbury & Atwell, 2005; Veen, 1982) or a combination of cortical cell size and cortical cell file number (Colombi et al., 2017; Croser, Bengough, & Pritchard, 1999; Iijima et al., 2007). Cortical cells increase their size radially, facilitated by the loosening of cell walls by microfibril reorientation (Iijima et al., 2007; Veen, 1982). The increase in radial cell area coincides with a reduction of cell lengths (Atwell, 1988; Croser, Bengough, & Pritchard, 2000). How cell volume changes under mechanical impedance needs further clarification. Cortical cell length reduction could partly explain reduced elongation rates observed under mechanical impedance (Atwell, 1988). Further reduction of elongation rate could be caused by reduced cell production in the meristem (Croser et al., 2000). Recently root thickening has been directly linked to increased energy cost for root elongation with increasing soil penetration resistance for different wheat genotypes (Colombi, Herrmann, Vallenback, & Keller, 2019). Root thickening has also been associated with an increase in the oxygen demand (50%–80%) for impeded lupin roots (Hanbury & Atwell, 2005). It is clear that root thickening has beneficial, as well as detrimental effects on the plant root system. There is a need to better understand the mechanism controlling radial thickening.
Ethylene biosynthesis and systems modified by ethylene are involved in stress responses and regulate root responses to impedance (Atwell, 1988; Jacobsen, Xu, Topping, & Lindsey, 2021; Pandey et al., 2021; Sarquis, Jordan, & Morgan, 1991). Mechanical impedance alters maize root growth by promoting ethylene biosynthesis which inhibits elongation and promotes swelling (Sarquis et al., 1991). Impeded maize primary roots produced more ethylene and had an increased root diameter compared to non‐impeded roots (Moss et al., 1988; Sarquis et al., 1991). Mechanically impeded Vicia faba roots produced more ethylene compared to non‐impeded roots (Kays, Nicklow, & Simons, 1974). Roots of 7‐day old Never ripe (ethylene‐insensitive) tomatoes formed elongated roots in a soft medium but were unable to penetrate a harder sand medium (D. G. Clark, Gubrium, Barrett, Terril, & Klee, 1999), and tomato roots treated with the ethylene action inhibitor 1‐methylcyclopropene (1‐MCP) were unable to penetrate a soft growing medium (Santisree et al., 2011). Based on the observed effects of ethylene on radial expansion and research indicating that thicker roots are more likely to penetrate hard soil, it has been assumed that ethylene production in response to mechanical impedance leads to the radial expansion and improved soil penetration (Potocka & Szymanowska‐Pułka, 2018). However, in a study of Eucalyptus seedlings by Benigno, Cawthray, Dixon, and Stevens (2012), compacted soil reduced both ethylene production and elongation rates, suggesting that the link between ethylene production and reduced root growth is not straightforward.
Existing studies have generally focused on root length, branching, and diameter responses to mechanical impedance (Konôpka et al., 2008). When root anatomy has been studied, different root axes have been compared while changes within a single root axis have rarely been considered. With few exceptions (Colombi et al., 2017; Veen, 1982), root anatomy has mainly been studied on primary roots (Colombi et al., 2019; Croser et al., 1999; Hanbury & Atwell, 2005; Iijima et al., 2007). However, different root classes can react differently to impedance (Vanhees, Loades, Bengough, Mooney, & Lynch, 2020). In this study, we hypothesize that root radial expansion is negatively associated with the penetration % of roots in compacted soil layers. Secondly, we assessed root class and genotypic differences in the ability of roots to penetrate hard soil and tested a variation of ethylene‐induced radial expansion responsiveness in these groups. In this context, we propose that ethylene might function as a signal associated with thickening and suggest that prolonged production of ethylene in response to mechanical impedance can function as a ‘stop’ signal for axial growth of that particular root axis. Genotypes that produce less ethylene, or that are insensitive to ethylene could therefore maintain root elongation rate more easily under impeded conditions.
2. MATERIALS AND METHODS
2.1. Experiment 1: Anatomical changes to a root axis crossing a compacted soil layer
2.1.1. Experimental set‐up
A brown earth soil (FAO classification: Stagno Gleyic Luvisol) with sandy loam texture (2% clay, 21% silt, and 77% sand) was procured from local sugar beet farms through British Sugar in Newark (UK). The soil was obtained from sugar beet during the manufacturing process. Before column packing the soil was air‐dried and sieved to <2 mm. Dried soil was wet to 17% gravimetric moisture content. Columns (14.8 cm diameter and 23 cm total height) were uniformly packed creating three regions with a compacted layer (1.5 g/cm3 and thickness of 3 cm) placed between low bulk density layers (1.2 g/cm3). The air‐filled porosity of the soil at 17% gravimetric water content was 26% (v/v) for the 1.2 g cm−3 bulk density layers, and 38% at 1.5 g cm−3 bulk density layers. It is therefore unlikely that prolonged hypoxic conditions were present during this experiment, as these are most likely where the air‐filled porosity is less than 10% (e.g., see Bengough et al., 2006). The top and bottom areas were 7.5 and 9.5 cm long, respectively, making up a total of 20 cm of the total height of soil in the column. A mould was used to create the compacted layer after which it was transferred onto the bottom half of the column. The soil surface of the compacted layer was abraded at each side to assure the compacted layer and the non‐compacted soil above and below the compacted layer adequately adhered. The columns were lined with a plastic sleeve to facilitate the removal of the intact soil column after scanning. Both pots and sleeves were perforated at the bottom to facilitate free drainage. A preliminary trial was conducted to optimize the positioning of the compacted layer and to identify the preferred number of growing days (to account for growth up to node 4 reaching below the compacted layer).
Smaller columns (10 cm high and 5 cm diameter), packed at the same moisture content and bulk density as the layered system, were used to record penetrometer resistance using an Instron load cell (Instron 5,969, 50 kN, Instron, Norwood, MA) fitted with a penetrometer needle (0.996 mm cone diameter and 15° semi‐angle). The penetrometer tip penetrated the samples for 12 mm at a constant speed of 4 mm s−1. Measurements were averaged between 5 and 11 mm extensions. Smaller (1.2 g/cm3) and greater (1.5 g/cm3) bulk densities had penetrometer resistance of 0.48 ± 0.03 (SD) MPa and 0.83 ± 0.01 (SD) MPa, respectively and were significantly different (t test, p = .002).
2.1.2. Plant material and growing conditions
Four genotypes (recombinant inbred lines; IBM086, IBM146, IBM014, and OhW128) previously studied in field trials (Chimungu et al., 2015; Vanhees et al., 2020), were selected based on their contrasting ability to penetrate the compacted layer and with sufficiently steep root angle to allow for roots to reach the compacted layer. Seeds were acquired from Dr. Shawn Kaeppler (the University of Wisconsin, Madison, WI – Genetics Cooperative Stock Center, Urbana, IL). Seeds were sterilized (6% NaOCl in H2O) for 30 min, imbibed for 24 hr, and germinated at 26°C for 3 days before planting. Germinated seeds with similar primary root lengths (±1 cm) were selected for planting. Two seeds per column were planted 0.5 cm deep for each genotype, plants were thinned to one plant per column if both of the seeds developed. Five blocks staggered in time were planted with one replicate for each genotype per block. Plants were grown in a greenhouse at a 25/18°C day/night temperature and a 14 hr/10 hr day/night cycle provided by additional lighting at a maximum of 600 μmol photons m−2 s−1. Once a week a nutrient solution (100 g of HortiMix Standard: NPK ratio 15‐7‐30 to 1L of solution contains 107 mmol of total water‐soluble N, 4.5 mmol P2O5 (w/w), 32 mmol total K2O (w/w), 4 mmol MgO (w/w), 0.04 mmol Fe‐EDTA, 0.18 mmol Mn, 0.28 mmol B, 0.04 mmol Zn, 0.03 mmol Cu, and 0.013 mmol Mo) (Hortifeeds, Lincoln, UK) was added when watering. Moisture content of the columns was maintained daily at 17% gravimetric moisture content by watering a constant amount of water per block based on the overall starting reference weight of the columns. Plants were grown for 49 days to assure sufficient growth of node 3 and node 4 roots. These nodes were selected because nodes 1 and 2 were too horizontally oriented to sufficiently interact with the compacted layer (more horizontal growth of earliest nodes has also been described by Araki, Hirayama, Hirasawa, & Iijima, 2000; York, Galindo‐Castañeda, Schussler, & Lynch, 2015).
2.1.3. X‐ray computed tomography
Soil columns were not watered 48 hr prior to computed tomography (CT) scanning to allow for enhanced contrast between the roots and soil matrix (Zappala et al., 2013). Each column was imaged using a v│tome│ × L (GE Measurement and Control Solutions, Wunstrof, Germany) X‐ray μCT scanner. Two scans (multiscan option) were taken per column (top and bottom) with a total scan time of 2 hr per column. The distance from the centre of the sample to the detector was 2,000 mm. X‐ray energy was set at 290 kV and the current was 2,700 μA. Filters were fitted to the X‐ray gun (1.5 mm copper, 0.5 tin) and detector (0.5 mm copper) to enhance the image quality. Image averaging was set at five images. The scanning resolution was 96 μm and 2,400 image projections were taken for each scan.
2.1.4. Image processing and analysis
Images were reconstructed at 32‐bit (Phoenix DatoS│×2 reconstruction tool, GE Sensing & Inspection Technologies GmbH, Wunstorf, Germany) with scan optimiation and beam hardening correction set at 8. The 3D image volumes were analysed in VGStudioMax 2.3 (Volume graphics Gmb, Heidelberg, Germany). The greyscale values of the two obtained volumes were equalized and scans were aligned and stitched together. An example of an image from CT scanning can be found in Figure 1. Nodes 1–4 were identified manually from 2D projections of the scans (Figure S1). Each plant was marked at the base of the stem with a thumbnail pressed into the stem prior to scanning which served as a reference point for labelling of each root axis (Figure 1a). For each node, all roots were labelled clockwise (observed from the above, yz‐projection plane) around the reference point. After labelling each root axis the polyline tool within VGStudioMAX was used to trace the roots from the root base downwards (Figure 1a). Polylining stopped either at the root tip or alternatively when the column wall or bottom of the column was reached. Whether roots reached and subsequently crossed the compacted layer was recorded. Distances along the root axis were measured during polylining to determine sectioning positions relative to the compacted layer along penetrating roots. Three sectioning points were located along each selected penetrating root axis; ‘before’, 1 cm above the compacted layer, ‘within’, 1 cm after penetrating the compacted layer and ‘after’, 1 cm after crossing the layer (Figure 1b). The polylines were also used for measuring root angle and rooting depth with Polyline Analysis Measurement Software (University of Nottingham, UK), an in‐house software developed specially to calculate root angle. Separate shorter polylines were drawn right above the compacted layer, tracing the root upward over a distance of 2 cm, to determine the angle at which the roots encounter the compacted layer (Figure S2). Rooting depth per column was taken as the average maximum depth of all roots up till their root tip or when they hit the column wall.
Figure 1.
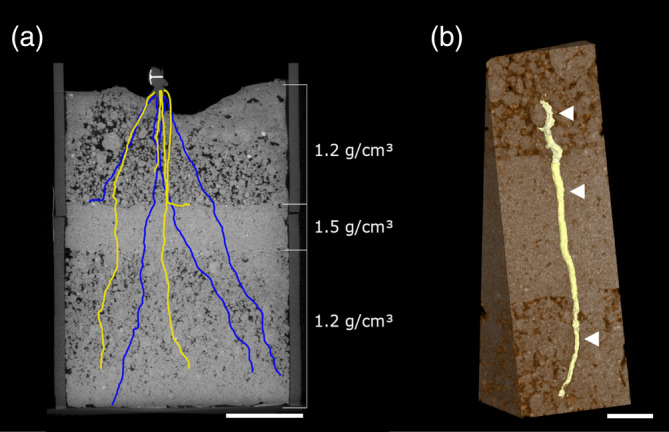
X‐ray CT images/reconstruction of (a) a root system encountering a compacted layer and (b) a root growing through the compacted layer. (a) Cross‐sectional view of a soil column in the xy‐plane with a compacted layer in between less dense layers. Blue and yellow lines represent the projection of the different polylines on the xy‐plane. Colours: yellow—node 4 and blue—node 3. Scale bar at 5 cm. (b) A 3D reconstruction of a segmented root growing through the denser layer. The white arrows represent the sectioning positions along the root axis (1 cm before, within and after the compacted layer). Scale bar at 1 cm [Colour figure can be viewed at wileyonlinelibrary.com]
2.1.5. Root harvest and sectioning for root anatomical phenes
Immediately after scanning, all soil columns were lifted out of the plastic columns, and roots were washed from the soil. The entire root system was extracted and stored in 75% ethanol (v/v) until sectioning. Penetrating roots of node 3 and node 4 were selected for sectioning based on polylining results and clipped from the entire root system. The length along each root axis was measured and sectioning positions were identified along the root axis of interest (Figure 1). Pieces of root containing the sectioning positions were excised out of the root axis and embedded by placing them into 3D printed moulds (Atkinson and Wells, 2017). 6% agarose (Sigma–Aldrich Co. Ltd, Gillingham, UK) at 39°C was used to fix the roots within the mould. A vibrating microtome (7,000 smz‐2) (Campden Instruments Ltd., Loughborough, UK) was used to section the roots within the agarose block at 200–230 μm thickness per slice (blade speed at 1.75–2 mm/s, blade frequency at 70 μm). Root sections were then incubated in calcofluor white (Sigma–Aldrich, Co. Lt, Gillingham, UK), 0.3 mg/ml for 90 s, rinsed with deionized water, and placed on a microscopy slide and covered by a coverslip. Cross‐sectional images (Figure 2) were obtained using an Eclipse Ti CLSM confocal scanning microscope (Nikon Instruments Europe B.V., Amsterdam, The Netherlands) with three excitation lasers. Images were collected using ×10 objective, all three image channels were combined. As entire cross sections did not fit the ×10 objective image space, multiple images per root section were obtained, taking care that part of each set of images overlapped. ICE software (Microsoft, Redmond, WA) was used to obtain one composite image per root section (camera motion set at planar motion). Image analysis for root anatomical phenes was conducted by creating object directories in objectJ (Vischer & Nastase, 2009), a Fiji plug in (Schindelin et al., 2012) according to Vanhees et al. (2020) with an additional directory for xylem vessel area. Abbreviations of root anatomical phenes can be found in Table 1.
Figure 2.
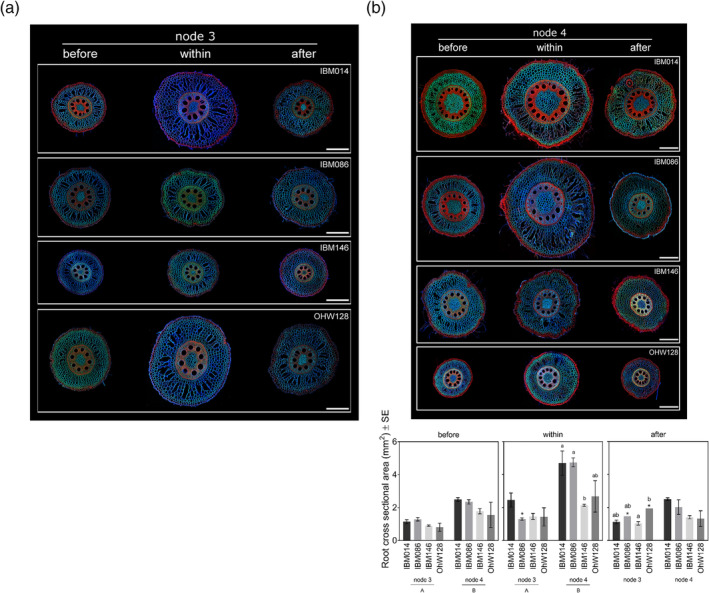
(a) Typical images of sections taken along the same root axis from node 3 and node 4 (see continued figure) for each genotype. Before, within and after indicate the root axis position where the roots were sectioned in relation to the compacted layer. All images are at the same scale, scale bar at 500 μm. (b) Root cross‐sectional area for both nodes and four genotypes before, within and after the compacted layer. Differences between nodes (capital letters, p ≤ .001) and between genotypes within respective nodes (lower case letters, p ≤ .05) were calculated by Tukey comparisons. Genotypes indicated by * had a limited amount of sections due to the limited amount of roots able to cross the compacted layer. Where no letters are shown, no significant differences were found between nodes or genotypes within nodes [Colour figure can be viewed at wileyonlinelibrary.com]
Table 1.
Root anatomical phenes and their abbreviations. All phenes were measured according to Vanhees et al. (2020)
| Abbreviation | Root anatomical phenes | Unit |
|---|---|---|
| RCSA | Root cross sectional area | mm2 |
| TSA | Total stele area | mm2 |
| TCA | Total cortical area | mm2 |
| CF | Cell file number | ‐ |
| IN | Cell size—inner cortical region | μm2 |
| MID | Cell size—middle cortical region | μm2 |
| OUT | Cell size—outer cortical region | μm2 |
2.2. Experiment 2: Radial expansion is driven by ethylene
2.2.1. Plant material and growing conditions
Seeds from four genotypes (IBM086, IBM146, IBM014, and OhW128) were surface sterilized in 3% DI water in sodium hypochlorite (v/v), rolled into tubes of germination paper (76 lb, Anchor Paper, St. Paul, MN), and placed in a dark chamber at 28°C for 4 days in beakers containing 0.5 mM CaSO4. Beakers containing germinating seedlings were placed under a fluorescent light (350 μE m−2 s−1) at 28°C for 1 day before transplanting to an aerated solution culture. Three randomly assigned seedlings from each genotype were transplanted in foam plugs suspended above each 38 L solution culture tank. The solution culture tank contained per litre: 3 mmol KNO3, 2 mmol Ca(NO3)2, 1 mmol (NH4)2HPO4, 0.5 mmol MgSO4, 50 mmol Fe‐EDTA, 50 mmol KCl, 25 mmol H3BO3, 2 mmol MnSO4, 2 mmol ZnSO4, 0.5 mmol CuSO4, and 0.5 mmol (NH4)6Mo7O24. The pH was adjusted daily to 5.5 using KOH and the solution was completely replaced every 7 days. Plants were grown for 30 days in a climate chamber. During the growth period, the mean minimum and maximum air temperatures were 26 ± 3 and 30 ± 3°C, respectively with maximum illumination of 800 μmol photons m−2 s−1 and average relative humidity of 40%.
2.2.2. Ethylene application
Three replicates of all four genotypes (i.e., each 38 L tank) were exposed to one of four different treatments (a) root zone air application (control), (b) root zone ethylene application (dose 1), (c) root zone ethylene application (dose 2), and (d) root zone 1‐MCP (ethylene inhibitor) application, all applied continuously beginning at seedling transfer to solution culture. Solution culture tanks in the control treatment were bubbled at 10 ml min−1 with ambient air in 38 L of solution culture. In the ethylene treatment (dose 1), compressed ethylene (1 ml L−1 in air, as used by [Gunawardena, Pearce, Jackson, Hawes, & Evans, 2001]) was bubbled through 38 L of solution culture at 10 ml min−1. In the ethylene treatment (dose 2), compressed ethylene (1 ml L−1 in air) was bubbled through 38 L of solution culture at 20 ml min−1. For the 1‐MCP treatment, 1‐MCP (SmartFresh, ~3.8% active ingredient, AgroFresh, USA) was volatilized by dissolving 0.17 g in 5 ml water in a glass scintillation vial, and then transferred into a 2‐L sidearm flask. An open‐cell foam plug enclosed the mouth of the flask, and the headspace containing 1‐MCP gas was bubbled through 38 L of solution culture at a rate of 10 ml min−1. The air pump ran continuously, and the 1‐MCP was replenished daily into the sidearm flask. There was no significant effect of flow rate on headspace ethylene concentrations, which ranged from 0.78 to 1.58 μl L−1 with a mean of 1.15 μl L−1, therefore the results of ethylene treatments were combined in a single mean. After 30 days of growth, plants were sampled. Third and fourth whorl nodal roots from each plant were sampled 5–8 cm from the base of the plant and preserved in 75% EtOH (v/v) for further anatomical analysis.
2.2.3. Laser ablation tomography and evaluation of root anatomy
Root anatomy was imaged using laser ablation tomography (LAT) (Hall, Lanba, & Lynch, 2019; Strock et al., 2019) In brief, a pulsed UV laser is used to vaporize the sample at the camera focal plane and simultaneously imaged. Imaging of root cross‐sections was performed using a Canon T3i camera (Canon Inc. Tokyo, Japan) and ×5 macro lens (MP‐E 65 mm). Two images for each root sampled were collected for phenotypic analysis. Six anatomical phenes (Table 1) on every image were measured using objectJ (Vischer & Nastase, 2009) and a Fiji plug in (Schindelin et al., 2012) according to Vanhees et al. (2020).
2.3. Statistical analysis
For experiment 1, the number of replicates obtained per genotype and node varied as one plant (genotype OhW128) died during the 49 day growth period. Hence, for nodes 3 and 4 only four replicates were considered for this genotype. For genotype IBM014, node 4 roots were underdeveloped (<0.5 cm long, observed during washing) at sampling, therefore we only obtained four replicates for this measurement. Additionally, not all genotypes were equal in crossing the compacted layer, hence some genotypes have fewer replicates at the within and after the compacted layer sectioning positions. Both the effect of blocking and interaction effects were tested, when not significant they were omitted from the analysis. Factorial regression was used to assess the effect of different factors on root counts. A Poisson distribution was used followed by post‐hoc Tukey comparisons to compare factor levels. Correlations between root angle and count data were calculated using a Spearman‐Rank correlation. Penetration %s were calculated per node as the ratio of the number of roots that crossed the layer to the number of roots that reached the layer (multiplied by 100%). Root thickening was defined as the increase of overall root cross‐sectional area and an ANOVA was used to identify the effect of factors genotype and node. Anatomical changes were similarly assessed by ANOVA that included factors genotype, node and sectioning position on root cross‐sectional area, total stele area, total cortical area, and cell file number. The same factors were used with the addition of the cortical region for the ANOVA on cell size. Tukey comparisons were carried out between nodes, between genotypes within nodes, and between sectioning positions for root cross‐sectional area. For cortical cell size and cell file number, Tukey comparisons were used to identify differences between sectioning positions. The increase of cell size was calculated for the different cortical regions and for the different nodes. For experiment 2 average cortical area, stele area and cell file number were assessed by ANOVA and Tukey comparison identified differences between ethylene, 1‐MCP, and control treatments. Root anatomical measurements were compared between the two experiments and differences across treatments were assessed by Tukey comparison. Correlations between cortical cell size obtained from both experiments were calculated.
3. RESULTS
3.1. Experiment 1: Anatomical changes within a root axis crossing a compacted layer
3.1.1. Steeper roots were more likely to reach the compacted layer
Although the same number of roots were formed per node irrespective of genotype or node (Figure 3a, Table 2) the number of roots reaching the compacted layer varied among genotypes. Within a node, the number of roots reaching the compacted layer was not different among genotypes (Figure 3a). However, significantly fewer roots reached the compacted layer for node 3 roots of genotype IBM086 in comparison with node 4 roots of genotype IBM146 (Figure 3a). The number of roots reaching the layer was only significantly different from the number of roots crossing the layer for node 4 roots of IBM086 (Figure 3b). Younger nodes (node 4) were steeper than older nodes (node 3) (Figure 4a) and root angle was correlated with the number of roots that reach the compacted layer (Spearman's rank correlation r = 0.53) (Figure 4b). Root angle itself was node and genotype‐dependent (Table 2B) and steeper root angle was associated with improved penetration %s (Figure 4c). IBM086 had the most shallow‐angled roots (Figure 4a), which led to node 3 roots hitting the column‐wall before reaching the compacted layer.
Figure 3.
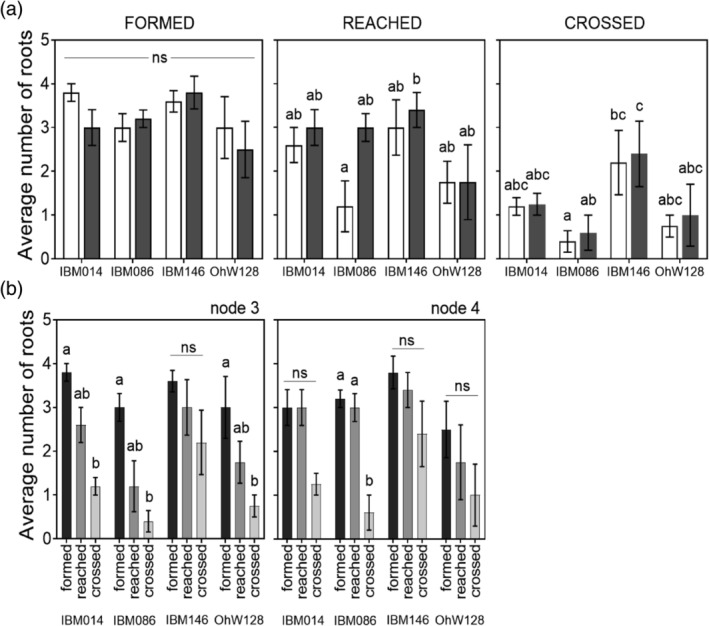
(a) Root counts at different locations with respect to the compacted layer. Bars in white are root counts for node 3, bars in grey are root counts for node 4. Differences in root counts between nodes and genotypes were assessed with Tukey comparisons (p ≤ .05). (b) Root counts per node and genotype on different locations with respect to the compacted layer. Differences between root counts within a panel are shown by different letters, based on a Tukey comparison (p ≤ .05) within node and genotype combinations. ns stands for non‐significant
Table 2.
(A) Factorial regression for the total number of roots per node and (B) root angle for node 3 and 4 roots
| Total number of roots | |||
|---|---|---|---|
| Factor | Deviance | p (> chi) | |
| A | Position | 35.47 | 1.99E‐08*** |
| Genotype | 12.40 | 6.14E‐03** | |
| Node | 0.80 | 0.44 | |
| Root angle | |||
|---|---|---|---|
| Factor | F‐value | p‐value | |
| B | Genotype | 5.39 | 4.06E‐03*** |
| Node | 17.45 | 2.12E‐04** | |
Note: The variable ‘position’ refers to the number of roots counted before the compacted layer, within the compacted layer and after the compacted layer. Significance at **p ≤ .01 and ***p ≤ .001.
Figure 4.
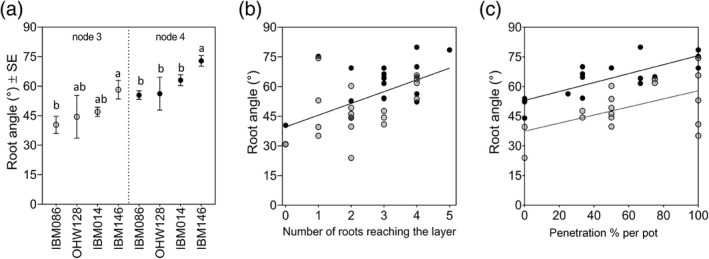
Root angle is different between nodes and determines if roots reach the compacted layer, with steeper roots having greater penetration %s. (a) Mean ± SE for different genotypes per node. (b) Correlation between root angle and the number of roots reaching the layer. Correlations were tested with a Spearman rank correlation (r = 0.5318, p = .0007). (c) Linear relationships between root angle and the penetration % for each column in the study. Significant R 2 values of 0.41 (p = .0056) and 0.56 (p = .005) for node 3 and node 4, respectively. For all figure panels, node 3 data are visualized in grey and node 4 data in black. Differences in root angle between genotypes were assessed with Tukey comparisons (p ≤ .05)
3.1.2. Genotypes differed in their ability to penetrate a compacted soil layer
The number of roots crossing the compacted layer varied among genotypes (Figure 3a). IBM146 had more roots crossing the compacted layer (Figure 3a) in comparison with IBM086 where roots did not fully reach the compacted layer (node 3) or did not cross the compacted layer (node 4). Higher percentages of roots grew into the layer than across it (Table 3). When roots did not grow into the compacted layer, they either buckled or deflected at the layer (Figure S3). When roots buckled, swelling of the root tip was observed. Penetration percentages varied among genotypes (Table 3), and penetration % was greater when roots were steeper at the crown (Figure 4c). No differences were found between nodes for average root angle right above the layer, however, steeper root angles at this position were associated with greater penetration % (Figure 5). The average rooting depth of nodal roots depended on the node, and the overall roots of node 3 were shallower than the roots of node 4 (Figure 6). Roots of genotype IBM146 grew to the greatest depth for both nodes (Figure 6) and were the steepest (Figure 4a).
Table 3.
Penetration %s ± SE per genotype for roots that reached the layer
| Genotype | Inside the layer | Across the layer | ||
|---|---|---|---|---|
| Node 3 | Node 4 | Node 3 | Node 4 | |
| IBM014 | 78% ± 10b | 50% ± 7b | 47% ± 3a | 44% ± 9a |
| IBM086 | 72% ± 11b | 47% ± 20b | 50% ± 22a | 20% ± 13a |
| IBM146 | 95% ± 5a | 93% ± 7a | 60% ± 17a | 67% ± 16a |
| OhW128 | 79% ± 13ab | 67% ± 29ab | 58% ± 25a | 58% ± 26a |
Note: Penetration %s can be seen as initially growing inside the layer or roots that were able to fully cross the layer. Letters show the differences between treatments assessed by Tukey comparisons within node‐genotype‐compaction layer combinations (p ≤ .05).
Figure 5.
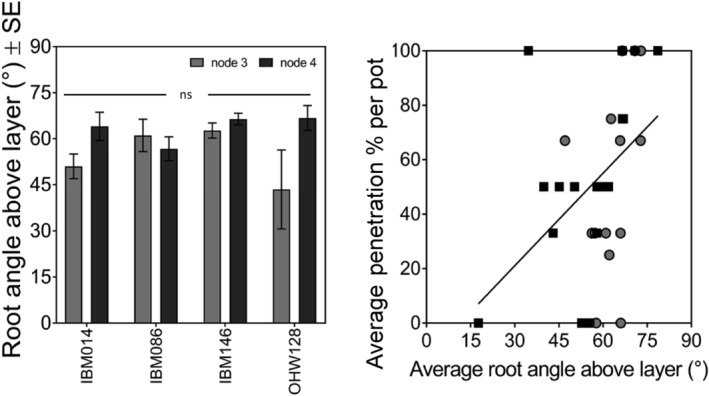
The average angle at which the roots approach the layer for node 3 and node 4 is the same Tukey comparison (p ≤ 0.05), while individual root angle significantly (p = .02, R2 = 0.25) influences penetration % per root. Node 3 data in grey and node 4 data in black. ns stands for non‐significant
Figure 6.
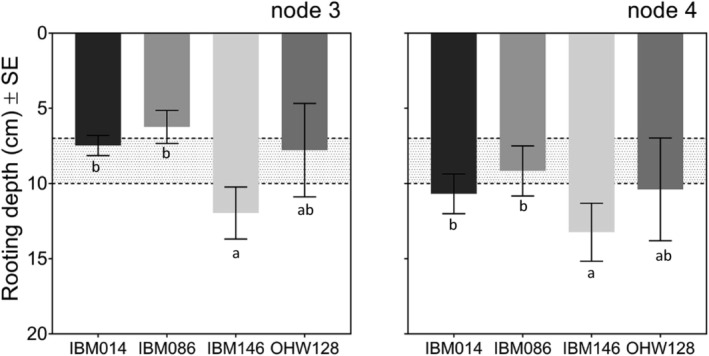
Average rooting depth (cm) ± SE per node and genotype, averaged for each replicate. Depth was calculated including all roots. If roots hit the column wall depth was recorded as the depth at which they hit the column wall. The greater bulk density layer was located at 7–10 cm depth and depicted by the dotted lines and grey area on the graph. Differences among genotypes within a panel were calculated by Tukey comparisons within nodes (p ≤ .05)
3.1.3. Radial expansion in response to impedance was dependent on genotype and nodal position
Root cross‐sectional area was affected by the root node, genotype, and sectioning position (Table S1, Figure 2). The older node (node 3) had significantly smaller root cross‐sectional areas than the younger node (node 4) at sectioning positions before and within the compacted layer (Figure 2). However, root cross‐sectional areas of roots from the two nodes after crossing the compacted layers were not significantly different (Figure 2b). Most genotypes thickened when crossing the compacted layer (Figure 2). Radial expansion was affected by genotype, node, and their interaction (Table 4). The average number of roots that crossed the compacted layer for both nodes of IBM086 and OhW128 was less than 1, hence caution should be taken interpreting the thickening of these root axes. Roots from node 4 of genotype IBM014 and IBM086 thickened more than those of IBM146 (Figure 2b). Thickening was absent for IBM146 node 4, since root cross‐sectional area from the ‘before’ and ‘within’ the compacted layer sectioning positions were not significantly different (Figure 2). After roots crossed the compacted layer, root cross‐sectional areas returned to similar dimensions seen at the ‘before the compacted layer’ sectioning position (Figure 2b).
Table 4.
ANOVA results for radial expansion (i.e., absolute increase in root cross‐sectional area), measured as an increase in root cross‐sectional area, in response to mechanical impedance
| Radial expansion | ||
|---|---|---|
| Factor | F‐value | p‐value |
| Node | 9.23 | 5.36E‐03** |
| Genotype | 4.67 | 9.70E‐03** |
| Node:Genotype | 3.02 | 4.80E‐02* |
Note: Significance levels at ***p ≤ .001, **p ≤ .01, *p ≤ .05.
3.1.4. Root thickening is more related to the expansion of the cortex than the stele
Root cross‐sectional area, total cortical area and total stele area were dependent on node, genotype, and sectioning position (Table S1). Thickening was due to increased cortical and stele areas (Figure S4, Table S2), which were correlated (Figure S5) However, there was no significant increase in stele area of node 4 roots of IBM014; this genotype thickened after encountering the compacted layer due to cortical area increase (Figure S4). Overall, the cortical tissues expanded more than the stele (Figure S4, Table S2) and the cortex has more area overall.
3.1.5. Cortical expansion is due to cellular size changes and not cell file changes
Cell size varied across the cortex (Table S1). The middle cortical cells had the largest cell sizes, surrounded by outer and inner cells with smaller cell sizes (Figure S6). Cortical cell size was also dependent on nodal position, genotype, and sectioning position in relation to the compacted layer (Table 4, Figure S6). Cortical cell sizes from all cortical regions increased for those genotypes that thickened within the compacted layer (Figure S6, Table 5), while for IBM146 (node 4), there was no thickening and cell size remained constant (Figure S6). For OHW128, there was no significant increase in cell size in any part of the cortex (Figure S6). Cell sizes below the compacted layer were similar to those above the layer (Figure S6). For thickening genotypes, the outer cortical cells had a greater relative cortical cell size increase than the inner and middle cortical cells (Table 5). Despite this greater relative increase in cell size, the outer cortical cells remained smaller than the middle cortical cells at all sectioning positions (Figure S6).
Table 5.
Fold increase of cell size either due to growth in the compacted layer (experiment 1) or exposure to ethylene (experiment 2)
| Experiment 1—Soil compacted layer | ||||||
|---|---|---|---|---|---|---|
| Node 3 | Node 4 | |||||
| Genotype | Outer | Middle | Inner | Outer | Middle | Inner |
| IBM014 | 2.28 | 1.97 | 1.77 | 5.48 | 2.78 | 2.14 |
| IBM086 | 1.56 | 1.32 | 1.23 | 3.19 | 2.35 | 2.24 |
| IBM146 | 1.80 | 1.90 | 1.81 | 1.46 | 1.43 | 1.30 |
| OhW128 | 2.24 | 2.17 | 1.74 | 3.73 | 3.23 | 2.54 |
| Experiment 2—hydroponics | ||||||
|---|---|---|---|---|---|---|
| Node 3 | Node 4 | |||||
| Genotype | Outer | Middle | Inner | Outer | Middle | Inner |
| IBM014 | 2.32 | 2.45 | 2.46 | 1.89 | 1.89 | 1.91 |
| IBM086 | 1.09 | 1.05 | 1.08 | 2.03 | 2.05 | 2.09 |
| IBM146 | 1.63 | 1.62 | 1.60 | 2.29 | 2.27 | 2.37 |
| OhW128 | 1.99 | 2.06 | 2.04 | 1.38 | 1.42 | 1.43 |
Note: Data is depicted according to the cortical area (outer, middle, and inner) and genotype for node 3 and node 4.
Cell file number was significantly different among nodes and genotypes (Table S1). Each genotype had fewer cell files for node 3 than for node 4 (Figure S7). Cell file numbers were not significantly different among sectioning positions along the root axis with respect to the compacted layer (Table S1). For all genotypes, the cell file number remained stable when crossing the compacted layer (Figure S7). Therefore, radial expansion was due to increased cell size rather than an increased cell file number.
3.2. Experiment 2: Ethylene caused radial expansion
In the second experiment, ethylene‐induced radial thickening was node‐dependent. The application of ethylene increased the cortical area in some cases but did not affect the stele area (Figure 7). Node 3 roots of IBM014 had the greatest increase (123%) in the cortical area in comparison with node 3 roots of other genotypes. Node 3 roots of IBM086 had no significant changes in the cortical area with ethylene treatment (Figure 7). The cortical area of node 3 but not node 4 roots increased significantly with ethylene application for genotypes IBM014 and IBM146 while the opposite was true for IBM086 (Figure 7). Treatment with 1‐MCP had no significant effect on cortical or stele area (Figure 7). Since 1‐MCP blocks the effect of ethylene it can be assumed that control roots were not responding to endogenous ethylene. The lack of effect was not due to inadequate concentrations of 1‐MCP, since 1‐MCP treated plants showed reduced root length and greater lateral branching densities in comparison with control and ethylene treatments (Figure S8).
Figure 7.
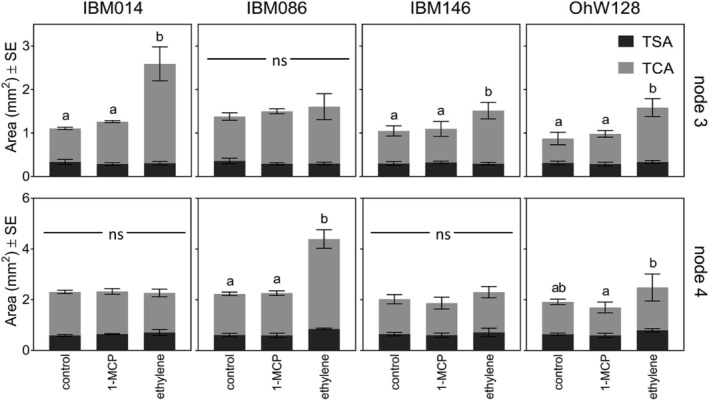
Average cortical area and stele area ± SE of root cross sections under ethylene, 1‐MCP, and air treatments per node and genotype. Total cortical areas (TCA) are shown in light grey and total stele area (TSA) are shown in dark grey. No significant differences were found in the stele area. Lower case letters were used to identify differences among cortex areas within node and genotype according to Tukey's test (p ≤ .05). Where no letters are shown, differences between treatments were non‐significant
3.3. Comparing soil and ethylene results
Root swelling responses in independent impedance (experiment 1) and ethylene treatment (experiment 2) experiments were similar (Figures 8 and 9). Root cross‐sectional area observed at the sectioning position before the compacted layer (experiment 1) was similar to the root cross‐sectional area observed under control conditions in the ethylene experiment (experiment 2), across all genotypes and node combinations (Figure 8). In three of the four cases where root cross‐sectional area increased in the compacted layer (in experiment 1) it also increased with ethylene exposure (experiment 2). Node 4 roots of IBM014 thickened in the compacted layer but did not increase root cross‐sectional area in response to ethylene (Figure 8a,b).
Figure 8.
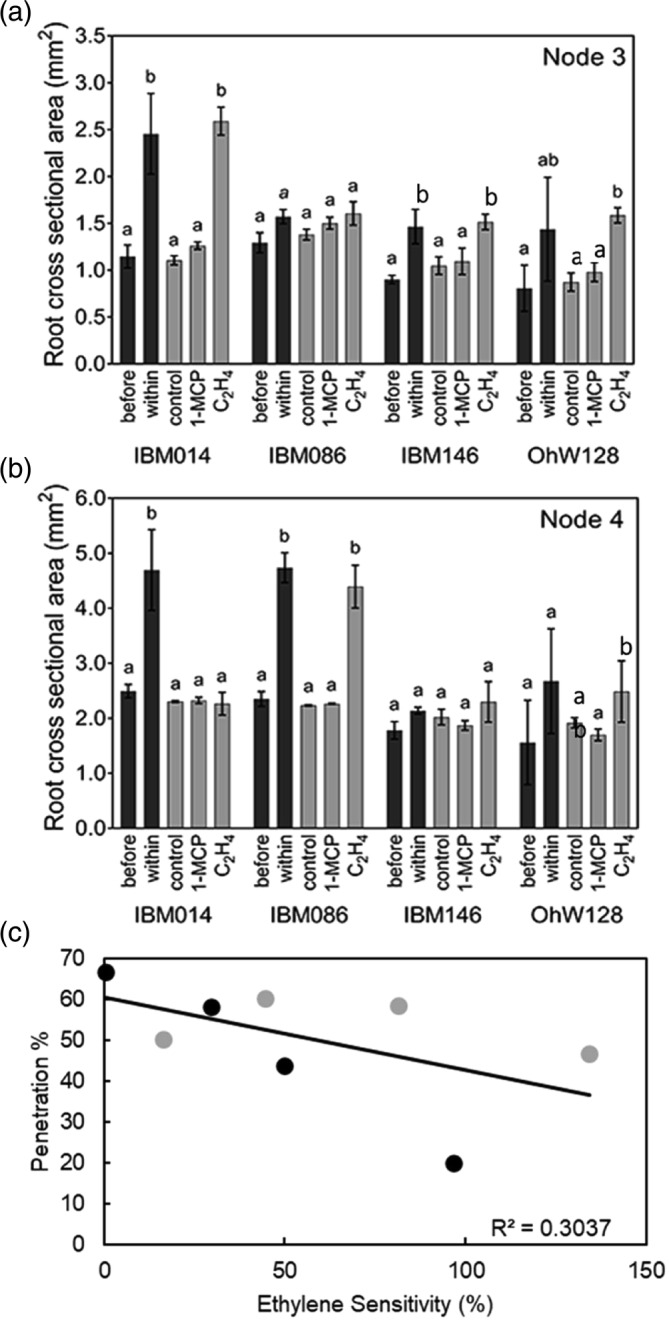
Comparison of root cross‐sectional area ± SE of experiment 1 (before and within compacted layer: black columns) and experiment 2 (control vs. ethylene vs. 1‐MCP, grey columns) for the different genotypes and nodes in (a) node 3 and (b) node 4. Letters show the differences between treatments assessed by Tukey comparisons within node‐genotype‐experiment combinations (p ≤ .05). Cursive mean separation letters indicate when replicating numbers dropped for IBM086 to n = 2. (c) Correlation between penetration % and ethylene sensitivity. Each point represents the average for each genotype. Black circles were used for data of node 3 and grey circles for data of node 4. Ethylene sensitivity was calculated as the relative increase in root‐cross sectional area between the ethylene and control treatments. *** Level of significance at p ≤ .001
Figure 9.
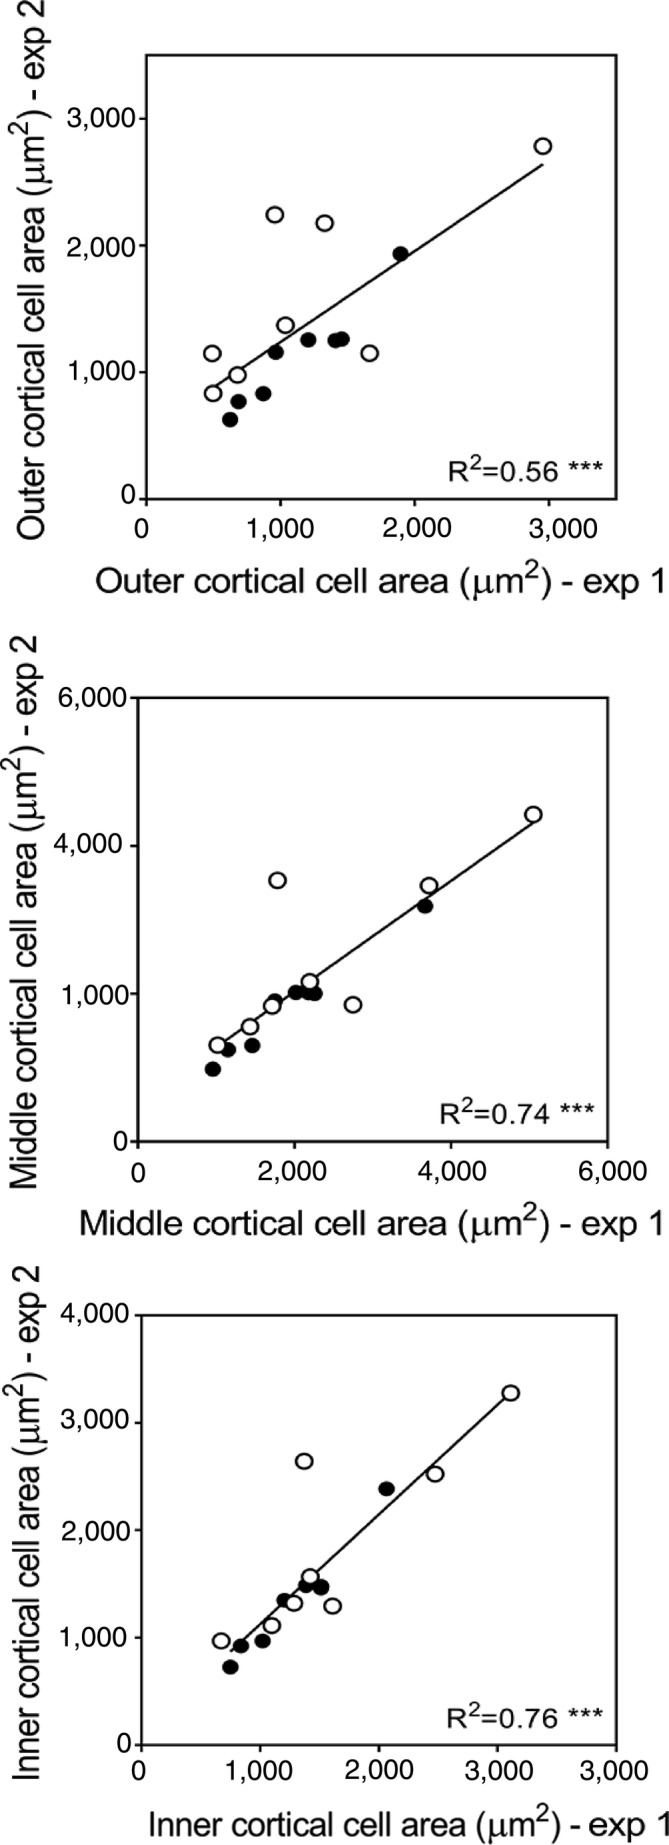
Correlation between cell size from different cortical regions of experiment 1 (column trial in soil) and experiment 2 (grown hydroponically). Each point represents the average cell area of a genotype for paired data of both experiments. Paired data is either ‘before the layer’ with control or ‘within the layer’ with ethylene treatment. Black circles were used for data of node 3 and white circles for data of node 4. *** Level of significance at p ≤ .001
In a few cases, there was no compaction‐induced thickening, but ethylene increased one of the thickness‐related metrics. In IBM146 and OHW128 node 4, there were no diameter increases with compaction or with ethylene but there were significant differences in cortical cell size with ethylene (Figures S9 and S10). In OHW128 node 3, there was no significant compaction‐induced thickening but there were ethylene effects on all the thickness‐related metrics. In this case, the variation in response to the compaction layer made it difficult to detect any compaction‐induced thickening (Figure 8a,b, Tables S2 and S3).
Average cell size of genotypes grown in the hydroponics experiment was strongly correlated with the cell size of those grown in soil (Figure 9, Table S4). The relationship between the soil and hydroponics experiments is stronger for node 3. Average cell size is slightly greater for node 4 roots across the entire cortex. The greatest increase in cell size in response to both ethylene (Figure S10) and within the compacted layer (Figure S6) occurred in IBM014 for node 3 roots and IBM086 for node 4 roots.
4. DISCUSSION
Thickening of a root axis upon experiencing mechanical impedance has been linked to ethylene‐induced radial expansion (Moss et al., 1988; Pandey et al., 2021; Sarquis et al., 1991). Since root thickening relieves stress on the root tip (Bengough et al., 2006), it is often assumed that radial expansion will help roots to penetrate hard soil layers. In contrast to this expectation, in this study, we observed that genotypes that showed less radial expansion in the compacted soil were better able to cross a compacted layer and attained greater rooting depth than genotypes with greater radial expansion (Figures 2, 6 and 8c). Likewise, within genotypes, the number of roots crossing the compacted layer was not significantly different between nodes (Figure 3a, Table 3) even though node 4 roots were thicker (Figure 2). These results add mechanistic support for the observation that there is no relation between root thickening and rooting depth of maize lines grown in compacted soil in the field (Vanhees et al., 2020). Furthermore, ethylene may be related to genetic variation in radial thickening in response to impedance since most genotypes showed similar anatomical responses to mechanical impedance conditions and exogenous ethylene application.
4.1. Root thickening was driven by cortical cell size expansion rather than an increased cell file number
Radial expansion in the compacted layer was mainly due to cortical expansion and, to a lesser extent, expansion of the stele (Figure S4). Stele area increased or remained unchanged under impedance, depending on genotype and node (Figure S4). Lupin roots grown under impeded conditions maintained stele dimensions (Atwell, 1988; Hanbury & Atwell, 2005), while barley, maize, rice, pea, and cotton roots showed increased stele diameters under impedance, though to a lesser extent than increases in the cortex (Iijima et al., 2007; Wilson et al., 1977). Since the stele tissue is completely enclosed by the cortical tissue, the radial expansion might be more constrained due to internal pressures from surrounding tissues restricting radial expansion. Alternatively, the cortex could simply be more plastic than the stele in its response to its local environment. Cortical tissues traits are responsive to other stresses (Chimungu, Brown, & Lynch, 2014a, 2014b; Galindo‐Castañeda, Brown, & Lynch, 2018; Saengwilai, Nord, Chimungu, Brown, & Lynch, 2014; Schneider et al., 2020), which illustrates the plasticity of this tissue. Large increases in stele diameter could have important functional consequences since xylem vessel areas are correlated with stele area (Burton et al., 2015; Uga et al., 2009; Uga, Okuno, & Yano, 2008). Increases in xylem vessel diameter in response to compaction were found in maize and pea (Iijima et al., 2007). In this study, there was a significant increase in mean xylem vessel area within the compacted layer in node 4 of genotypes IBM014 and IBM086 (Figure S11). How these changes affect water transport remains to be investigated.
Genotypic differences in anatomical response to mechanical impedance have only been studied in a few cases including in wheat (Colombi et al., 2017; 2019) and maize (Chimungu et al., 2015; Vanhees et al., 2020). Iijima et al. (2007) showed that the cortical thickness of maize increased more than the stele diameter in response to mechanical impedance. Cortical changes due to impedance have been attributed to (a) increased cortical cell size (Atwell, 1988; Hanbury & Atwell, 2005; Veen, 1982) or (b) increase in both cell file number and cell size (Colombi et al., 2017; Croser et al., 1999; Iijima et al., 2007). In these studies, different plants exposed or not exposed to impedance were used to obtain root axes for their observations. This would introduce additional uncertainty about cell file number changes. We observed that cortical thickening is due to cell diameter increases, while cell file number remained stable along the root axis (Figures S6 and S7).
Why roots thicken by cell size expansion rather than by increasing their cell file number merits further study. Cortical cell expansion might be more energy‐efficient, since fewer, larger cortical cells would incur less cell wall construction cost and less metabolic cost per cell due to a proportionately greater volume of the vacuole (Chimungu et al., 2014a; Lynch, 2013). In a recent study of 16 wheat genotypes, the energy costs of root elongation increased as impedance increased, but genotypes with greater cortical cell diameters were more energy‐efficient (Colombi et al., 2019). Reduced metabolic costs assist with soil exploration since the conserved resources can be reallocated to root elongation or proliferation (Lynch, 2015; Lynch & Wojciechowski, 2015). In addition, a change in cell size may be easier and quicker to achieve than a cell file number change which would entail meristematic reorganization.
Cortical cell size varied across the cortex (Figure S6) and outer cell layers expanded to a proportionally greater extent than other layers in the compacted layer (Table 5). For wheat and maize, greater outer cortical cell expansion has been reported in response to mechanical impedance (Veen, 1982; Wilson et al., 1977). Expansion of outer cortical layers may be less constrained by internal pressure from surrounding cells (Bengough et al., 2006; Veen, 1982).
4.2. Steeper root growth angles were associated with greater penetration of a compacted layer
Steeper root angles allowed roots to reach the compacted layer within this column system since less root elongation was needed to reach the layer. Roots that were steeper‐angled, as measured at the crown, also penetrated the hard layer more readily (Figure 4c). When the angle immediately above the compacted layer was measured, a similar but weak relationship was found between root angle and penetration % (Figure 5). These relationships occurred despite the fact that we were only able to sample a small range of root angles because shallow‐angled roots that hit the column wall rather than the compacted layer could not be sampled. Previous research has indicated that the stronger the soil, the greater the benefit of near‐vertical (perpendicular) angles of the root tip with respect to the compacted soil (Jin et al., 2013).
4.3. Root thickening responses to compaction and ethylene are similar
Ethylene appears to be involved in the radial thickening response since the genotypic variation in ethylene‐induced thickening was correlated with the variation in impedance‐induced thickening (Figure 8a,b). Impeded roots produce more ethylene than non‐impeded controls (He, Finlayson, Drew, Jordan, & Morgan, 1996; Moss et al., 1988; Sarquis et al., 1991), and recent work has demonstrated that compacted soil restricts ethylene diffusion, causing localized ethylene accumulation around the impeded root (Pandey et al., 2021). Root cross‐sectional area measured on roots above the compacted layer (experiment 1) and those under control and 1‐MCP treatments (experiment 2) were comparable (Figure 8a,b). 1‐MCP blocks ethylene perception, and the concentration used here significantly affected root length and branching density (Figure S8). It can therefore be assumed that the thickness of roots growing through less impeding soil (before and after the compacted layer) was not significantly limited by ethylene. However, within the compacted layer, increased ethylene signalling leads to increased root diameter.
In this study, we measured anatomical phenotypes of segments of roots sampled before, within, and after passing through the compacted soil. We did not measure anatomical features of roots growing into a compacted layer. The process of root penetration is dynamic and capturing radial thickening at the interface of a compaction layer would require a detailed time‐course study. In addition, while we observed root tip swelling after root bucking, we would not expect to observe ethylene‐induced radial thickening responses at the root tip, but rather behind the root tip in the zone of differentiation. Further studies are required to determine the temporal and spatial dynamics of root thickening in response to compaction.
We found a correlation between the thickening of roots in the compacted layer and ethylene‐induced root thickening. Roots thickened in the compacted layer in both nodes of IBM014, one node each of IBM086 and IBM146, and not detectable in OHW128, though the variance was high for this genotype (Figure S4 and Figure 8). In each case of thickening, there was a corresponding increase in cortical cell size (Figure S6). In three of the four cases where thickening occurred in the compacted layer, we also observed ethylene‐induced thickening and increases in cortical cell size (Figures 7 and 8, Figure S10). The exception, IBM014 node 4, did not display ethylene‐induced increases in cross‐sectional or cortical area but did have increased cortical cell size. Cortical cell sizes were highly correlated between the experiments (Figure 9). The results suggest ethylene‐induced root thickening may be node‐specific as well as genetically variable. Recent studies have demonstrated root anatomy and architectural traits are node specific and may be under distinct genetic control (Schneider et al., 2021; Schneider et al., 2021; Schneider, Yang, Brown, & Lynch, 2021; Yang, Schneider, Brown, & Lynch, 2019).
Ethylene‐induced root thickening is associated with reduced elongation rates (Bengough & Mullins, 1991; Croser et al., 2000) through the reduction of cell length and cell flux out of the meristem (Croser et al., 1999). Ethylene reduces the number of meristematic cells, which reduces meristem length (Barlow, 1976). Ethylene also increases radial expansion, resulting in less root elongation (Sarquis et al., 1991). In this study, root elongation rates were not measured, though low concentrations of ethylene reduced total root length in only one genotype and slightly increased it in two genotypes (Figure S8). In a recent study using ethylene‐insensitive mutants of Arabidopsis and rice, ethylene signalling mutants had slower primary root elongation rates than wildtype plants in uncompacted medium, but root growth of the mutants was unaffected by compaction (Pandey et al., 2021). Our study suggests that there is natural variation in root thickening in response to ethylene, and that less sensitive roots can maintain root elongation under impeded conditions, enabling them to attain greater rooting depth and potentially allowing better access to water and nutrients in deep soil strata.
Positive effects have also been attributed to root thickening. For instance, thickening reduces the stress on the root tip (Kirby & Bengough, 2002) and thicker roots buckle less (L. J. Clark et al., 2008; Whiteley et al., 1982). Thickening of roots might be beneficial on small scales or for localized impeded conditions. In order for roots to penetrate harder soil clods/aggregates or to penetrate through a biopore wall, usually only a small distance of impedance needs to be overcome. However, the effect of thickening and reduced elongation rate clearly leads to reduced root length and diminished soil exploration by the affected root axis. We observed swollen root tips on those roots that buckled when encountering the compacted layer but failed to penetrate it. These results are in accord with the observation that root thickening was not associated with the rooting depth of maize lines on compacted soils in the field (Vanhees et al., 2020). We propose the negative effects of ethylene will increasingly overrule the positive with increasingly thick layers of compacted soil.
Moss et al. (1988) found ethylene reduced primary root length further the longer it was applied. Under prolonged impeded conditions, ethylene, as a stress signal, could potentially inform the plant to alter its growth by compensatory root growth mechanisms. The compacted layer in this research was designed to mimic the spatial abruptness of a plough pan, which could induce different anatomical responses than when a root axis has experienced impedance for a longer time. How prolonged exposure to impedance, for instance when growing through compacted soil instead of a hardpan, changes root anatomy and root architecture within a whole root system and how this differs from the current experimental system remains to be investigated. We observed anatomical phenotypes recovered once the root had passed the compacted layer. Similarly, root elongation rates of barley were restored after 3 days when transferred from impeded conditions in ballotini to unimpeded growth in solution (Goss & Scott, 1980) and pea roots experienced reduced elongation rates for 48 hr after transferring to hydroponics from sand cores after which the former elongation rate was restored (Croser et al., 2000). Assuming that under unimpeded conditions these roots can elongate more than 1 cm per day, (Bengough et al., 2011; Croser et al., 2000) we saw that the residual effect of impedance in soil was less pronounced than in other studies. Ethylene production rates can rapidly increase and decrease upon application of mechanical impedance (Sarquis et al., 1991). Exposure to higher ethylene concentration could also cause more pronounced residual effects on root thickening since higher ethylene concentrations induce longer recovery time (Sarquis et al., 1991). Under our experimental conditions, the change in soil penetration resistance was 0.35 MPa, and so less than in most other studies. It would therefore be reasonable to assume that a short‐term ethylene signal would be generated, after which roots quickly return to their original radial dimensions. It is also likely that roots will have experienced a range of physical stresses within the compacted layer, as the soil dried and then was re‐wet, following watering. This may have significantly increased the degree of mechanical impedance when the soil was drier, and perhaps even permitted transient hypoxia following rewatering.
We suggest that ethylene functions as a stop signal for root growth when axial roots become impeded (Pandey et al., 2021). When larger volumes of impeded soil cause a prolonged production of ethylene and its retention in constricted soil porosity, that is, reduced pore connectivity, this will signal axial root growth to stop. Upon this signal, root growth in the lesser impeded areas, or adjustments to above‐ground plant growth might become upregulated.
5. CONCLUSIONS
Root thickening within a compacted layer varied with genotype. Previous studies have not considered anatomical changes along individual root axes in response to impeding soil conditions. We found no significant changes to the cell file number along a single root axes of maize when these axes grew through denser soil. Instead, the thickening of the cortex was caused by cell radial expansion. Exogenous ethylene and mechanical impedance caused similar patterns of expansion in cortical cells. Root thickening was negatively correlated with the ability of the different genotypes to penetrate through a compacted soil layer and grow beyond the compacted layer. Genotypes that did not thicken in the compacted layer or with the application of exogenous ethylene had the highest penetration percentages and were able to grow deeper away from the compacted layer. This was node and genotype‐dependent. Since root thickening is associated with reduced elongation rates, we suggest prolonged exposure to ethylene slows and may ultimately stop axial root growth. This implies ethylene will stop further root exploration when roots experience impedance and that roots with less ethylene‐induced radial expansion could be better at overcoming impedance in many situations.
CONFLICT OF INTEREST
The authors have no conflict of interest to declare.
Supporting information
Appendix S1. Supporting information.
ACKNOWLEDGMENTS
The authors thank Dr Brian Atkinson and Dr Craig Sturrock from the Hounsfield Facility at the University of Nottingham for assistance with the X‐ray CT study. This research was supported by the University of Nottingham, USDOE ARPA‐E ROOTS Award Number DE‐AR0000821, the USDA National Institute of Food and Agriculture Federal Appropriations under Project PEN04732, the Pennsylvania State University, the Howard G Buffett Foundation, and the James Hutton Institute. The James Hutton Institute receives funding from the Rural & Environment Science & Analytical Services Division of the Scottish Government.
Vanhees, D. J. , Schneider, H. M. , Sidhu, J. S. , Loades, K. W. , Bengough, A. G. , Bennett, M. J. , Pandey, B. K. , Brown, K. M. , Mooney, S. J. , & Lynch, J. P. (2022). Soil penetration by maize roots is negatively related to ethylene‐induced thickening. Plant, Cell & Environment, 45, 789–804. 10.1111/pce.14175
Funding information Advanced Research Projects Agency ‐ Energy, Grant/Award Number: DE‐AR0000821; Cooperative State Research, Education, and Extension Service, Grant/Award Number: Project PEN04582; Howard G Buffett Foundation; James Hutton Institute; University of Nottingham
DATA AVAILABILITY STATEMENT
Data is available from the corresponding author on request.
REFERENCES
- Araki, H. , Hirayama, M. , Hirasawa, H. , & Iijima, M. (2000). Which roots penetrate the deepest in rice and maize root systems? Plant Production Science, 3(3), 281–288. [Google Scholar]
- Athmann, M. , Sondermann, J. , Kautz, T. , & Köpke, U. (2019). Comparing macropore exploration by faba bean, wheat, barley and oilseed rape roots using in situ endoscopy. Journal of Soil Science and Plant Nutrition, 19, 689–700. [Google Scholar]
- Atkinson, J. A. , & Wells, D. M. (2017). An updated protocol for high throughput plant tissue sectioning. Front. Plant Sci, 8, 1721. 10.3389/fpls.2017.01721 [DOI] [PMC free article] [PubMed] [Google Scholar]
- Atwell, B. J. (1988). Physiological responses of lupin roots to soil compaction. Plant and Soil, 111, 277–281. [Google Scholar]
- Atwell, B. J. (1990). The effect of soil compaction on wheat during early tillering: I. Growth, development and root structure. New Phytologist, 115, 29–35. [Google Scholar]
- Barlow, P. W. (1976). The effect of ethylene on root meristems of Pisum sativum and Zea mays . Planta, 131, 235–243. [DOI] [PubMed] [Google Scholar]
- Barraclough, P. B. , & Weir, A. H. (1988). Effects of a compacted subsoil layer on root and shoot growth, water use and nutrient uptake of winter wheat. Journal of Agricultural Science, 110, 207–216. [Google Scholar]
- Bengough, A. G. , Bransby, M. F. , Hans, J. , McKenna, S. J. , Roberts, T. J. , & Valentine, T. A. (2006). Root responses to soil physical conditions; growth dynamics from field to cell. Journal of Experimental Botany, 57(2), 437–447. [DOI] [PubMed] [Google Scholar]
- Bengough, A. G. , McKenzie, B. M. , Hallett, P. D. , & Valentine, T. A. (2011). Root elongation, water stress, and mechanical impedance: A review of limiting stresses and beneficial root tip traits. Journal of Experimental Botany, 62(1), 59–68. [DOI] [PubMed] [Google Scholar]
- Bengough, A. G. , & Mullins, C. E. (1991). Penetrometer resistance, root penetration resistance and root elongation rate in two sandy loam soils. Plant and Soil, 131, 59–66. [Google Scholar]
- Bengough, G. A. , Loades, K. , & McKenzie, B. M. (2016). Root hairs aid soil penetration by anchoring the root surface to pore walls. Journal of Experimental Botany, 67(4), 1071–1078. [DOI] [PMC free article] [PubMed] [Google Scholar]
- Benigno, S. M. , Cawthray, G. R. , Dixon, K. W. , & Stevens, J. C. (2012). Soil physical strength rather than excess ethylene reduces root elongation of Eucalyptus seedlings in mechanically impeded sandy soil. Plant Growth Regulation, 68, 261–270. [Google Scholar]
- Bennie, A. T. P. (1996). Growth and mechanical impedanc. In Waisel Y., Eshel A., & Kafkafi U. (Eds.), Plant roots: The hidden half (pp. 453–470). New York, NY: Marcel Dekker. [Google Scholar]
- Boeuf‐Tremblay, V. , Plantureux, S. , & Guckert, A. (1995). Influence of mechanical impedance on root exudation of maize seedlings at two development stages. Plant and Soil, 172, 279–287. [Google Scholar]
- Burton, A. L. , Johnson, J. , Foerster, J. , Hanlon, M. T. , Kaeppler, S. M. , Lynch, J. P. , & Brown, K. M. (2015). QTL mapping and phenotypic variation in root anatomical traits in maize (Zea mays L.). Theoretical and Applied Genetics, 128, 93–106. [DOI] [PubMed] [Google Scholar]
- Chimungu, J. G. , Brown, K. M. , & Lynch, J. P. (2014a). Large root cortical cell size improves drought tolerance in maize. Plant Physiology, 166, 2166–2178. [DOI] [PMC free article] [PubMed] [Google Scholar]
- Chimungu, J. G. , Brown, K. M. , & Lynch, J. P. (2014b). Reduced root cortical cell file number improves drought tolerance in maize. Plant Physiology, 166, 1943–1955. [DOI] [PMC free article] [PubMed] [Google Scholar]
- Chimungu, J. G. , Loades, K. W. , & Lynch, J. P. (2015). Root anatomical phenes predict root penetration ability and biomechanical properties in maize (Zea Mays). Journal of Experimental Botany, 66(11), 3151–3162. [DOI] [PMC free article] [PubMed] [Google Scholar]
- Clark, D. G. , Gubrium, E. K. , Barrett, J. E. , Terril, A. N. , & Klee, H. J. (1999). Root formation in ethylene insensitive plants. Plant Physiology, 121, 53–59. [DOI] [PMC free article] [PubMed] [Google Scholar]
- Clark, L. J. , Price, A. H. , Steele, K. A. , & Whalley, W. R. (2008). Evidence from near‐isogenic lines that root penetration increases with root diameter and bending stiffness in rice. Functional Plant Biology, 35, 1163–1171. [DOI] [PubMed] [Google Scholar]
- Clark, L. J. , Whalley, W. R. , & Barraclough, P. B. (2001). Partial mechanical impedance can increase the turgor of seedling pea roots. Journal of Experimental Botany, 52(354), 167–171. [PubMed] [Google Scholar]
- Colombi, T. , Herrmann, A. M. , Vallenback, P. , & Keller, T. (2019). Cortical cell diameter is key to energy costs of root growth in wheat. Plant Physiology, 180, 2049–2060. [DOI] [PMC free article] [PubMed] [Google Scholar]
- Colombi, T. , Kirchgessner, N. , Walter, A. , & Keller, T. (2017). Root tip shape governs root elongation rate under increased soil strength. Plant Physiology, 174, 2289–2301. [DOI] [PMC free article] [PubMed] [Google Scholar]
- Colombi, T. , & Walter, A. (2016). Root responses of triticale and soybean to soil compaction in the field are reproducible under controlled conditions. Functional Plant Biology, 43, 114–128. [DOI] [PubMed] [Google Scholar]
- Croser, C. , Bengough, A. G. , & Pritchard, J. (1999). The effect of mechanical impedance on root growth in pea (Pisum sativum). I. Rates of cell flux, mitosis, and strain during recovery. Physiologia Plantarum, 107, 277–286. [Google Scholar]
- Croser, C. , Bengough, A. G. , & Pritchard, J. (2000). The effect of mechanical impedance on root growth in pea (Pisum sativum). II. Cell expansion and wall rheology during recovery. Physiologia Plantarum, 109, 150–159. [Google Scholar]
- Dexter, A. R. , & Hewitt, J. S. (1978). The deflection of plant roots. Journal of Agricultural Engineering Research, 23, 17–22. [Google Scholar]
- Ehlers, W. , Köpke, U. , Hesse, F. , & Böhm, W. (1983). Penetration resistance and root growth of oats in tilled and untilled loess soil. Soil & Tillage Research, 3, 261–275. [Google Scholar]
- Galindo‐Castañeda, T. , Brown, K. M. , & Lynch, J. P. (2018). Reduced root cortical burden improves growth and grain yield under low phosphorus availability in maize. Plant, Cell & Environment, 41, 1579–1592. [DOI] [PubMed] [Google Scholar]
- Gao, W. , Hodgkinson, L. , Jin, K. , Watts, C. W. , Ashton, R. W. , Shen, J. , … Whalley, W. R. (2016). Deep roots and soil structure. Plant, Cell & Environment, 39, 1662–1668. [DOI] [PMC free article] [PubMed] [Google Scholar]
- Goss, M. J. , & Scott, R. R. (1980). Effects of mechanical impedance on root growth in barley (Hordeum vulgare L.) III. Observations on the mechanism of response. Journal of Experimental Botany, 31(2), 577–588. [Google Scholar]
- Grzesiak, S. , Grzesiak, M. T. , Hura, T. , Marcińska, I. , & Rzepka, A. (2013). Changes in root system structure, leaf water potential and gas exchange of maize and triticale seedlings affected by soil compaction. Environmental and Experimental Botany, 88, 2–10. [Google Scholar]
- Gunawardena, A. H. L. A. N. , Pearce, D. M. , Jackson, M. B. , Hawes, C. R. , & Evans, D. E. (2001). Characterisation of programmed cell death during aerenchyma formation induced by ethylene or hypoxia in roots of maize (Zea mays L.). Planta, 212, 205–214. [DOI] [PubMed] [Google Scholar]
- Hall, B. , Lanba, A. , & Lynch, J. P. (2019). Three‐dimensional analysis of biological systems via a novel laser ablation technique. Journal of Laser Applications, 31(2), 022602. 10.2351/1.5108633 [DOI] [Google Scholar]
- Han, E. , Kautz, T. , Perkons, U. , Uteau, D. , Peth, S. , Huang, N. , … Köpke, U. (2015). Root growth dynamics inside and outside of soil biopores as affected by crop sequence determined with the profile wall method. Biology and Fertility of Soils, 51, 847–856. [Google Scholar]
- Hanbury, C. D. , & Atwell, B. J. (2005). Growth dynamics of mechanically impeded lupin roots: Does altered morphology induce hypoxia? Annals of Botany, 96, 913–924. [DOI] [PMC free article] [PubMed] [Google Scholar]
- He, C. , Finlayson, S. A. , Drew, M. C. , Jordan, W. R. , & Morgan, P. W. (1996). Ethylene biosynthesis during aerenchyma formation in roots of maize subjected to mechanical impedance and hypoxia. Plant Physiology, 112, 1679–1685. [DOI] [PMC free article] [PubMed] [Google Scholar]
- Helliwell, J. R. , Sturrock, C. J. , Miller, A. J. , Whalley, W. R. , & Mooney, S. J. (2019). The role of plant species and soil condition in the physical development of the rhizosphere. Plant, Cell & Environment, 42, 1974–1986. [DOI] [PMC free article] [PubMed] [Google Scholar]
- Iijima, M. , Griffiths, B. , & Bengough, A. G. (2000). Sloughing of cap cells and carbon exudation from maize seedling roots in compacted sand. New Phytologist, 145, 477–482. [DOI] [PubMed] [Google Scholar]
- Iijima, M. , Higuchi, T. , & Barlow, P. W. (2004). Contribution of root cap mucilage and presence of an intact root cap in maize (Zea mays) to the reduction of soil mechanical impedance. Annals of Botany, 94, 473–477. [DOI] [PMC free article] [PubMed] [Google Scholar]
- Iijima, M. , Kato, J. , & Taniguchi, A. (2007). Combined soil physical stress of soil drying, anaerobiosis and mechanical impedance to seedling root growth of four crop species. Plant Production Science, 10(4), 451–459. [Google Scholar]
- Jacobsen, A. G. , Xu, J. , Topping, J. F. , & Lindsey, K. (2021). Root growth responses to mechanical impedance are regulated by a network of ROS, ethylene and auxin signalling in Arabidopsis. New Phytologist, 231(1), 225–242. [DOI] [PMC free article] [PubMed] [Google Scholar]
- Jin, K. , Shen, J. , Ashton, R. W. , Dodd, I. C. , Parry, M. A. , & Whalley, W. R. (2013). How do roots elongate in a structured soil? Journal of Experimental Botany, 64, 4761–4777. [DOI] [PubMed] [Google Scholar]
- Kays, S. J. , Nicklow, C. W. , & Simons, D. H. (1974). Ethylene in relation to the response of roots to physical impedance. Plant and Soil, 40, 565–571. [Google Scholar]
- Kirby, J. M. , & Bengough, A. G. (2002). Influence of soil strength on root growth: Experiments and analysis using a critical‐state model. European Journal of Soil Science, 53, 119–128. [Google Scholar]
- Konôpka, B. , Pagès, L. , & Doussan, C. (2009). Soil compaction modifies morphological characteristics of seminal maize roots. Plant, Soil and Environment, 55(1), 1–10. [Google Scholar]
- Konôpka, B. , Pagès, L. , & Doussan, C. W. (2008). Impact of soil compaction heterogeneity and moisture on maize (Zea mays L.) root and shoot development. Plant, Soil and Environment, 54(12), 509–519. [Google Scholar]
- Lynch, J. P. (2013). Steep, cheap and deep: An ideotype to optimize water and N acquisition by maize root systems. Annals of Botany, 112, 347–357. [DOI] [PMC free article] [PubMed] [Google Scholar]
- Lynch, J. P. (2015). Root phenes that reduce the metabolic costs of soil exploration: Opportunities for 21st century agriculture. Plant, Cell & Environment, 38, 1775–1784. [DOI] [PubMed] [Google Scholar]
- Lynch, J. P. , & Wojciechowski, T. (2015). Opportunities and challenges in the subsoil: Pathways to deeper rooted crops. Journal of Experimental Botany, 66(8), 2199–2210. [DOI] [PMC free article] [PubMed] [Google Scholar]
- Materechera, S. A. , Dexter, A. R. , & Alston, A. M. (1991). Penetration of very strong soils by seedling roots of different plant species. Plant and Soil, 135, 31–41. [Google Scholar]
- Moss, G. I. , Hall, K. C. , & Jackson, M. B. (1988). Ethylene and the responses of roots of maize (Zea mays L.) to physical impedance. New Phytologist, 109, 303–311. [Google Scholar]
- Pandey, B. K. , Huang, G. , Bhosale, R. , Hartman, S. , Jose, L. , Sturrock, C. J. , … Bennett, M. J. (2021). Plant roots sense soil compaction through restricted ethylene diffusion. Science, 371, 276–280. 10.1126/science.abf3013 [DOI] [PubMed] [Google Scholar]
- Pankhurst, C. E. , Pierret, A. , Hawke, B. G. , & Kirby, J. M. (2002). Microbiological and chemical properties of soil associated with macropores at different depths in a red‐duplex soil in NSW Australia. Plant and Soil, 238, 11–20. [Google Scholar]
- Pfeifer, J. , Faget, M. , Walter, A. , Blossfeld, S. , Fiorani, F. , Schurr, U. , & Nagel, K. A. (2014). Spring barley shows dynamic compensatory root and shoot growth responses when exposed to localised soil compaction and fertilisation. Functional Plant Biology, 41, 581–597. [DOI] [PubMed] [Google Scholar]
- Potocka, I. , & Szymanowska‐Pułka, J. (2018). Morphological responses of plant roots to mechanical stress. Annals of Botany, 122, 711–723. [DOI] [PMC free article] [PubMed] [Google Scholar]
- Saengwilai, P. , Nord, E. A. , Chimungu, J. G. , Brown, K. M. , & Lynch, J. P. (2014). Root cortical aerenchyma enhances nitrogen acquisition from low‐nitrogen soils in maize. Plant Physiology, 166, 726–735. [DOI] [PMC free article] [PubMed] [Google Scholar]
- Santisree, P. , Nongmaithem, S. , Vasuki, H. , Sreelakshmi, Y. , Ivanchenko, M. G. , & Sharma, R. (2011). Tomato root penetration in soil requires a coaction between ethylene and auxin signaling. Plant Physiology, 156, 1424–1438. [DOI] [PMC free article] [PubMed] [Google Scholar]
- Sarquis, J. I. , Jordan, W. R. , & Morgan, P. W. (1991). Ethylene evolution from maize (Zea mays L.) seedling roots and shoots in response to mechanical impedance. Plant Physiology, 96, 1171–1177. [DOI] [PMC free article] [PubMed] [Google Scholar]
- Schindelin, J. , Arganda‐Carreras, I. , Frise, E. , Kaynig, V. , Longair, M. , Pietzsch, T. , … Cardona, A. (2012). Fiji: An open‐source platform for biological‐image analysis. Nature Methods, 9(7), 676–682. [DOI] [PMC free article] [PubMed] [Google Scholar]
- Schmidt, S. , Gregory, P. J. , Grinev, D. V. , & Bengough, A. G. (2013). Root elongation rate is correlated with the length of the bare root apex of maize and lupin roots despite contrasting responses of root growth to compact and dry soils. Plant and Soil, 372, 609–618. [Google Scholar]
- Schneider, H. M. , Klein, S. P. , Hanlon, M. T. , Kaeppler, S. , Brown, K. M. , & Lynch, J. P. (2020). Genetic control of root anatomical plasticity in maize. The Plant Genome, 13(1), e20003. [DOI] [PubMed] [Google Scholar]
- Schneider, H. M. , Lor, V. S. N. , Hanlon, M. , Perkins, A. , Kaeppler, S. , Borkar, A. , … Lynch, J. (2021). Root angle in maize influences nitrogen capture and is regulated by CBL‐interacting serine/threonine‐protein kinase 15 (ZmCIPK15). Plant, Cell & Environment, 118(6), e2012087118. 10.1073/pnas.2012087118 [DOI] [PMC free article] [PubMed] [Google Scholar]
- Schneider, H. M. , Strock, C. F. , Hanlon, M. T. , Vanhees, D. J. , Perkins, A. C. , Ajmera, I. B. , … Lynch, J. P. (2021). Multiseriate cortical sclerenchyma enhance root penetration in compacted soils. Proceedings of the National Academy of Sciences, 118(6), e2012087118. [DOI] [PMC free article] [PubMed] [Google Scholar]
- Schneider, H. M. , Yang, J. T. , Brown, K. M. , & Lynch, J. P. (2021). Nodal root diameter and node number in maize (Zea mays L.) interact to influence plant growth under nitrogen stress. Plant Direct, 5(3), e00310. [DOI] [PMC free article] [PubMed] [Google Scholar]
- Strock, C. F. , Morrow de la Riva, L. , & Lynch, J. P. (2018). Reduction in root secondary growth as a strategy for phosphorus acquisition. Plant Physiology, 176, 691–703. [DOI] [PMC free article] [PubMed] [Google Scholar]
- Strock, C. F. , Schneider, H. M. , Galindo‐Castañeda, T. , Hall, B. T. , Van Gansbeke, B. , Mather, D. E. , … Lynch, J. P. (2019). Laser ablation tomography for visualization of root colonization by edaphic organisms. Journal of Experimental Botany, 70(19), 5327–5342. [DOI] [PMC free article] [PubMed] [Google Scholar]
- Uga, Y. , Ebana, K. , Abe, J. , Morita, S. , Okuno, K. , & Yano, M. (2009). Variation in root morphology and anatomy among accessions of cultivated rice (Oryza sativa L.) with different genetic backgrounds. Breeding Science, 59, 87–93. [Google Scholar]
- Uga, Y. , Okuno, K. , & Yano, M. (2008). QTLs underlying natural variation in stele and xylem structures of rice root. Breeding Science, 58, 7–14. [Google Scholar]
- Valentine, T. A. , Hallett, P. D. , Binnie, K. , Young, M. W. , Squire, G. R. , Hawes, C. , & Bengough, A. G. (2012). Soil strength and macropore volume limit root elongation rates in many UKagricultural soils. Annals of Botany, 110, 259–270. [DOI] [PMC free article] [PubMed] [Google Scholar]
- Vanhees, D. J. , Loades, K. W. , Bengough, A. G. , Mooney, S. J. , & Lynch, J. P. (2020). Root anatomical traits contribute to deeper rooting of maize under compacted field conditions. Journal of Experimental Botany, 71(14), 4243–4257. 10.1093/jxb/eraa165 [DOI] [PMC free article] [PubMed] [Google Scholar]
- Veen, B. W. (1982). The influence of mechanical impedance on the growth of maize roots. Plant and Soil, 66, 101–109. [Google Scholar]
- Vischer, N. , & Nastase, S. (2009). ObjectJ: Non‐destructive marking and linked results in imageJ. Software. Retrieved from sils.fnwi.uva.nl/bcb/objectj/index.html
- Vollsnes, A. V. , Futsaether, C. M. , & Bengough, A. G. (2010). Quantifying rhizosphere particle movement around mutant maize roots using time‐lapse imaging and particle image velocimetry. European Journal of Soil Science, 61, 926–939. [Google Scholar]
- Whalley, W. R. , Leeds‐Harrison, P. B. , Clark, L. J. , & Gowing, D. J. G. (2005). Use of effective stress to predict the penetrometer resistance of unsaturated agricultural soils. Soil & Tillage Research, 84, 18–27. [Google Scholar]
- White, R. G. , & Kirkegaard, J. A. (2010). The distribution and abundance of wheat roots in a dense, structured subsoil ‐ implications for water uptake. Plant, Cell & Environment, 33, 133–148. [DOI] [PubMed] [Google Scholar]
- Whiteley, G. M. , Hewitt, J. S. , & Dexter, A. R. (1982). The buckling of plant roots. Physiologia Plantarum, 54, 333–342. [Google Scholar]
- Whitmore, A. P. , & Whalley, W. R. (2009). Physical effects of soil drying on roots and crop growth. Journal of Experimental Botany, 60(10), 2845–2857. [DOI] [PubMed] [Google Scholar]
- Wilson, A. J. , Robards, A. W. , & Goss, M. J. (1977). Effects of mechanical impedance on root growth in barley, Hordeum vulgare LII. Effects on cell development in seminal roots. Journal of Experimental Botany, 28(106), 1216–1227. [Google Scholar]
- Yang, J. T. , Schneider, H. M. , Brown, K. M. , & Lynch, J. P. (2019). Genotypic variation and nitrogen stress effects on root anatomy in maize are node specific. Journal of Experimental Botany, 70(19), 5311–5325. [DOI] [PMC free article] [PubMed] [Google Scholar]
- York, L. M. , Galindo‐Castañeda, T. , Schussler, J. R. , & Lynch, J. P. (2015). Evolution of US maize (Zea mays L.) root architectural and anatomical phenes over the past 100 years corresponds to increased tolerance of nitrogen stress. Journal of Experimental Botany, 66(8), 2347–2358. [DOI] [PMC free article] [PubMed] [Google Scholar]
- Zappala, S. , Mairhofer, S. , Tracy, S. , Sturrock, C. J. , Bennett, M. , Pridmore, T. , & Mooney, S. J. (2013). Quantifying the effect of soil moisture content on segmenting root system architecture in X‐ray computed tomography images, 370, 35–45. 10.1007/s11104-013-1596-1 [DOI] [Google Scholar]
- Zhou, H. , Whalley, W. R. , Hawkesford, M. J. , Ashton, R. W. , Atkinson, B. , Atkinson, J. A. , … Mooney, S. J. (2021). The interaction between wheat roots and soil pores in structured field soil. Journal of Experimental Botany, 72, 747–756. [DOI] [PMC free article] [PubMed] [Google Scholar]
Associated Data
This section collects any data citations, data availability statements, or supplementary materials included in this article.
Supplementary Materials
Appendix S1. Supporting information.
Data Availability Statement
Data is available from the corresponding author on request.