

SUMMARY
C4 photosynthesis is a biochemical pathway that operates across mesophyll and bundle sheath (BS) cells to increase CO2 concentration at the site of CO2 fixation. C4 plants benefit from high irradiance but their efficiency decreases under shade, causing a loss of productivity in crop canopies. We investigated shade acclimation responses of Setaria viridis, a model monocot of NADP‐dependent malic enzyme subtype, focussing on cell‐specific electron transport capacity. Plants grown under low light (LL) maintained CO2 assimilation rates similar to high light plants but had an increased chlorophyll and light‐harvesting‐protein content, predominantly in BS cells. Photosystem II (PSII) protein abundance, oxygen‐evolving activity and the PSII/PSI ratio were enhanced in LL BS cells, indicating a higher capacity for linear electron flow. Abundances of PSI, ATP synthase, Cytochrome b 6 f and the chloroplast NAD(P)H dehydrogenase complex, which constitute the BS cyclic electron flow machinery, were also increased in LL plants. A decline in PEP carboxylase activity in mesophyll cells and a consequent shortage of reducing power in BS chloroplasts were associated with a more oxidised plastoquinone pool in LL plants and the formation of PSII – light‐harvesting complex II supercomplexes with an increased oxygen evolution rate. Our results suggest that the supramolecular composition of PSII in BS cells is adjusted according to the redox state of the plastoquinone pool. This discovery contributes to the understanding of the acclimation of PSII activity in C4 plants and will support the development of strategies for crop improvement, including the engineering of C4 photosynthesis into C3 plants.
Keywords: Setaria viridis, C4 photosynthesis, light harvesting, electron transport, bundle sheath, Photosystem II, chloroplast NAD(P)H dehydrogenase complex
Significance Statement
The efficiency of C4 photosynthesis decreases under low irradiance, causing a loss of productivity in crop canopies. We investigate shade acclimation of a model monocot of NADP‐dependent malic enzyme subtype, analysing cell‐specific protein expression and electron transport capacity. We demonstrate that C4 plants adjust the abundance and activity of Photosystem II in response to irradiance, specifically in bundle sheath cells.
INTRODUCTION
C4 plants operate a biochemical CO2‐concentrating pathway that reduces photorespiration by providing a higher CO2 partial pressure at the site of ribulose 1,5‐bisphosphate carboxylase/oxygenase (Rubisco)(von Caemmerer and Furbank, 2003). C4 leaves are typically organised in two concentric cylinders around the veins. The vasculature is surrounded by bundle sheath (BS) cells from which mesophyll (M) cells radiate, intertwined by intercellular airspace (Dengler and Nelson, 1999; Lundgren et al., 2014). In the cytosol of M cells, CO2 is first hydrated to HCO3 − by carbonic anhydrase (CA) and then fixed by phosphoenolpyruvate (PEP) carboxylase (PEPC) into C4 acids. These diffuse to BS cells, where they are decarboxylated either by NADP‐dependent malic enzyme (NADP‐ME), NAD‐dependent malic enzyme (NAD‐ME), PEP carboxykinase (PEPCK) or a combination thereof (Furbank, 2011). Many important C4 crops, like Zea mays, Sorghum bicolor, Saccharum officinarum and Setaria italica, principally produce malate in M cells and use NADP‐ME as the predominant decarboxylase. The pyruvate produced by NADP‐ME diffuses back to M cells, where it is regenerated to PEP by pyruvate orthophosphate dikinase using two ATP molecules. For each carboxylation event, Rubisco produces two molecules of 3‐phosphoglyceric acid, which can be exchanged for glyceraldehyde 3‐phosphate between BS and M cells in the so‐called triose shuttle (Furbank, 2011). The regeneration of glyceraldehyde 3‐phosphate to ribulose 1,5‐bisphosphate is exclusively located in BS cells and regulated by sedoheptulose‐bisphosphatase (SBPase) (Harrison et al., 2001). At least half of the reducing power requirements of BS cells is met by the decarboxylation of malate, supplying BS cells with NADPH derived from M (Figure 1), while the ATP required for ribulose 1,5‐bisphosphate regeneration is supplied by photophosphorylation in BS chloroplasts (Bellasio and Lundgren, 2016; Munekage and Taniguchi, 2016).
Figure 1.

Schematic representation of thylakoid protein complexes and electron transport pathways in mesophyll and bundle sheath chloroplasts of NADP‐ME subtype C4 plants. PSII, Photosystem II; PQ, plastoquinone; Cytb 6 f, Cytochrome b 6 f; PC, plastocyanin; PSI, Photosystem I; NDH, chloroplast NAD(P)H dehydrogenase complex; PGR5, PROTON GRADIENT REGULATION 5; FNR, ferredoxin:NADP+ oxidoreductase; FDI, ferredoxin iso‐protein I; FDII, ferredoxin iso‐protein II; OAA, oxaloacetate; Mal, malate; Pyr, pyruvate; PEP, phosphoenolpyruvate; PEPC, PEP carboxylase; MDH, malate dehydrogenase; ME, NADP‐dependent malic enzyme; PPDK, pyruvate orthophosphate dikinase. Dashed arrows indicate cyclic electron flow pathways, pink arrows indicate proton transfer across the thylakoid membrane and grey arrows indicate potential ways to replenish cyclic electron flow in the bundle sheath chloroplast.
The partitioning of energy demand between the two cell types is flexible to some extent, due to partial overlapping of the biochemical functionality of M and BS cells, the variable engagement of the decarboxylating pathways and the triose shuttle (Bellasio and Griffiths, 2014; Pick et al., 2011; Weber and von Caemmerer, 2010). The energy required in M and BS cells is supplied by two distinct populations of chloroplasts, which harvest light through electron transport chains attuned to the specific biochemical requirements. Photosynthetic electron transport pathways in M are very similar to those in C3 chloroplasts (Figure 1). BS chloroplasts of most NADP‐ME plants do not produce NADPH by linear electron flow (LEF), and have little or no Photosystem II (PSII) in their mostly agranal chloroplasts (Chapman et al., 1980; Furbank, 2011; Romanowska et al., 2008), but are specialised to synthesise ATP, driven by the proton motive force (pmf) generated from cyclic electron flow (CEF) around Photosystem I (PSI) (Munekage, 2016; Nakamura et al., 2013). Two CEF pathways operate in BS cells (Figure 1): the first via the chloroplast NAD(P)H dehydrogenase (NDH) complex and the second via the PROTON GRADIENT REGULATION 5 (PGR5) protein (Munekage et al., 2010). The NDH complex oxidises ferredoxin and reduces plastoquinone (PQ) while also contributing to establishing pmf (Pan et al., 2020; Peng et al., 2011; Shikanai, 2016). In Z. mays, the NDH pathway is predominant in BS cells, whilst PGR5 is more abundant in M cells (Takabayashi et al., 2005).
In crop canopies, leaves generally grow in full sunlight and get progressively shaded by new leaves emerging at the top, and up to 50% of net CO2 uptake may be fixed by shaded leaves (Baker et al., 1988; Long, 1993). C4 photosynthesis is known to be sensitive to limiting light intensities as shading decreases the quantum yield for CO2 assimilation costing up to 10% of potential carbon gain (Pengelly et al., 2010; Pignon et al., 2017; Tazoe et al., 2008; Ubierna et al., 2013). Therefore, long‐ and short‐term acclimations to low light (LL) are highly relevant for crop productivity (Bellasio and Griffiths, 2014; Sage, 2014). Reports of PSII activity and grana development in BS cells of NADP‐ME plants show great variability depending on the growth conditions and suggest a contribution of electron transport machinery to light acclimation (Andersen et al., 1972; Danila et al., 2019; Drozak and Romanowska, 2006; Hasan et al., 2006). Despite the growing interest in improving C4 photosynthesis and attempts to introduce it into C3 crop plants (von Caemmerer and Furbank, 2016; Ermakova et al., 2021; Ermakova et al., 2019), little is known of environmental responses and regulatory mechanisms of electron transport at the cell‐specific level. Here, we investigate the acclimation of thylakoid protein complexes in M and BS cells in a model NADP‐ME grass, Setaria viridis, grown under LL, and reveal an upregulation of the photosynthetic machinery in LL plants, suggesting increased energy requirements, predominantly in BS cells.
RESULTS
Leaf biochemistry
Two‐week‐old S. viridis grown under LL (300 µmol m−2 sec−1) developed fewer tillers and had fewer leaves than plants grown under high light (HL, 1000 µmol m−2 sec−1, Figure 2). LL plants had half the dry weight per leaf area and 70% lower starch content compared to HL plants but did not differ in leaf nitrogen content (Table 1). LL leaves contained 63% more chlorophyll (a + b) and had a higher chlorophyll a/b ratio than HL plants (Table 1). At the cell‐type level, total chlorophyll increased by 127% in BS cells and by 37% in M cells of LL plants, compared to the corresponding cells in HL plants (Table 1), therefore BS cells contained 41% of the total leaf chlorophyll in LL plants and 29% in HL plants (Figure 2). The chlorophyll a/b ratio of M and BS cells did not change significantly between HL and LL plants.
Figure 2.
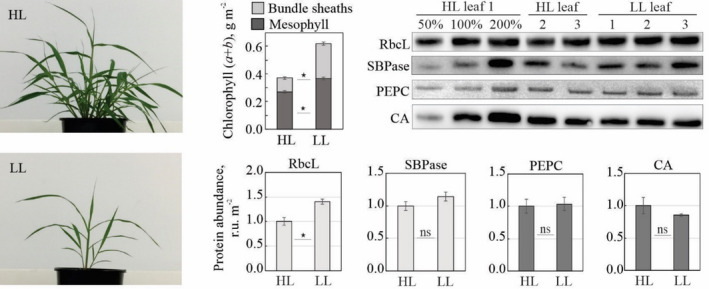
Properties of S. viridis grown under high light (HL) and low light (LL). (Left) Plants 16 days after germination. (Top middle histogram) Leaf chlorophyll (a + b) distribution between mesophyll and bundle sheaths. (Top right) Immunodetection of the large subunit of Rubisco (RbcL), sedoheptulose‐bisphosphatase (SBPase), PEP carboxylase (PEPC) and carbonic anhydrase (CA) on leaf area basis. Three biological replicates were loaded for each sample type and a titration series of one of the samples was used for relative quantification. (Bottom right histograms) Relative quantification of protein abundances from the immunoblots. Light grey bars, bundle sheath‐specific proteins; dark grey bars, mesophyll‐specific proteins. Asterisks indicate statistically significant differences between the two light regimes (t‐test, P < 0.05); mean ± SE; n = 3 biological replicates; ns, not significant.
Table 1.
Biochemical and photosynthetic characteristics of leaves, mesophyll (M) and bundle sheaths (BS) cells of S. viridis grown at high light (HL) and low light (LL)
| Characteristic | HL | LL |
|---|---|---|
| Leaf mass per area, g (dry weight) m−2 | 66.7 ± 3.8 | 35.4 ± 1.1* |
| Chlorophyll (a + b), mmol m−2, Leaf | 0.38 ± 0.02 | 0.62 ± 0.03* |
| M | 0.27 ± 0.02 | 0.37 ± 0.02* |
| BS | 0.11 ± 0.02 | 0.25 ± 0.03* |
| ChlBS/ChlLeaf (from the SBPase immunoblot, Figure S2) | 0.29 ± 0.01 | 0.42 ± 0.02* |
| Chlorophyll a/b, Leaf | 4.81 ± 0.05 | 5.07 ± 0.06* |
| M | 4.05 ± 0.04 | 4.13 ± 0.06 |
| BS | 6.64 ± 0.15 | 6.43 ± 0.11 |
| Starch, g m−2, Leaf | 17.9 ± 1.28 | 5.51 ± 0.41* |
| Leaf nitrogen, mmol m−2 | 89.1 ± 4.8 | 101.6 ± 3.5 |
| PEP carboxylase activity, μmol CO2 m−2 sec−1, Leaf | 193 ± 6 | 160 ± 12* |
| Rubisco active sites, µmol m−2, Leaf | 4.79 ± 0.29 | 5.49 ± 0.16* |
| Net CO2 assimilation rate at 300 µmol m−2 sec−1, μmol CO2 m−2 sec−1, Leaf | 15.88 ± 1.14 | 16.15 ± 0.67 |
| Net CO2 assimilation rate at 1000 µmol m−2 sec−1, μmol CO2 m−2 sec−1, Leaf | 29.73 ± 1.67 | 29.61 ± 0.80 |
| Thylakoid Photosystem II activity (H2O→DCBQ), µmol O2 (mmol Chl)−1 sec−1, M | 36 ± 1 | 59 ± 3* |
| BS | 0 ± 0 | 2 ± 1* |
| Time constant of P700 oxidation, s, MV, BS | 0.0042 ± 0.0005 | 0.0078 ± 0.0004* |
| Time constant of P700 oxidation, s, MV + DCMU, BS | 0.0042 ± 0.0004 | 0.0072 ± 0.0011* |
| Gross O2 evolution at 1000 µmol m−2 sec−1, µmol (mmol Chl)−1 sec−1, BS | 1.58 ± 0.10 | 2.20 ± 0.18* |
| O2 uptake in the dark, µmol (mmol Chl)−1 sec−1, BS | 0.8 ± 0.26 | 1.08 ± 0.26 |
| O2 uptake at 1000 µmol m−2 sec−1, µmol (mmol Chl)−1 sec−1, BS | 5.29 ± 0.48 | 6.6 ± 0.92 |
DCBQ, 2,6‐dichloro‐1,4‐benzoquinone; MV, methyl viologen; DCMU, dichorophenyl‐dimethylurea. Mean ± SE; n = 3 biological replicates, except for leaf nitrogen (n = 6), chlorophyll measurements (n = 6 for M and leaves, n = 9 for BS) and BS O2 fluxes (n = 5). Asterisks indicate statistically significant differences between the two light regimes (t‐test, P < 0.05).
The abundances of PEPC, CA and SBPase per leaf area did not differ between the two light regimes (Figure 2), but the activity of PEPC was 20% lower in LL plants (Table 1). The amount of Rubisco active sites was 15% higher in LL plants (Table 1), consistent with the higher abundance of Rubisco large subunit (RbcL) (Figure 2). Net CO2 assimilation did not differ between LL and HL plants (Table 1).
Cell‐level protein abundance
M cells of LL plants had about twofold more PSI and PSII core subunits (D1 and PsaB, respectively), 1.5‐fold more of the Lhcb2 subunit of light‐harvesting complex II (LHCII) and 1.3‐fold more of the AtpB subunit of ATP synthase than M cells of HL plants (Figure 3). No difference between HL and LL plants was detected in M abundance of the Rieske FeS subunit of Cytochrome b 6 f (Cytb 6 f), the NdhH subunit of NDH complex, the Lhca1 subunit of light‐harvesting complex I (LHCI), PSII subunit S (PsbS, which mediates the fast, ΔpH‐dependent component of the non‐photochemical quenching) and PGR5.
Figure 3.

Immunodetection of photosynthetic proteins in S. viridis plants grown under high light (HL) and low light (LL). (Top) PsaB (PSI core), AtpB (ATP synthase), Lhcb2 (light‐harvesting complex II), PsbQ (water‐oxidising complex of PSII), D1 (PSII core), Rieske FeS (Cytochrome b 6 f), NdhH (NDH complex), Lhca1 (light‐harvesting complex I), PsbS (PSII subunit S responsible for photoprotective thermal dissipation) and PGR5 (CEF route) were detected in protein samples isolated from whole leaves (‘leaf’) and from bundle sheaths (BS) and loaded on chlorophyll (a + b) basis. Three biological replicates were loaded for each sample type and a titration series of one of the samples was used for relative quantification. The D1 immunoblot with other dilutions is shown in Figure S3. (Bottom) Relative quantification of protein abundances in mesophyll (M) and BS cells per leaf area from the immunoblots; HL leaf (M + BS) protein abundances were set to 1 for each protein. Conversion of relative protein abundances from chlorophyll (a + b) to leaf area basis was done using the partitioning of total leaf chlorophyll to BS cells (Table 1). Asterisks indicate statistically significant differences in M or BS cells between the two light regimes (t‐test, P < 0.05); mean ± SE; n = 3 biological replicates; ns, not significant.
BS cells of LL plants had about 10‐fold more D1, 2.7‐fold more PsaB and Lhcb2, 2.3‐fold more AtpB, 1.8‐fold more Lhca1, 1.7‐fold more NdhH and 1.3‐fold more Rieske per leaf area than HL BS cells (Figure 3). PsbS and PGR5 levels did not differ significantly between HL and LL BS cells . The BS/M distribution remained similar between HL and LL plants for PsaB, D1, Lhca1, Lhcb2, AtpB, Rieske, PsbS and PGR5, whilst the BS apportioning of NdhH shifted from about 70% in HL plants to about 90% in LL plants. The BS portion of D1 increased from 3% in HL plants to 8% in LL plants (Figure 3). For both HL and LL plants, the apportioning of PsbQ to BS cells was the same as or higher than the apportioning of leaf D1 to the BS .
PSI/PSII ratio
For M thylakoids of both LL and HL plants, the PSI/PSII ratio was 1.06 (Figure 4, M LL), similar to C3 plants (Danielsson et al., 2004). BS thylakoids showed a decreased Tyrosine D radical signal (Figure 4, green spectra), from which PSI/PSII ratios of 8.0 and 2.6 were calculated for HL and LL, respectively.
Figure 4.

Electron paramagnetic resonance (EPR) quantification of PSI/PSII ratios from mesophyll (M) and bundle sheath (BS) thylakoid membranes of S. viridis grown at high light (HL) or low light (LL). Spectra shown are from Tyrosine D radical (green line) oxidised with 15 mm ferricyanide (PSII, blue line) and deconvoluted P700+ radical (PSI, dotted blue line). The amplitude of Tyrosine D radical signal in the BS was multiplied for better visibility. EPR measurements were conducted at a microwave frequency of 9.76 GHz, a microwave power of 8 mW, a modulation amplitude of 5 G and room temperature. Data shown are from a representative experiment from three independent thylakoid isolations; M HL samples showed similar characteristics to M LL and are not shown.
Photosystem II activity
M thylakoids of HL plants had 40% lower O2 evolution compared to LL plants (Table 1). Evolution of O2 from BS thylakoids of HL plants was below the detection limit and BS thylakoids of LL plants had 11% of the O2 evolution of M thylakoids (Table 1).
In the flash‐induced variable fluorescence decay, a saturating flash fully reduces QA, the primary quinone electron acceptor in PSII, resulting in maximal fluorescence yield (Figure 5, left panels), and the following fluorescence decay kinetics depend on the QA − re‐oxidation (Mamedov et al., 2000; Vass et al., 1999). Three exponential decay components of different speeds were obtained (t1, t2 and t3 in Table S1). The first component represents the re‐oxidation of QA − by the PQ that is already bound at the QB site of PSII; the second component represents the re‐oxidation by the PQ which has to bind to the QB site from the PQ pool; the third component reflects a recombination between QA − and the S2 state of the water‐oxidising complex on the donor side of PSII (Figure 5, left panels, black traces). In the presence of dichlorophenyl‐dimethylurea (DCMU), blocking all forward electron transfer from QA − to QB (Figure 5, left panels, red traces), the decay phase can be resolved in two slow components (t2 and t3 in Table S1). M thylakoids from LL and HL plants had similar fluorescence kinetics and therefore only M LL are shown (Figure 5).
Figure 5.

Electron transfer properties of PSII from mesophyll (M) and bundle sheath (BS) thylakoid membranes of S. viridis grown at high light (HL) or low light (LL). (Left) Flash‐induced fluorescence decay kinetics of thylakoids in the absence (black trace) and in the presence (red trace) of 20 µm dichorophenyl‐dimethylurea (DCMU). (Right) Thermoluminescence measurements of thylakoids in the absence (black trace) and in the presence (red trace) of 40 µm DCMU. Data shown are from a representative experiment from three independent thylakoid isolations; M HL samples showed similar characteristics to M LL and are not shown.
In M thylakoids from LL plants the first component represented 73% of the maximal fluorescence amplitude, the second 14% and the third 13% (Table S1). With DCMU the first component was 27% and the second 72%. In BS thylakoids from LL plants, the initial fast fluorescence decay became slower (Figure 5, left panels, BS LL, black trace) and, as a consequence, the recombination phase nearly doubled in amplitude (21%, Table S1). In HL BS thylakoids this slowing of fluorescence decay was even more pronounced (Figure 5, left panels, BS HL, black trace): the two fast phases were twice and four times slower than in the M thylakoids (Table S1). These slow forward electron transfer kinetics from QA − indicate that the PQ pool was more reduced in BS thylakoids than in M thylakoids, and more so in HL BS thylakoids.
Thermoluminescence measurements also report on the redox state of PSII (Vass, 2003; Volgusheva et al., 2016). In samples containing active PSII centres after a single flash, a characteristic B‐band, which reflects a recombination between QB − and the S2 state of the water‐oxidising complex, is observed. In LL M thylakoids, the B‐band peaked at 38°C (Figure 5, right panels, M LL, black trace). When forward electron transfer from QA − is blocked, for example upon addition of DCMU, a different Q‐band, which reflects QA − → S2 state recombination, is observed. In M thylakoids this band was detected at 19°C (Figure 5, right panels, M LL, red trace). These two bands report on two extreme cases where the electron transfer on the acceptor side of PSII is either functional or not.
In LL BS thylakoids (Figure 5, right panels, BS LL) both B‐ and Q‐bands were shifted closer to each other (32°C and 24°C, respectively). Furthermore, in HL BS thylakoids both bands merged to show the same peak temperature at 27°C in the absence or presence of DCMU (Figure 5, right panels, BS HL). This is another indication of the modification of the redox state of QA and impaired electron transfer on the acceptor side of PSII in BS thylakoids, especially at HL. Changes in the redox state of QA reflect changes in the redox equilibrium QA ↔ QB ↔ PQ pool and indicate that while in LL BS cells a small pool of PQ was still available to accept electrons from PSII, in HL BS cells no PSII acceptors were available.
Supramolecular organisation of PSII and thylakoid structure
In M thylakoids of both HL and LL plants, PSII‐LHCII supercomplexes and PSII dimers constituted a large fraction of all PSII complexes. In BS cells, PSII monomers were prevalent at HL, whilst LL plants had a higher proportion of PSII‐LHCII supercomplexes and fewer PSII monomers compared to HL plants (Figure 6, left panels). HL BS thylakoids did not have any grana formations, but in BS of LL plants rudimentary grana were observed as regions of appressed thylakoid membranes (Figure 6, right panels, pointed by arrows).
Figure 6.

Properties of the thylakoid membranes from S. viridis plants grown at high light (HL) or low light (LL). (Left) Blue‐Native gel electrophoresis of the protein complexes isolated from mesophyll (M) and bundle sheath (BS) thylakoids and supramolecular composition of PSII analysed by immunodetection of D1; 10 µg of chlorophyll (a + b) was loaded for each sample. (Right) TEM micrographs of BS chloroplasts; arrows indicate grana formations in LL plants. Scale bar, 1 µm.
Electron transport pathways in isolated bundle sheath cells
To clarify the contribution of PSII and other electron pathways to the reduction of PSI in BS cells (Figure 1), we monitored the kinetics of P700 oxidation in isolated BS strands (Figure 7). Upon the illumination, after the initial rise, the P700+ signal quickly returned to the dark level in both LL and HL samples. We attributed this phenomenon to active CEF returning electrons to the PQ pool and reducing P700+. When methyl viologen (MV, a PSI acceptor effectively preventing CEF) was added, P700+ quickly reached the steady state (Figure 7) and the time constant of P700 oxidation was almost doubled in LL plants compared to HL plants (Table 1). Application of DCMU in addition to MV did not change the kinetics of P700 oxidation in either of BS samples (Figure 7, Table 1). However, the time constant of oxidation was still significantly higher in LL plants than in HL plants (Table 1).
Figure 7.
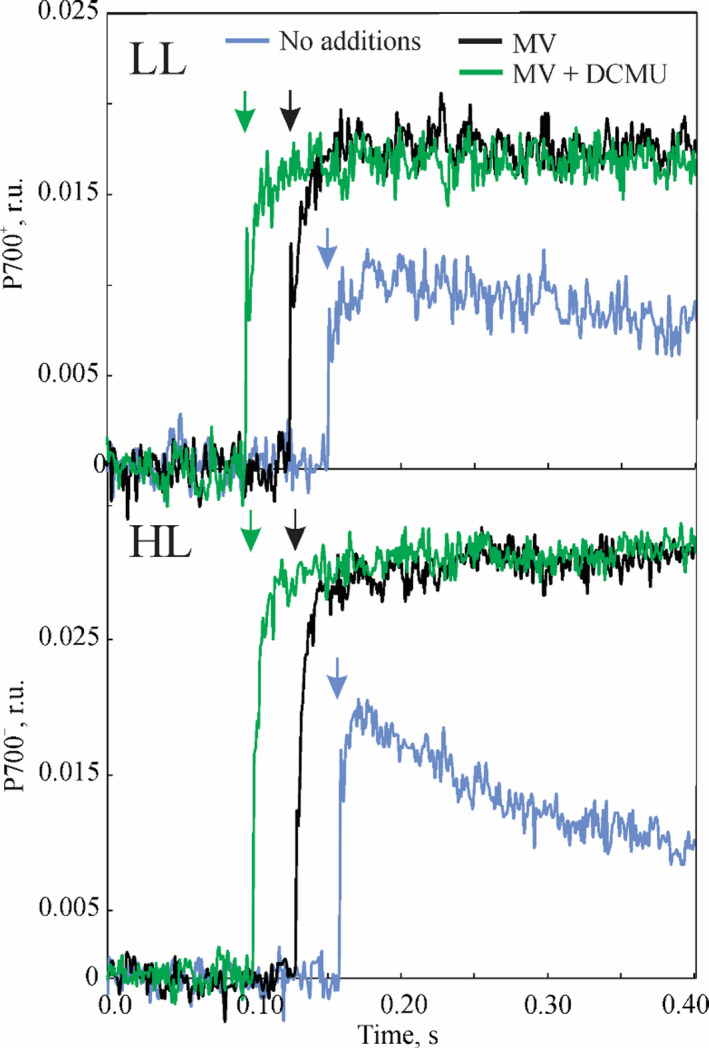
Kinetics of P700 oxidation measured on bundle sheath (BS) strands isolated from S. viridis plants grown under high light (HL) and low light (LL), in the absence or presence of 200 µm methyl viologen (MV) and 25 µm dichorophenyl‐dimethylurea (DCMU) as indicated. All BS preparations were supplied with 10 mm malate, 15 mm ribose‐5‐phosphate, 100 mm NaHCO3 and 5 mm dihydroxyacetone phosphate to support CO2 assimilation. Arrows show the beginning of illumination with red actinic light at 1000 µmol m−2 sec−1. Chlorophyll (a + b) concentration of BS samples was 25–30 µg ml−1. Time constants of exponential fitting of the curves are shown in Table 1.
Isolated BS strands were also assayed for gross O2 production and uptake by Membrane Inlet Mass Spectrometry (MIMS) at 1000 µmol m−2 sec−1. LL BS cells had a gross O2 evolution rate of 2.20 µmol (mmol Chl)−1 sec−1, significantly higher than that of HL BS cells of 1.58 µmol (mmol Chl)−1 sec−1 (Table 1). The rates of gross O2 uptake in the dark and under irradiance were similar between LL and HL BS cells (Table 1). O2 uptake detected in BS cells was not supported by the plastid terminal oxidase (PTOX) as it was only present in M cells (Figure S4).
DISCUSSION
We investigated acclimation of the electron transport machinery in S. viridis, a model monocot from the Panicoideae subfamily, which affiliates with important NADP‐ME crops like Z. mays, S. bicolor, S. officinarum and S. italica. LL plants had higher leaf chlorophyll content, similar to Z. mays (Drozak and Romanowska, 2006; Kromdijk et al., 2010), and higher apportioning of chlorophyll to the BS than HL plants (Figure 2). This resulted in an increased leaf chlorophyll a/b ratio (Table 1), in contrast to the typical response to shading of C3 species upregulating chlorophyll b‐binding antennae (Boardman, 1977; Sage and McKown, 2006).
BS cells of LL plants increased their capacity for LEF, compared to HL plants. The PSI/PSII ratio decreased from 8 (relative to that in the M) in HL plants to 2.6 in LL plants, and the abundance of D1 and PsbQ proteins and PSII activity increased accordingly (Figures 3 and 4, Table 1). Measured BS PSII activity was higher in LL plants in both isolated BS strands and BS thylakoids (Table 1). Gross O2 uptake was detected in HL BS strands through MIMS but not in BS thylakoids through the polarographic method due to a higher sensitivity of the first. Interestingly, the contribution of PSII to PSI reduction in isolated BS cells was not significant but P700+ was oxidised more slowly in LL plants even in the presence of MV and DCMU, blocking CEF and PSII activity (Figure 7, Table 1). These results are consistent with an existence of another pathway donating electrons to PSI which is more active in LL plants.
A reduction of the PQ pool using stromal reductants mediated by NDH could be responsible for the slower oxidation of P700 in LL BS cells. This is in line with the higher abundance of NDH detected in BS cells of LL plants compared to HL plants (Figure 3). NDH from Z. mays BS cells copurifies with FNR (Funk et al., 1999) and might therefore obtain electrons from stromal NADPH derived from malate decarboxylation via ferredoxin and, consequently, reduce the PQ pool. In support of this idea, differently from M cells, BS cells of Z. mays contain the specific ferredoxin iso‐protein FDII and the membrane‐bound form of FNR, which has a higher affinity for oxidised ferredoxin and may have evolved to catalyse the reduction of ferredoxin using NADPH, similar to the root FNR (Goss and Hanke, 2014; Matsumura et al., 1999).
Increased PSII activity and NDH abundance in LL BS cells could also contribute to upregulation of CEF capacity since the reduction of the PQ pool by LEF, and conceivably via NDH, maintains CEF by replenishing electrons leaking to various sinks around PSI (Ivanov et al., 2005). Direct CEF measurements in BS cells are complicated by the mutual dependence between M and BS cells and a large proportion of CEF/LET. To overcome experimental limits, in a companion paper we modelled the cell‐specific electron transport chains of LL and HL plants and showed that LL BS cells required a higher CEF rate than HL plants to sustain the same assimilation rate (Bellasio and Ermakova, 2021). The detected changes of protein abundance suggested an increased ATP demand in BS cells of LL plants, which is also consistent with an increased CEF capacity. The concurrent upregulation of LHCI and LHCII subunits under LL (Figure 3) indicated increased light harvesting in the BS. Further, LL plants increased abundances of PSI, Cytb 6 f, NDH and ATP synthase (Figure 3), which constitute the BS CEF machinery. NDH abundance was previously found to correlate with the ATP requirements of cells in C4 plants (Takabayashi et al., 2005). In the BS, it could contribute to ATP production by both cycling electrons around PSI and replenishing the PQ pool with electrons from stromal reductants. Interestingly, PGR5 abundance was not significantly increased in LL plants and, as suggested by PGR5 overexpression in Flaveria bidentis (Tazoe et al., 2020), this CEF route is more likely involved in photoprotection of PSI in both M and BS cells than in production of extra ATP in BS cells.
The more oxidised PQ pool in LL BS thylakoids, as revealed by the faster re‐oxidation of QA − (Figure 5), is consistent with the lower intercellular malate flux in LL plants. If NDH mediated the reduction of PSI from stromal reductants, as proposed above, the redox state of the PQ pool would correspond to the stromal availability of NADPH and ultimately to the influx of malate to BS cells. Consistently, activity of PEPC , which is responsible for the production of C4 acids in M cells and is light‐activated (Bailey et al., 2007), was lower in LL plants (Table 1). Light regulation of PEPC allows the supply of NADPH to BS cells to be matched with the BS capacity for ATP production upon changes of irradiance (von Caemmerer and Furbank, 2003; Pfeffer and Peisker, 1998).
The redox state of the PQ pool could affect supramolecular organisation of PSII to facilitate gross O2 evolution when the malate supply to BS cells is limited, that is, in LL conditions (Figure 6). PSII‐LHCII supercomplexes, prevalent in LL BS thylakoid, are more stable and capable of higher O2 evolution rates than monomers (Danielsson et al., 2006; Hankamer et al., 1997). It was shown in Z. mays, S. bicolor and F. bidentis that oxygenic activity of PSII in the BS could be scaled down by reducing the abundance of small subunits PsbP, PsbQ and PsbR required to stabilise the O2‐evolving complex (Höfer et al., 1992; Meierhoff and Westhoff, 1993). However, it was noted by Romanowska et al. (2006) that the loss of these subunits may result from the enzymatic treatment of BS strands, while, in our untreated BS preparations, PsbQ was more abundant than D1 both for HL and LL plants, suggesting that PsbQ was not limiting O2 evolution (Figure 3).
Since PSII‐LHCII supercomplexes provide a binding site for the grana formation between the stroma‐exposed protein residues of two complexes (Albanese et al., 2020), the rudimental grana present in LL BS cells (Figure 6) could have formed because more supercomplexes were available in response to the lower redox state of the PQ pool (Figure 5). In C3 plants, the disassembly of PSII‐LHCII supercomplexes (during the LHCII state transitions or for the repair process) is dependent on the STATE TRANSITION 8 (STN8) kinase phosphorylating the PSII core proteins D1, D2 and CP43 (Dietzel et al., 2011; Tikkanen et al., 2008). The activity of STN8 requires reduced Cytb 6 f and was proposed to respond to the redox state of the PQ pool (Betterle et al., 2015; Rochaix, 2013). Although in C4 chloroplast proteome studies STN8 was identified with confidence only in M cells (Majeran et al., 2008), the phosphorylated D1 was detected in the BS of Z. mays (Rogowski et al., 2019). Therefore, it is conceivable that an active influx of malate causing overreduction of the PQ pool in HL BS cells could increase STN8 activity and lead to the disassembly of PSII‐LHCII supercomplexes, consequently lowering PSII activity. Monomeric PSII with limited oxygenic activity, detected in HL BS thylakoids (Figure 6, Table 1), was observed in other NADP‐ME species (Hernández‐Prieto et al., 2019; Majeran et al., 2008) and might have a role in photoprotection of BS cells, allowing the dissipation of excess absorbed light via photoinhibitory quenching (Malnoë, 2018). Alternatively, plants might retain monomeric PSII in BS cells to ensure fast assembly of PSII‐LHCII supercomplexes during the progressive shading of leaves in the canopy. Whilst an adjustment of the PSII supramolecular composition could represent a short/medium‐term response to irradiance, the persistent overreduction of the PQ pool in HL BS cells may have driven a long‐term response of decreasing the overall PSI/PSII ratio mediated by regulation of gene expression (Pfannschmidt et al., 1999). However, it is possible the formation of PSII‐LHCII supercomplexes and the PSI/PSII ratio respond to other regulatory signals accompanying changes in irradiance, that is, NAPDH/NADP+ or ATP/ADP.
The adjustment of PSII activity through the redox state of the PQ pool explains contrasting acclimation strategies of NADP‐ME plants, as well as the increased LEF and the granal organisation of BS chloroplasts in NAD‐ME plants (Ghannoum et al., 2005; Ueno et al., 2005). The rate of NADPH supply to the BS can be decreased by diverting a part of the oxaloacetate produced by PEPC to aspartate, which then moves to the BS and is reconverted to oxaloacetate and decarboxylated through PEPCK or by NADP‐ME after re‐reduction to malate (Furbank, 2011). The reduction state of the PQ pool may depend on the activity of these redundant decarboxylating pathways, explaining the great variability of PSII content in BS cells of NADP‐ME plants (Chapman and Hatch, 1981; Meister et al., 1996) and the variability in the acclimation of light reactions in NADP‐ME plants (Rogowski et al., 2019). The universal nature of PQ‐mediated regulation of light reactions gives hope that BS chloroplasts of C3 plants engineered with the NADP‐ME C4 pathway (Ermakova et al., 2020, 2021) will adjust their PSII activity according to the amount of NADPH provided by malate decarboxylation.
CONCLUSION
We examined the effect of growth at low irradiance on thylakoid composition in M and BS chloroplasts of S. viridis. We showed that S. viridis grown under LL enhanced the photosynthetic capacity of BS cells, suggesting an increased energy demand in that compartment, although maintaining strikingly similar CO2 assimilation rates to HL plants. Detailed characterisation of PSII activity in BS cells revealed that, similarly to C3 plants, the redox state of the PQ pool could affect the composition of the electron transport chain in response to irradiance. In the companion paper (Bellasio and Ermakova, 2021), we address a contribution of the detected electron transport changes to leaf‐level photosynthetic efficiency, providing fodder for improving yield of C4 crops and engineering C4 pathway into C3 plants.
EXPERIMENTAL PROCEDURES
Plant growth conditions
Seeds of S. viridis (A10 ecotype) were germinated in individual 2‐L pots containing garden soil with 2 cm of commercial seed raising mix layered on top (Debco, Tyabb, Australia), both with 1 g L−1 of slow release fertilizer (Osmocote, Scotts, Bella Vista, Australia). Plants were grown in controlled environmental chambers with a 16 h/8 h light/dark period, 28°C day, 24°C night, and 60% humidity. Light at 1000 µmol m−2 sec−1 (measured at the pot level) was supplied by halogen incandescent lamps (42 W 2800 K warm white clear glass 630 lumens, CLA, Brookvale, Australia) and Pentron Hg 4 ft fluorescent tubes (54 W 4100 K cool white, Sylvania, Wilmington, MA, USA). Part of the cabinet was covered with a shade cloth to reduce irradiance to 300 µmol m−2 sec−1. All measurements were performed on the youngest fully expanded leaves sampled before flowering between 15 and 25 days after germination.
Enzyme activities
Soluble protein was extracted from frozen leaf discs and PEPC activity was measured by spectrophotometric assay after Pengelly et al. (2010). The amount of Rubisco active sites was assayed by [14C] carboxyarabinitol bisphosphate binding as described in Ruuska et al. (2000).
Western blotting and microscopy
BS strands were isolated following Ghannoum et al. (2005). Leaves were homogenised by Omni Mixer (Thermo Fisher Scientific, Tewksbury, MA, USA) during three 10‐s cycles at intensity #7 in 100 ml of ice‐cold 50 mm phosphate buffer (pH 7.5) containing 2 mm ethylenediaminetetraacetic acid (EDTA), 5 mm MgCl2, 5 mm dithiothreitol and 0.33 m sorbitol. The homogenate was passed through a tea strainer to remove large debris and then BS strands were collected from the filtrate on an 80‐µm nylon filter (Merck, Burlington, MA, USA).
For protein isolation, frozen leaf discs were ground in ice‐cold glass homogenisers and isolated BS strands were ground with a pestle in a chilled mortar, both in 0.5 ml of ice‐cold 100 mm trisaminomethane‐HCl buffer (pH 7.8) with 25 mm NaCl, 20 mm EDTA, 20 g L−1 sodium dodecyl sulphate, 10 mm dithiothreitol and 20 ml L−1 protease inhibitor cocktail (Sigma‐Aldrich, St Louis, MO, USA). Aliquots were taken for chlorophyll analysis and then extracts were incubated at 65°C for 10 min and centrifuged at 13 000 g for 1 min at 4°C. Protein extracts were supplemented with 4× XT Sample buffer (BioRad, Hercules, CA, USA) and separated by polyacrylamide gel electrophoresis (Nu‐PAGE 4–12% Bis‐Tris gel, Invitrogen, Life Technologies Corporation, Carlsbad, CA, USA). Proteins were transferred to a nitrocellulose membrane and probed against photosynthetic proteins with antibodies according to manufacturers’ protocols (Agrisera, Vännäs, Sweden). BS preparations had negligible M contamination, as demonstrated by the immunodetection of PEPC (Figure S1).
M and BS thylakoid isolation, Blue‐Native gel electrophoresis and immunoblotting followed Ermakova et al. (2019). Ultrathin sections for transmission electron microscopy (TEM) were prepared after Danila et al. (2019) and examined using a Hitachi HA7100 (Hitachi High Technologies, Santa Clara, CA, USA) at 75 kV.
Chlorophyll and starch
Total chlorophyll was extracted from frozen leaf discs ground using TissueLyser II (Qiagen, Venlo, The Netherlands) or from protein samples in 80% acetone, buffered with 25 mm HEPES‐KOH (pH 7.8). Chlorophyll a and b content was measured at 750 nm, 663.3 nm and 646.6 nm, and calculated according to Porra et al. (1989). Chlorophyll a/b ratios were determined for BS cells directly from isolated BS strands, while M cell ratios were determined from the mesophyll sap released upon leaf rolling as described in Covshoff et al. (2012). The fraction of total leaf chlorophyll in BS cells was calculated as x from: ax + b(1 − x) = c, where a is the chlorophyll a/b ratio of BS cells, b is the chlorophyll a/b ratio of M cells and c is the chlorophyll a/b ratio of leaf. The fraction of total leaf chlorophyll in BS cells was also calculated based on immunodetection of SBPase (located exclusively in BS cells) from the BS and leaf samples normalised on chlorophyll basis (Figure S2):
For starch assay, frozen leaf discs were collected 1 h after the light onset and ground with a TissueLyser II. Soluble sugars were removed (three extractions with 80% ethanol: incubation for 20 min at 80°C and centrifugation for 5 min at 13 000 g ). Pellets were dried for 15 min at 55°C and starch was assayed with the HK Assay Kit (Megazyme, Bray, Ireland), following the manufacturer’s instructions.
Dry matter N content
For dry matter nitrogen content, oven‐dried leaves were ground to a consistent powder and the percentage nitrogen was calculated by combustion of samples in an elemental analyser (EA1110, Carlo Erba, Cornaredo, Italy).
P700 spectroscopy on bundle sheath strands
BS strands were isolated by the differential grinding method (Furbank and Badger, 1983), resuspended in activity buffer (10 mm HEPES‐KOH [pH 7.4], 2 mm MgCl2, 2 mm KH2PO4, 10 mm KCl, 0.3 m sorbitol) to a chlorophyll (a + b) concentration of 25–30 µg ml−1 and kept on ice. One millilitre of BS suspension was supplied with 10 mm malate, 5 mm dihydroxyacetone phosphate, 15 mm ribose‐5‐phosphate and 100 mm NaHCO3 – metabolites required to support CO2 assimilation (Furbank and Badger, 1983) – and 200 µm of MV or 25 µm DCMU when indicated. The suspension was mixed and BS strands were allowed to sink in a cuvette for 1 min in darkness. After that, the P700+ signal was measured from the bottom of the cuvette by Dual‐PAM/F (Walz, Effeltrich, Germany). The level of P700+ was first recorded in darkness for 1 min and then monitored upon the illumination with red actinic light of 1000 µmol m−2 sec−1. Time constants of P700 oxidation were obtained by exponential fitting in OriginPro 2018b (OriginLab Corp., Northampton, MA, USA).
Mass spectrometric O2 exchange on bundle sheath strands
BS samples (1 ml) were supplied with the metabolites required to support CO2 assimilation and filtered via gentle vacuum onto a glass fibre filter (Whatman, Buckinghamshire, UK) through a 10.2‐mm aperture. A disc of 10.0 mm was cut from the centre of the filter, saturated with 50 µl of the activity buffer with the metabolites and loaded onto a steel mesh within a 1‐ml stainless steel cuvette. The cuvette was equilibrated to 25°C via a circulating water bath (Julabo, Seelbach, Germany). The bottom was sealed with a gas‐permeable Teflon membrane (Hansatech, Norfolk, UK) while the top lid had a quartz window through which halogen light was supplied through a fibre optic and a septum. The cuvette was purged with compressed air and then injected with 2% 18O2 (99%, Sigma‐Aldrich) and 2% CO2 (BOC, Sydney, Australia). After 5 min in darkness for equilibration, gross rates of O2 production and O2 consumption were measured for 5 min in the dark and for 5 min at 1000 µmol m−2 sec−1 via Delta V MIMS (Thermo Electron Corp, Bremen, Germany) resolving the evolution of 16O2 (the product of splitting H2 16O at natural abundance) from consumption of artificially enriched 18O2. Rates were calculated according to Beckmann et al. (2009).
PSII activity and electron paramagnetic resonance
PSII activity of thylakoid membranes at a chlorophyll (a + b) concentration of 10 µg ml−1 and 25°C was measured as the rate of oxygen evolution with a Clark electrode (Hansatech Instruments, UK) under white light irradiance (1000 µmol m−2 sec−1) in 20 mm 2‐(N‐morpholino)ethanesulfonic acid‐NaOH buffer (pH 6.5), 400 mm sucrose, 15 mm NaCl and 5 mm MgCl2, with 2 mm ferricyanide and 0.2 mm DCBQ as electron acceptors.
The flash‐induced variable fluorescence decay (Krause and Weis, 1991; Maxwell and Johnson, 2000) was measured using an FL3000 dual modulation kinetic fluorometer (Photon Systems Instruments, Drasov, Czech Republic) as described in Volgusheva et al. (2016). Samples were measured at a chlorophyll (a + b) concentration of 10 µg ml−1 and 20 µm DCMU. The fluorescence kinetics were analysed by fitting the multiexponential decay components in Origin 2016 (OriginLab Corp.). Thermoluminescence glow curves, a useful complement to the analysis of the fluorescence kinetics (Vass, 2003; Volgusheva et al., 2016), were measured with a TL200/PMT thermoluminescence system (Photon Systems Instruments) after Volgusheva et al. (2016) at a chlorophyll (a + b) concentration of 150 µg ml−1 and 40 µm DCMU.
Electron paramagnetic resonance (EPR) of Tyrosine D radical from PSII and P700+ from PSI (one radical per reaction centre) was quantified with a Bruker EMX‐micro spectrometer (Bruker BioSpin, Rheinstetten, Germany) equipped with an EMX‐Premium bridge and an ER4119HS resonator using a quartz flat cell as described in Danielsson et al. (2004); 15 mm ferricyanide was added when indicated.
Gas exchange
The net CO2 assimilation rate was measured using an LI‐6800 portable gas exchange system (LI‐COR Biosciences, Lincoln, NE, USA) under red‐blue (90%/10%) actinic light. Leaves were equilibrated at 400 ppm CO2 in the reference side at a flow rate 300 µmol sec−1, a leaf temperature of 28°C and irradiance of either 1000 or 300 µmol m−2 sec−1.
Statistical analysis
For all measurements, the relationship between mean values for HL and LL plants was tested using a two‐tailed, heteroscedastic Student t‐test (Microsoft Excel® 2016).
Author Contributions
ME, SvC and RTF designed the project; ME, FM and DF designed and performed experiments; ME, CB, DF and FM analysed data; ME, CB, FM and SvC wrote the article with contribution of all co‐authors.
Conflict of interest
The authors declare no conflict of interest.
Supporting information
Figure S1. Contamination of bundle sheath (BS) preparations with mesophyll cells, as assessed by PEPC immunoblotting.
Figure S2. Immunodetection of SBPase.
Figure S3. Immunodetection of D1.
Figure S4. Immunodetection of plastid terminal oxidase (PTOX).
Table S1. Analysis of the decay kinetics of flash‐induced variable fluorescence.
Acknowledgements
We thank Soumi Bala for help with the enzyme activity measurements, Florence Danila and Joanne Lee for TEM and Hilary Stuart‐Williams for the nitrogen elemental analysis. We thank the Centre for Advanced Microscopy at the Australian National University and the Australian Plant Phenomics Facility supported under the National Collaborative Research Infrastructure Strategy of the Australian Government. This research was supported by the Australian Research Council Centre of Excellence for Translational Photosynthesis (CE140100015). CB was funded by an H2020 Marie Skłodowska‐Curie Individual Fellowship (DILIPHO, ID: 702755).
Data Availability
The datasets analysed in this work are available from the corresponding author on request.
References
- Albanese, P. , Tamara, S. , Saracco, G. , Scheltema, R.A. & Pagliano, C. (2020) How paired PSII–LHCII supercomplexes mediate the stacking of plant thylakoid membranes unveiled by structural mass‐spectrometry. Nature Communications, 11, 1361. [DOI] [PMC free article] [PubMed] [Google Scholar]
- Andersen, K.S. , Bain, J.M. , Bishop, D.G. & Smillie, R.M. (1972) Photosystem II activity in agranal bundle sheath chloroplasts from zea mays. Plant Physiology, 49, 461–466. [DOI] [PMC free article] [PubMed] [Google Scholar]
- Bailey, K.J. , Gray, J.E. , Walker, R.P. & Leegood, R.C. (2007) Coordinate regulation of phosphoenolpyruvate carboxylase and phosphoenolpyruvate carboxykinase by light and CO2 during C4 photosynthesis. Plant Physiology, 144, 479–486. [DOI] [PMC free article] [PubMed] [Google Scholar]
- Baker, N.R. , Long, S.P. & Ort, D.R. (1988) Photosynthesis and temperature, with particular reference to effects on quantum yield. Symposia of the Society for Experimental Biology, 42, 347–375. [PubMed] [Google Scholar]
- Beckmann, K. , Messinger, J. , Badger, M.R. , Wydrzynski, T. & Hillier, W. (2009) On‐line mass spectrometry: membrane inlet sampling. Photosynthesis research, 102, 511–522. [DOI] [PMC free article] [PubMed] [Google Scholar]
- Bellasio, C. & Ermakova, M. (2021) Resolving leaf level metabolism of C4 Setaria viridis acclimated to low light through a biochemical model. BioRxiv. 10.1101/2021.04.11.439306. [DOI] [Google Scholar]
- Bellasio, C. & Griffiths, H. (2014) The operation of two decarboxylases (NADPME and PEPCK), transamination and partitioning of C4 metabolic processes between mesophyll and bundle sheath cells allows light capture to be balanced for the maize C4 pathway. Plant Physiology, 164, 466–480. [DOI] [PMC free article] [PubMed] [Google Scholar]
- Bellasio, C. & Lundgren, M.R. (2016) Anatomical constraints to C4 evolution: light harvesting capacity in the bundle sheath. New Phytologist, 212, 485–496. [DOI] [PubMed] [Google Scholar]
- Betterle, N. , Ballottari, M. , Baginsky, S. & Bassi, R. (2015) High Light‐dependent phosphorylation of photosystem II inner antenna CP29 in monocots is STN7 independent and enhances nonphotochemical quenching. Plant Physiology, 167, 457. [DOI] [PMC free article] [PubMed] [Google Scholar]
- Boardman, N.K. (1977) Comparative photosynthesis of sun and shade plants. Annual Review of Plant Physiology, 28, 355–377. [Google Scholar]
- Chapman, K.S.R. , Berry, J.A. & Hatch, M.D. (1980) Photosynthetic metabolism in bundle sheath cells of the C4 species Zea mays: sources of ATP and NADPH and the contribution of photosystem II. Archives of Biochemistry and Biophysics, 202, 330–341. [DOI] [PubMed] [Google Scholar]
- Chapman, K.S.R. & Hatch, M.D. (1981) Aspartate Decarboxylation in bundle sheath‐cells of Zea mays and its Possible contribution to C4 photosynthesis. Australian Journal of Plant Physiology, 8, 237–248. [Google Scholar]
- Covshoff, S. , Furbank, R.T. , Leegood, R.C. & Hibberd, J.M. (2012) Leaf rolling allows quantification of mRNA abundance in mesophyll cells of sorghum. Journal of Experimental Botany, 64, 807–813. [DOI] [PubMed] [Google Scholar]
- Danielsson, R. , Albertsson, P.‐Å. , Mamedov, F. & Styring, S. (2004) Quantification of photosystem I and II in different parts of the thylakoid membrane from spinach. Biochimica et Biophysica Acta (BBA) ‐ Bioenergetics, 1608(1), 53–61. [DOI] [PubMed] [Google Scholar]
- Danielsson, R. , Suorsa, M. , Paakkarinen, V. , Albertsson, P.‐Å. , Styring, S. , Aro, E.‐M. et al. (2006) Dimeric and monomeric organization of photosystem II: distribution of five distinct complexes in the different domains of the thylakoid membrane. Journal of Biological Chemistry. 281, 14241–14249. [DOI] [PubMed] [Google Scholar]
- Danila, F.R. , Quick, W.P. , White, R.G. , von Caemmerer, S. & Furbank, R.T. (2019) Response of plasmodesmata formation in leaves of C4 grasses to growth irradiance. Plant, Cell & Environment, 42, 24822492. [DOI] [PubMed] [Google Scholar]
- Dengler, N.G. & Nelson, T. (1999) Leaf structure and development in C4 plants. In: Sage, R.F. & Monson, R.K. (Eds.) C4 plant biology. San Diego: Academic Press. [Google Scholar]
- Dietzel, L. , Bräutigam, K. , Steiner, S. , Schüffler, K. , Lepetit, B. , Grimm, B. et al . (2011) Photosystem II supercomplex remodeling serves as an entry mechanism for state transitions in Arabidopsis. The Plant Cell, 23, 2964–2977. [DOI] [PMC free article] [PubMed] [Google Scholar]
- Drozak, A. & Romanowska, E. (2006) Acclimation of mesophyll and bundle sheath chloroplasts of maize to different irradiances during growth. Biochimica et Biophysica Acta (BBA) ‐ Bioenergetics, 1757(11), 1539–1546. [DOI] [PubMed] [Google Scholar]
- Ermakova, M. , Arrivault, S. , Giuliani, R. , Danila, F. , Alonso‐Cantabrana, H. , Vlad, D. et al. (2021) Installation of C4 photosynthetic pathway enzymes in rice using a single construct. Plant Biotechnology Journal, 19, 575–588. [DOI] [PMC free article] [PubMed] [Google Scholar]
- Ermakova, M. , Danila, F.R. , Furbank, R.T. & von Caemmerer, S. (2020) On the road to C4 rice: advances and perspectives. The Plant Journal, 101, 940–950. [DOI] [PMC free article] [PubMed] [Google Scholar]
- Ermakova, M. , Lopez‐Calcagno, P.E. , Raines, C.A. , Furbank, R.T. & von Caemmerer, S. (2019) Overexpression of the Rieske FeS protein of the Cytochrome b6f complex increases C4 photosynthesis in Setaria viridis . Communications Biology, 2, 314. [DOI] [PMC free article] [PubMed] [Google Scholar]
- Funk, E. , Schäfer, E. & Steinmüller, K. (1999) Characterization of the complex I ‐ homologous NAD(P)H‐plastoquinone‐oxidoreductase (NDH‐complex) of maize chloroplasts. Journal of Plant Physiology, 154, 16–23. [Google Scholar]
- Furbank, R.T. (2011) Evolution of the C4 photosynthetic mechanism: are there really three C4 acid decarboxylation types? Journal of Experimental Botany, 62, 3103–3108. [DOI] [PubMed] [Google Scholar]
- Furbank, R.T. & Badger, M.R. (1983) Photorespiratory characteristics of isolated bundle sheath strands of C4 monocotyledons. Functional Plant Biology, 10, 451–458. [Google Scholar]
- Ghannoum, O. , Evans, J.R. , Chow, W.S. , Andrews, T.J. , Conroy, J.P. & von Caemmerer, S. (2005) Faster rubisco is the key to superior nitrogen‐use efficiency in NADP‐Malic enzyme relative to NAD‐Malic enzyme C4 grasses. Plant Physiology, 137, 638–650. [DOI] [PMC free article] [PubMed] [Google Scholar]
- Goss, T. & Hanke, G. (2014) The end of the line: can ferredoxin and ferredoxin NADP(H) oxidoreductase determine the fate of photosynthetic electrons? Current Protein & Peptide Science, 15, 385–393. [DOI] [PMC free article] [PubMed] [Google Scholar]
- Hankamer, B. , Barber, J. & Boekema, E.J. (1997) Structure and membrane organization of photosystem ii in green plants. Annual Review of Plant Physiology and Plant Molecular Biology, 48, 641–671. [DOI] [PubMed] [Google Scholar]
- Harrison, E.P. , Olcer, H. , Lloyd, J.C. , Long, S.P. & Raines, C.A. (2001) Small decreases in SBPase cause a linear decline in the apparent RuBP regeneration rate, but do not affect Rubisco carboxylation capacity. Journal of Experimental Botany, 52, 1779–1784. [DOI] [PubMed] [Google Scholar]
- Hasan, R. , Kawasaki, M. , Taniguchi, M. & Miyake, H. (2006) Salinity stress induces granal development in bundle sheath chloroplasts of maize, an NADP‐malic enzyme‐type C4 plant. Plant Production Science, 9, 256–265. [Google Scholar]
- Hernández‐Prieto, M.A. , Foster, C. , Watson‐Lazowski, A. , Ghannoum, O. & Chen, M. (2019) Comparative analysis of thylakoid protein complexes in the mesophyll and bundle sheath cells from C3, C4 and C3–C4 Paniceae grasses. Physiologia Plantarum, 166, 134–147. [DOI] [PubMed] [Google Scholar]
- Höfer, M.U. , Santore, U.J. & Westhoff, P.J.P. (1992) Differential accumulation of the 10‐, 16‐ and 23‐kDa peripheral components of the water‐splitting complex of photosystem II in mesophyll and bundle‐sheath chloroplasts of the dicotyledonous C4 plant Flaveria trinervia (Spreng.) C. Mohr. Planta, 186, 304–312. [DOI] [PubMed] [Google Scholar]
- Ivanov, B. , Asada, K. , Kramer, D.M. & Edwards, G. (2005) Characterization of photosynthetic electron transport in bundle sheath cells of maize. I. Ascorbate effectively stimulates cyclic electron flow around PSI. Planta, 220, 572–581. [DOI] [PubMed] [Google Scholar]
- Krause, G.H. & Weis, E. (1991) Chlorophyll fluorescence and photosynthesis: the basics. Annual Review of Plant Physiology and Plant Molecular Biology, 42, 313–349. [Google Scholar]
- Kromdijk, J. , Griffiths, H. & Schepers, H.E. (2010) Can the progressive increase of C4 bundle sheath leakiness at low PFD be explained by incomplete suppression of photorespiration? Plant Cell and Environment, 33, 1935–1948. [DOI] [PubMed] [Google Scholar]
- Long, S.P. (1993) The significance of light‐limited photosynthesis to crop canopy carbon gain and productivity ‐ a theoretical analysis. In: Abrol, Y.P. , Mohanty, P. & Govindjee . (Eds.) Photosynthesis: photoreactions to plant productivity. New Delhi: Oxford & IBH Publishing, pp. 547–560. [Google Scholar]
- Lundgren, M.R. , Osborne, C.P. & Christin, P.‐A. (2014) Deconstructing Kranz anatomy to understand C4 evolution. Journal of Experimental Botany, 65, 3357–3369. [DOI] [PubMed] [Google Scholar]
- Majeran, W. , Zybailov, B. , Ytterberg, A.J. , Dunsmore, J. , Sun, Q. & van Wijk, K.J. (2008) Consequences of C4 differentiation for chloroplast membrane proteomes in maize mesophyll and bundle sheath cells. Molecular & Cellular Proteomics, 7, 1609–1638. [DOI] [PMC free article] [PubMed] [Google Scholar]
- Malnoë, A. (2018) Photoinhibition or photoprotection of photosynthesis? Update on the (newly termed) sustained quenching component qH. Environmental and Experimental Botany, 154, 123–133. [Google Scholar]
- Mamedov, F. , Stefansson, H. , Albertsson, P.‐Å. & Styring, S. (2000) Photosystem II in different parts of the thylakoid membrane: a functional comparison between different domains. Biochemistry, 39, 10478–10486. [DOI] [PubMed] [Google Scholar]
- Matsumura, T. , Kimata‐Ariga, Y. , Sakakibara, H. , Sugiyama, T. , Murata, H. , Takao, T. et al. (1999) Complementary DNA cloning and characterization of ferredoxin localized in bundle‐sheath cells of maize leaves. Plant Physiology, 119, 481–488. [DOI] [PMC free article] [PubMed] [Google Scholar]
- Maxwell, K. & Johnson, G.N. (2000) Chlorophyll fluorescence ‐ a practical guide. Journal of Experimental Botany, 51, 659–668. [DOI] [PubMed] [Google Scholar]
- Meierhoff, K. & Westhoff, P.J.P. (1993) Differential biogenesis of photosystem II in mesophyll and bundle‐sheath cells of monocotyledonous NADP‐malic enzyme‐type C4 plants: the non‐stoichiometric abundance of the subunits of photosystem II in the bundle‐sheath chloroplasts and the translational activity of the plastome‐encoded genes. Planta, 191, 23–33. [Google Scholar]
- Meister, M. , Agostino, A. & Hatch, M.D. (1996) The roles of malate and aspartate in C‐4 photosynthetic metabolism of Flaveria bidentis (L). Planta, 199, 262–269. [Google Scholar]
- Munekage, Y. (2016) Light harvesting and chloroplast electron transport in NADP‐malic enzyme type C4 plants. Current Opinion in Plant Biology, 31, 9–15. [DOI] [PubMed] [Google Scholar]
- Munekage, Y.N. , Eymery, F. , Rumeau, D. , Cuine, S. , Oguri, M. , Nakamura, N. et al. (2010) Elevated expression of PGR5 and NDH‐H in bundle sheath chloroplasts in C‐4 flaveria species. Plant and Cell Physiology, 51, 664–668. [DOI] [PubMed] [Google Scholar]
- Munekage, Y. & Taniguchi, Y.Y. (2016) Promotion of cyclic electron transport around photosystem I with the development of C4 photosynthesis. Plant and Cell Physiology, 57, 897–903. [DOI] [PubMed] [Google Scholar]
- Nakamura, N. , Iwano, M. , Havaux, M. , Yokota, A. & Munekage, Y.N. (2013) Promotion of cyclic electron transport around photosystem I during the evolution of NADP–malic enzyme‐type C4 photosynthesis in the genus Flaveria. New Phytologist, 199, 832–842. [DOI] [PubMed] [Google Scholar]
- Pan, X. , Cao, D. , Xie, F. , Xu, F. , Su, X. , Mi, H. et al. (2020) Structural basis for electron transport mechanism of complex I‐like photosynthetic NAD(P)H dehydrogenase. Nature Communications, 11, 610. [DOI] [PMC free article] [PubMed] [Google Scholar]
- Peng, L. , Yamamoto, H. & Shikanai, T. (2011) Structure and biogenesis of the chloroplast NAD(P)H dehydrogenase complex. Biochimica et Biophysica Acta ‐ Bioenergetics, 1807, 945–953. [DOI] [PubMed] [Google Scholar]
- Pengelly, J.J.L. , Sirault, X.R.R. , Tazoe, Y. , Evans, J.R. , Furbank, R.T. & von Caemmerer, S. (2010) Growth of the C4 dicot Flaveria bidentis: photosynthetic acclimation to low light through shifts in leaf anatomy and biochemistry. Journal of Experimental Botany, 61, 4109–4122. [DOI] [PMC free article] [PubMed] [Google Scholar]
- Pfannschmidt, T. , Nilsson, A. & Allen, J.F. (1999) Photosynthetic control of chloroplast gene expression. Nature, 397(6720), 625–628. [Google Scholar]
- Pfeffer, M. & Peisker, M. (1998) CO2 gas exchange and phosphoenolpyruvate carboxylase activity in leaves of Zea mays L. Photosynthesis Research, 58, 281–291. [Google Scholar]
- Pick, T.R. , Brautigam, A. , Schluter, U. , Denton, A.K. , Colmsee, C. , Scholz, U. et al. (2011) Systems analysis of a maize leaf developmental gradient redefines the current C‐4 model and provides candidates for regulation. The Plant Cell, 23, 4208–4220. [DOI] [PMC free article] [PubMed] [Google Scholar]
- Pignon, C.P. , Jaiswal, D. , McGrath, J.M. & Long, S.P. (2017) Loss of photosynthetic efficiency in the shade. An Achilles heel for the dense modern stands of our most productive C4 crops? Journal of Experimental Botany, 68, 335–345. [DOI] [PMC free article] [PubMed] [Google Scholar]
- Porra, R.J. , Thompson, W.A. & Kriedemann, P.E. (1989) Determination of accurate extinction coefficients and simultaneous equations for assaying chlorophylls a and b extracted with four different solvents: verification of the concentration of chlorophyll standards by atomic absorption spectroscopy. Biochimica et Biophysica Acta (BBA) ‐ Bioenergetics, 975, 384–394. [Google Scholar]
- Rochaix, J.‐D. (2013) Redox regulation of thylakoid protein kinases and photosynthetic gene expression. Antioxidants & Redox Signaling, 18, 2184–2201. [DOI] [PMC free article] [PubMed] [Google Scholar]
- Rogowski, P. , Wasilewska‐Dębowska, W. , Krupnik, T. , Drożak, A. , Zienkiewicz, M. , Krysiak, M. et al. (2019) Photosynthesis and organization of maize mesophyll and bundle sheath thylakoids of plants grown in various light intensities. Environmental and Experimental Botany, 162, 72–86. [Google Scholar]
- Romanowska, E. , Drozak, A. , Pokorska, B. , Shiell, B.J. & Michalski, W.P. (2006) Organization and activity of photosystems in the mesophyll and bundle sheath chloroplasts of maize. Journal of Plant Physiology, 163, 607–618. [DOI] [PubMed] [Google Scholar]
- Romanowska, E. , Kargul, J. , Powikrowska, M. , Finazzi, G. , Nield, J. , Drozak, A. et al. (2008) Structural organization of photosynthetic apparatus in agranal chloroplasts of maize. Journal of Biological Chemistry, 283, 26037–26046. [DOI] [PMC free article] [PubMed] [Google Scholar]
- Ruuska, S.A. , Andrews, T.J. , Badger, M.R. , Price, G.D. & von Caemmerer, S. (2000) The role of chloroplast electron transport and metabolites in modulating Rubisco activity in tobacco. Insights from transgenic plants with reduced amounts of cytochrome b/f complex or glyceraldehyde 3‐phosphate dehydrogenase. Plant Physiology, 122, 491–504. [DOI] [PMC free article] [PubMed] [Google Scholar]
- Sage, R.F. (2014) Stopping the leaks: new insights into C4 photosynthesis at low light. Plant, Cell & Environment, 37, 1037–1041. [DOI] [PubMed] [Google Scholar]
- Sage, R.F. & McKown, A.D. (2006) Is C4 photosynthesis less phenotypically plastic than C3 photosynthesis?*. Journal of Experimental Botany, 57, 303–317. [DOI] [PubMed] [Google Scholar]
- Shikanai, T. (2016) Chloroplast NDH: a different enzyme with a structure similar to that of respiratory NADH dehydrogenase. Biochimica et Biophysica Acta (BBA) ‐ Bioenergetics, 1857(7), 1015–1022. [DOI] [PubMed] [Google Scholar]
- Takabayashi, A. , Kishine, M. , Asada, K. , Endo, T. & Sato, F. (2005) Differential use of two cyclic electron flows around photosystem I for driving CO2‐concentration mechanism in C4 photosynthesis. Proceedings of the National Academy of Sciences of United States of America, 102, 16898–16903. [DOI] [PMC free article] [PubMed] [Google Scholar]
- Tazoe, Y. , Hanba, Y.T. , Furumoto, T. , Noguchi, K. & Terashima, I. (2008) Relationships between quantum yield for CO2 assimilation, activity of key enzymes and CO2 leakiness in Amaranthus cruentus, a C4 dicot, grown in high or low light. Plant and Cell Physiology, 49, 19–29. [DOI] [PubMed] [Google Scholar]
- Tazoe, Y. , Ishikawa, N. , Shikanai, T. , Ishiyama, K. , Takagi, D. , Makino, A. et al. (2020) Overproduction of PGR5 enhances the electron sink downstream of photosystem I in a C4 plant, Flaveria bidentis. The Plant Journal, 103, 814–823. [DOI] [PubMed] [Google Scholar]
- Tikkanen, M. , Nurmi, M. , Kangasjärvi, S. & Aro, E.‐M. (2008) Core protein phosphorylation facilitates the repair of photodamaged photosystem II at high light. Biochimica et Biophysica Acta (BBA) ‐ Bioenergetics, 1777(11), 1432–1437. [DOI] [PubMed] [Google Scholar]
- Ubierna, N. , Sun, W. , Kramer, D.M. & Cousins, A.B. (2013) The Efficiency Of C4 photosynthesis under low light conditions in zea mays, miscanthus X giganteus and flaveria bidentis. Plant, Cell & Environment, 36, 365–381. [DOI] [PubMed] [Google Scholar]
- Ueno, O. , Yoshimura, Y. & Sentoku, N. (2005) Variation in the activity of some enzymes of photorespiratory metabolism in C4 grasses. Annals of Botany, 96, 863–869. [DOI] [PMC free article] [PubMed] [Google Scholar]
- Vass, I. (2003) The history of photosynthetic thermoluminescence. Photosynthesis Research, 76, 303–318. [DOI] [PubMed] [Google Scholar]
- Vass, I. , Kirilovsky, D. & Etienne, A.‐L. (1999) UV‐B radiation‐induced donor‐ and acceptor‐side modifications of photosystem II in the Cyanobacterium Synechocystis sp. PCC 6803. Biochemistry, 38, 12786–12794. [DOI] [PubMed] [Google Scholar]
- Volgusheva, A. , Kruse, O. , Styring, S. & Mamedov, F. (2016) Changes in the Photosystem II complex associated with hydrogen formation in sulfur deprived Chlamydomonas reinhardtii. Algal Research, 18, 296–304. [Google Scholar]
- von Caemmerer, S. & Furbank, R.T. (2003) The C4 pathway: an efficient CO2 pump. Photosynthesis Research, 77, 191–207. [DOI] [PubMed] [Google Scholar]
- von Caemmerer, S. & Furbank, R.T. (2016) Strategies for improving C4 photosynthesis. Current Opinion in Plant Biology, 31, 125–134. [DOI] [PubMed] [Google Scholar]
- Weber, A.P.M. & von Caemmerer, S. (2010) Plastid transport and metabolism of C3 and C4 plants — comparative analysis and possible biotechnological exploitation. Current Opinion in Plant Biology, 13, 256–264. [DOI] [PubMed] [Google Scholar]
Associated Data
This section collects any data citations, data availability statements, or supplementary materials included in this article.
Supplementary Materials
Figure S1. Contamination of bundle sheath (BS) preparations with mesophyll cells, as assessed by PEPC immunoblotting.
Figure S2. Immunodetection of SBPase.
Figure S3. Immunodetection of D1.
Figure S4. Immunodetection of plastid terminal oxidase (PTOX).
Table S1. Analysis of the decay kinetics of flash‐induced variable fluorescence.
Data Availability Statement
The datasets analysed in this work are available from the corresponding author on request.