

Abstract
Dysregulation of cardiovascular autonomic control is gaining recognition as a prevailing consequence of concussion injury. Characterizing the presence of autonomic dysfunction in concussed persons is inconsistent and conventional metrics of autonomic function cannot differentiate the presence/absence of injury. Mayer wave (MW) activity originates through baroreflex adjustments to blood pressure (BP) oscillations that appear in the low‐frequency (LF: 0.04–0.15 Hz) band of the BP and heart rate (HR) power spectrum after a fast Fourier transform. We prospectively explored MW activity (∼0.1 Hz) in 19 concussed and 19 noninjured athletes for 5 min while seated at rest within 48 h and 1 week of injury. MW activity was derived from the LF band of continuous digital electrocardiogram and beat‐to‐beat BP signals (LFHR, LF‐SBP, MWHR, and MW‐SBP, respectively); a proportion between MWBP and MWHR was computed (cMW). At 48 h, the concussion group had a significantly lower MWBP and cMW than controls; these differences were gone by 1 week. MWHR, LFHR, and LF‐SBP were not different between groups at either visit. Attenuated sympathetic vasomotor tone was present and the central autonomic mechanisms regulating MW activity to the heart and peripheral vasculature became transiently discordant early after concussion with apparent resolution by 1 week.
Keywords: mild traumatic brain injury, sympathetic nervous system, arterial blood pressure regulation, baroreflex
Characterizing the presence of autonomic dysfunction in concussed persons is inconsistent and conventional metrics of autonomic function cannot differentiate the presence/absence of injury. The current study demonstrates that Mayer wave activity at ∼0.1 Hz provides insight on autonomic dysfunction that occurs during the first week after sustaining a concussion that conventional metrics of cardiovascular autonomic nervous system function did not.

Introduction
The arterial baroreflex is the mechanism responsible for the regulation and buffering of acute perturbations to arterial blood pressure (ABP) in response to changing posture and physical or psychological demands that result in loading or unloading of the baroreceptors (i.e., rise or fall in ABP, respectively). 1 , 2 The baroreceptors are mechanosensitive nerve endings that innervate the adventitia of the carotid sinuses and aortic arch. 2 , 3 , 4 Upon mechanical deformation of the arterial wall with each ejection of blood, an action potential is triggered within the baroreceptors and transmitted through cranial nerves IX and X to a synapse in the nucleus tractus solitarius (NTS). From the NTS, there are neuronal projections to the insular cortex 5 and caudal ventrolateral medulla, which provides tonic inhibition of the rostral ventrolateral medulla (RVLM). 6 The RVLM is the primary regulatory center of the sympathetic nervous system (SNS); efferent signals descend from here through the spinal cord to SNS preganglionic nerve fibers, the sympathetic chain ganglia, and then the postganglionic projections to the end organs, such as the heart and peripheral vasculature. 6 , 7 The arterial baroreflex has sensitivity and tolerance to ABP perturbations, 8 and baroreceptor sensitivity (BRS) serves as an important indicator of cardiovascular autonomic nervous system (CV‐ANS) (dys)function in a range of health and disease conditions. 8
CV‐ANS dysfunction is becoming an increasingly recognized secondary consequence of concussion injuries. For reasons that are unclear and subject to speculation, 9 , 10 , 11 the pathophysiological consequences of concussion result in aberrant CV‐ANS functions after injury. Numerous reports demonstrate the presence of altered heart rate or blood pressure variability (HRV and BPV, respectively), 10 changes to the arterial pulse wave contours, 12 baroreceptor dysfunction, 13 , 14 , 15 , 16 and case reports of anomalous electrocardiogram (ECG) findings 17 , 18 in concussed individuals who are often compared with a matched control group of noninjured athletes undergoing parallel observations. The dysfunction is most often present in observations that occur early after an injury, with a resolution to control group levels at some remote period after the incident. 9 , 10 In some cases, there is evidence for a persistent disparity of CV‐ANS function from control group levels in those that are symptom‐free and presumed to have recovered from the concussion injury. 19 , 20 Similar to other symptoms that may be experienced after a concussion (i.e., posttraumatic headache, cognitive impairment, photosensitivity, etc.), it is likely that CV‐ANS dysfunction is not present in all individuals who experience an injury. Given the number of structures within the ANS involved in the regulation of beat‐to‐beat ABP, the complexities of their interactions, and the risk of influence by circadian rhythms or the psychophysiological state, conventional metrics of HRV or BPV may not be adequately capturing postinjury dysfunction and they have yet to identify those in whom CV‐ANS dysfunction is present after a concussion injury.
Mayer waves (MWs) 21 are cyclical variations in ABP that arise through baroreflex‐mediated adjustments to efferent sympathetic vasomotor tone. 22 , 23 The origin of MW activity is not fully agreed upon but is generally accepted to be a byproduct of changing efferent sympathetic outflow to vascular tissues and vagal activity to the sinoatrial node as a function of the arterial baroreflex. Our current understanding of MW origins come from various experiments in animals and humans that have targeted different centers, receptors, and pathways via pharmacological blockade. 22 , 23 , 24 In humans, MW activity can be found at a frequency of ∼0.1 Hz and quantified by performing spectral decomposition of continuous digital ABP recordings 25 , 26 , 27 and the cardiac R‐R interval as measured by an ECG. 28 , 29 , 30 A prior study by our group found that male athletes with a recent concussion injury had a marked reduction in BRS compared with a control group of male athletes without concussion. 15 The primary purpose of this report was to evaluate MW activity in the context of BRS among recently concussed athletes and noninjured controls during the first week following a concussion injury. A secondary aim was to discern if MW activity could provide objective evidence to identify those individuals with concussion in whom CV‐ANS dysfunction was most likely present after injury.
Methods
Participants
The study procedures were approved by the institutional review board and all participants provided written informed consent before participating. As part of the clinical evaluation at the time of a suspected injury that occurred during practice or competition, the athletes were evaluated and diagnosed by the sports medicine staff using accepted clinical practices guidelines of concussion assessment for both immediate on‐field and subsequent office‐based follow‐up evaluations that included symptom evaluation. 31 , 32 , 33 To determine the presence of a concussion, an injured athlete underwent a physical and neurological examination, an assessment of cognitive function and standing balance. These evaluations were aided by the use of the sport concussion assessment tool (SCAT), which is an industry standard in the evaluation of a suspected concussive head trauma. 31 , 32 , 33 If the injured party had positive signs and symptoms that were consistent with concussion, they were withheld from participation. In the event of a medical emergency (i.e., Glasgow Coma Scale <13, prolonged loss of consciousness, or worsening somatic/cognitive or other neurological symptoms), the injured athlete was taken to the emergency department. Otherwise, the injured party was reevaluated after a brief rest period to confirm the presence of symptoms. The final diagnosis of concussion was made by a physician trained in the care of mild traumatic brain injuries. Once the diagnosis was confirmed, the injured athlete was evaluated by sports medicine staff on a consistent daily basis over the subsequent days until the symptoms resolved. Clinical decision making on return‐to‐play (RTP) of concussed athletes was made by the sports medicine staff, and did not include any input from data collected in the research study. The number of days that an individual with concussion was symptomatic was tracked clinically and for this study were characterized as having symptoms for <7 days (i.e., RTP <1 week) or more than 1 week (i.e., RTP ≥ 1 week). Once the concussed athlete was free of symptoms, they began a five‐stage clinically driven RTP protocol.
For the purposes of research participation, a candidate with a concussion injury was deemed by the principal investigator to have capacity to provide informed consent by demonstrating the ability to orient to person, place, time, and a current event. To be eligible for the research study, the athlete with a diagnosed concussion injury must have sustained their injury within the previous 48 h, be able to demonstrate capacity to provide written informed consent, not be taking medications with direct or indirect actions on the cardiovascular or central nervous systems, and be free of acute illness or trauma that would otherwise minimize their ability to complete the study procedures. Participants for the control group were recruited from in‐season athletes with a goal of matching these individuals based on gender, sport, and when possible, sport position (attempt to account for fitness levels) with participants in the group with concussion. Control participants were enrolled based upon meeting the previously outlined guidelines, excepting for the presence of concussion. The number of diagnosed concussions that each participant sustained during their lifetime was obtained via self‐report. As a result of their injury and the timing of enrollment in the first study visit, athletes with concussion were at least 24 h removed from their most recent bout of exercise. These individuals were also unlikely to engage in strenuous exercise for the week between study visits due to the participation restrictions arising from the presence and persistence of concussion symptoms. Similarly, because our testing window occurred in the morning (details to follow), all control participants were at least 12 h removed from their most recent exercise bout before performing the study visits.
Data collection and signal processing
The initial study observation occurred in a research laboratory within 48 h of injury (i.e., Visit 1) and was repeated 1 week later (i.e., Visit 2); participants in the control group completed two visits separated by 1 week. Data collection occurred between 8:00 a.m. and 12:30 p.m. for all study visits and the second study visit occurred within a ±30‐min window of the start time from the initial visit to mitigate the impact from circadian variations. Similarly, participants were required to abstain from consuming alcohol‐containing or caffeinated beverages for at least 12 h prior to data collection. The laboratory environment was thermoneutral (i.e., ∼70 °F) and overhead lights were turned off; ambient lighting in the room came from exterior windows. At each study visit, a continuous 3‐lead ECG (Lead II) and beat‐to‐beat finger ABP monitor using photoplethysmography was collected during 5 min of quiescent seating. The seated upright position was selected as a means to provoke the CV‐ANS in a controlled and noneffort–dependent manner; this position requires accommodation by the ANS to buffer the hydrostatic gradient caused by the upright posture. ECG site preparation was performed according to clinical standards and the placement of three electrodes was standardized for continuous HR monitoring. Beat‐to‐beat ABP was obtained from the second and third finger of the right hand using a commercially available and FDA‐approved photoplethysmography‐based ABP monitor (CNAP Monitor 500, CNSystems Medizintechnik AG, Graz, Austria). Respiration rate was obtained using a respiration belt transducer (Biopac Systems Inc., Goleta, CA) that was placed distal to the xiphoid process and around the thorax.
After instrumentation and before data collection, participants remained seated in the upright position with their right arm elevated and resting on a foam pad at heart level and parallel to the surface of the floor with the elbow flexed to 90o at quiet rest for approximately 20 min to acclimate to the testing environment. After acclimation to the seated position, 5 min of continuous resting data were obtained during which the participants breathed at a self‐selected pace. Digital ECG, beat‐to‐beat ABP, and respiratory rate were collected at a sampling rate of 500 Hz with a commercially available data acquisition system (Biopac MP150, Biopac Systems Inc.) using proprietary software (Acknowledge v. 4.2, Biopac Systems Inc.). Data were archived for subsequent offline analysis. Finger ABP was calibrated by the device (CNAP Monitor 500, CNSystems Medizintechnik AG) for each data collection against the brachial artery pressure.
Offline data analysis was performed with customized programs created with LabVIEW software (National Instruments, Austin, TX). For each data file, the digital signals were visually inspected and ectopic beats, if present, were removed from the analysis using a customized LabVIEW program. Raw digital data files were filtered with a zero‐lag fourth‐order Butterworth filter with default cutoff frequencies of 6 Hz (high pass) and 100 Hz (low pass filter). Peak detection was performed on all QRS complexes and systolic blood pressure (SBP) peaks; the R‐R intervals and beat‐to‐beat SBP were interpolated to create separate continuous time series signals. HRV and BPV variability were calculated by power spectral analyses using a discrete Fourier transform. The resulting power spectra were numerically integrated and the area of the power spectral density (PSD) curve in the corresponding bandwidths for oscillations in the low‐frequency (LF; 0.04–0.15 Hz) and high‐frequency (HF; 0.15–0.40 Hz) power spectra was calculated to reflect: cardiac parasympathetic modulation (HF‐HRV); cardiac sympathetic and parasympathetic modulation (LF‐HRV); and sympathetic modulation of peripheral vasomotor tone (LF‐SBP). 34 , 35 , 36 , 37 The respiratory rate was confirmed by evaluating the corresponding spike and frequency in the HF band of the PSD curve at each visit. MW activity for ABP oscillations and heart period activity were obtained from the power spectrum density curves at ∼0.1 Hz (MW‐SBP and MW‐HR, respectively) by the analysis software. An example PSD curve is provided in Figure 1 to demonstrate the respective frequency bands and location of MW activity. To facilitate parametric statistical analyses, the respective HF‐HRV, LF‐HRV, LF‐SBP, MW‐HR, and MW‐SBP values for each participant were log10 transformed. The MW‐HR and MW‐SBP variables were also used to calculate the MW proportion (cMW = MW‐HR/MW‐SBP). Spontaneous BRS was calculated from the R‐R interval and beat‐by‐beat SBP using the bivariate phase rectified signal averaging technique. 38 The BRS was normalized (BRSn) to the corresponding mean directional SBP change for increasing (BRSn‐UP) and decreasing SBP (BRSn‐DN) within a participant's signal for each visit. 39 , 40 These values (e.g., BRSn‐UP and BRSn‐DN) were averaged to provide a single measure of BRS (BRSn‐Avg) for each subject and visit. These computations were identical to those in our prior report on BRS after concussion. 15
Figure 1.

Example power spectral density curve with high‐frequency (HF) and low‐frequency (LF) band ranges, and location of Mayer wave (MW) peak.
Statistical analyses
Values are expressed as group mean ± SD unless otherwise indicated. Pearson chi‐square tests were performed to determine if the groups differed for the composition of gender and ethnicity within the cohort. Between‐subjects analyses of variance (ANOVA) were performed to identify group differences (i.e., control and concussion) for demographic data (age, height, weight, and BMI) and Visit 1 hemodynamics (i.e., HR, SBP, and diastolic blood pressure (DBP)), CV‐ANS function (i.e., HF‐HRV, LF‐HRV, and LF‐SBP), respiration rate, BRS (i.e., BRSn‐Avg, BRSn‐Up, and BRSn_Dn), and MW outcomes (i.e., MW‐HR, MW‐SBP, and CMW) variables. The interaction effects from separate 2 × 2 (group: control, concussion; visit: Visit 1, Visit 2) mixed ANOVAs were performed to determine if group‐specific changes in hemodynamics (i.e., HR, SBP, and DBP), CV‐ANS function (i.e., HF‐HRV, LF‐HRV, and LF‐SBP), respiration rate, BRS (i.e., BRSn‐Avg, BRSn‐Up, and BRSn_Dn), and MW outcomes (i.e., MW‐HR, MW‐SBP, and CMW) variables occurred from Visit 1 to Visit 2. To explore the effect of RTP status on outcomes that were significant in the 2 × 2 analyses, separate 3 × 2 (group: control, RTP <1 week, RTP ≥1 week; visit: Visits 1 and 2) mixed ANOVAs were also performed. Statistical analyses were carried out using IBM SPSS® Statistics 25 (IBM, Armonk, NY) and Jamovi software (version 1.2), and figures were created with GraphPad Prism® (version 8.4.1 for Windows, GraphPad Software, San Diego, CA). An a priori level of significance was set at P ≤ 0.05.
Results
Nineteen intercollegiate athletes with a concussion and 19 control participants volunteered to participate in this prospective observational study. Demographic characteristics for the control and concussion groups are provided (Table 1). CV‐ANS and hemodynamic information are also provided for each group by visit (Table 2). The demographic composition of participants in the control and concussion groups was similar and there were no statistical differences between groups. At Visit 1, hemodynamics, respiratory rate, and CV‐ANS outcomes did not differ between groups, with the exception of MW‐SBP, which was significantly lower in the concussion compared with the control group (P = 0.015, 95% CI of the mean difference: −0.76 to −0.09, Cohen's d = −0.87, Table 2). However, the group × visit interaction effect (P = 0.09, partial η 2 = 0.08) did not reach significance. Separately, the group × visit interaction effect for LF‐HRV was significant (P = 0.045, partial η 2 = 0.11). However, the small effect size and marginal P value relative to the number of analyses performed suggests a likely trivial response in this variable. The MW‐HR and MW‐SBP plots are graphically depicted to demonstrate the group mean and individual outcomes for each visit (Fig. 2).
Table 1.
Demographic characteristics of participants
| Control | Concussion | Significance | ||
|---|---|---|---|---|
| (n = 19) | (n = 19) | 95% CI for mean difference | (P value) | |
| Age (years) | 19.8 ± 1.3 | 19.8 ± 1.5 | −0.97 to 0.97 | 1.00 |
| Height (m) | 1.71 ± 0.11 | 1.76 ± 0.14 | −0.03 to 0.13 | 0.20 |
| Weight (kg) | 70.2 ± 14.4 | 75.3 ± 15.1 | −4.39 to 13.7 | 0.30 |
| BMI (kg/m2) | 23.7 ± 2.2 | 24.4 ± 4.1 | −1.61 to 2.73 | 0.61 |
| Gender: M/F (n) | 10/9 | 11/8 | − | 1.00 |
| Ethnicity: AA/Cauc/Hisp (n) | 5/10/4 | 3/15/1 | − | 0.11 |
| Past concussions (n) | 0.9 ± 1.9 | 0.5 ± 0.7 | −0.22 to 1.07 | 0.19 |
note: Data are presented as group mean ± SD. P values represent significant group main effects.
BMI, body mass index; M, male; F, female; AA, African American; Cauc, Caucasian; Hisp, Hispanic.
Table 2.
Cardiovascular autonomic and hemodynamic profile of participants by visit and group
| Visit 1 | Visit 2 | ||||||
|---|---|---|---|---|---|---|---|
| Control | Concussion | P value (Group) | 95% CI (mean difference) | Control | Concussion | P (Group × Visit interaction) | |
| Heart rate (bpm) | 63 ± 7 | 61 ± 10 | 0.30 | −8.36 to 2.67 | 64 ± 9 | 64 ± 8 | 0.13 |
| Systolic blood pressure (mmHg) | 112 ± 20 | 118 ± 20 | 0.42 | −7.95 to 18.80 | 114 ± 12 | 117 ± 17 | 0.56 |
| Diastolic blood pressure (mmHg) | 62 ± 5 | 66 ± 9 | 0.36 | −2.70 to 7.23 | 66 ± 10 | 65 ± 11 | 0.47 |
| Respiration rate (breaths per minute) | 14.1 ± 0.6 | 14.0 ± 0.8 | 0.82 | −0.62 to 0.50 | 13.9 ± 0.6 | 14.0 ± 0.5 | 0.64 |
| Heart period power spectrum (ms2/Hz) | |||||||
| High frequency (0.15–0.40 Hz) | 3.33 ± 0.56 | 3.45 ± 0.47 | 0.49 | −0.22 to 0.46 | 3.31 ± 0.55 | 3.25 ± 0.52 | 0.31 |
| Low frequency (0.04–0.15 Hz) | 3.54 ± 0.52 | 3.65 ± 0.38 | 0.44 | −0.18 to 0.41 | 3.53 ± 0.42 | 3.46 ± 0.37 | 0.045 |
| Mayer wave activity (∼0.1 Hz) | 4.38 ± 0.57 | 4.38 ± 0.63 | 1.00 | −0.39 to 0.39 | 4.25 ± 0.65 | 4.16 ± 0.90 | 0.66 |
| Systolic blood pressure power spectrum (mmHg2/Hz) | |||||||
| Low frequency (0.04–0.15 Hz) | 1.03 ± 0.41 | 0.98 ± 0.51 | 0.64 | −0.38 to 0.24 | 1.02 ± 0.40 | 1.01 ± 0.40 | 0.71 |
| Mayer wave activity (∼0.1 Hz) | 1.89 ± 0.39 | 1.46 ± 0.60 | 0.015 | −0.76 to −0.09 | 1.88 ± 0.60 | 1.83 ± 0.58 | 0.092 |
| Mayer wave activity proportion (cMW) | 2.35 ± 0.46 | 3.36 ± 1.20 | <0.001 | 0.42–1.61 | 2.31 ± 0.63 | 2.36 ± 0.91 | <0.001 |
| Baroreceptor sensitivity (ms/mmHg) | |||||||
| BRSn‐Avg | 6.25 ± 2.56 | 2.91 ± 2.01 | <0.001 | –4.8 to –1.82 | 6.47 ± 2.37 | 4.05 ± 3.19 | 0.22 |
| BRSn‐Up | 6.12 ± 2.66 | 2.97 ± 2.02 | <0.001 | −4.7 to −1.59 | 6.25 ± 2.33 | 4.00 ± 3.24 | 0.23 |
| BRSn‐Dn | 6.46 ± 2.65 | 2.78 ± 2.10 | <0.001 | −5.26 to −2.10 | 6.69 ± 2.75 | 4.09 ± 3.20 | 0.17 |
note: Data are presented as the group mean ± SD. P values represent significant main effects for each visit.
bpm, beats per minute; BRSn, normalized baroreceptor sensitivity; Hz, hertz; mmHg, millimeters of mercury.
Figure 2.

Truncated violin plots demonstrating the Mayer wave activity in the HR and SBP signals by group and visit. Each violin plot presents the group median (‐ ‐ ‐ ‐) and interquartile range (·····). The truncation of each plot represents the minimum and maximum observation for each group. The dark circles within each plot represent each participant's data. * P < 0.001.
The result of the BRS analyses showed significant main effects for group for all BRS indices (BRSn‐UP: P = 0.001, d = −0.26, 95% CI of the mean difference: −1.32 to 0.162; BRSn‐Dn: P < 0.001, d = −0.324, 95% CI of the mean difference: −1.56 to 0.01; BRSn‐Avg: P < 0.001, d = −3.04, 95% CI of the mean difference: −0.68 to 0.06; Table 2). These results indicate large differences in BRS between those who have experienced a concussion compared with controls. None of the BRS group × visit interaction effects were significant (all P’s > 0.17), indicating no group‐specific differences from Visit 1 to Visit 2. The main effects for visit were not significant for BRSn‐Up (P = 0.12), BRSn‐Dn (P = 0.053), or BRSn‐Avg (P = 0.07). Since this effect was collapsed across group, the effect is not central to our research question.
The ratio between the MW‐HR and MW‐SBP, referred to as the cMW, was significantly elevated in the concussion group compared with the controls at Visit 1 (P < 0.001, 95% CI: 0.42–1.61, d = 1.12; Fig. 3). The group × visit interaction effect was significant (P < 0.001, partial η 2 = 0.26) showing a marked decline in the concussion group from Visit 1 to Visit 2 (Fig. 3). The cMW demonstrated that more than 50% of the participants with concussion exceeded the control group distribution at V1; the cMW proportion of 3.0 appeared to be the threshold beyond which this differentiation occurred.
Figure 3.

Truncated violin plots demonstrating the Mayer wave proportion by group and visit. Each violin plot presents the group median (‐ ‐ ‐ ‐) and interquartile range (·····). The truncation of each plot represents the minimum and maximum observation for each group. The dark circles within each plot represent each participant's data. * P < 0.001.
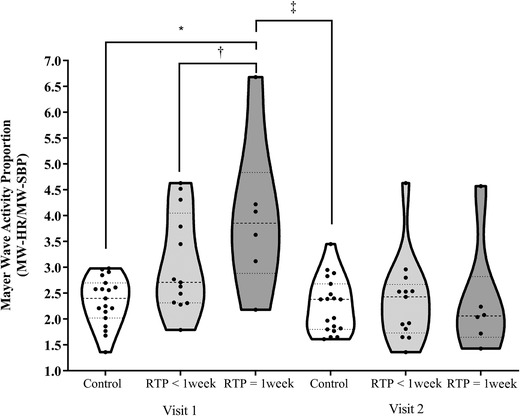
For the secondary analyses exploring the role of RTP status on cMW and BRSn‐AVG, 13 participants with concussion were found to have symptoms for less than 1 week (i.e., RTP <1 week) and six were symptomatic for more than 1 week (i.e., RTP ≥1 week). Between‐subjects ANOVA at Visit 1 for cMW revealed that a significant difference existed between groups (P < 0.001, η 2 = 0.33). For this comparison, five out of six participants with RTP ≥1 week and five out of 13 participants with RTP <1 week exceeded the 3.0 proportion. Tukey post‐hoc tests indicated that the RTP ≥1 week group had a significantly greater cMW than the controls (P = 0.001, 95% CI: 0.64–2.63) and trended toward a significant difference between the RTP <1‐week group and control group (P = 0.064, 95% CI: −0.04 to 1.49) and between the RTP >1 week and RTP <1 week groups (P = 0.10, 95% CI: −0.14 to 1.95) (Fig. 4). The interaction effect for the group × visit analysis (P < 0.0001, partial η 2 = 0.36) revealed the presence of a different group response in cMW from Visit 1 to Visit 2. Tukey post‐hoc tests indicated that the RTP ≥1 week group had a significantly greater change in cMW than the control group from Visit 1 to Visit 2 (P < 0.001, 95% CI: −2.53 to −0.68), while the comparisons between +1 week and −1 week (P = 0.065, 95% CI: −1.89 to 0.05) and between −1 week and controls (P = 0.06, 95% CI: −1.39 to 0.03) did not reach significance. For the same analyses of BRSn‐AVG, between‐subjects ANOVA at Visit 1 revealed that a significant difference existed between groups (P < 0.0001, η 2 = 0.36). Tukey post‐hoc tests indicated that the control group had a significantly higher BRSn‐AVG than the RTP ≥1 week group (P = 0.006, 95% CI: 0.96–6.29) and the RTP <1 week group (P = 0.001, 95% CI: 1.15–5.25) (Fig. 5). The interaction effect for the group × visit analysis (P = 0.15) did not achieve significance for the BRSn‐AVG response from Visit 1 to Visit 2.
Figure 4.
Truncated violin plots demonstrating the Mayer wave proportion by RTP group and visit. Each violin plot presents the group median (‐ ‐ ‐ ‐) and interquartile range (·····). The truncation of each plot represents the minimum and maximum observation for each group. The dark circles within each plot represent each participant's data. * P = 0.001, † P = 0.07, ‡ P < 0.0001.
Figure 5.

Truncated violin plots demonstrating the BRSn‐Avg by RTP group and visit. Each violin plot presents the group median (‐ ‐ ‐ ‐) and interquartile range (·····). The truncation of each plot represents the minimum and maximum observation for each group. The dark circles within each plot represent each participant's data. * P < 0.001; † P < 0.05.
Discussion
The current report has several novel insights as to how MW activity can inform about the presence of CV‐ANS dysfunction after concussion injury while measurements were taken in the seated position during the first postinjury week. The changes in BRSn‐AVG between groups at Visit 1 confirm our prior observations of reduced BRS after concussion 15 and underlie the impaired arterial baroreflex after concussion injury. The quantification of MW activity in the HR and SBP signals demonstrated that a concussion injury differentially impacted the CV‐ANS outflow to the cardiac pacemaker and peripheral vasculature. The differential impact was highlighted by the computation of the cMW, which is the computed proportion between the respective MW activity in the HR and SBP signals. First, cMW was different between concussion and control groups within 48 h of injury (e.g., Visit 1) and demonstrated that more than 50% of the participants with concussion exceeded the control group distribution at Visit 1, with a proportion value of 3.0 appearing to be the point of delineation. If not for two control participants at Visit 2, the former statement would have been true for each visit as 36 out of 38 control group observations were less than 3.0. Second, cMW identified a large percentage of those participants with concussion who experienced longer symptoms after injury, as demonstrated by the duration of time until entering the RTP protocol. In this scenario, ∼38% of participants with RTP <1 week and ∼83% of participants with RTP ≥1 week exceeded the 3.0 proportion. There were no demographic or injury‐related outcomes from the study that provided a basis for the differences between those participants with concussion who had similar cMW, but different RTP durations. Third, given that the cMW is a proportion, the analyses revealed that the MW‐HR activity was very consistent between groups and across visits, but the MW‐SBP activity was below the control group observations in more than half of the participants with concussion at Visit 1; this threshold corresponded to an MW‐SBP amplitude of ∼1.4 mmHg2/Hz. Finally, with the exception for the BRS outcomes, the conventional metrics of CV‐ANS function did not identify any group differences at the corresponding study visits. More specifically, the MW‐SBP activity at ∼0.1 Hz identified a seemingly aberrant vasomotor pattern that the conventional LF‐SBP metric, which encompasses the entire 0.04–0.15 Hz range, did not.
Under normal circumstances, the initiation of physiological work from a resting state or an orthostatic challenge leads to a well‐orchestrated CV‐ANS response to accommodate cardiac output and total peripheral resistance to meet the increasing demand or to buffer the SBP perturbation. These responses are completed through a several‐step process and the magnitude of the response is partially determined by the initial blood pressure changes sensed by the loading/unloading of the arterial baroreceptors. Briefly, parasympathetic nervous system activity through the vagus nerve (cranial nerve X) is withdrawn from the sinoatrial node, permitting the heart rate (HR) to increase. In addition, resting state tonic inhibition of the RVLM is unencumbered and the disinhibited state permits an increase of SNS outflow to the peripheral vasculature, sinoatrial node, and myocardium. The timing of these events is not entirely synchronized and the changes to HR precede the SBP response. It may be possible that the different MW activity in the HR and SBP signals among all participants, which is highlighted by the cMW, represents an intrinsic difference in the beat‐to‐beat regulation of the effector organs (i.e., heart and vasculature) under normal physiological situations. The concussive event disrupts this normal balance/rhythm, most notably to the peripheral vasculature in ∼50% of the concussed participants, leading to a larger cMW. Albeit not in the context of MW activity, a prior report demonstrated that the central autonomic centers and peripheral effector organs are subject to uncoupling after a traumatic brain injury such that HRV and BRS are inversely associated with the severity of neurological injury. 41 Researchers who study CV‐ANS dysfunction after concussion posit that abnormal observations of HRV, BPV, or BRS after injury represent a lower magnitude uncoupling of what was previously demonstrated. 9 , 10 , 11 , 14 , 16 The computation of cMW appears to be the first parameter to objectively quantify this phenomenon such that specific individuals who may be subject to the greatest risk of having sustained a more severe neurological injury from the concussive event are identifiable.
MW oscillations in the ABP signal are strongly correlated with muscle sympathetic nerve activity (MSNA), 25 , 26 , 42 which is an invasive data collection procedure that uses a microelectrode inserted into a superficial, peripheral nerve. 43 , 44 The burst amplitude and activation patterns of MSNA have been rigorously studied and are an accepted measurement of sympathetic outflow from the central nervous system. 25 , 26 , 42 MW activity is ablated under controlled experimental conditions in neurologically intact persons receiving pharmacological blockade of sympathetic outflow. 45 , 46 In addition, demonstrations of blunted or paradoxical MW activity in the ABP signal of persons with spinal cord injury reinforce the impact of central nervous system trauma and blunted sympathetic outflow in real‐life conditions. 47 , 48 , 49 , 50 , 51 Therefore, a finding that approximately 50% of our concussion cohort had significantly blunted MW‐SBP activity within 48 h of injury suggests that these persons experienced a diminution of efferent sympathetic outflow, despite having similar SBP and DBP measurements as the control group. The demonstration of reduced MW‐SBP early after concussion, but not 1 week later, is a likely reflection of secondary, indirect consequences of the concussive insult manifesting as dysregulation of autonomic integration in the central nervous system and efferent outflow through the SNS, as opposed to being a direct effect of trauma. The absence of group differences for MW‐HR activity was not entirely unexpected given that participants were in a seated and resting position, which are conditions predominated by parasympathetic drive to the sinoatrial node. Prior work in humans demonstrated that the use of atropine to induce a partial parasympathetic blockade of the heart decreased fluctuations across the HF and LF bands, which includes the MW frequency. 30
Unfortunately, the novelty of using MW activity in the evaluation of persons with concussion injury limits the ability to reconcile the present observations with those that are already in the literature. There is inconsistency in the concussion and autonomic dysfunction (AD) literature due in large part to the use of different technology and data acquisition devices, time points for data collection, the use of different positions and provocations, and an absence of consensus about the most appropriate variables to report for the time and frequency domains and other emerging outcomes. These sentiments are more thoroughly described in a recent systematic review of AD and concussion. 10 Nonetheless, the current findings highlight that individuals who sustain a concussion may not all have the same CV‐ANS reactions to injury. AD after a concussion does not appear to occur in all individuals following injury based on the similarity to control group observations at the 48‐h time point. The presentation of AD is more likely to manifest in a similar pattern of unpredictability and inconsistency that is known to occur with the conventional clinical symptoms (e.g., affective, cognitive, somatic, vestibular‐oculomotor, etc.). To account for this likelihood, the field will have to adopt new approaches and reach consensus on how to stratify concussed individuals by the presence or absence of AD, as opposed to only categorizing them as having a concussion. Further work is needed to help characterize how cMW or MW‐SBP can inform about the presentation of AD and reduced BRS after concussion. In addition, the use of self‐reported symptoms and their respective magnitude, as well as other positive findings of dysfunction, should be incorporated into future studies to enable a better understanding of the functional impacts of AD on the postconcussive experience.
Limitations and future directions
Some limitations of our study need to be considered. First, our cohort of concussed athletes was a small and fairly homogeneous sample of college‐aged athletes, and the generalizability of the results to the general population is limited. This study, like others that evaluate CV‐ANS after concussion, did not have preinjury data from which the postinjury outcomes could be compared with. A larger and more diverse cohort of recently concussed athletes from a broad range of sports is needed to reproduce our findings to enhance generalizability and long‐term implications. The present study was performed while the participants were in the seated position. Therefore, these findings and threshold values are unlikely to be repeated if persons are evaluated in different postures (e.g., supine and standing) or while physiological and psychological provocations are performed.
Conclusion
The current study demonstrates that MW activity at ∼0.1 Hz provides insight on AD that occurs during the first week after sustaining a concussion that conventional metrics of CV‐ANS function did not. The observed changes in MW activity after concussion were most notable in the ABP signal, suggesting that central efferent autonomic outflow to the peripheral vasculature was disrupted in some participants with concussion, but not others, without having an impact on SBP or DBP. With further exploration, this approach has the potential to serve as an autonomic biomarker to identify AD after concussion, especially in those with a longer symptomatic presentation.
Author contributions
M.F.L. was involved in conception and study design, acquisition of data, data/statistical analysis with interpretation, manuscript preparation, and final approval of the manuscript. A.N.H. and C.L.L. were involved in acquisition of data, manuscript preparation, and final approval of the manuscript. A.J.T. was involved in conception and study design, manuscript preparation, and final approval of the manuscript. J.P.W. was involved in data/statistical analysis with interpretation, manuscript preparation, and final approval of the manuscript.
Competing interests
The authors declare no competing interests.
Acknowledgments
Preparation of this manuscript was supported by the New Jersey Commission for Brain Injury Research Individual Research Grant #CBIR16IRG025.
References
- 1. Benarroch, E.E. 2008. The arterial baroreflex: functional organization and involvement in neurologic disease. Neurology 71: 1733–1738. [DOI] [PubMed] [Google Scholar]
- 2. Kirchheim, H.R. 1976. Systemic arterial baroreceptor reflexes. Physiol. Rev. 56: 100–177. [DOI] [PubMed] [Google Scholar]
- 3. Landgren, S. 1952. On the excitation mechanism of the carotid baroceptors. Acta Physiol. Scand. 26: 1–34. [DOI] [PubMed] [Google Scholar]
- 4. Landgren, S. 1952. The baroceptor activity in the carotid sinus nerve and the distensibility of the sinus wall. Acta Physiol. Scand. 26: 35–56. [DOI] [PubMed] [Google Scholar]
- 5. Torrealba, F. & Muller C.. 1996. Glutamate immunoreactivity of insular cortex afferents to the nucleus tractus solitarius in the rat: a quantitative electron microscopic study. Neuroscience 71: 77–87. [DOI] [PubMed] [Google Scholar]
- 6. Guyenet, P.G. 1990. Role of the ventral medulla oblongata in blood pressure regulation. In Central Regulation of Autonomic Functions. Loewy A.D. & Spyer K.M., Eds.: 145–167. New York: Oxford University Press. [Google Scholar]
- 7. Robertson, D. , Biaggioni I., Burnstock G., et al. 2012. Primer on the Autonomic Nervous System. Oxford: Academic Press. [Google Scholar]
- 8. Chapleau, M.W. , Li Z., Meyrelles S.S., et al. 2001. Mechanisms determining sensitivity of baroreceptor afferents in health and disease. Ann. N.Y. Acad. Sci. 940: 1–19. [DOI] [PubMed] [Google Scholar]
- 9. Bishop, S.A. , Dech R.T., Guzik P., et al. 2018. Heart rate variability and implication for sport concussion. Clin. Physiol. Funct. Imaging 38: 733–742. [DOI] [PubMed] [Google Scholar]
- 10. Blake, T.A. , McKay C.D., Meeuwisse W.H., et al. 2016. The impact of concussion on cardiac autonomic function: a systematic review. Brain Inj. 30: 132–145. [DOI] [PubMed] [Google Scholar]
- 11. La Fountaine, M.F. 2018. An anatomical and physiological basis for the cardiovascular autonomic nervous system consequences of sport‐related brain injury. Int. J. Psychophysiol. 132: 155–166. [DOI] [PubMed] [Google Scholar]
- 12. La Fountaine, M.F. , Toda M., Testa A.J., et al. 2016. Autonomic nervous system responses to concussion: arterial pulse contour analysis. Front. Neurol. 7: 13. [DOI] [PMC free article] [PubMed] [Google Scholar]
- 13. Heyer, G.L. , Fischer A., Wilson J., et al. 2016. Orthostatic intolerance and autonomic dysfunction in youth with persistent postconcussion symptoms: a head‐upright tilt table study. Clin. J. Sport Med. 26: 40–45. [DOI] [PubMed] [Google Scholar]
- 14. Dobson, J.L. , Yarbrough M.B., Perez J., et al. 2017. Sport‐related concussion induces transient cardiovascular autonomic dysfunction. Am. J. Physiol. Regul. Integr. Comp. Physiol. 312: R575–R584. [DOI] [PubMed] [Google Scholar]
- 15. La Fountaine, M.F. , Hohn A.N., Testa A.J., et al. 2019. Attenuation of spontaneous baroreceptor sensitivity after concussion. Med. Sci. Sports Exerc. 51: 792–797. [DOI] [PubMed] [Google Scholar]
- 16. Bishop, S. , Dech R., Baker T., et al. 2017. Parasympathetic baroreflexes and heart rate variability during acute stage of sport concussion recovery. Brain Inj. 31: 247–259. [DOI] [PubMed] [Google Scholar]
- 17. La Fountaine, M.F. , Toda M., Testa A., et al. 2014. Cardioautonomic instability following a sports‐related concussion in a 20‐year‐old male. Int. J. Cardiol. 172: e511–e512. [DOI] [PubMed] [Google Scholar]
- 18. La Fountaine, M.F. , Gossett J.D., De Meersman R.E., et al. 2011. Increased QT interval variability in 3 recently concussed athletes: an exploratory observation. J. Athl. Train. 46: 230–233. [DOI] [PMC free article] [PubMed] [Google Scholar]
- 19. Memmini, A.K. , Fountaine M.F., Broglio S.P., et al. 2021. Long‐term influence of concussion on cardio‐autonomic function in adolescent hockey players. J. Athl. Train. 56: 141–147. [DOI] [PMC free article] [PubMed] [Google Scholar]
- 20. Haider, M.N. , Johnson B.D., Horn E.C., et al. 2020. Blunted cardiac parasympathetic activation in student athletes with a remote history of concussion: a pilot study. Front. Neurol. 11: 547126. [DOI] [PMC free article] [PubMed] [Google Scholar]
- 21. Mayer, S. 1876. Studien zur physiologie des herzes und der blutgefasse. Sitz. Kaiser. Akad. Wiss. 74: 281–307. [Google Scholar]
- 22. Julien, C. 2006. The enigma of Mayer waves: facts and models. Cardiovasc. Res. 70: 12–21. [DOI] [PubMed] [Google Scholar]
- 23. Ghali, M.G.Z. & Ghali G.Z.. 2020. Mechanisms contributing to the generation of Mayer waves. Front. Neurosci. 14: 395. [DOI] [PMC free article] [PubMed] [Google Scholar] [Retracted]
- 24. Cohen, M.A. & Taylor J.A.. 2002. Short‐term cardiovascular oscillations in man: measuring and modelling the physiologies. J. Physiol. 542: 669–683. [DOI] [PMC free article] [PubMed] [Google Scholar]
- 25. Cooke, W.H. , Hoag J.B., Crossman A.A., et al. 1999. Human responses to upright tilt: a window on central autonomic integration. J. Physiol. 517: 617–628. [DOI] [PMC free article] [PubMed] [Google Scholar]
- 26. Furlan, R. , Porta A., Costa F., et al. 2000. Oscillatory patterns in sympathetic neural discharge and cardiovascular variables during orthostatic stimulus. Circulation 101: 886–892. [DOI] [PubMed] [Google Scholar]
- 27. Kamiya, A. , Hayano J., Kawada T., et al. 2005. Low‐frequency oscillation of sympathetic nerve activity decreases during development of tilt‐induced syncope preceding sympathetic withdrawal and bradycardia. Am. J. Physiol. Heart Circ. Physiol. 289: H1758–H1769. [DOI] [PubMed] [Google Scholar]
- 28. Bergfeldt, L. & Haga Y.. 2003. Power spectral and Poincare plot characteristics in sinus node dysfunction. J. Appl. Physiol. (1985) 94: 2217–2224. [DOI] [PubMed] [Google Scholar]
- 29. de Boer, R.W. , Karemaker J.M. & Strackee J.. 1985. Spectrum of a series of point events, generated by the integral pulse frequency modulation model. Med. Biol. Eng. Comput. 23: 138–142. [DOI] [PubMed] [Google Scholar]
- 30. Scheffer, G.J. , TenVoorde B.J., Karemaker J.M., et al. 1994. Effects of epidural analgesia and atropine on heart rate and blood pressure variability: implications for the interpretation of beat‐to‐beat fluctuations. Eur. J. Anaesthesiol. 11: 75–80. [PubMed] [Google Scholar]
- 31. McCrory, P. , Meeuwisse W.H., Aubry M., et al. 2013. Consensus statement on concussion in sport: the 4th International Conference on Concussion in Sport, Zurich, November 2012. J. Athl. Train. 48: 554–575. [DOI] [PMC free article] [PubMed] [Google Scholar]
- 32. Harmon, K.G. , Drezner J., Gammons M., et al. 2013. American Medical Society for Sports Medicine position statement: concussion in sport. Clin. J. Sport Med. 23: 1–18. [DOI] [PubMed] [Google Scholar]
- 33. Herring, S.A. , Cantu R.C., Guskiewicz K.M., et al. 2011. Concussion (mild traumatic brain injury) and the team physician: a consensus statement–2011 update. Med. Sci. Sports Exerc. 43: 2412–2422. [DOI] [PubMed] [Google Scholar]
- 34. Akselrod, S. , Gordon D., Ubel F.A., et al. 1981. Power spectrum analysis of heart rate fluctuation: a quantitative probe of beat‐to‐beat cardiovascular control. Science 213: 220–222. [DOI] [PubMed] [Google Scholar]
- 35. Pomeranz, B. , Macaulay R.J., Caudill M.A., et al. 1985. Assessment of autonomic function in humans by heart rate spectral analysis. Am. J. Physiol. 248: H151–H153. [DOI] [PubMed] [Google Scholar]
- 36. Malliani, A. , Pagani M., Lombardi S., et al. 1991. Cardiovascular neural regulation explored in the frequency domain. Circulation 84: 482–492. [DOI] [PubMed] [Google Scholar]
- 37. Furlan, R. , Guzzetti S., Crivellaro W., et al. 1990. Continuous 24‐hour assessment of the neural regulation of systemic arterial pressure and RR variabilities in ambulant subjects. Circulation 81: 537–547. [DOI] [PubMed] [Google Scholar]
- 38. Bauer, A. , Barthel P., Muller A., et al. 2009. Bivariate phase‐rectified signal averaging–a novel technique for cross‐correlation analysis in noisy nonstationary signals. J. Electrocardiol. 42: 602–606. [DOI] [PubMed] [Google Scholar]
- 39. Muller, A. , Morley‐Davies A., Barthel P., et al. 2012. Bivariate phase‐rectified signal averaging for assessment of spontaneous baroreflex sensitivity: normalization of the results. J. Electrocardiol. 45: 77–81. [DOI] [PubMed] [Google Scholar]
- 40. Bauer, A. , Morley‐Davies A., Barthel P., et al. 2010. Bivariate phase‐rectified signal averaging for assessment of spontaneous baroreflex sensitivity: pilot study of the technology. J. Electrocardiol. 43: 649–653. [DOI] [PubMed] [Google Scholar]
- 41. Goldstein, B. , Toweill D., Lai S., et al. 1998. Uncoupling of the autonomic and cardiovascular systems in acute brain injury. Am. J. Physiol. 275: R1287–R1292. [DOI] [PubMed] [Google Scholar]
- 42. Pagani, M. , Montano N., Porta A., et al. 1997. Relationship between spectral components of cardiovascular variabilities and direct measures of muscle sympathetic nerve activity in humans. Circulation 95: 1441–1448. [DOI] [PubMed] [Google Scholar]
- 43. Hagbarth, K.E. & Vallbo A.B.. 1968. Pulse and respiratory grouping of sympathetic impulses in human muscle‐nerves. Acta Physiol. Scand. 74: 96–108. [DOI] [PubMed] [Google Scholar]
- 44. White, D.W. , Shoemaker J.K. & Raven P.B.. 2015. Methods and considerations for the analysis and standardization of assessing muscle sympathetic nerve activity in humans. Auton. Neurosci. 193: 12–21. [DOI] [PMC free article] [PubMed] [Google Scholar]
- 45. Cevese, A. , Gulli G., Polati E., et al. 2001. Baroreflex and oscillation of heart period at 0.1 Hz studied by alpha‐blockade and cross‐spectral analysis in healthy humans. J. Physiol. 531: 235–244. [DOI] [PMC free article] [PubMed] [Google Scholar]
- 46. van de Borne, P. , Rahnama M., Mezzetti S., et al. 2001. Contrasting effects of phentolamine and nitroprusside on neural and cardiovascular variability. Am. J. Physiol. Heart Circ. Physiol. 281: H559–H565. [DOI] [PubMed] [Google Scholar]
- 47. Koh, J. , Brown T.E., Beightol L.A., et al. 1994. Human autonomic rhythms: vagal cardiac mechanisms in tetraplegic subjects. J. Physiol. 474: 483–495. [DOI] [PMC free article] [PubMed] [Google Scholar]
- 48. Guzzetti, S. , Cogliati C., Broggi C., et al. 1994. Influences of neural mechanisms on heart period and arterial pressure variabilities in quadriplegic patients. Am. J. Physiol. 266: H1112–H1120. [DOI] [PubMed] [Google Scholar]
- 49. Inoue, K. , Miyake S., Kumashiro M., et al. 1991. Power spectral analysis of blood pressure variability in traumatic quadriplegic humans. Am. J. Physiol. 260: H842–H847. [DOI] [PubMed] [Google Scholar]
- 50. Houtman, S. , Oeseburg B., Hughson R.L., et al. 2000. Sympathetic nervous system activity and cardiovascular homeostatis during head‐up tilt in patients with spinal cord injuries. Clin. Auton. Res. 10: 207–212. [DOI] [PubMed] [Google Scholar]
- 51. Munakata, M. , Kameyama J., Nunokawa T., et al. 2001. Altered Mayer wave and baroreflex profiles in high spinal cord injury. Am. J. Hypertens. 14: 141–148. [DOI] [PubMed] [Google Scholar]