

Abstract
Primary influent and final effluent samples were collected from wastewater treatment plants using either chlorination or ultraviolet (UV) disinfection biweekly for one year. Paired measurements were determined for fecal indicator bacteria (Escherichia coli and enterococci), cultivated bacteriophages (somatic, F+, and CB-390 coliphage and GB-124 Bacteroides phage), human-associated viral markers (human polyomavirus [HPyV] and crAssphage), enteric pathogens (adenovirus, noroviruses genogroups I and II) as well as total infectious enteric virus. To increase the probability of detecting low concentration targets, both primary (10L) and final effluent wastewater samples (40–100 L) were concentrated using a dead-end hollow-fiber ultrafilter (D-HFUF). Despite seasonal temperature fluctuations, concentration shifts of FIB, bacteriophages, human-associated viruses, and viral pathogens measured in primary influent samples were minimal, while levels of infectious enteric virus were significantly higher in the spring and fall (P range: 0.0003–0.0409). FIB levels measured in primary influents were 1–2 log10 higher than bacteriophage, human-associated viral markers (except crAssphage) and viral pathogens measured. FIB displayed the greatest sensitivity to chlorine disinfection, while crAssphage, adenoviruses and infectious enteric viruses were significantly less sensitive (P ≤ 0.0096). During UV treatment, bacteriophages F+ and GB-124 were the most resistant of the culturable viruses measured (P ≤ 0.001), while crAssphage were the most resistant (P ≤ 0.0124) overall. When UV lamps were inactive, infectious enteric viruses were significantly more resilient to upstream treatment processes than all other targets measured (P ≤ 0.0257). Similar to infectious enteric viruses and adenoviruses; GB-124, F+, and crAssphages displayed the highest resistance to UV irradiation, signaling a potential applicability as pathogen surrogates in these systems. The use of D-HFUF enhanced the ability to estimate removal of viruses through wastewater treatment, with the expectation that future applications of this method will be used to better elucidate viral behavior within these systems.
Keywords: Dead-end hollow-fiber ultrafilter (D-HFUF), Coliphage, crAssphage, Norovirus, Fecal indicator bacteria, Total infectious virus, Wastewater
Graphical Abstract

1. Introduction
Municipal wastewater treatment plants are engineered to remove chemical and microbiological contaminants allowing for safe discharge to environmental receiving waters. Removal technologies target microbiological contaminants through settling, biological inactivation, and chemical disinfection, with the performance of these systems evaluated using pathogen surrogates such as fecal indicator bacteria (i.e. Escherichia coli and enterococci) (FIB). FIB, however, may not always respond to wastewater treatments in a similar manner to pathogens (viruses and protozoa), making it unclear if these disinfection processes are sufficient to reduce virus levels present in wastewater to safe levels prior to discharge (Harwood et al., 2005; Tree et al., 1997). Viruses are physically smaller compared to bacteria and are not always effectively removed using settling processes, nor are viruses as susceptible to chemical disinfectants commonly used to remove bacteria from wastewater effluents (Gerba et al., 2018; Prado et al., 2011; Qiu et al., 2015). Furthermore, ultraviolet (UV) another common wastewater disinfection strategy has been shown to attenuate viral and bacterial targets with varying levels of success (Chern et al., 2014; Weng et al., 2018). For these reasons, viruses are reported to be the dominant health risk to people recreating in environmental waters impacted by wastewater treatment plant (WWTP) discharges (Hlavsa et al., 2015; Jiang et al., 2007).
There are currently more than 200 known virus strains capable of causing a variety of human illnesses (Woolhouse et al., 2012). Enteric viral infections often result in high host shedding rates (105–1012 virus particles/g), however, infectious doses tend to be low (2–100 virus particles) suggesting that exposure to wastewater in ambient water settings could lead to potential recreator illness (Atmar et al., 2008; Lindesmith et al., 2003; Teunis et al., 2008). Furthermore, virus persistence, susceptibility, and dispersion patterns in wastewater and ambient waters do not always mimic those of FIB suggesting that use of bacterial surrogates may not always signal the occurrence of these pathogens (Korajkic et al., 2020; Korajkic et al., 2018; Wanjugi et al., 2016). While the direct detection of pathogenic viruses would be ideal, it often proves difficult due to low concentrations in wastewater and ambient waters, requiring the use of labor intensive concentration techniques and complex detection assays that tend to perform better with one virus compared to another (Victoria et al., 2009). To improve the ability to signal the potential presence of disease-causing viruses in wastewater and ambient waters, bacteriophages (i.e. coliphage) have been proposed as a potential enteric virus surrogate (USEPA, 2015). Bacteriophages are viruses that infect a particular bacterial host group. Coliphage including somatic and F+ types are of interest because they are bacteriophage that infect E. coli and may be adequate surrogates for the presence of key enteric viruses (Nappier et al., 2019). Optimized concentration and detection protocols are available that can readily characterize coliphage levels in ambient waters (McMinn et al., 2017a; McMinn et al., 2017b; United States Environmental Protection Agency, 2018a, 2018b). However, a compatible concentration method is also needed to better detail coliphage persistence trends through wastewater treatment to compare with enteric virus persistence patterns.
Numerous concentration protocols are available for wastewater testing with most based on viral particle charge and/or size exclusion, each with varying capabilities to recover a target virus of interest. However, in highly turbid matrices such as wastewater, these approaches can show varying degrees of success due to filter fouling often resulting in low, inconsistent virus recoveries (Harwood et al., 2005; Schlindwein et al., 2010; Sedmak et al., 2005; Simmons and Xagoraraki, 2011). Recently, size exclusion filters such as those used for medical dialysis (i.e. hollow-fiber ultrafilters [D-HFUF]) have been successfully implemented for the concentration of viruses from different water types (i.e., potable, ambient, among others) (Hill et al., 2009; Liu et al., 2012; Morales-Morales et al., 2003). D-HFUF is a low cost, fully encapsulated option offering a large surface area making them less prone to fouling and clogging issues when processing turbid samples. D-HFUF protocols are also relatively simple to use compared to other common concentration techniques requiring less training for operation and it is field deployable. An additional benefit of the D-HFUF size exclusion approach is that pre-treatment of samples (i.e., pH adjustment) is not necessary, nor are the use of strong pH elution buffers required, which could potentially inactivate viruses and result in variable recoveries depending on the species. Taken together, application of D-HFUF should minimize the inactivation of sensitive viruses resulting in more consistent recoveries (Hill et al., 2009; McMinn, 2013; McMinn et al., 2012). As a result, information on the persistence of bacteriophage and human enteric viruses through wastewater treatment processes could be improved using a D-HFUF concentration protocol.
In addition to viral targets, the D-HFUF protocol has been used to concentrate viable bacteria such as E. coli and enterococci (Knappett et al., 2011; Leskinen and Lim, 2008; Morales-Morales et al., 2003), as well as recovery of ambient water microorganisms using molecular measurements (Leskinen et al., 2010; Rhodes et al., 2016). The ability for D-HFUF to concentrate a broad range of targets affords the opportunity to characterize a large collection of public health relevant microorganisms in a single concentration step. Paired measurements of FIB (E. coli and enterococci) used to evaluate wastewater treatment efficacy are rarely reported with corresponding bacteriophage information such as somatic coliphage, GB-124 bacteriophage, and the recently discovered crAssphage (Korajkic et al., 2020). Furthermore, there are currently no studies that also include quantitative information on key enteric viruses (e.g., noroviruses GI and GII) and total infectious virus. Previous research indicated that these different public health analytes of interest (i.e., enteric viruses) may exhibit different attenuation trends through wastewater treatment (Aghalari et al., 2020; Sidhu et al., 2018). With the data currently available, it is difficult to discern whether these attenuation differences are due to the use of different and variable concentration protocols and/or the wastewater treatment practices.
To address these research gaps, the D-HFUF concentration procedure was employed in a 12-month study collecting samples of primary and final wastewater effluent from one WWTP using UV disinfection and another facility employing chlorination/de-chlorination. Paired measurements were evaluated for removal of culturable FIB (E. coli and enterococci), four cultivated bacteriophages (somatic coliphage, F+ coliphage, total coliphage [CB-390], and GB-124 Bacteroides phage), two human-associated microbial source tracking (MST) genetic markers (crAssphage and HPyV), three enteric viral pathogens (adenoviruses and noroviruses GI and GII), as well as total infectious enteric viruses using mammalian cell culture.
2. Materials and methods
2.1. WWTP descriptions
Two WWTP facilities within the greater Cincinnati sewer district were sampled for this study. WWTP #1 (second largest treatment plant in the Cincinnati) services 237,000 customers and processes up to 55 million gallons of waste per day (MGD), incorporating the following treatments: (i) bar screen and grit removal (ii) primary settling and skimming, (iii) aeration tanks/secondary settling tanks using biological activation through aeration and activated sludge processes, (iv) chlorine contact tank with sodium hypochlorite, (v) de-chlorination using sodium bisulfite. WWTP #2 serves 55,143 customers generating mainly residential waste averaging 9 MGD and it incorporates the following treatments: (i) screening and grit removal, (ii) oxidation and secondary clarification tanks, (iii) filtration (sand), (iv) disinfection using a low-pressure UV light treatment. Treatment plants were selected based on final disinfection processes used for effluent treatment prior to discharge. WWTP #1 uses traditional chloramine treatment to disinfect final effluent prior to discharge, but only dechlorinates during the spring and summer months. WWTP #2 uses sand filtration followed by UV disinfection, but UV treatment is only used for a portion of the year (April–October). For this study, only primary influents and final wastewater effluents were sampled. For Plant #1, sodium thiosulfate was added (0.01 g/L) to all final effluent samples prior to sample processing to neutralize chlorine present.
2.2. Wastewater sampling
Samples of primary influent and final effluents at each plant were analyzed bi-monthly for one year totaling 24 sampling events per WWTP. During each sampling event, primary influent physical and chemical parameters were assessed including turbidity (FNU), pH, temperature (°C), dissolved oxygen (%), and conductivity (μs/cm) using a YSI ProDSS multiparameter water quality meter (YSI Inc., Yellow Springs, OH) following manufacturer’s instructions (Table 2).
Table 2.
Chemical and physical measurements from primary influents and tertiary effluents.
| Location and sample type | |||||
|---|---|---|---|---|---|
|
| |||||
| Chemical/physical measurement | WWTP #1 (P)1 | WWTP #1 (F/chlorine)2 | WWTP #2 (P) | WWTP #2 (F/UV)3 | WWTP #2 (F/no UV)4 |
|
| |||||
| Temperature (°C) | 17.75 ± 4.12 | 17.95 ± 3.92 | 18.70 ± 3.38 | 20.41 ± 2.37 | 15.36 ± 1.95 |
| Pressure (mm Hg) | 741.22 ± 4.84 | 750.57 ± 5.53 | 741.47 ± 3.66 | 749.83 ± 4.05 | 749.59 ± 3.19 |
| DO (%) | 41.01 ± 20.32 | 97.46 ± 1.63 | 20.93 ± 17.46 | 94.60 ± 5.80 | 78.10 ± 7.59 |
| Conductivity μs/cm) | 1342.17 ± 368.14 | 1194.48 ± 418.79 | 1147.48 ± 207.89 | 874.06 ± 237.29 | 824.08 ± 370.15 |
| pH | 7.62 ± 0.21 | 7.78 ± 0.52 | 7.62 ± 0.27 | 7.79 ± 0.14 | 8.52 ± 0.94 |
| Turbidity (FNU) | 24.15 ± 7.13 | 11.29 ± 15.79 | 37.26 ± 10.31 | 1.03 ± 1.83 | 0.22 ± 0.82 |
(P) refers to primary treated influent.
(F) refers to final treated effluent.
(F/UV) refers to UV treated final effluent.
(F/no UV) refers to final effluent with no UV treatment.
2.2.1. Primary influent sampling
Grab samples of primary influent to measure levels of FIB and bacteriophages were collected in sterile 1 L polypropylene containers and transported on ice to the laboratory for immediate processing (holding time < 30 min). Since FIB and bacteriophage concentrations are elevated in primary influent, decimal dilution series were prepared in sterile 1XPBS (0.137 M NaCl, 0.0027 M KCl, and 0.0119 M phosphate) (Sigma Aldrich, St. Louis, MO) to achieve quantifiable levels for culture analyses. For infectious enteric virus, as well as MST and pathogenic virus genetic measurements, 10 L of primary effluent were collected in a sterile carboy and transported to the laboratory (holding time < 1 h).
2.2.2. Final effluent sampling
Samples of final effluent to be analyzed for FIB were collected in sterile 1 L bottles and transported to the laboratory for analysis (holding time < 30 min). Levels of bacteriophage as well as pathogenic enteric viruses in final effluent were typically at concentrations too low to directly measure through grab sampling, necessitating the use of sample concentration to obtain quantifiable amounts. To accomplish this, final effluent samples were collected using a sterile, rinsed bucket from either an in-house tap (WWTP #1) or from a holding basin at (WWTP #2). Final effluent samples for all viral assays were filtered through a dead-end hollow-fiber ultrafilter (D-HFUF) using methods similar to those previously described (McMinn et al., 2017b). Briefly, between 20 and 40 L (depending on bacteriophage target) of final effluent were filtered through a single-use 15S Asahi Kasei Rexeed ultrafilter (Dial Medical Supply, Chester Springs, PA) using a peristaltic pump powered by an onsite electrical outlet. Two D-HFUF units were run in tandem per each sampling event, to capture quantifiable levels of all bacteriophage targets (somatic, F+ and CB-390 coliphages and GB-124). For infectious enteric virus and enteric viral pathogens, 100 L of final effluent was passed through a single use 25S Ashai Kasei Rexeed ultrafilter using methods described above. Following sample concentration, each D-HFUF unit was disconnected from the pump and the filter port was re-capped to seal, placed in a sterile, labeled zip lock bag, and transported on ice to the laboratory for further processing (holding time < 1 h).
2.3. Cultivation experiments
2.3.1. FIB enumeration
Upon arrival to the laboratory, samples of both primary influent and final effluent were diluted (if required) in sterile 1XPBS. Each sample was then analyzed in duplicate at two dilutions (ranging from: 10−2 to 10−4). Samples for FIB were processed in accordance with EPA Method 1600 and 1603 (EPA, 2006, 2014). Briefly, samples were passed through a 0.45 μm nitrocellulose membrane, the membrane was then placed on either mEI (BD Difco, Franklin Lakes, NJ) for enterococci enumeration or a modified mTEC agar (BD Difco, Franklin Lakes, NJ) for E. coli enumeration. The mEI plates were incubated for 16–18 h at 41 °C, while modified mTEC plates were initially incubated for 2 h at 35 °C, followed by 14–16 h incubation at 44.5 °C. The resulting colony forming units (CFU) specific for each media type were enumerated and reported per 100 mL (CFU/100 mL). During each sampling event, negative controls (sample substituted with sterile 1XPBS) and media sterility checks (plates containing media with no sample) yielded no detectable CFU, indicating absence of contamination.
2.3.2. Cultivated bacteriophage quantification
Primary influent grab samples were processed for levels of bacteriophage (somatic coliphage, F+ coliphage, total coliphage [CB-390], and GB-124 Bacteroides phage). To ensure recovery of quantifiable levels of bacteriophage, primary influent volumes between 0.1 mL and 10 mL (depending on phage type) were used. All bacteriophage were enumerated using EPA Method 1602 single agar layer method (SAL), with a few amendments (EPA, 2000; Fewtrell, 2001). Briefly, equal parts (100 mL) of a 2× concentration of molten tryptic soy agar (for somatic, F+, and CB-390) or a 2× concentration of BPRMA (for GB-124 Bacteroides phage) (Conda Laboratories, Madrid, Spain) containing appropriate concentrations of log-phase host bacteria was added to each sample dilution bottle containing measured portions of primary influent spiked 1XPBS, totaling 100 mL in volume (Ebdon et al., 2007; McMinn et al., 2014) (ISO 10705–4:2001, 2001; Agullo-Barcelo et al., 2016). For somatic, F+, and CB-390 assays antibiotics (100 μg/mL of nalidixic acid for host ΦX174, 15 μg/mL of streptomycin/ampicillin for host MS2, or 15 μL/mL ampicillin for host E. coli CB-390) amended with 0.5 M MgCl2 were mixed and spread over five 150 mm plates. For GB-124 assay antibiotics (100 μg/mL of nalidixic acid and 100 μg/mL of kanamycin monosulfate for B. fragilis host) were mixed and spread over five 150 mm petri plates (approx. 40 mL per plate)(Ebdon et al., 2007). Agar plates were incubated at 37 °C for 16–18 h, resulting coliphage plaque forming units (PFU) were enumerated the following day and reported as PFU/100 mL. Agar was allowed to solidify, and plates were inverted and incubated either aerobically (CB-390 coliphage) or in a 5% CO2 atmosphere (GB-124 phage) 37 °C for 16–18 h.
To determine bacteriophage levels from final effluent samples, each capped D-HFUF unit from field filtration were eluted with 200 mL of elution solution (0.01% Tween 80, 0.01% sodium hexametaphosphate, 0.001% Antifoam Y-30) (Sigma-Aldrich, St. Louis, MO). The elution solution was circulated through the filter, first in a clockwise pattern for 1 min., followed by a counterclockwise pattern for 1 min, and finally a clockwise (1 min) pattern. The resulting eluates (~200 mL per filter) were divided evenly, and each was analyzed for a separate bacteriophage target by the SAL culture procedure, previously described (McMinn et al., 2017b). During each experiment, negative controls (sample substituted with sterile 1XPBS) and media sterility checks (plates containing agar and antibiotics with no sample) yielded no detectable PFU, indicating absence of contamination in bacteriophage reagents used.
2.4. Infectious enteric virus analysis
Buffalo Green Monkey kidney cells (BGM), passages 112–145 were propagated in Dulbecco’s Modified Eagle Medium High Glucose (DMEM) (ThermoFisher Scientific, Waltham, Massachusetts) supplemented with 10% (v/v) fetal bovine serum (FBS) (Sigma-Aldrich) and incubated at 5% CO2 at 37 °C. BGM cells were seeded into 25cm2 vented capped cell culture flasks (Corning #1012628, ThermoFisher Scientific) at approximately 1.0 × 10⁵ viable cells/mL as determined by viability analysis using a Vi-Cell cell viability analyzer (Beckman Coulter, Indianapolis, IN). Cells reached confluency within three days of flask seeding and were prepared for virus infection by washing cell monolayers with 10 mL of Earle’s Balanced Salt Solution (EBSS) (Sigma-Aldrich) amended with 1% antibiotic/antimycotic (Thermofisher Scientific) per flask. One milliliter volumes of either sample concentrates (undiluted and serial 1:5 dilutions), sterile 1XPBS (negative control) or human coxsackievirus B4 (ATCC, Manassas, VA; Catalog # VR-184) for a positive culture control were used to inoculate each cell flask. Flasks were inoculated in replicates of 10 per each dilution series analyzed, and then rocked at room temperature for 90 min to allow for viral infection to take place. Following infection, 10 mL of maintenance media consisting of DMEM supplemented with 2% FBS and 1% antibiotic/antimycotic was added to each flask. All cell culture flasks were then incubated for two weeks under 5% CO2 atmosphere at 37 °C. Quantitation of infectious enteric viruses were determined by daily observations for cytopathic effect (CPE) in BGM cells, defined as displaying a minimum of 75% or greater cell monolayer degradation. Following a two-week infection cycle, positive and negative sample concentrate dilution series replicates were recorded and the results quantified using the most probable number (MPN) method (Agency, 2020). Resulting viral titers were expressed as log10 MPN infectious virus particles /100 mL for enteric viruses present.
2.5. Virus quantification with reverse-transcriptase qPCR (RT-qPCR) and qPCR
2.5.1. Wastewater sample concentration
Primary influent samples (10 L) were concentrated by D-HFUF in the laboratory using methods similar to those used for bacteriophage concentration (described above) and according to McMinn et al., 2017 (McMinn et al., 2017b). Following WWTP onsite concentration of 100 L of final wastewater effluent samples, 25S Ashai Kasei Rexeed ultrafilter filters (previously described) were eluted in the laboratory, resulting in approximately 400 mL of eluate (McMinn et al., 2017b). Filter eluates from both primary influent (200 mL) and final effluent (400 mL) were then further concentrated using the celite concentration procedure (McMinn et al., 2012; Rhodes et al., 2011). Briefly, BBL non-desiccated beef extract (VWR International, Radnor, PA) was added directly to the sample concentrate at a ratio of 3 g/100 mL and mixed until dissolved. To each solution, celite powder #577 (VWR International) was added at a ratio of 0.1 g/100 mL and mixed. The pH of the solution was adjusted to 4.0 using 1 N HCl and the mixture was slowly stirred for 10 min. Celite particles were pelleted via centrifugation (3,600×G for 10 min), the supernatant was then carefully removed. The pellet was resuspended in either 10 mL (200 mL primary eluates) or 20 mL (400 mL final eluates) of sterile 1XPBS at pH 9.0 and resuspended by vortex mixing, sample concentrates were then centrifuged (3,600×G for 10 m) to pellet celite particles. The resulting supernatant was collected and stored in 15 or 50 mL polystyrene falcon tubes (ThermoFisher Scientific) at −80 °C (≤ 6 months) until nucleic acid extraction.
2.6. Oligonucleotides and reference material preparation
Table 1 lists oligonucleotides for human-associated viral and pathogen genetic markers used in study. A single gBLOCK (Integrated DAN Technologies, Coralville, IA) reference material was designed to function with all qPCR and RT-qPCR genetic markers. The gBLOCK was reconstituted in AE buffer and quantified with a Qubit 4 Fluorometer (Invitrogen, Carlsbad, CA). The construct was then diluted in AE buffer to generate 10, 102, 103, 104, 105, and 106 copies/2 μL for calibrations standards. Calibrations models consisting of triplicate measurements for each dilution were generated with all instrument run and assay combinations. All reference materials were stored in GeneMate Slick low-adhesion microcentrifuge tubes (ISC BioExpress, Kaysville, UT) at −20 °C.
Table 1.
RT-qPCR and qPCR assay oligonucleotides and calibration model performance metrics.
| Viral target | Name | Sequence (5′ → 3′) | Y-intercept range | R2 range | Slope range | Amplification efficiency | References |
|---|---|---|---|---|---|---|---|
|
| |||||||
| Adenovirus | P: JTVXP | FAM-CTGGTGCAGTTCGCCCGTGCCA-TAMRA | 40.254–42.307 | 0.990–0.997 | −3.517 to −3.305 | 0.955 ± 0.027 | (Jothikumar et al., 2005a) |
| F: JTVXF | GGACGCCTCGGAGTACCTGAG | ||||||
| R: JTVXR | ACIGTGGGGTTTCTGAACTTGTT | ||||||
| Norovirus GI | P: NV1LCpr | FAM-TGGACAGGAGAYCGCRATCT-TAMRA | 37.987–39.580 | 0.990–0.998 | − 3.427 to−3.279 | 0.981 ± 0.020 | (da Silva et al., 2007; Svraka et al., 2007) |
| F: QNIF4 | CGCTGGATGCGNTTCCAT | ||||||
| R: NV1LCR | CCTTAGACGCCATCATCATTTAC | ||||||
| Norovirus GII | P: QNIFS | FAM-AGCACGTGGGAGGGCGATCG-TAMRA | 35.852–37.826 | 0.993–0.998 | − 3.533 to −3.145 | 0.974 ± 0.044 | (Loisy et al., 2005; Jothikumar et al., 2005b) |
| F: QNIF2d | ATGTTCAGRTGGATGAGRTTCTCWGA | ||||||
| R: COG2R | TCGACGCCATCTTCATTCACA | ||||||
| Hepatitis G | P: HepG-P | VIC-TCACCCATCCACCACCT-MGBNFQ | N/A | N/A | N/A | N/A | (Cashdollar et al., 2013) |
| F: HepG-F | GCAAGCCCCAGAAACCG | ||||||
| R: HepG-R | CAAGATGACCGGGATTTACGA | ||||||
| CrAssphage 056 | P: 056P1 | FAM-AATAACGATTTACGTGATGTAAC-MGBNFQ | 40.452–42.307 | 0.987–0.996 | −3.514 to − 3.397 | 0.951 ± 0.015 | (Farkas et al., 2019) |
| F: 056F1 | CAGAAGTACAAACTCCTAAAAAACGTA | ||||||
| R: 056R1 | GATGACCAATAAACAAGCCATTA | ||||||
| Human Polyomavirus | P: KGJ3 | FAM-TCATCACTGGCAAACAT-MG | 38.645–40.63 | 0.985–0.99 | −3.540 to 3.34 | 0.957 ± 0.027 | (McQuaig et al., 2006) |
| F: SM2 | AGTCTTTAGGGTCTTCTACCTTT | ||||||
| R: P6 | GGTGCCAACCTATGGAACAG | ||||||
2.6.1. Nucleic acid extraction
Viral nucleic acid was extracted from 200 μL portions of each sample concentrate using a Qiagen All Prep PowerViral Kit (Qiagen, Valencia, CA), according to manufacturer’s instructions. All purified extracts were analyzed by qPCR within 24 h of extraction. One extraction blank (EB) lacking sample concentrate (substituted with sterile reagent-grade water), was included with each extraction batch (batch = 12 samples).
2.6.2. RT-qPCR amplification
RT-qPCR amplification of norovirus (GI and GII) and the Armored RNA Hepatitis G (Asuragen, Austin, TX) control were achieved using the RNA UltraSense™ One-Step Quantitative RT-PCR System (Applied Biosystems, Foster City, CA) following manufacturer’s instructions. RT-qPCR reactions consisted of 1.25 μL enzyme mix, 5 μL of 5× reaction mix, 2.5 μL of BSA (0.2 mg/mL), 0.05 μL ROX, 3 μL RT-qPCR primer-probe mix (80 nM probe and 1 μM primer), 2 μL template, and 11.2 μL nuclease-free water, for a total reaction volume of 25 μL. One step RT-qPCR reaction conditions were as follows: 50 °C for 15 min, followed by 40 cycles of 95 °C for 2 min, 95 °C for 15 s, and 60 °C for 30 s. The RT-qPCR amplifications (in triplicate) were performed using a QuantStudio 3 Real-Time PCR System in MicroAmp optical 96-well reaction plates with MicroAmp 96-well optical adhesive film (Thermo Fisher Scientific). The threshold was manually set to 0.03. Quantification cycle (Cq) values were exported to Microsoft Excel for further analysis.
2.6.3. qPCR amplification
For amplification of adenovirus, HPyV and crAssphage genetic markers, qPCR reaction mixtures contained; 12.5 μL of TaqMan™ Environmental Master Mix 2.0 (Thermo Fisher Scientific), 2.5 μL BSA (0.2 mg/mL), 3 μL qPCR primer-probe mix (80 nM probe and 1 μM primer), 2 μL template, and 5 μL nuclease-free water, for a total reaction volume of 25 μL. Thermal cycling conditions were as follows: 50 °C for 2 min, followed by 40 cycles of 95 °C for 10 min, 95 °C for 15 s, and 60 °C for 1 min. qPCR amplifications were conducted with the same instrument and consumables used for RT-qPCR (see above).
2.6.4. Quality controls
A series of quality controls were included to ensure generation of high-quality PCR-based results. Amplification inhibition was assessed using Armored RNA Hepatitis G (aRNA, Asuragen, Austin, TX) as a non-competitive internal spike control as previously reported (Cashdollar et al., 2013; Gibson et al., 2012) with the following amendments. Briefly, each wastewater sample nucleic acid extract was tested undiluted and at a five-fold dilution with a known aRNA spike concentration (2 μL/reaction). An amplification inhibition threshold was determined for each instrument run [inhibition Cq threshold = (mean aRNA control Cq) + 1.5 Cq] based on the repeated measurement of six aRNA control reactions consisting of 2 μL of aRNA only (no wastewater extract). A wastewater extract was deemed inhibited when the mean Cq from triplicate measurements of spiked aRNA (undiluted or 1:5 dilution) exceeded the respective amplification threshold. In instances of amplification inhibition, wastewater extracts were further diluted and reanalyzed to alleviate inhibition. Of 96 wastewater extracts (48 primary influent +48 final effluent), 29% of the samples (2 primary influent and 26 final effluent) indicated amplification inhibition. In most instances, amplification inhibition was relieved using a 1:5 dilution as indicated by the mean HepG Cq values at or below the amplification threshold. To monitor for potential nucleic acid contamination during RT-qPCR and qPCR amplifications, six notemplate controls (NTC) with AE buffer substituted for template DNA were performed with each instrument run. EB and NTC extraneous DNA controls indicated the absence of contamination in 100% of control reactions (n = 240). Calibration linearity (R2) was greater than 0.985 and amplification efficiency (E = 10(−1/slope) − 1) ranged from 095.1 to 0.981 (Table 1). Lower Limit of Quantification (LLOQ) was defined as 95% upper bound of the 1 log10 of the gBLOCK standard dilution.
2.7. Data analyses
All data were log10 transformed prior to statistical analyses. In instances of analytes that were below limits of detection (LOD) for culture-based analyses or below LLOQ for both RT-qPCR and qPCR analyses, which primarily occurred with final effluent samples, we opted to treat these “left-censored values” as non-detects, rather than assigning them a constant value. Substitution of a constant can artificially deflate the log10 reduction values and introduce bias, especially when large portions of the dataset contain “left-censored” values (Canales et al., 2018). Additionally, statistical analysis was only completed for those analytes where at least 30% of the dataset contained quantifiable values for both primary and final wastewater effluents. As a result, the following combination of analytes were excluded from statistical analysis for WWTPs: WWTP#1 HPyV, norovirus GI and GII and WWTP#2 adenoviruses, HPyV, norovirus GI, GII, and infectious enteric virus. Differences in concentrations of various analytes in primary effluent of each WWTP, as well as differences in log10 reductions between primary and final effluents were assessed using one-way analysis of variance (ANOVA) with Tukey’s multiple comparisons tests. Furthermore, the coefficient of correlation between concentrations of different analytes in primary effluent of each WWTP was evaluated using a Pearson product-momentum correlation test. Finally, the efficacy of different wastewater disinfection strategies (i.e. UV compared to chlorination) was estimated by comparing log10 reduction values between the two WWTP using two-tailed unpaired t-test. All statistical analyses were conducted using GraphPad Prism Version 8.3.1 (GraphPad Software, La Jolla, CA, USA) at a significance level α = 0.05.
3. Results
3.1. Wastewater physical and chemical measurements
Physical and chemical measurements were taken at each WWTP facility for both primary influent and final wastewater effluent (Table 2). For primary influent samples, temperatures recorded for the year averaged just over 1 °C difference between the two plants sampled, (17.8 ± 4.12 °C WWTP #1 and 18.7 ± 3.38 °C WWTP #2). Larger fluctuations were observed in DO and conductivity primary influent measurements where both parameters were higher in WWTP #1 (41.00 ± 20.32% and 1342.17 ± 368.14 μs/cm) compared to WWTP #2 (20.93 ± 17.46% and 1147.48 ± 207.89 μs/cm). While the annual average pH was nearly identical between the two plants, (7.61 ± 0.21 for WWTP #1 and 7.62 ± 0.27 for WWTP #2), there were notable differences in turbidity with considerably higher levels at WWTP #2 (37.26 ± 10.31 FNU) compared to that of WWTP #1 (24.15 ± 7.13 FNU).
For final effluent, under a 1 °C difference in annual average temperature was also observed between the two plants (17.95 ± 3.92 °C for WWTP #1 and 18.43 ± 3.32 °C for WWTP #2). As with primary influent, both annual average readings for DO and conductivity in final effluent were observed at higher concentrations at WWTP #1 (97.46 ± 1.63% and 1194.48 ± 418.79 μs/cm, respectively) than those recorded at WWTP #2 (DO range: 78.10 ± 7.59 to 94.60 ± 5.80% and conductivity range: 824.08 ± 370.15 to 874.06 ± 237.29 μs/cm, respectively). The final effluent annual average pH was lower in WWTP #1 (7.78 ± 0.52) compared to that of WWTP #2 (8.08 ± 0.68), annual average turbidity of the effluent was much higher for WWTP #1 (11.29 ± 15.79 FNU) than for WWTP #2 (0.71 ± 1.55 FNU).
3.2. Microbial target general trends in primary influent
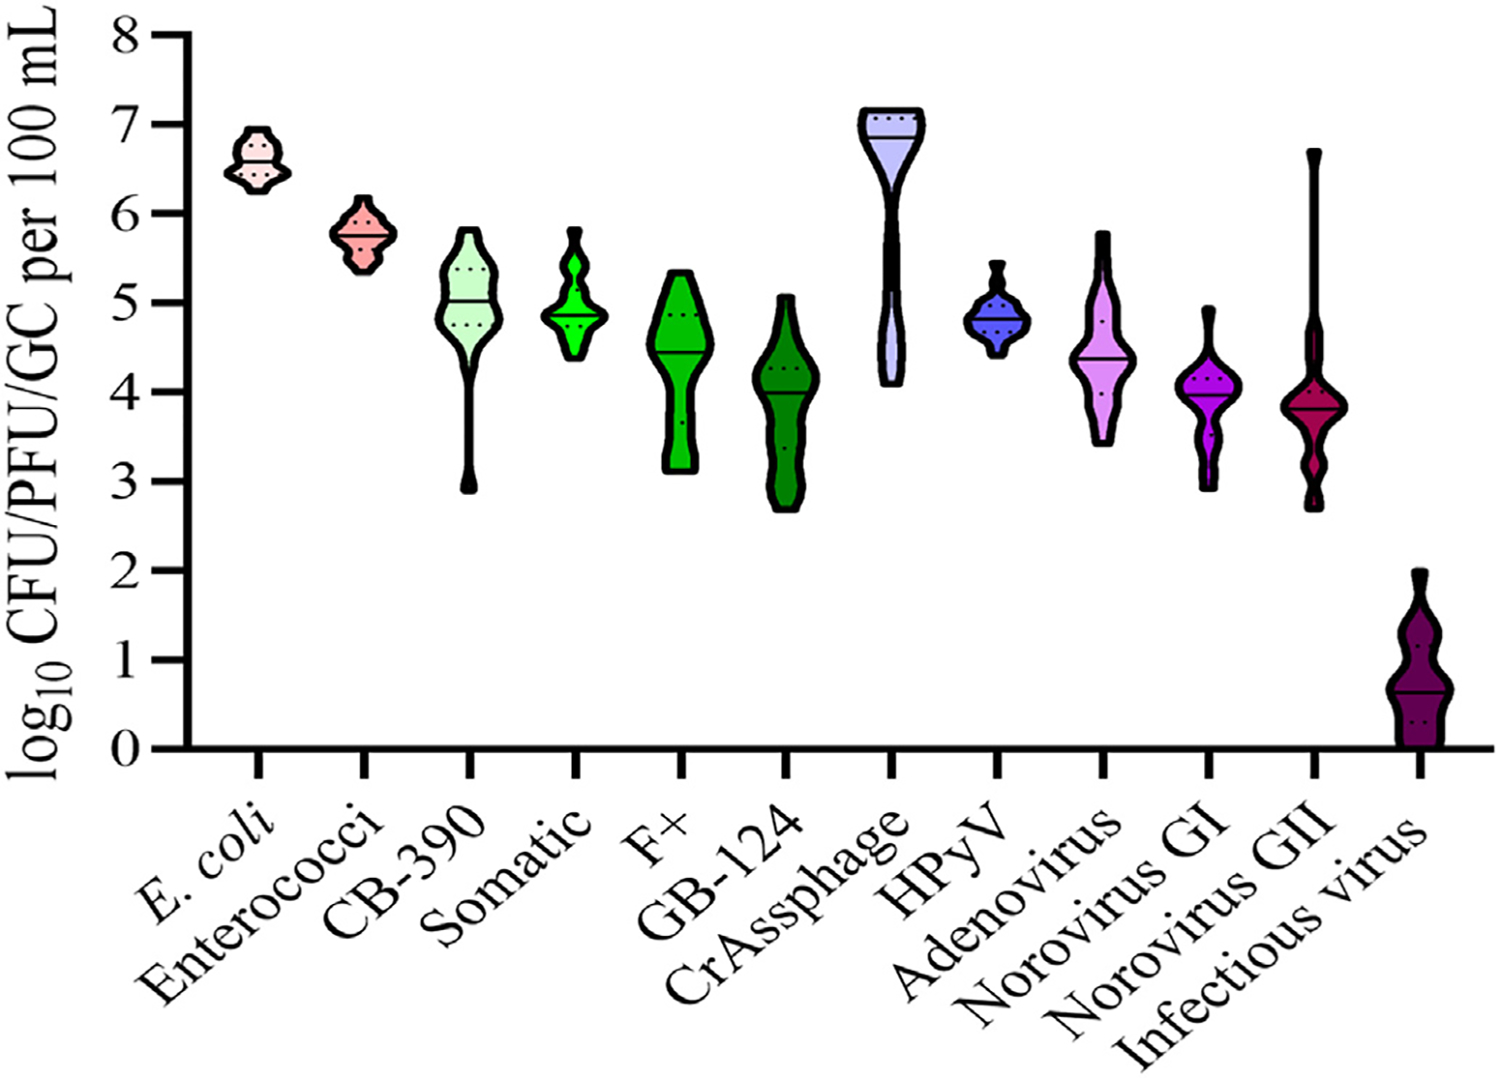
In WWTP primary influent samples, average E. coli levels (range: 5.48–6.95 log10 CFU/100 mL) (Figs. 1 and 2, Table 3) were found to be significantly higher (P ≤ 0.0001) to average levels of enterococci (range: 4.70 to 6.19 log10 CFU/100 mL). Apart from crAssphage and HPyV, FIB levels were found at significantly higher levels (P ≤ 0.0027) than all other analytes measured.
Fig. 1.

Concentrations of FIB, viral indicators, viral pathogens, and infectious virus measured in primary influent sampling at WWTP #1. Plots represent concentrations in primary influent, solid line within the plot represents median and dashed line represents quartiles.
Fig. 2.
Concentrations of FIB, viral indicators, viral pathogens and infectious virus measured in primary influent sampling at WWTP #2. Plots represent concentrations in primary influent, solid line within the plot represents median and dashed line represents quartiles.
Table 3.
Summary of concentration ranges for each analyte in primary influent and tertiary effluents.
| Target | Source1 | Concentration range2 WWTP #1 | Concentration range2 WWTP #2 |
|
|---|---|---|---|---|
| UV active | UV inactive | |||
|
| ||||
| Fecal indicator bacteria culture | ||||
| Influent | 5.48 to 6.53 | 6.40 to 6.95 | 6.26 to 6.65 | |
| E.coli | Effluent | 0.70 to 2.78 | 0.35 to 1.90 | 2.90 to 3.94 |
| Influent | 4.70 to 5.95 | 5.47 to 6.19 | 5.35 to 5.98 | |
| Enterococci | Effluent | 0.18 to 1.51 | 0.18 to 1.53 | 2.10 to 3.38 |
| Bacteriophage culture | ||||
| Influent | 3.61 to 5.13 | 4.38 to 5.53 | 4.46 to 5.83 | |
| Somatic | Effluent | 0.06 to 1.57 | 0.004 to 0.74 | 1.72 to 2.75 |
| Influent | 1.62 to 6.30 | 3.11 to 5.35 | 3.60 to 5.22 | |
| F + | Effluent | 0.002 to 1.35 | 0.002 to 1.16 | 0.47 to 1.99 |
| Influent | 3.84 to 5.59 | 2.90 to 5.68 | 4.34 to 5.83 | |
| CB-390 | Effluent | 0.21 to 1.39 | 0.05 to 0.96 | 2.02 to 2.90 |
| Influent | 2.30 to 4.66 | 3.03 to 5.08 | 2.69 to 4.39 | |
| Bacteroides GB-124 | Effluent | 0.25 to 0.79 | 0.021 to 0.50 | 0.70 to 1.83 |
| MST markers qPCR | ||||
| Influent | 4.30 to 4.90 | 4.65 to 5.22 | 4.42 to 5.45 | |
| HPyV | Effluent | 1.85 to 3.88* | 1.76 to 2.03* | 1.93 to 2.07* |
| Influent | 4.07 to 7.16 | 4.10 to 7.17 | 4.37 to 7.03 | |
| crAssphage | Effluent | 2.44 to 6.30 | 2.12 to 4.22 | 2.71 to 4.31 |
| Viral pathogens qPCR | ||||
| Influent | 3.30 to 5.12 | 3.43 to 5.79 | 3.79 to 5.42 | |
| Adenovirus | Effluent | 2.05 to 2.80 | 1.82 to 2.12* | 1.91 to 2.80* |
| Influent | 2.96 to 5.18 | 3.06 to 4.21 | 2.93 to 4.94 | |
| Norovirus GI | Effluent | 1.99 to 2.92* | N/A | 1.96 to 2.61* |
| Influent | 2.95 to 4.81 | 2.70 to 4.03 | 3.56 to 4.69 | |
| Norovirus GII | Effluent | 2.13 to 3.66* | N/A | 1.76 to 2.97 |
| Infectious enteric viruses | ||||
| Influent | 0.03 to 1.81 | 0.05 to 2.00 | 0.005 to 1.44 | |
| Total infectious enteric virus | Effluent | 0.0007 to 0.014 | 0.0003 to 0.006* | 0.0007 to 0.0083 |
N/A: insufficient data available to report concentration ranges.
Sample collection location within the WWTP treatment system; influent (Primary Influent) and effluent (Final effluent).
Concentrations reported as log10 CFU/PFU/genomic copies per 100 mL volumes of wastewater.
Represents data sets with n < 5 data points present.
Primary influent cultivated bacteriophage average concentrations ranged from 1.62–6.30 log10 PFU/100 mL (Figs. 1 and 2, Table 3). CB-390 coliphage were found at the highest levels followed by somatic coliphages and both were significantly higher (P ≤ 0.0019) compared to F+ coliphage and GB-124 bacteriophages at both plants.
For MST viral genetic markers, average crAssphage levels (range: 4.07 to 7.17 log10 copies/100 mL) were found at significantly higher levels than all other analytes measured (P < 0.0001) with the exception of E. coli (Figs. 1 and 2, Table 3). Average HPyV levels ranged from 4.30 to 5.45 log10 copies/100 mL were found at significantly lower levels (P < 0.0001) than those of crAssphage.
For viral pathogens, average levels for adenoviruses and norovirus GI and GII in primary influents ranged from 2.70 to 5.18 log10 copies/100 mL (Figs. 1 and 2, Table 3), while levels of infectious viruses ranged from 0.005 to 2.00 log10 infectious virus particles/100 mL. At WWTP #1 concentrations of adenoviruses were found to be significantly higher than both norovirus GI (P = 0.0004) and GII (P = 0.0005), while there was no difference observed between levels of norovirus GI and GII in comparison at WWTP#2. Additionally, concentrations of norovirus GI were found at lower concentrations compared to norovirus GII during the fall at both plants. Average levels of infectious viruses determined in primary influent between the plants was found to be significantly lower (P < 0.0001) than all other analytes. No seasonal trends were observed for the majority of microbial targets in either primary influent. The only exception were infectious enteric viruses whose concentrations were generally higher in fall and summer as compared to winter and spring (P range: 0.0003–0.0409).
3.3. Microbial measurements and general trends in effluents
Microbial measurements for final effluent samples are summarized in Table 3. In contrast to primary influent measurements, 42% yielded measurements below respective method LOD or LLOQ. Overall, trends in FIB concentrations of final effluents ranged from 0.18–3.96 log10 CFU/100 mL, while culturable bacteriophage concentrations ranged from 0.002–2.90 log10 PFU/100 mL (Table 3). MST genetic marker HPyV concentrations ranged from 1.76–3.88 log10 copies/100 mL, while crAssphage concentrations in final effluents were elevated in comparison, ranging from 2.12–6.30 log10 copies/100 mL. Limited quantitative measurements were available for viral pathogen molecular measurement (RT-qPCR and qPCR) in final effluents in comparison to culturable FIB and bacteriophage. Adenovirus concentrations ranged from 1.82–2.80 log10 copies/100 mL between the WWTPs, while norovirus GI and GI ranged from 1.76–3.66 log10 copies/100 mL. It is important to note that norovirus GI and GII levels at WWTP #2 final effluent (UV lamps active) could not be calculated due to insufficient data points available due to the majority of measurements below the respective LLOQ.
3.4. Correlations between microbial analytes in primary influent
At WWTP #1, significant correlations (P ≤ 0.047, R2 range: 0.47 to 0.84) were observed between FIB, cultivated bacteriophages (with the exception of F+ coliphage) and infectious virus in primary influent. At WWTP #2, fewer significant correlations were found between microbial analyte paired measurements compared to primary influent from WWTP #1. Specifically, levels of E. coli correlated with GB-124 phages (P = 0002, R2 = 0.61) and crAssphage (P = 0.045, R2 = 0.41), while enterococci levels were negatively correlated with adenoviruses (P = 0.026, R2 = −0.45). Somatic coliphages, correlated with both human-associated markers (HPyV and crAssphage) (P = 0.028, R2 = 0.45 and P = 0.005, R2 = 0.55, respectively), but there were no significant correlations with infectious enteric viruses. Correlation analyses were not conducted between target and sample type combinations for effluent sample paired measurements due to the large number of non-detects (samples yielding results below LOD or LLOQ).
3.5. FIB log10 reductions after chlorination disinfection
For WWTP #1, E. coli reductions were comparable to those of enterococci as well as all culturable bacteriophages. Average E. coli reductions (3.98 ± 0.47 log10 CFU/100 mL) from WWTP#1 was not significantly different from culturable bacteriophage, while loss of culturable enterococci (4.74 ± 0.39 log10 CFU/100 mL) were significantly higher (P ≤ 0.0007) than those of all culturable bacteriophage (Fig. 3). In comparison to human-associated MST markers and viral pathogens, both culturable E. coli and enterococci were reduced at significantly higher rates (P < 0.0001) than crAssphage and adenoviruses (P < 0.0001). Most FIB and cultivated bacteriophage removal rates displayed some degree of correlation (P ≤ 0.048, R2 range: 0.45 to 0.95) with one another, except for F+ coliphage where no correlations were observed.
Fig. 3.

Log10 reductions of eligible FIB and viral indicators observed at WWTP #1. Box is delimited by 25th and 75th percentiles, solid line within the box represents median and black dot within the box represents the average. Whiskers are 10th and 90th percentile values. An * indicates that a log10 reduction was not eligible for calculation due 30% or more non-detects (below LOD or LLOQ).
3.6. Bacteriophage and viral pathogen log10 reductions after chlorination disinfection
There were no statistical differences in the attenuation between bacteriophages during chlorination, however all bacteriophages were reduced at significantly higher levels than crAssphage (P < 0.0001) and adenoviruses (P < 0.0001) during this treatment. Levels of infectious enteric viruses were reduced at significantly lower amounts (P ≤ 0.0096) than all other analytes. Human-associated MST marker reduction did not correlate with those of culturable indicators (FIB and bacteriophages), while F+ coliphage removal correlated with adenovirus (P = 0.006, R2 = 0.93). No correlations were observed between infectious enteric viruses with any other analytes.
3.7. FIB log10 reductions after UV disinfection
For WWTP #2, UV lamps were in operation only portions of the year (April–October) and inactive for the remainder (November–March) (Fig. 4). During UV lamp operation, average reduction of E. coli (5.50 ± 0.35 log10 CFU/100 mL) were significantly higher (P value range: ≤0.0007) than corresponding bacteriophage and crAssphage levels. For enterococci, average levels of removal were significantly higher (P < 0.0001) than F+, GB-124 phages, and crAssphage. When UV lamps were in operation, removal rates of E. coli and enterococci correlated (P = 0.0047, R2 = 0.83). During periods when UV lamps were inactive (November–March), E. coli and enterococci average reductions were 2.95 ± 0.41 log10 CFU/100 mL and 2.97 ± 0.47 log10 CFU/100 mL, respectively. There were no significant differences between FIB, bacteriophage, or human-associated MST markers. Furthermore, E. coli and enterococci reduction levels correlated with one another (P = 0.003, R2 = 0.83), but did not correlate with other analytes, with exception of enterococci and F+ coliphage (P = 0.022, R2 = 0.71).
Fig. 4.

Log10 reductions of eligible FIB and viral indicator and sample type combinations at WWTP #2. Grey boxes represent fecal indicator log reductions under UV treatment and clear boxes represent log10 reductions under no UV treatment. Box is delimited by 25th and 75th percentiles, solid line within the box represents median and black dot within the box represents average. Whiskers are 10th and 90th percentile values. An * indicates that a log10 reduction was not eligible for calculation due 30% or more non-detects (below LOD or LLOQ).
3.8. Viral indicators and viral pathogens log10 reductions after UV disinfection
During UV disinfection, average reduction of cultivated bacteriophages ranged from 3.86 log10 PFU/100 mL to 4.74 log10 PFU/100 mL, while crAssphage reduction was slightly lower (3.25 ± 0.42 copies/100 mL). CB-390 and somatic coliphages were reduced at significantly higher levels than both F+ (P ≤ 0.001) and GB-124 phages (P < 0.0002) during UV lamp operation. All cultivated bacteriophages were reduced at significantly higher levels compared to crAssphage (P ≤ 0.0124) during UV treatment. In addition, CB-390 and somatic coliphage reductions were significantly correlated (P = 0.002, R2 = 0.83), while GB-124 correlated with crAssphage (P = 0.04, R2 = 0.66).
When UV lamps were inactive, reduction levels for all cultivated bacteriophage and human-associated MST markers were lower than with UV lamps active resulting in fewer instances of significant attenuation for most microbial target combinations. F+ coliphage exhibited the highest reduction level (3.32 ± 0.38 log10 PFU/100 mL) compared to any other cultivated bacteriophage or human-associated MST marker and were significantly higher than GB-124 phages (P = 0.0008) and CB-390 coliphage (P = 0.036). F+ coliphage were also reduced at significantly higher levels (P = 0.035) compared to norovirus GI. Infectious enteric viruses were reduced significantly less (P ≤ 0.0257) compared to all other microbial analytes. In addition, no significant correlations in reduction levels were observed between any cultivated bacteriophage and human-associated MST marker combination. The only remaining statistically significant correlation was observed between crAssphage and norovirus GII (P = 0.004, R2 = −0.98).
3.9. Percentage of sample detects during the sampling period per analyte measured
With the exception of infectious enteric viruses (96% sample positives), all analytes measured were detected (above LOD or LLOQ) in 100% of primary influent samples tested during the analysis period between the two plants (Fig. 5). Understandably, during periods lacking UV treatment (November–March) at WWTP#2, less instances of analyte non-detects were observed compared to periods when both UV and chlorination treatments were present. The lowest percentages of samples positive at WWTP#2 during UV inactivation were for adenoviruses and HPyV (30% sample positives), while norovirus G1 (80% sample positives) and infectious enteric viruses (60% sample positives) were also impacted. During UV inactivation at WWTP#2, both noroviruses GI and GII (36% and 29% sample positives, respectively) along with adenoviruses (36% sample positives) observed significant declines (<50% sample positives) in overall sample detection frequencies, but HPyV (0% sample positives) and infectious enteric viruses (14% sample positives) were the most impacted overall during this treatment. During chlorine treatment at WWTP#1 more analytes were impacted, but to a lesser degree than observed during UV treatment. Detection frequencies for both norovirus GI and GII (33% and 29% sample positives, respectively), adenovirus (42% sample positives) and HPyV (25% sample positives) were significantly affected (<50% sample positives) by this treatment. Impacts on frequencies of sample detection for infectious enteric viruses during chlorine treatment were a less apparent (50% sample positives) under this treatment than during UV (14% sample positives).
Fig. 5.

Percentage of sample detects (samples below assay LOD or LLOQ) during the sampling period per analyte measured in both primary influent and tertiary effluent at each WWTP #1 (chlorination) and WWTP #2 (UV disinfection). Final denotes tertiary effluent.
4. Discussion
4.1. Attenuation of fecal indicators and enteric pathogens with two disinfection approaches
Two wastewater treatment technologies (chlorination and UV) were assessed for efficacy in the reduction of FIB, coliphages, human-associated Bacteroides phages, human-associated MST markers, viral pathogens and infectious enteric viruses. As previously observed, E. coli and enterococci were generally found to be more sensitive to wastewater treatment compared to viral targets (culturable and qPCR) (Carducci et al., 2008; Havelaar et al., 1993; Mandilara et al., 2006). Under UV disinfection, F+ coliphage, GB-124 phage, and crAssphages displayed a higher level of resilience compared to other indicators measured. This observation supports conclusions of previous studies suggesting that F-RNA phages are less sensitive to UV compared to somatic phages (Havelaar et al., 1987; Sommer et al., 1998; Sommer et al., 2001), while others were unable to report these trends due to high instances of non-detects (Worley-Morse et al., 2019). Although hindered by lower initial concentrations in primary influent, GB-124 phages displayed a similar resilience to UV treatment to that of F+ phages, which has been reported elsewhere (Diston et al., 2012; Simonet and Gantzer, 2006; Thompson et al., 2003). Contrasting these findings, during chlorine disinfection all cultivated bacteriophages measured were equally susceptible to treatment, while the human-associated MST marker crAssphage was significantly less sensitive, responding in a similar manner to adenovirus as has been previously described (Wu et al., 2020). Although crAssphage are commonly measured in environmental matrices (Farkas et al., 2019; Garcia-Aljaro et al., 2017; Stachler et al., 2018), there is little data concerning attenuation through wastewater treatment (Tandukar et al., 2020), and no studies to date comparing crAssphage removal with that of other bacteriophages and viral pathogens. A recently published study concluded crAssphages were removed at higher rates than other viral molecular markers (indicators and pathogens) measured (Tandukar et al., 2020). This study, however, relied on smaller sample volumes (100 mL to 1 L) and vastly different concentration methodologies (electropositive filter and PEG) compared to this study (D-HFUF and celite), possibly impacting results. Taken together, these findings suggest that one indicator may be more suitable than another depending on disinfection practices and concentration methodology. It is also likely that protocols will need to be standardized to perform meaningful data comparisons.
To better elucidate the reduction of viral indicators exposed to different wastewater disinfection strategies two additional bacteriophage culture assays were included (CB-390 and GB-124), as well as qPCR assays targeting human associated viral MST markers (HPyV and crAssphage). CB-390 (transformed E. coli WG5 expressing Famp plasmid) was chosen based on its permissiveness to infection from both somatic and F+ coliphages, which is advantageous as somatic coliphages are in high concentrations in treated wastewater, while F-RNA phages display levels of UV resilience similar to pathogenic viruses (Guzman et al., 2008). An advantage of GB-124 Bacteroides phage over coliphages is its close association with human fecal pollution sources, giving it the benefit of being a culturable human-associated viral indicator (McMinn et al., 2014). Molecular viral indicators HPyV and crAssphage are also associated with human fecal pollution, with crAssphages having sufficient concentrations in wastewater allowing for determinations of concentrations regardless of wastewater treatment stage sampled (Crank et al., 2020; Wu et al., 2020).
Due to lack of quantifiable viral RT-qPCR and qPCR pathogen data during UV treatment, statistical analyses determination was not possible in some instances, preventing comparisons with FIB, culturable bacteriophages, and MST genetic markers. During chlorine treatment, adenoviruses, human-associated MST marker crAssphage, and infectious enteric viruses displayed a significant level of treatment resistance in comparison to all bacteriophages and more similar reductions to human viruses. Although both adenovirus and crAssphage resistance are reported elsewhere (Eischeid et al., 2009; Wu et al., 2020), how these chlorine resistant viruses were measured (qPCR) could have an impacted these findings. Comparing the removal of culturable indicator viruses to that of viruses measured by RT-qPCR or qPCR can be challenging, since during PCR-based testing, gene fragments of both infectious and non-infectious viruses are amplified, potentially inflating concentrations measured by these molecular approaches, and thus confounding comparisons between data sets (Hamza and Bibby, 2019; Lavender and Kinzelman, 2009; Noble et al., 2010). Additionally, the BGM cell line for infectious virus determination is susceptible to infection by only a small subset of enteric viruses, and of those, more resilient viral strains could preferentially culture over less resilient strains. Evidence for this hypothesis has been documented for echoviruses (Enterovirus genus of the family Picornaviridae). It was observed that during echovirus replication (using BGM culture), chlorine resistance traits were acquired through amino acid substitutions, and additionally, generating mutations allowing for alternative host cell receptors to mediate entry, improving viral replication fitness (Zhong et al., 2017). Additionally, there is evidence suggesting wastewater particulates physically shield infectious enteric viruses from exposure to disinfectants, while particulate matter can create an absorbent demand of reactive disinfectant residuals in wastewater (Cromeans et al., 2010; Gerba et al., 2018), although the effect of these mechanisms can vary between sites (Stoeckel and Harwood, 2007). Since identifying viral resistance pathways was outside the scope of our research, further examination is warranted to identify the mechanisms responsible for these observations.
4.2. Absence of seasonal variability in most microbial targets
To accurately assess phages as surrogates for enteric viruses, seasonal occurrence in primary treated wastewater must be considered, as severe fluctuations in concentrations could limit this application. During the year-long study, with the exception of infectious enteric viruses, no seasonal fluctuations were observed for concentrations of FIB, bacteriophages, human-associated MST markers, or viral pathogens (adenoviruses, norovirus GI and GII) measured at either plant in primary influent samples. This finding is unsurprising since these microorganisms and viruses are normal inhabitants of gastrointestinal tracts of humans and are consistently being shed in the fecal waste stream entering WWTPs, regardless of season (Aw and Gin, 2010; Mandilara et al., 2006; Muniesa et al., 2012; Nappier et al., 2019). Levels of both E. coli and enterococci measured in primary influent were at higher concentrations (1–2 log10) than culturable bacteriophages, human-associated viruses and viral pathogens, which has been reported elsewhere (Mandilara et al., 2006; McMinn et al., 2017a; Yahya et al., 2015). Concentrations of FIB and indicator viruses (both culture and qPCR) in primary influent displayed numerous instances of positive correlation throughout the 12-month study period, although patterns varied between plants. Variations observed between culturable indicators could be attributed to WWTP #1 waste source being mainly urban (mix of industrial and residential), while waste entering WWTP #2 originated from a small rural, mainly residential area. These differences could constitute significant changes in the waste stream entering a given plant (Dias et al., 2018; Hewitt et al., 2011). For infectious enteric viruses, concentrations were significantly lower than all other analytes in both plants though the entirety of the study. This is also in agreement with numerous studies characterizing levels of these targets in primary WWTP influents (Dias et al., 2018; McMinn et al., 2017a), where viral pathogens are sporadically detected since viral illnesses are infrequent within a contributing population at any given time. While it was outside of the scope of the current study to quantify protozoan pathogens (i.e., Cryptosporidium and Giardia app.), future research efforts should consider their inclusion as some evidence suggests that somatic coliphages may be adequate indicator for their presence and/or removal through WWTP processes (Schmitz et al., 2018).
4.3. The D-HFUF advantage
Many studies measuring culturable viral indicator species have been hindered by sample volume limitations associated with standard methods such as the double-ager layer method (typically 0.1–1 mL) (EPA, 2000, 2001; Lucena et al., 2004; Mandilara et al., 2006; Tanji et al., 2002; Worley-Morse et al., 2019). Methods relying on small volumes (≤1 L) increase the likelihood for false negative results or require researchers to assume conclusions based on bacteriophage and viral pathogen data that was at or nearing assay detection limits, making it difficult to accurately assess and contrast coliphage removal efficacy with that of viral pathogens (Hodon Ryu et al., 2021; Mandilara et al., 2006; Tanji et al., 2002; Worley-Morse et al., 2019). D-HFUF was used to process large volumes (10 to 100 L) of wastewater, increasing the likelihood of enumerating viral targets in wastewater, to assess more accurately removal through various wastewater disinfection strategies (UV and chlorination). Applying large volume concentration using D-HFUF in combination with a large volume SAL method enabled detection frequencies of 99% for bacteriophages in final wastewater effluent samples, a noticeable improvement (5% to 100% of sample non-detects) over those reported in similar studies (Hodon Ryu et al., 2021; Mandilara et al., 2006; Muniesa et al., 2012; Worley-Morse et al., 2019; Zhang and Farahbakhsh, 2007). Despite large volume (100L) final wastewater effluent concentration, a large percentage of these samples lacked quantifiable concentrations of viral pathogens adenovirus (67–86% sample non-detects), noroviruses GI and GII (50–100% sample non-detects), and infectious enteric viruses (60–86% sample non-detects) during experimentation, limiting the ability to compare removal to FIB and indicator viruses. The occurrence of non-detects for rare microbial targets was likely exacerbated by the occurrence of amplification inhibition. Even though sample purification and amplification reagents were used that minimize inhibition, bias was observed in 29% of samples suggesting that there is a trade-off between sample wastewater sample volume and molecular method performance. Additional research is warranted to optimize sampling and molecular methods for large volume WWTP final effluent testing.
4.4. Implications for wastewater and recreational water quality management
Study findings have multiple implications for wastewater and recreational water quality management. For example, accurate determination of potential health risks due to wastewater discharges into environmental receiving waters relies on methods capable of detecting rare microbial targets in large volumes of treated wastewater. Study findings suggest that for routine wastewater monitoring, large volume analyses are crucial for achieving the sensitivity needed to measure extremely low concentration microbial targets in treated wastewater. Large volume concentration methods such as D-HFUF not only allow for large volume sample testing, but also are based on particle size rather than surface charge, making them more applicable for the isolation of a more diverse range of microbial targets. In addition, study results suggest that some bacteriophages may be more suitable than others to evaluate wastewater treatment efficacy and that one bacteriophage may not be appropriate for all treatment scenarios. Conclusions also suggest that chlorine treatment is equally effective in removal of culturable bacteriophage investigated in this study, while under UV treatment, certain species of bacteriophage are more resilient and could potentially act as conservative indicators of pathogenic virus removal. Finally, findings may have important implications for future quantitative microbial risk assessment models for key fecal bacterial and viral indicators. Additional research is warranted to confirm trends observed here.
5. Conclusions
This study used D-HFUF to characterize bacterial and viral microbial targets using cultivation and molecular approaches in primary influent and final effluent samples from two WWTP facilities using different disinfection approaches over a 12-month period. Key findings include:
The D-HFUF concentration approach allowed for the simultaneously recovery of viral fecal indicators, MST genetic markers, and enteric viruses using both cultivation and molecular methodologies.
Reductions between FIB and human viruses varied by WWTP suggesting that a single microbial target may not be suitable for all wastewater treatment processes.
Cultivated F+ coliphage and GB-124 Bacteroides bacteriophage along with the human-associated crAssphage MST genetic marker were the most resistant to UV irradiation suggesting these may act as conservative indicators signaling pathogenic viruses.
D-HFUF concentration of final effluent samples almost eliminated cultivated bacteriophage sample non-detects improving the ability to compare enteric viral pathogen trends through wastewater treatment.
While this study illustrated multiple advantages for a D-HFUF sample concentration application for wastewater sample testing, there are some limitations to consider. First, large volume samples (≥100 L) combined with designer reagents does not eliminate amplification inhibition completely making it more challenging to detect rare genetic targets. Second, microbial target occurrence trends observed here focused on two WWTP facilities in the same geographic region. Additional research on the attenuation of microbial targets during wastewater treatment is needed in different geographical locations.
HIGHLIGHTS.
D-HFUF enabled more sensitive detection of all microbial targets.
FIB concentrations were generally 1–2 log10 higher than other analytes.
Infectious virus concentrations were highest in spring and fall (P ≤ 0.04).
crAssphage, adenoviruses, infectious viruses less sensitive (P ≤ 0.009) to chlorine.
F+, GB-124 bacteriophage and crAssphage the most resistant (P ≤ 0.0124) to UV.
Acknowledgements
Information has been subjected to U.S. EPA peer and administrative review and has been approved for external publication. Any opinions expressed in this paper are those of the authors and do not necessarily reflect the official positions and policies of the U.S. EPA. Any mention of trade names or commercial products does not constitute endorsement or recommendation for use.
Footnotes
Declaration of competing interest
The authors declare that they have no known competing financial interests or personal relationships that could have appeared to influence the work reported in this paper.
References
- Agency, EPA, US, 2020. Most Probable Number (MPN) Calculator. https://mostprobablenumbercalculator.epa.gov/. USEPA, Durham, NC. [Google Scholar]
- Aghalari Z, Dahms HU, Sillanpaa M, Sosa-Hernandez JE, Parra-Saldivar R, 2020. Effectiveness of wastewater treatment systems in removing microbial agents: a systematic review. Global Health 16 (1), 13. [DOI] [PMC free article] [PubMed] [Google Scholar]
- Agullo-Barcelo M, Galofre B, Sala L, Garcia-Aljaro C, Lucena F, Jofre J, 2016. Simultaneous detection of somatic and F-specific coliphages in different settings by Escherichia coli strain CB390. FEMS Microbiol. Lett. 363 (17). [DOI] [PubMed] [Google Scholar]
- Atmar RL, Opekun AR, Gilger MA, Estes MK, Crawford SE, Neill FH, Graham DY, 2008. Norwalk virus shedding after experimental human infection. Emerg. Infect. Dis. 14 (10), 1553–1557. [DOI] [PMC free article] [PubMed] [Google Scholar]
- Aw TG, Gin KY, 2010. Environmental surveillance and molecular characterization of human enteric viruses in tropical urban wastewaters. J. Appl. Microbiol. 109 (2), 716–730. [DOI] [PubMed] [Google Scholar]
- Canales RA, Wilson AM, Pearce-Walker JI, Verhougstraete MP, Reynolds KA, 2018. Methods for handling left-censored data in quantitative microbial risk assessment. Appl. Environ. Microbiol. 84 (20). [DOI] [PMC free article] [PubMed] [Google Scholar]
- Carducci A, Morici P, Pizzi F, Battistini R, Rovini E, Verani M, 2008. Study of the viral removal efficiency in a urban wastewater treatment plant. Water Sci. Technol. 58 (4), 893–897. [DOI] [PubMed] [Google Scholar]
- Cashdollar JL, Brinkman NE, Griffin SM, McMinn BR, Rhodes ER, Varughese EA, Grimm AC, Parshionikar SU, Wymer L, Fout GS, 2013. Development and evaluation of EPA method 1615 for detection of enterovirus and norovirus in water. Appl. Environ. Microbiol. 79 (1), 215–223. [DOI] [PMC free article] [PubMed] [Google Scholar]
- Chern EC, Brenner K, Wymer L, Haugland RA, 2014. Influence of wastewater disinfection on densities of culturable fecal indicator bacteria and genetic markers. J. Water Health 12 (3), 410–417. [DOI] [PubMed] [Google Scholar]
- Crank K, Li X, North D, Ferraro GB, Iaconelli M, Mancini P, La Rosa G, Bibby K, 2020. CrAssphage abundance and correlation with molecular viral markers in italian wastewater. Water Res. 184, 116161. [DOI] [PubMed] [Google Scholar]
- Cromeans TL, Kahler AM, Hill VR, 2010. Inactivation of adenoviruses, enteroviruses, and murine norovirus in water by free chlorine and monochloramine. Appl. Environ. Microbiol. 76 (4), 1028–1033. [DOI] [PMC free article] [PubMed] [Google Scholar]
- da Silva AK, Le Saux JC, Parnaudeau S, Pommepuy M, Elimelech M, Le Guyader FS, 2007. Evaluation of removal of noroviruses during wastewater treatment, using real-time reverse transcription-PCR: different behaviors of genogroups I and II. Appl. Environ. Microbiol. 73 (24), 7891–7897. [DOI] [PMC free article] [PubMed] [Google Scholar]
- Dias E, Ebdon J, Taylor H, 2018. The application of bacteriophages as novel indicators of viral pathogens in wastewater treatment systems. Water Res. 129, 172–179. [DOI] [PubMed] [Google Scholar]
- Diston D, Ebdon JE, Taylor HD, 2012. The effect of UV-C radiation (254 nm) on candidate microbial source tracking phages infecting a human-specific strain of Bacteroides fragilis (GB-124). J. Water Health 10 (2), 262–270. [DOI] [PubMed] [Google Scholar]
- Ebdon J, Muniesa M, Taylor H, 2007. The application of a recently isolated strain of bacteroides (GB-124) to identify human sources of faecal pollution in a temperate river catchment. Water Res. 41 (16), 3683–3690. [DOI] [PubMed] [Google Scholar]
- Eischeid AC, Meyer JN, Linden KG, 2009. UV disinfection of adenoviruses: molecular indications of DNA damage efficiency. Appl. Environ. Microbiol. 75 (1), 23–28. [DOI] [PMC free article] [PubMed] [Google Scholar]
- EPA, U.S., 2000. Method 1602: Male-specific (F+) and Somatic Coliphage in Water by Single Agar Layer (SAL) Procedure. Water, O.o, Washington D.C. [Google Scholar]
- EPA, U.S., 2001. Method 1601: Detection of Male-specific (F+) and Somatic Coliphage in Water by Two-645 Step Enrichment Procedure. Water, O.o, Washington, D.C. [Google Scholar]
- EPA, U.S., 2006. Method 1600: Enterococci in Water by Membrane Filtration Using Membrane-Enterococcus Indoxyl-B-D-Glucoside Agar (mEI). Water, O.o., Washington D.C. [Google Scholar]
- EPA, U.S., 2014. Method 1603: Escherichia coli (E. coli) in Water by Membrane Filtration Using Modified Membrane-Thermotolerant Escherichia coli Agar (Modified mTEC). Water, O.o, Washington D.C. [Google Scholar]
- Farkas K, Adriaenssens EM, Walker DI, McDonald JE, Malham SK, Jones DL, 2019. Critical evaluation of CrAssphage as a molecular marker for human-derived wastewater contamination in the aquatic environment. Food Environ. Virol. 11 (2), 113–119. [DOI] [PMC free article] [PubMed] [Google Scholar]
- Fewtrell LABJ, 2001. Indicators of microbial water quality. Water Quality: Guidelines, Standards and Health. Risk Assessment and Risk Management for Water-related Infectious Disease, pp. 289–315. [Google Scholar]
- Garcia-Aljaro C, Balleste E, Muniesa M, Jofre J, 2017. Determination of crAssphage in water samples and applicability for tracking human faecal pollution. Microb. Biotechnol. 10 (6), 1775–1780. [DOI] [PMC free article] [PubMed] [Google Scholar]
- Gerba CP, Betancourt WQ, Kitajima M, Rock CM, 2018. Reducing uncertainty in estimating virus reduction by advanced water treatment processes. Water Res. 133, 282–288. [DOI] [PubMed] [Google Scholar]
- Gibson KE, Schwab KJ, Spencer SK, Borchardt MA, 2012. Measuring and mitigating inhibition during quantitative real time PCR analysis of viral nucleic acid extracts from large-volume environmental water samples. Water Res. 46 (13), 4281–4291. [DOI] [PubMed] [Google Scholar]
- Guzman C, Moce-Llivina L, Lucena F, Jofre J, 2008. Evaluation of Escherichia coli host strain CB390 for simultaneous detection of somatic and F-specific coliphages. Appl. Environ. Microbiol. 74 (2), 531–534. [DOI] [PMC free article] [PubMed] [Google Scholar]
- Hamza IA, Bibby K, 2019. Critical issues in application of molecular methods to environmental virology. J. Virol. Methods 266, 11–24. [DOI] [PubMed] [Google Scholar]
- Harwood VJ, Levine AD, Scott TM, Chivukula V, Lukasik J, Farrah SR, Rose JB, 2005. Validity of the indicator organism paradigm for pathogen reduction in reclaimed water and public health protection. Appl. Environ. Microbiol. 71 (6), 3163–3170. [DOI] [PMC free article] [PubMed] [Google Scholar]
- Havelaar AH, Pothogeboom WM, Koot W, Pot R, 1987. F-specific bacteriophages as indicators of the disinfection efficiency of secondary effluent with ultraviolet-radiation. Ozone Sci. Eng. 9 (4), 353–367. [Google Scholar]
- Havelaar AH, van Olphen M, Drost YC, 1993. F-specific RNA bacteriophages are adequate model organisms for enteric viruses in fresh water. Appl. Environ. Microbiol. 59 (9), 2956–2962. [DOI] [PMC free article] [PubMed] [Google Scholar]
- Hewitt J, Leonard M, Greening GE, Lewis GD, 2011. Influence of wastewater treatment process and the population size on human virus profiles in wastewater. Water Res. 45 (18), 6267–6276. [DOI] [PubMed] [Google Scholar]
- Hill VR, Polaczyk AL, Kahler AM, Cromeans TL, Hahn D, Amburgey JE, 2009. Comparison of hollow-fiber ultrafiltration to the USEPA VIRADEL technique and USEPA method 1623. J. Environ. Qual. 38 (2), 822–825. [DOI] [PubMed] [Google Scholar]
- Hlavsa MC, Roberts VA, Kahler AM, Hilborn ED, Mecher TR, Beach MJ, Wade TJ, Yoder JS, Centers for Disease Cand Prevention, 2015. Outbreaks of illness associated with recreational water–United States, 2011–2012. MMWR Morb. Mortal. Wkly Rep. 64 (24), 668–672. [PMC free article] [PubMed] [Google Scholar]
- Hodon Ryu YA, Brinkman Nichole E., Ware Michael W., Boczek Laura, Hoelle, Jill Mistry, Jatin H, Keely Scott P., Villegas Eric N., 2021. Understanding microbial loads in wastewater treatment works as source water for water reuse. Water 13 (11), 1452. [DOI] [PMC free article] [PubMed] [Google Scholar]
- ISO 10705–4:2001, 2001. Enumeration of Bacteriophages Infecting Bacteriodes fragilis. Water Quality-Detection and Enumeration of Bacteriophages-Part 4. 1st ed. University of Brighton. [Google Scholar]
- Jiang SC, Chu W, He JW, 2007. Seasonal detection of human viruses and coliphage in Newport Bay, California. Appl. Environ. Microbiol. 73 (20), 6468–6474. [DOI] [PMC free article] [PubMed] [Google Scholar]
- Jothikumar N, Cromeans TL, Hill VR, Lu X, Sobsey MD, 2005a. Quantitative real-time PCR assays for detection of human adenoviruses and identification of serotypes 40 and 41. Appl. Environ. Microbiol. 71 (6), 3131–3136. [DOI] [PMC free article] [PubMed] [Google Scholar]
- Jothikumar N, Lowther JA, Henshilwood K, Lees DN, Hill VR, Vinje J, 2005b. Rapid and sensitive detection of noroviruses by using TaqMan-based one-step reverse transcription-PCR assays and application to naturally contaminated shellfish samples. Appl. Environ. Microbiol. 71 (4), 1870–1875. [DOI] [PMC free article] [PubMed] [Google Scholar]
- Knappett PS, Layton A, McKay LD, Williams D, Mailloux BJ, Huq MR, Alam MJ, Ahmed KM, Akita Y, Serre ML, Sayler GS, van Geen A, 2011. Efficacy of hollow-fiber ultrafiltration for microbial sampling in groundwater. Ground Water 49 (1), 53–65. [DOI] [PubMed] [Google Scholar]
- Korajkic A, McMinn BR, Harwood VJ, 2018. Relationships between microbial indicators and pathogens in recreational water settings. Int. J. Environ. Res. Public Health 15 (12). [DOI] [PMC free article] [PubMed] [Google Scholar]
- Korajkic A, McMinn B, Herrmann MP, Sivaganesan M, Kelty CA, Clinton P, Nash MS, Shanks OC, 2020. Viral and bacterial fecal indicators in untreated wastewater across the contiguous United States exhibit geospatial trends. Appl. Environ. Microbiol. 86 (8). [DOI] [PMC free article] [PubMed] [Google Scholar]
- Lavender JS, Kinzelman JL, 2009. A cross comparison of QPCR to agar-based or defined substrate test methods for the determination of Escherichia coli and enterococci in municipal water quality monitoring programs. Water Res. 43 (19), 4967–4979. [DOI] [PubMed] [Google Scholar]
- Leskinen SD, Lim DV, 2008. Rapid ultrafiltration concentration and biosensor detection of enterococci from large volumes of Florida recreational water. Appl. Environ. Microbiol. 74 (15), 4792–4798. [DOI] [PMC free article] [PubMed] [Google Scholar]
- Leskinen SD, Brownell M, Lim DV, Harwood VJ, 2010. Hollow-fiber ultrafiltration and PCR detection of human-associated genetic markers from various types of surface water in Florida. Appl. Environ. Microbiol. 76 (12), 4116–4117. [DOI] [PMC free article] [PubMed] [Google Scholar]
- Lindesmith L, Moe C, Marionneau S, Ruvoen N, Jiang X, Lindblad L, Stewart P, LePendu J, Baric R, 2003. Human susceptibility and resistance to Norwalk virus infection. Nat. Med. 9 (5), 548–553. [DOI] [PubMed] [Google Scholar]
- Liu P, Hill VR, Hahn D, Johnson TB, Pan Y, Jothikumar N, Moe CL, 2012. Hollow-fiber ultrafiltration for simultaneous recovery of viruses, bacteria and parasites from reclaimed water. J. Microbiol. Methods 88 (1), 155–161. [DOI] [PubMed] [Google Scholar]
- Loisy F, Atmar RL, Guillon P, Le Cann P, Pommepuy M, Le Guyader FS, 2005. Real-time RT-PCR for norovirus screening in shellfish. J. Virol. Methods 123 (1), 1–7. [DOI] [PubMed] [Google Scholar]
- Lucena F, Duran AE, Moron A, Calderon E, Campos C, Gantzer C, Skraber S, Jofre J, 2004. Reduction of bacterial indicators and bacteriophages infecting faecal bacteria in primary and secondary wastewater treatments. J. Appl. Microbiol. 97 (5), 1069–1076. [DOI] [PubMed] [Google Scholar]
- Mandilara GD, Smeti EM, Mavridou AT, Lambiri MP, Vatopoulos AC, Rigas FP, 2006. Correlation between bacterial indicators and bacteriophages in sewage and sludge. FEMS Microbiol. Lett. 263 (1), 119–126. [DOI] [PubMed] [Google Scholar]
- McMinn BR, 2013. Optimization of adenovirus 40 and 41 recovery from tap water using small disk filters. J. Virol. Methods 193 (2), 284–290. [DOI] [PubMed] [Google Scholar]
- McMinn BR, Cashdollar JL, Grimm AC, Fout GS, 2012. Evaluation of the celite secondary concentration procedure and an alternate elution buffer for the recovery of enteric adenoviruses 40 and 41. J. Virol. Methods 179 (2), 423–428. [DOI] [PubMed] [Google Scholar]
- McMinn BR, Korajkic A, Ashbolt NJ, 2014. Evaluation of Bacteroides fragilis GB-124 bacteriophages as novel human-associated faecal indicators in the United States. Lett. Appl. Microbiol. 59 (1), 115–121. [DOI] [PubMed] [Google Scholar]
- McMinn BR, Ashbolt NJ, Korajkic A, 2017a. Bacteriophages as indicators of faecal pollution and enteric virus removal. Lett. Appl. Microbiol. 65 (1), 11–26. [DOI] [PMC free article] [PubMed] [Google Scholar]
- McMinn BR, Huff EM, Rhodes ER, Korajkic A, 2017b. Concentration and quantification of somatic and F+ coliphages from recreational waters. J. Virol. Methods 249, 58–65. [DOI] [PMC free article] [PubMed] [Google Scholar]
- McQuaig SM, Scott TM, Harwood VJ, Farrah SR, Lukasik JO, 2006. Detection of human-derived fecal pollution in environmental waters by use of a PCR-based human polyomavirus assay. Appl. Environ. Microbiol. 72 (12), 7567–7574. [DOI] [PMC free article] [PubMed] [Google Scholar]
- Morales-Morales HA, Vidal G, Olszewski J, Rock CM, Dasgupta D, Oshima KH, Smith GB, 2003. Optimization of a reusable hollow-fiber ultrafilter for simultaneous concentration of enteric bacteria, protozoa, and viruses from water. Appl. Environ. Microbiol. 69 (7), 4098–4102. [DOI] [PMC free article] [PubMed] [Google Scholar]
- Muniesa M, Lucena F, Blanch AR, Payan A, Jofre J, 2012. Use of abundance ratios of somatic coliphages and bacteriophages of bacteroides thetaiotaomicron GA17 for microbial source identification. Water Res. 46 (19), 6410–6418. [DOI] [PubMed] [Google Scholar]
- Nappier SP, Hong T, Ichida A, Goldstone A, Eftim SE, 2019. Occurrence of coliphage in raw wastewater and in ambient water: a meta-analysis. Water Res. 153, 263–273. [DOI] [PMC free article] [PubMed] [Google Scholar]
- Noble RT, Blackwood AD, Griffith JF, McGee CD, Weisberg SB, 2010. Comparison of rapid quantitative PCR-based and conventional culture-based methods for enumeration of enterococcus spp. And Escherichia coli in recreational waters. Appl. Environ. Microbiol. 76 (22), 7437–7443. [DOI] [PMC free article] [PubMed] [Google Scholar]
- Prado T, Silva DM, Guilayn WC, Rose TL, Gaspar AM, Miagostovich MP, 2011. Quantification and molecular characterization of enteric viruses detected in effluents from two hospital wastewater treatment plants. Water Res. 45 (3), 1287–1297. [DOI] [PubMed] [Google Scholar]
- Qiu Y, Lee BE, Neumann N, Ashbolt N, Craik S, Maal-Bared R, Pang XL, 2015. Assessment of human virus removal during municipal wastewater treatment in Edmonton, Canada. J. Appl. Microbiol. 119 (6), 1729–1739. [DOI] [PubMed] [Google Scholar]
- Rhodes ER, Hamilton DW, See MJ, Wymer L, 2011. Evaluation of hollow-fiber ultrafiltration primary concentration of pathogens and secondary concentration of viruses from water. J. Virol. Methods 176 (1–2), 38–45. [DOI] [PubMed] [Google Scholar]
- Rhodes ER, Huff EM, Hamilton DW, Jones JL, 2016. The evaluation of hollow-fiber ultrafiltration and celite concentration of enteroviruses, adenoviruses and bacteriophage from different water matrices. J. Virol. Methods 228, 31–38. [DOI] [PubMed] [Google Scholar]
- Schlindwein AD, Rigotto C, Simoes CM, Barardi CR, 2010. Detection of enteric viruses in sewage sludge and treated wastewater effluent. Water Sci. Technol. 61 (2), 537–544. [DOI] [PubMed] [Google Scholar]
- Schmitz BW, Moriyama H, Haramoto E, Kitajima M, Sherchan S, Gerba CP, Pepper IL, 2018. Reduction of cryptosporidium, giardia, and fecal indicators by bardenpho wastewater treatment. Environ. Sci. Technol. 52 (12), 7015–7023. [DOI] [PubMed] [Google Scholar]
- Sedmak G, Bina D, Macdonald J, Couillard L, 2005. Nine-year study of the occurrence of culturable viruses in source water for two drinking water treatment plants and the influent and effluent of a wastewater treatment Plant in Milwaukee, Wisconsin (August 1994 through july 2003). Appl. Environ. Microbiol. 71 (2), 1042–1050. [DOI] [PMC free article] [PubMed] [Google Scholar]
- Sidhu JPS, Sena K, Hodgers L, Palmer A, Toze S, 2018. Comparative enteric viruses and coliphage removal during wastewater treatment processes in a sub-tropical environment. Sci. Total Environ. 616–617, 669–677. [DOI] [PubMed] [Google Scholar]
- Simmons FJ, Xagoraraki I, 2011. Release of infectious human enteric viruses by full-scale wastewater utilities. Water Res. 45 (12), 3590–3598. [DOI] [PubMed] [Google Scholar]
- Simonet J, Gantzer C, 2006. Inactivation of poliovirus 1 and F-specific RNA phages and degradation of their genomes by UV irradiation at 254 nanometers. Appl. Environ. Microbiol. 72 (12), 7671–7677. [DOI] [PMC free article] [PubMed] [Google Scholar]
- Sommer R, Haider T, Cabaj A, Pribil W, Lhotsky M, 1998. Time dose reciprocity in UV disinfection of water. Water Sci. Technol. 38 (12), 145–150. [Google Scholar]
- Sommer R, Pribil W, Appelt S, Gehringer P, Eschweiler H, Leth H, Cabaj A, Haider T, 2001. Inactivation of bacteriophages in water by means of non-ionizing (UV-253.7 nm) and ionizing (gamma) radiation: a comparative approach. Water Res. 35 (13), 3109–3116. [DOI] [PubMed] [Google Scholar]
- Stachler E, Akyon B, de Carvalho NA, Ference C, Bibby K, 2018. Correlation of crAssphage qPCR markers with culturable and molecular indicators of human fecal pollution in an impacted urban watershed. Environ. Sci. Technol. 52 (13), 7505–7512. [DOI] [PubMed] [Google Scholar]
- Stoeckel DM, Harwood VJ, 2007. Performance, design, and analysis in microbial source tracking studies. Appl. Environ. Microbiol. 73 (8), 2405–2415. [DOI] [PMC free article] [PubMed] [Google Scholar]
- Svraka S, Duizer E, Vennema H, de Bruin E, van der Veer B, Dorresteijn B, Koopmans M, 2007. Etiological role of viruses in outbreaks of acute gastroenteritis in The Netherlands from 1994 through 2005. J. Clin. Microbiol. 45 (5), 1389–1394. [DOI] [PMC free article] [PubMed] [Google Scholar]
- Tandukar S, Sherchan SP, Haramoto E, 2020. Applicability of crAssphage, pepper mild mottle virus, and tobacco mosaic virus as indicators of reduction of enteric viruses during wastewater treatment. Sci. Rep. 10 (1), 3616. [DOI] [PMC free article] [PubMed] [Google Scholar]
- Tanji Y, Mizoguchi K, Yoichi M, Morita M, Hori K, Unno H, 2002. Fate of coliphage in a wastewater treatment process. J. Biosci. Bioeng. 94 (2), 172–174. [DOI] [PubMed] [Google Scholar]
- Teunis PF, Moe CL, Liu P, Miller SE, Lindesmith L, Baric RS, Le Pendu J, Calderon RL, 2008. Norwalk virus: how infectious is it? J. Med. Virol. 80 (8), 1468–1476. [DOI] [PubMed] [Google Scholar]
- Thompson SS, Jackson JL, Suva-Castillo M, Yanko WA, El Jack Z, Kuo J, Chen CL, Williams FP, Schnurr DP, 2003. Detection of infectious human adenoviruses in tertiary-treated and ultraviolet-disinfected wastewater. Water Environ. Res. 75 (2), 163–170. [DOI] [PubMed] [Google Scholar]
- Tree JA, Adams MR, Lees DN, 1997. Virus inactivation during disinfection of wastewater by chlorination and UV irradiation and the efficacy of F+ bacteriophage as a viral indicator. Water Sci. Technol. 35 (11–12), 227–232. [Google Scholar]
- United States Environmental Protection Agency, 2018a. Method 1642: Male-specific (F+) and Somatic Coliphage in Recreational Waters and Wastewater by Ultrafiltration (UF) and Single Agar Layer (SAL) Procedure. Water, O.o., Washington, D.C. [Google Scholar]
- United States Environmental Protection Agency, 2018b. Method 1643: Male-specific (F+) and Somatic Coliphage in Secondary (No Disinfection) Wastewater by the Single Agar Layer (SAL) Procedure. Water, O.o, Washington, D.C. [Google Scholar]
- USEPA, 2015. Review of Coliphages as Possible Indicators of Fecal Contamination for Ambient Water Quality. Water, O.o., Washington D.C. [Google Scholar]
- Victoria M, Guimaraes F, Fumian T, Ferreira F, Vieira C, Leite JP, Miagostovich M, 2009. Evaluation of an adsorption-elution method for detection of astrovirus and norovirus in environmental waters. J. Virol. Methods 156 (1–2), 73–76. [DOI] [PubMed] [Google Scholar]
- Wanjugi P, Sivaganesan M, Korajkic A, Kelty CA, McMinn B, Ulrich R, Harwood VJ, Shanks OC, 2016. Differential decomposition of bacterial and viral fecal indicators in common human pollution types. Water Res. 105, 591–601. [DOI] [PMC free article] [PubMed] [Google Scholar]
- Weng S, Dunkin N, Schwab KJ, McQuarrie J, Bell K, Jacangelo JG, 2018. Infectivity reduction efficacy of UV irradiation and peracetic acid-UV combined treatment on MS2 bacteriophage and murine norovirus in secondary wastewater effluent. J. Environ. Manag. 221, 1–9. [DOI] [PubMed] [Google Scholar]
- Woolhouse M, Scott F, Hudson Z, Howey R, Chase-Topping M, 2012. Human viruses: discovery and emergence. Philos. Trans. R. Soc. Lond. Ser. B Biol. Sci. 367 (1604), 2864–2871. [DOI] [PMC free article] [PubMed] [Google Scholar]
- Worley-Morse T, Mann M, Khunjar W, Olabode L, Gonzalez R, 2019. Evaluating the fate of bacterial indicators, viral indicators, and viruses in water resource recovery facilities. Water Environ. Res. 91 (9), 830–842. [DOI] [PMC free article] [PubMed] [Google Scholar]
- Wu Z, Greaves J, Arp L, Stone D, Bibby K, 2020. Comparative fate of CrAssphage with culturable and molecular fecal pollution indicators during activated sludge wastewater treatment. Environ. Int. 136, 105452. [DOI] [PubMed] [Google Scholar]
- Yahya M, Hmaied F, Jebri S, Jofre J, Hamdi M, 2015. Bacteriophages as indicators of human and animal faecal contamination in raw and treated wastewaters from Tunisia. J. Appl. Microbiol. 118 (5), 1217–1225. [DOI] [PubMed] [Google Scholar]
- Zhang K, Farahbakhsh K, 2007. Removal of native coliphages and coliform bacteria from municipal wastewater by various wastewater treatment processes: implications to water reuse. Water Res. 41 (12), 2816–2824. [DOI] [PubMed] [Google Scholar]
- Zhong Q, Carratala A, Shim H, Bachmann V, Jensen JD, Kohn T, 2017. Resistance of echovirus 11 to ClO2 is associated with enhanced host receptor use, altered entry routes, and high fitness. Environ. Sci. Technol. 51 (18), 10746–10755. [DOI] [PMC free article] [PubMed] [Google Scholar]