

Abstract
Long noncoding RNAs (lncRNAs) have been demonstrated to play critical regulatory roles in posttranscriptional and transcriptional regulation in eukaryotic cells. However, the characteristics of many lncRNAs, particularly their expression patterns in the lesion epicenter of spinal tissues following subacute spinal cord injury (SCI), remain unclear. In this study, we determined the expression profiles of lncRNAs in the lesion epicenter of spinal tissues after traumatic SCI and predicted latent regulatory networks. Standard Allen's drop surgery was conducted on mice, and hematoxylin and eosin staining was used to observe the damaged area. High‐throughput sequencing was performed to identify the differential expression profiles of lncRNAs. Quantitative real‐time polymerase chain reaction was conducted to evaluate the quality of the sequencing results. Bioinformatics analyses, including Gene Ontology and Kyoto Encyclopedia of Genes and Genomes pathway analysis, coexpression analysis, and protein–protein interaction analysis, were performed. Targeted binding of lncRNA–miRNA–mRNA was predicted by TargetScan and miRanda. A total of 230 differentially expressed lncRNAs were identified and preliminarily verified, and some potential regulatory networks were constructed. These findings improve our understanding of the mechanisms underlying subacute SCI; differentially expressed lncRNAs are closely involved in pathophysiological processes by regulating multiple pathways. Further studies are essential for revealing the exact mechanism underlying competing endogenous RNA pathways in vivo and in vitro.
Keywords: bioinformatics, long noncoding RNA, regulatory network, subacute spinal cord injury
1. INTRODUCTION
Spinal cord injury (SCI) is one of the most debilitating neurological diseases, and therapy for SCI is generally costly but ineffective. The incidence of SCI has increased among elderly people over the previous three decades. 1 , 2 , 3 , 4 In the past century, scientists in the field of neural regeneration have focused on dissecting the cellular and molecular mechanisms of SCI. 5 The pathophysiology of SCI is considered biphasic, consisting of a primary and secondary phase of injury, with the most important and complex pathophysiological processes occurring in the secondary phase. 6 The subacute phase, which lasts from 7–14 days post‐SCI, is considered the critical period for biological therapy. 6 , 7 , 8 Understanding the fundamental cellular and molecular mechanisms and exploring the regulation networks of pathophysiological events in SCI in a systemic manner is critical for developing promising treatment strategies.
Transcriptome sequencing in humans has revealed that no more than 2% of the genome codes for proteins. Thus, a large proportion of noncoding RNAs (ncRNAs) are generated. 9 Long noncoding RNAs (lncRNAs), with lengths of more than 200 nucleotides, have been found to play critical roles in various biological processes. 9 , 10 Recently, our understanding of the biological functions of lncRNAs in nervous system diseases has greatly advanced, particularly in neuropathic pain and nerve injury, 11 the roles of a few neuro‐related lncRNAs have been clarified. 12 , 13 , 14 However, few studies have examined the alterations in the expression of genes related to SCI. 15 Researchers have revealed some potential RNA pathways involved in SCI, including a potential competitive endogenous RNA pathway involved in the chronic SCI phase; this targeted interaction relationship consists of lncRNA6032, miR‐330‐3p, and Col6a1 and a potential pathway involving XR_350851 that regulates autophagy. 16 The regulatory functions of lncRNAs have been widely acknowledged but the precise regulatory network is not well‐understood. Studies of the functions of lncRNAs in subacute SCI remain limited, particularly regarding building of the lncRNA–microRNA (miRNA)–messenger RNA (mRNA) regulatory network.
In our previous studies, we demonstrated that one type of ncRNA, also known as miRNA, acts as a negative factor for SCI recovery from the acute to subacute phase via the PI3K/Akt/mTOR and transforming growth factor‐beta (TGF‐β) signaling pathways. 17 , 18 , 19 To determine the detailed mechanisms of lncRNAs and their related networks, we investigated whether lncRNA deregulation is involved in regulating the mammalian spinal cord in the subacute phase of SCI.
2. METHODS
2.1. Establishment of a mouse model and construction of sequencing library
All procedures involving animals were approved by the Ethics Committee of Shandong First Medical University and were performed in accordance with the Guidance Suggestions for the Care and Use of Laboratory Animals made by the Ministry of Science and Technology of China. Forty‐eight clean grade healthy 8‐week‐old male C57BL/6 mice were purchased from the Laboratory Animal Center of Shandong University. The mice were randomly divided into six groups; there were three SCI groups and three sham groups, with eight mice in each group. One mouse was randomly selected for hematoxylin & eosin (H&E) staining, and tissues from the remaining seven mice were mixed as one sample for RNA sequencing. The mouse model was established and samples were extracted as described previously. 20 In brief, laminectomy was performed to expose the dorsal aspect of the spinal cord (T8–T10) in SCI and Sham mice groups. Allen's drop injury (weight of 6 g and height of 60 mm) was induced in the SCI group. The spinal cord tissues at the level of the contusion injury were harvested on postoperative Day 1 and 7. Total RNA samples were collected after 7 days, and tissues were collected for H&E staining after 1 and 7 days. H&E staining was performed as previously described. Briefly, the spinal cord tissues were stripped off, fixed with 4% paraformaldehyde, paraffin‐embedded, dewaxed with xylene, placed in gradient ethanol, and stained with H&E. 20 Total RNA was extracted using the Trizol method 21 and detected by measuring the OD260/280 with a spectrophotometer (Thermo Fisher Scientific). The sequencing file was built after accurate detection of RNA integrity using a biological analyzer (Thermo Fisher Scientific). miRNA and lncRNA database construction and sequencing were performed. Total ribosomal RNA was removed, and the recovered RNA was purified and randomly broken into short fragments using a fragmentation reagent (Illumina). Using T4 RNA ligase 2, an adenosylated single‐stranded DNA 3′ junction and 5′ junction were successively ligated to the recovered RNA, and RNA sequences with 5′ and 3′ link junctions were amplified by reverse transcription‐polymerase chain reaction (PCR) with three complementary reverse transcription primers (Illumina). Finally, a 6% polyacrylamide‐Tris‐borate‐EDTA gel was used to separate and recover the PCR products, which showed lengths of 140–160 base pairs, for miRNA database construction; sequences more than 200 base pairs in length were used for lncRNA database construction. The sequencing reading length was set, and the library was sequenced on an Illumina Hiseq. 4000 by LC Bio according to the company's protocol.
2.2. Analysis of expression profile data and collection of differential expression data
StringTie (http://ccb.jhu.edu/software/stringtie/) was used to evaluate the expression levels of the mRNAs and lncRNAs by calculating the fragments per kilobase of transcript per million mapped reads. Differentially expressed miRNAs and lncRNAs were selected as those showing a log2(fold change) > 1 or log2(fold change) < −1 and with statistical significance (p value < 0.05) using the R package Ballgown. miRNAs were identified in miRBase 22.1 (http://www.mirbase.org/). To explore the function of lncRNAs, we predicted the cis‐target genes of lncRNAs. LncRNAs may play a cis role in neighboring target genes. Coding genes in 100,000 upstream and downstream regions were selected using a Perl script. We then performed functional analysis of the target genes of lncRNAs using scripts developed in‐house. Significance was considered at a p value < 0.05. We used Bowtie2 (http://bowtie-bio.sourceforge.net/) and Tophat2 (http://tophat.cbcb.umd.edu/) to map the reads to the genome of mice and StringTie to assemble the reads and to estimate the expression levels of all transcripts. The Circos program was used to show the localization and abundance of lncRNAs in the genome, and a class code was generated by StringTie.
2.3. Real‐time quantitative polymerase chain reaction (qRT‐PCR)
The results of RNA sequencing were verified by real‐time quantitative polymerase chain reaction (qRT‐PCR). Total complementary DNA was used for qRT‐PCR with SYBR Green Master Mix (Takara) on an ABI PRISM 7500 RT‐PCR System (Applied Biosystems) as previously described. 22 The primer sequences were as follows: lncRNA 1110038B12Rik F: GGTCTGGGCAGGGTCTGA, R: CTGGCGTGTGTCCTCAAATCC; lncRNA Gm23137F: GCAGTCGAGTTTCCCGCATTTG, R: CCAGGGCGAGGCTTATCCATT; lncRNA Rock1 F: CCCACTACCACAAATTATGC, R: GGCGAGGCTTATCCATTG; miR‐214‐3p F: TCGGACAGCAGGCACAGAC, R: CAGTGCAGGGTCCGAGGTAT; let‐7 F: TGGCGGTGAGGTAGTAGGTTG, R: CAGTGCAGGGTCCGAGGTAT; miR‐223‐3p_R + 1 F: TCGGCGGTGTCAGTTTGTC, R: CAGTGCAGGGTCCGAGGTAT; Hmox1 F: AGATGGCGTCACTTCGTCAG, R: GAGCGGTGTCTGGGATGAG; Vim F: TAGCCGCAGCCTCTATTC, R: AGTCCACCGAGTCTTGAAG; Hspb1 F: ACCAGCCTTCAGCCGAGC, R: GCCAGCGATCAGCCGTCT.
2.4. Protein–protein interaction (PPI) network construction
The STRING database (http://string-db.org/) was used to analyze the PPIs of differentially expressed (DE) mRNAs with a combined score of more than 0.4 as the cutoff value. The top 50 most significant DE genes were used as cores to construct the PPI network.
2.5. Analysis of lncRNA–mRNA coexpression regulatory network
The Pearson correlation coefficients of lncRNA–mRNAs based on lncRNA and mRNA expression levels obtained by RNA‐Seq were calculated. This coefficient was used to evaluate the correlation intensity of lncRNA–mRNA co‐expression (p ≤ 0.01). The top five most significant DE transcripts were used as cores to construct the lncRNA–mRNA coexpression regulatory network.
2.6. GO and Kyoto Encyclopedia of Genes and Genomes (KEGG) pathway analysis
LncRNAs may play a cis role in neighboring target genes. Coding genes in 100,000 upstream and downstream regions were selected using a Perl script. The cis‐target genes of the lncRNAs were predicted, and functional analysis of the target genes for lncRNAs was performed using in‐house scripts (p ≤ 0.05). The Gene Ontology (GO) (http://www.geneontology.org/) and Kyoto Encyclopedia of Genes and Genomes (KEGG) (http://www.genome.jp/kegg/) databases were used to predict the main biological functions and most important biochemical metabolic pathways and signal transduction pathways of the DE mRNAs.
2.7. Prediction of miRNA targets of lncRNAs and mRNAs, construction of the interaction network
TargetScan (http://www.targetscan.org/) and Miranda (http://www.miranda.org/) were used to predict miRNA targets in the sequences of the lncRNAs and mRNAs. The network was constructed according to the protein interactions in the STRING database.
3. RESULTS
3.1. SCI mouse model and RNA sequencing
After H&E staining, the nucleus was stained blue and the cytoplasm was stained pink. In the Sham group, the spinal cord structure was intact and undamaged (Figure 1A); one day after the injury, the tissue structure was damaged, showing inflammatory cell infiltration and capillary rupture bleeding (Figure 1B). Seven days after injury, the tissue damage was partially repaired and the bleeding was mostly absorbed but there was a large amount of inflammatory cell infiltration at the injury site (Figure 1C). As shown in the bioinformatics analysis pipeline workflow, a computational approach and stepwise filtering procedures were applied to identify high‐confidence lncRNAs expressed in the RNA‐sequencing cohort and preliminarily explore the interaction network and related functions (Figure 2).
Figure 1.
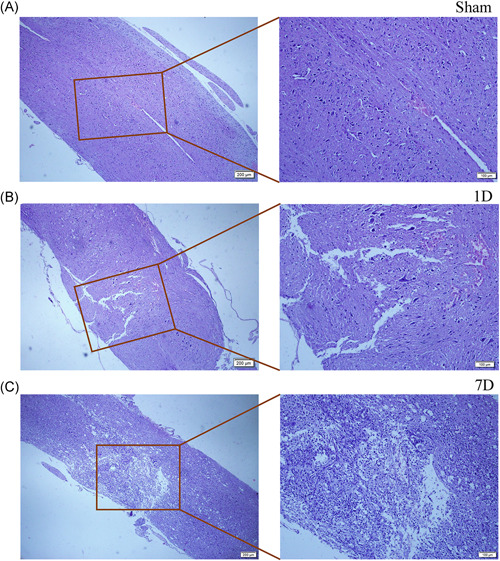
Hematoxylin and eosin staining of spinal cord samples, Sham group (A), 1 day after spinal cord injury (B), and 7 days after spinal cord injury(C) (Scar bars in low‐power field =200 µm, Scar bar in high‐power field = 100 µm)
Figure 2.
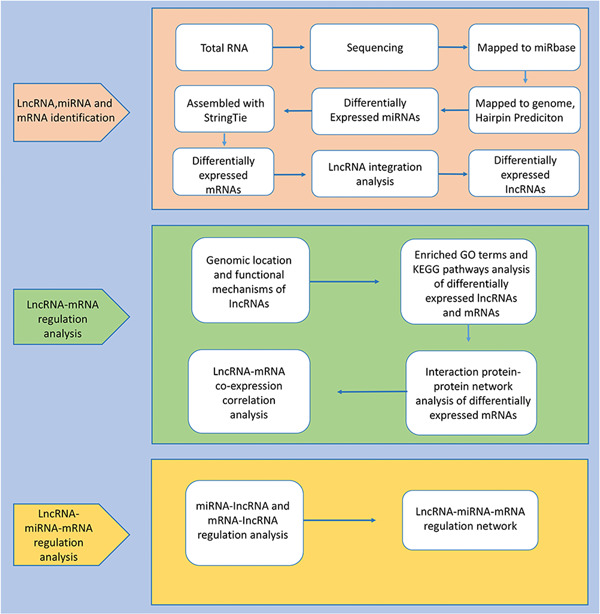
Overview of the analysis pipeline. lncRNA, long noncoding RNA; mRNA, messenger RNA; miRNA, microRNA
3.2. LncRNA expression profiles and validation of DE ncRNAs and mRNAs
The lncRNAs were subdivided into five categories according to their class code generated by StringTie: (i) a transfrag falling entirely within a reference intron (intronic); (j) potentially novel isoform or fragment of at least one splice junction was shared with a reference transcript; (o) generic exonic overlap with a reference transcript; (u) unknown intergenic transcript (intergenic); and (x) exonic overlap with reference on the opposite strand (antisense). The percentages of the five lncRNA class codes in the Sham groups were as follows: 77.28% i, 19.77% u, 1.8% j, 0.67% x, and 0.48% o. The distribution changed after SCI to 74.61% i, 20.29% u, 3.23% j, 1.01% x, and 0.87% o, respectively (Figure 3A,B). All potential lncRNAs in all samples were assembled by Stringtie and identified by CPC, CNCI, and Pfam. A graphical outline of the expression characteristics of the lncRNAs is shown in a hierarchical clustering analysis heatmap and a volcano plot (Figures 3C and 3E). In total, 230 DE lncRNAs were identified, of which 172 were upregulated and 58 were downregulated (p ≤ 0.05) (Figure 3D). The reliability of the RNA‐sequencing results was validated by qRT‐PCR analysis of three randomly selected DE lncRNAs: 1110038B12Rik, Gm23137, and Rock1; three DE miRNAs: miR‐214‐3p, let‐7, and miR‐223‐3p_R + 1; and three DE mRNAs: Hmox1, Vim, and Hspb1. The expression of these RNAs in the lesion epicenter compared with the Sham group were analyzed, and all validated qRT‐PCR results of DE lncRNAs, miRNA, and mRNAs were consistent with the corresponding sequencing data (Figure 4A–F).
Figure 3.
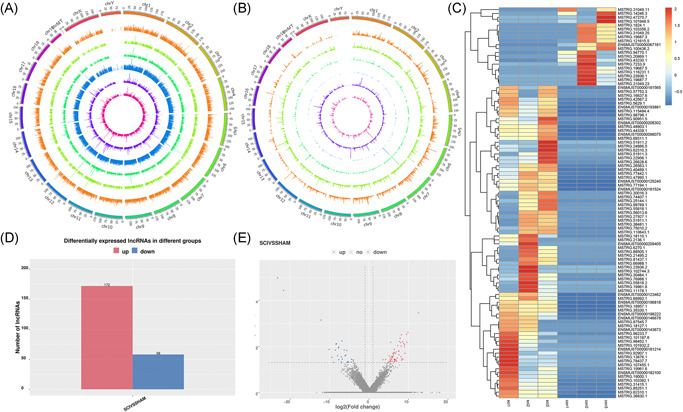
Genome Mapping and Genome‐wide identification. Distribution of lncRNAs in the genome of different samples. There are six layers from the outside to the inside, and each layer shows the chromosome distribution and expression of lncRNAs of one sample. The outer three layers represent the SCI group, and the inner three layers represent the Sham group. The height of the column in each layer represents the expression level, and the higher the expression level, the higher the column height (A). RNA distribution of six types of lncRNAs along each chromosome. Known lncRNAs (class code = , depicted in orange), intronic lncRNAs (class code i, depicted in light green), lncRNAs sharing a reference with at least 1 splice junction (class code j, depicted in the dark green), lncRNA of generic exonic overlap with a reference transcript (class code o, depicted in blue), intergenic lncRNA (class code u, depicted in violet), and antisense lncRNA (class code x, depicted in pink) are presented in physical bins of 500 kb for each chromosome (B). Heatmap of top differentially expressed lncRNAs (C). Barplot of DE lncRNAs (D). Volcano plots showing variance in differentially expressed lncRNA (E). Red and blue points indicate up‐ and downregulated lncRNAs, respectively. DE, differentially expressed; lncRNA, long noncoding RNA
Figure 4.
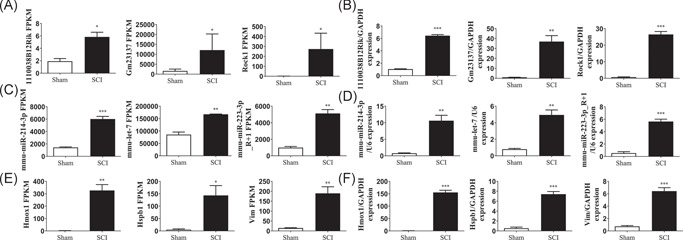
Validation of differential lncRNA, miRNA, and mRNA expression. Sequencing results of lncRNAs (A), miRNAs (C), and mRNA (E); qRT‐PCR validation of putative lncRNAs (B), miRNAs (D), and mRNAs (F). mean ± SD, n = 3, **p < 0.005, ***p < 0.001 (two sample t‐test). lncRNA, long noncoding RNA; mRNA, messenger RNA; miRNA, microRNA; qRT‐PCR, real‐time quantitative polymerase chain reaction
3.3. Basic property comparison of lncRNAs and mRNAs and protein interaction network analysis
The transcript abundance, length, exon number, and open reading frames (ORF) of the lncRNAs and mRNAs were compared under the same conditions. Most lncRNAs contained fewer than one exon, whereas mRNAs contained more exons which were distributed over a wider range. Some mRNAs had as many as 20 exons (Figure 5A). The lengths of the lncRNAs were typically shorter than those of the mRNAs (Figure 5B). The lengths of the ORF in lncRNAs were often shorter than those of the mRNAs (Figure 5C,D). The fragments per kilobase of transcript per million mapped reads data indicated that the lncRNAs were more abundant than the mRNAs (Figure 5E). PPI networks of the most 50 DE genes are shown in the STRING database (Figures 6 and S1).
Figure 5.
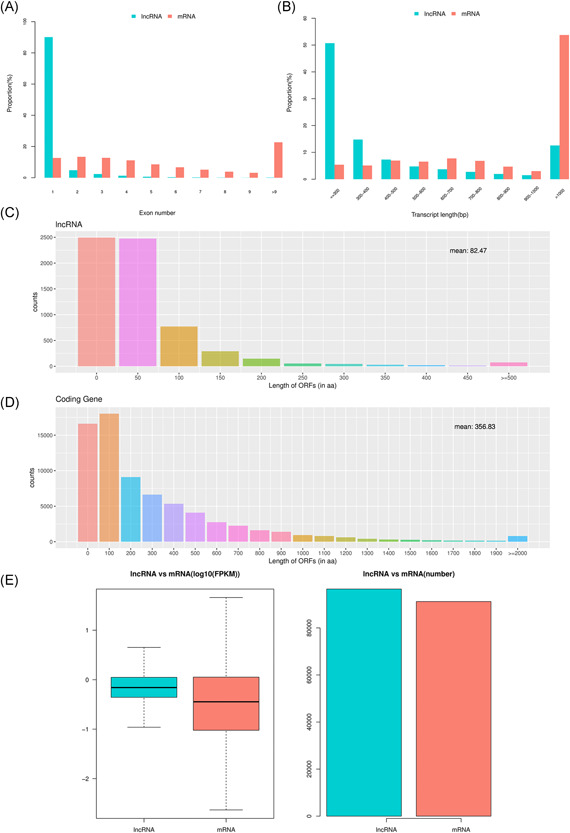
Basic property comparison of lncRNAs and mRNAs. Exon numbers of lncRNAs and mRNAs (A). Transcript lengths of lncRNAs and mRNAs (B). ORF lengths of lncRNAs and mRNAs (C) and (D). Expression levels of lncRNAs and mRNAs, mean ± SD (E). lncRNA, long noncoding RNA; mRNA, messenger RNA; miRNA, microRNA; ORF, open reading frames; SD, standard deviation
Figure 6.
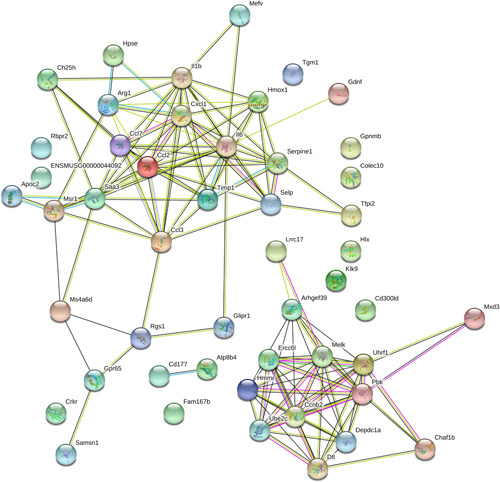
Interaction protein–protein network analysis of differentially expressed genes
3.4. Enriched ontology terms and KEGG pathways of differentially expressed lncRNA‐related transcripts and coexpressed transcripts
GO and KEGG enrichment analysis of dysregulated genes between the SCI and Sham groups was performed to determine the main biological functions and molecular pathway mechanisms. In this study, the dysregulated lncRNA‐related transcripts were associated with hemoglobin complex, haptoglobin binding, globin–hemoglobin complex, oxygen transporter activity, and oxygen transport (Figure 7A). Dysregulated transcripts of lncRNA‐associated pathways were found by KEGG analysis to be most significantly associated with the following: neomycin, kanamycin, and gentamicin biosynthesis, African trypanosomiasis, systemic lupus erythematosus, and alcoholism (Figure 7B). To explore the relationship between the lncRNA and mRNA transcripts, we performed lncRNA–mRNA co‐expression network analyses. A lncRNA–mRNA network of the top five most DE transcripts was constructed (Figure 8A). We then analyzed the GO and KEGG enrichment of the co‐expressed mRNAs. GO functional enrichment analysis showed that the transcripts were associated with phagolysosome, positive regulation of fibronectin‐dependent thymocyte migration, and positive regulation of the tumor necrosis factor ligand superfamily (Figure 8B). KEGG enrichment analysis showed that transcripts were associated with Staphylococcus aureus infection, complement and coagulation cascades, malaria, and osteoclast differentiation (Figure 8C).
Figure 7.
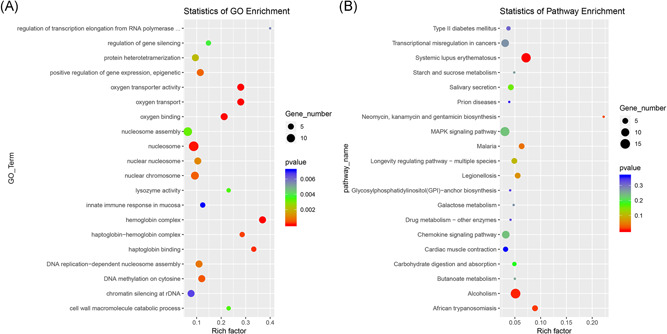
Enriched GO terms (A) and KEGG pathways (B) of differentially expressed lncRNA‐related transcripts. The rich factor is the ratio of the number of different genes to the total number of genes in the database; a higher rich factor value indicates a greater enrichment degree. GO, Gene Ontology; KEGG, Kyoto Encyclopedia of Genes and Genomes
Figure 8.
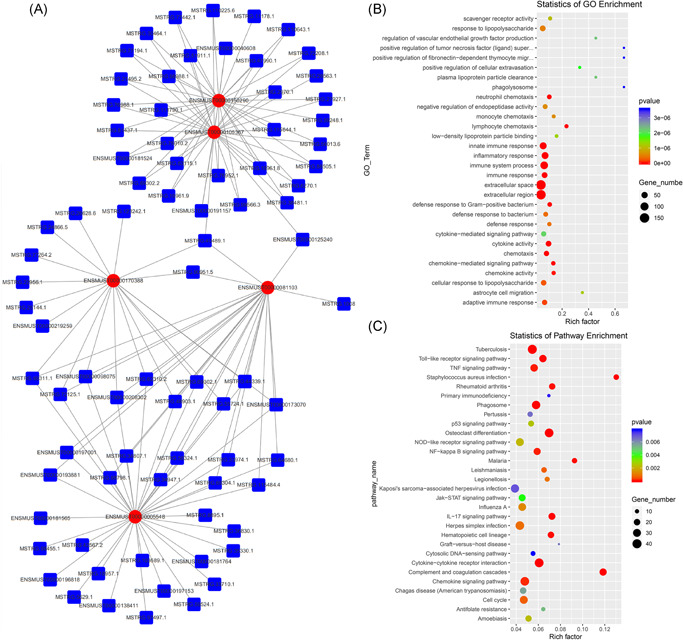
Coexpression network analyses of top five most differentially expressed transcripts (A). Enriched GO terms (B) and KEGG pathways (C) of differentially expressed lncRNAs coexpressed transcripts. GO, Gene Ontology; KEGG, Kyoto Encyclopedia of Genes and Genomes; lncRNA, long noncoding RNA
3.5. Prediction and construction of a lncRNA–miRNA interaction network
The competing endogenous RNA network was investigated using the Cytoscape software to clarify the competitive mechanisms and potential biological functions of lncRNAs after SCI. The targeted relationship between lncRNA and miRNA was predicted using TargetScan and MiRanda software. The top 10 most DE lncRNAs were: Eapp: MSTRG.23936.2, 4930430E12Rik: MSTRG.75010.2, 4933406I18Rik: MSTRG.103356.2, Gm23137: MSTRG.19687.3, Gm23137: MSTRG.19687.5, Gm23137: MSTRG.19687.7, Hbb‐bt: MSTRG.102744.3, Malat1: MSTRG.56013.6, Oaz2: MSTRG.115484.4, and Rock1: MSTRG.51911.2 with their binding miRNAs, and miRNAs also bind with mRNAs; both miRNAs and mRNAs were also DE. The binding miRNAs were miR‐1298‐3p, miR‐135a‐5p, miR‐135b‐5p, miR‐217‐5p, miR‐92a‐3p, miR‐204‐5p, miR‐211‐5p, miR‐214‐3p, miR‐7a‐5p, and miR‐7b‐5p (Figure 9).
Figure 9.
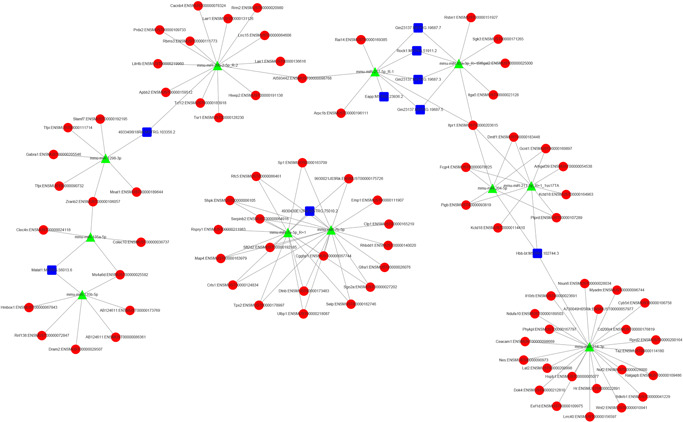
LncRNA–miRNA–mRNA regulatory interaction network analysis of top 10 most differentially expressed lncRNAs. lncRNA, long noncoding RNA; mRNA, messenger RNA; miRNA, microRNA
4. DISCUSSION
SCI is a global health problem and understanding its fundamental cellular and molecular mechanisms is crucial for developing prospective treatment strategies. There are two stages of SCI: the primary and secondary injury phases. 6 In the primary injury phase, immediate traumatic injury causes laceration, acute stretching, and sudden acceleration‐deceleration injuries, after which sustained compression injury begins. 7 In the acute phase of secondary injury, multiple pathophysiological processes, including neutrophil invasion, neuronal death, axonal swelling, and blood‐brain barrier permeability, are triggered by primary traumatic injury. 23 In the subacute secondary injury phase, damage and repair occur simultaneously; the main processes are macrophage infiltration, blood–brain barrier repair, resolution of edema, and scar formation. 6 Some lncRNAs have been shown to play regulatory roles in neuro‐pathophysiological processes. For instance, lncRNAs in the dorsal root ganglion show cell‐type specificity after nerve injury, 24 and some functions of novel lncRNAs (MALAT1, SNHG5, and ZNF667‐AS1) have been identified. 25 , 26 , 27 However, the role of lncRNAs in the subacute phase of SCI remains unknown.
In our previous studies of the ncRNA expression pattern after SCI, we demonstrated that microRNA‐21 acts as a negative factor of SCI recovery in the acute phase via the PI3K/Akt/mTOR signaling pathway. 17 , 18 , 19 Additionally, we verified that miR‐21a‐5p promotes spinal fibrosis after SCI. 22 , 28 To determine the detailed mechanisms of lncRNAs regulation after SCI, samples from the mouse models were subjected to next‐generation deep sequencing. High‐throughput RNA sequencing, which shows several advantages such as a larger dynamic range of detection, higher sensitivity, and specificity, is a powerful tool. We identified DE lncRNAs and miRNAs and mRNAs obtained from SCI samples, at the transcriptome level. We mostly focused on lncRNAs rather than miRNA or mRNA. The localization of lncRNAs in the genome was determined and the basic properties of lncRNAs and mRNAs were compared. Coexpression networks revealing lncRNA–mRNA interaction patterns were constructed. We also explored the biological functions of the DE mRNAs, particularly those related to lncRNAs. Previous studies analyzed lncRNA expression in six species, including human, mouse, and fruit fly, and found that the majority of lncRNAs contained at least one short ORF ( ≥ 24 amino acids) and often several ORFs. The average ORF size in lncRNAs was between 43 and 68 amino acids depending on the species. 29 In protein‐coding mRNA, the main ORF is usually long and highly consistent with the annotated protein, which is an important indicator of whether it is translated. In lncRNA, the main ORFs are usually shorter than those of protein‐coding mRNA, and most of the main ORFs in ncRNA correspond to proteins with a length less than 100 amino acids. 29 Most lncRNAs contain ORFs longer than 24 amino acids, which theoretically have the potential to encode corresponding proteins. Generally, short peptides are not easy to find in the protein database and thus are easily ignored. There have been numerous reports of small open readboxes (sORFs < 100 amino acids) that encode functional proteins. The ORFs in the lncRNAs obtained in this study were mostly below 100 amino acids, and the number of lncRNAs with ORF lengths below 50 amino acids was three times higher than that of lncRNAs with ORF length between 50 and 100 amino acids. These results are consistent with previous reports. In addition, lncRNAs usually have multiple ORFs with coding potential, and some of them have high translation potential. Some investigators suggest that these small peptides may play a role in the evolution of proteins in organisms. 29 Specific roles, such as antibacterial and pro‐inflammatory activities in the immune system, for these peptides have been found in recent studies, 30 and as new tumor markers in colon cancer, liver cancer, and triple‐negative breast cancer. 31 In this study, by comparing the transcript lengths, exon numbers, ORF lengths, and expression levels of lncRNA and mRNA, we analyzed mRNA and lncRNA on an overall level; in addition, we compared our results with those of previous research, to verify the accuracy of sequencing analysis. Despite the existence of a number of studies regarding coding in lncRNAs, the evidence remains fragmented. The translation process is complex and the specific mechanisms are still unclear; therefore, this study did not involve the prediction of the translation function of lncRNA.
The GO enrichment results showed a wide overlap between co‐expressed mRNAs and lncRNA‐interacting mRNAs. Both networks are involved in immune system processes, inflammatory response, innate immune response, and cytokine activity. This is consistent with the pathological features and H&E staining results in the subacute phase of SCI. Simultaneously, the KEGG enrichment results showed that some classic pathways, such as the p53, NF‐κB, Jak‐STAT, and IL‐17 signaling pathways, were specifically activated, which is consistent with the results of previous studies. 2 , 8 , 32 PPI networks, coexpression networks, and lncRNA–miRN–mRNA networks can be used to screen out targets, which can be mRNA, miRNA, or lncRNA. The subsequent interactions can be explored for functional verification.
Based on the one‐to‐many binding characteristics between lncRNA and miRNA, 10 , 33 lncRNA–miRNA targeted interaction networks were constructed with the 10 most DE lncRNAs as the core vertices. It is worth noting that some miRNAs targeting these lncRNAs have been reported to play an important role in the pathophysiological process of the nervous system. miR‐135b‐5p plays a neuroprotective role by targeting GSK3β3 34 , 35 and can also regulate neuroectoderm formation through TGF‐β/BMP signaling 36 ; miR‐7a‐5p, which is widely found in zebrafish, human, and mouse, plays a regulatory role in nerve development, nerve injury, central nervous system tumors, and Parkinson's disease, by targeting EGFR, RAF1, KLF4, PARP, SP1, and PI3K 37 ; overexpression of miR‐217‐5p protects against oxygen‐glucose deprivation‐induced neuronal injury 38 ; miR‐211‐5p has been shown to regulate the progression of Alzheimer's disease in rat animal models. 39 Some related lncRNA–miRNA interactions have been preliminarily identified and validated in tumor models such as lncRNAGAS8‐AS1‐miR‐135b‐5p. Moreover, lncRNAGAS5‐miR‐135b‐5p has been shown to interfere with cancer progression. 40 , 41 , 42 These preliminary studies also provide important ideas for the screening of key targets in later stages.
Our findings improve the understanding of the underlying mechanisms of SCI, and many novel lncRNAs screened in this study may play an important role in the regulation of protein expression. However, there were several limitations to this study. PPI networks lack comparisons between groups, and bioinformatics methods were solely used to predict possible biological functions; therefore, prediction of the entire noncoding RNA network is incomplete. For ethical reasons, we cannot sequence human spinal cord samples directly, but a mouse model is a convenient and reliable alternative. The widespread use of animal models is based not only on the broad biological commonality of most mammals but also on the fact that human diseases often affect other species as well. This is true for most infectious diseases, as well as noncommunicable diseases such as type 1 diabetes, hypertension, allergies, cancer, epilepsy, and myopathy. Not only are the symptoms similar, but the mechanisms are often so conserved that 90% of veterinary drugs used to treat animals are the same as or very similar to those used to treat humans. 43 Although the uncertainty of experimental results in preclinical animal models due to differences in species is always present, it cannot negate the value of animal models. We need to further improve the understanding of this difference, which can help determine the accuracy of interpretation of experimental results and improve the success rate of clinical trials. Although we hypothesized that DE lncRNAs may be extensively involved in the pathophysiological process of the subacute stage of SCI through the regulation of multiple classical pathways, the results of single sequencing cannot determine whether the changes in lncRNA expression are in response to cellular injury or causal for the cellular processes associated with the phenotypic changes following SCI. In our future studies, based on the lncRNA–miRNA–mRNA and lncRNA–mRNA interaction networks predicted in this study, we will continue to monitor and verify the DE lncRNAs and their predicted pathways at multiple time points after SCI, to verify their targeted upstream and downstream regulatory relationships.
CONFLICT OF INTERESTS
The authors declare that there are no conflict of interests.
AUTHOR CONTRIBUTIONS
Wenzhao Wang, Liang Ma, and Jun Li carried out the animal model design and carried out the study. Shang‐You Yang, Mingjie Sun, Jianan Chen, and Zheng Yi participated in the data analysis. Wei Xie conceived of the study, and participated in its design and coordination, and helped to draft the manuscript. All authors read and approved the final manuscript and they all declare that no competing interests exist.
Supporting information
Supporting information.
ACKNOWLEDGMENTS
Shandong Medical and Health Science and Technology Development Programs (No. 2016WS0618). Sichuan Science and Technology Program (No. 2019JDRC0100 and 2020JDRC0054); the National Clinical Research Center for Geriatrics, West China Hospital, Sichuan University (Z20192013); West China hospital postdoctoral research and development fund (2019HXBH068).
Wang W, Ma L, Li J, et al. Identification and coregulation pattern analysis of long noncoding RNAs following subacute spinal cord injury. J Orthop Res. 2022;40:661‐673. 10.1002/jor.25101
Wenzhao Wang, Liang Ma and Jun Li contributed equally to this study and should be considered co‐first authors.
REFERENCES
- 1. Harvey LA, Dunlop SA, Churilov L, Galea MP. Spinal Cord Injury Physical Activity (SCIPA) Hands On Trial Collaborators . Early intensive hand rehabilitation is not more effective than usual care plus one‐to‐one hand therapy in people with sub‐acute spinal cord injury ('Hands On'): a randomised trial. J Physiother. 2017;63(4):197‐204. [DOI] [PubMed] [Google Scholar]
- 2. Tran AP, Warren PM, Silver J. The biology of regeneration failure and success after spinal cord injury. Physiol Rev. 2018;98(2):881‐917. [DOI] [PMC free article] [PubMed] [Google Scholar]
- 3. Hara M, Kobayakawa K, Ohkawa Y, et al. Interaction of reactive astrocytes with type I collagen induces astrocytic scar formation through the integrin‐N‐cadherin pathway after spinal cord injury. Nat Med. 2017;23(7):818‐828. [DOI] [PubMed] [Google Scholar]
- 4. Cristante AF, Barros Filho TE, Marcon RM, Letaif OB, Rocha ID. Therapeutic approaches for spinal cord injury. Clinics. 2012;67(10):1219‐1224. [DOI] [PMC free article] [PubMed] [Google Scholar]
- 5. Holmes D. Spinal‐cord injury: spurring regrowth. Nature. 2017;552(7684):S49. [DOI] [PubMed] [Google Scholar]
- 6. Rowland JW, Hawryluk GW, Kwon B, Fehlings MG. Current status of acute spinal cord injury pathophysiology and emerging therapies: promise on the horizon. Neurosurg Focus. 2008;25(5):E2. [DOI] [PubMed] [Google Scholar]
- 7. Baptiste DC, Fehlings MG. Pharmacological approaches to repair the injured spinal cord. J Neurotrauma. 2006;23(3‐4):318‐334. [DOI] [PubMed] [Google Scholar]
- 8. Schwab JM, Maas A, Hsieh J, Curt A. Raising awareness for spinal cord injury research. Lancet Neurol. 2018;17(7):581‐582. [DOI] [PubMed] [Google Scholar]
- 9. Kopp F, Mendell JT. Functional classification and experimental dissection of long noncoding RNAs. Cell. 2018;172(3):393‐407. [DOI] [PMC free article] [PubMed] [Google Scholar]
- 10. Atianand MK, Caffrey DR, Fitzgerald KA. Immunobiology of long noncoding RNAs. Annu Rev Immunol. 2017;35:177‐198. [DOI] [PMC free article] [PubMed] [Google Scholar]
- 11. Zhou J, Fan Y, Chen H. Analyses of long non‐coding RNA and mRNA profiles in the spinal cord of rats using RNA sequencing during the progression of neuropathic pain in an SNI model. RNA Biol. 2017;14(12):1810‐1826. [DOI] [PMC free article] [PubMed] [Google Scholar]
- 12. Li Z, Li X, Chen X, et al. Emerging roles of long non‐coding RNAs in neuropathic pain. Cell Prolif. 2019;52(1):e12528. [DOI] [PMC free article] [PubMed] [Google Scholar]
- 13. Liu Z, Liang Y, Wang H, et al. LncRNA expression in the spinal cord modulated by minocycline in a mouse model of spared nerve injury. J Pain Res. 2017;10:2503‐2514. [DOI] [PMC free article] [PubMed] [Google Scholar]
- 14. Xia LX, Ke C, Lu JM. NEAT1 contributes to neuropathic pain development through targeting miR‐381/HMGB1 axis in CCI rat models. J Cell Physiol. 2018;233(9):7103‐7111. [DOI] [PubMed] [Google Scholar]
- 15. Duran RC, Yan H, Zheng Y, et al. The systematic analysis of coding and long non‐coding RNAs in the sub‐chronic and chronic stages of spinal cord injury. Sci Rep. 2017;7:41008. [DOI] [PMC free article] [PubMed] [Google Scholar]
- 16. Wang L, Wang B, Liu J, Quan Z. Construction and analysis of a spinal cord injury competitive endogenous RNA network based on the expression data of long noncoding, micro and messenger RNAs. Mol Med Rep. 2019;19(4):3021‐3034. [DOI] [PMC free article] [PubMed] [Google Scholar]
- 17. Ning B, Gao L, Liu RH, Liu Y, Zhang NS, Chen ZY. microRNAs in spinal cord injury: potential roles and therapeutic implications. Int J Biol Sci. 2014;10(9):997‐1006. [DOI] [PMC free article] [PubMed] [Google Scholar]
- 18. Zhang M, Xin Y. Circular RNAs: a new frontier for cancer diagnosis and therapy. J Hematol Oncol. 2018;11(1):21. [DOI] [PMC free article] [PubMed] [Google Scholar]
- 19. Liu R, Wang W, Wang S, Xie W, Li H, Ning B. microRNA‐21 regulates astrocytic reaction post‐acute phase of spinal cord injury through modulating TGF‐β signaling. Aging. 2018;10:1474‐1488. [DOI] [PMC free article] [PubMed] [Google Scholar]
- 20. Wang W, Su Y, Tang S, et al. Identification of noncoding RNA expression profiles and regulatory interaction networks following traumatic spinal cord injury by sequence analysis. Aging (Albany NY). 2019;11(8):2352‐2368. [DOI] [PMC free article] [PubMed] [Google Scholar]
- 21. Wang W, Liu R, Su Y, Li H, Xie W, Ning B. MicroRNA‐21‐5p mediates TGF‐beta‐regulated fibrogenic activation of spinal fibroblasts and the formation of fibrotic scars after spinal cord injury. Int J Biol Sci. 2018;14(2):178‐188. [DOI] [PMC free article] [PubMed] [Google Scholar]
- 22. Wang W, Tang S, Li H, et al. MicroRNA‐21a‐5p promotes fibrosis in spinal fibroblasts after mechanical trauma. Exp Cell Res. 2018;370(1):24‐30. [DOI] [PubMed] [Google Scholar]
- 23. Ho CH, Wuermser LA, Priebe MM, Chiodo AE, Scelza WM, Kirshblum SC. Spinal cord injury medicine. 1. Epidemiology and classification. Arch Phys Med Rehabil. 2007;88(3 Suppl 1):S49‐S54. [DOI] [PubMed] [Google Scholar]
- 24. Baskozos G, Dawes JM, Austin JS, et al. Comprehensive analysis of long noncoding RNA expression in dorsal root ganglion reveals cell‐type specificity and dysregulation after nerve injury. Pain. 2019;160(2):463‐485. [DOI] [PMC free article] [PubMed] [Google Scholar]
- 25. Qiao Y, Peng C, Li J, Wu D, Wang X. LncRNA MALAT1 is neuroprotective in a rat model of spinal cord ischemia‐reperfusion injury through miR‐204 regulation. Curr Neurovasc Res. 2018;15(3):211‐219. [DOI] [PubMed] [Google Scholar]
- 26. Jiang ZS, Zhang JR. LncRNA SNHG5 enhances astrocytes and microglia viability via upregulating KLF4 in spinal cord injury. Int J Biol Macromol. 2018;120(Pt A):66‐72. [DOI] [PubMed] [Google Scholar]
- 27. Zhou J, Xiong Q, Chen H, Yang C, Fan Y. Identification of the spinal expression profile of non‐coding RNAs involved in neuropathic pain following spared nerve injury by sequence analysis. Front Mol Neurosci. 2017;10:91. [DOI] [PMC free article] [PubMed] [Google Scholar]
- 28. Guo X, Qiu W, Liu Q, et al. Immunosuppressive effects of hypoxia‐induced glioma exosomes through myeloid‐derived suppressor cells via the miR‐10a/Rora and miR‐21/Pten Pathways. Oncogene. 2018;37(31):4239‐4259. [DOI] [PubMed] [Google Scholar]
- 29. Ruiz‐Orera J, Messeguer X, Subirana JA, Alba MM. Long non‐coding RNAs as a source of new peptides. eLife. 2014;3:e03523. [DOI] [PMC free article] [PubMed] [Google Scholar]
- 30. Jackson R, Kroehling L, Khitun A, et al. The translation of non‐canonical open reading frames controls mucosal immunity. Nature. 2018;564(7736):434‐438. [DOI] [PMC free article] [PubMed] [Google Scholar]
- 31. Zhou B, Yang H, Yang C, et al. Translation of noncoding RNAs and cancer. Cancer Lett. 2020;497:89‐99. [DOI] [PubMed] [Google Scholar]
- 32. Moon BS, Bai J, Cai M, Liu C, Shi J, Lu W. Kruppel‐like factor 4‐dependent Staufen1‐mediated mRNA decay regulates cortical neurogenesis. Nat Commun. 2018;9(1):401. [DOI] [PMC free article] [PubMed] [Google Scholar]
- 33. Chandran R, Mehta SL, Vemuganti R. Non‐coding RNAs and neuroprotection after acute CNS injuries. Neurochem Int. 2017;111:12‐22. [DOI] [PMC free article] [PubMed] [Google Scholar]
- 34. Duan Q, Sun W, Yuan H, Mu X. MicroRNA‐135b‐5p prevents oxygen‐glucose deprivation and reoxygenation‐induced neuronal injury through regulation of the GSK‐3beta/Nrf2/ARE signaling pathway. Arch Med Sci. 2018;14(4):735‐744. [DOI] [PMC free article] [PubMed] [Google Scholar]
- 35. van Battum EY, Verhagen MG, Vangoor VR, et al. An Image‐Based miRNA Screen Identifies miRNA‐135s As Regulators of CNS Axon Growth and Regeneration by Targeting Kruppel‐like Factor 4. J Neurosci. 2018;38(3):613‐630. [DOI] [PMC free article] [PubMed] [Google Scholar]
- 36. Bhinge A, Poschmann J, Namboori SC, et al. MiR‐135b is a direct PAX6 target and specifies human neuroectoderm by inhibiting TGF‐beta/BMP signaling. EMBO J. 2014;33(11):1271‐1283. [DOI] [PMC free article] [PubMed] [Google Scholar]
- 37. Karran E, Mercken M, De Strooper B. The amyloid cascade hypothesis for Alzheimer's disease: an appraisal for the development of therapeutics. Nat Rev Drug Discov. 2011;10(9):698‐712. [DOI] [PubMed] [Google Scholar]
- 38. Yi Z, Shi Y, Zhao P, Xu Y, Pan P. Overexpression of miR‐217‐5p protects against oxygen‐glucose deprivation/reperfusion‐induced neuronal injury via inhibition of PTEN. Hum Cell. 2020;33(4):1026‐1035. [DOI] [PubMed] [Google Scholar]
- 39. Zhu R, Qi X, Liu C, et al. The silent information regulator 1 pathway attenuates ROS‐induced oxidative stress in Alzheimer's disease. J Integr Neurosci. 2020;19(2):321‐332. [DOI] [PubMed] [Google Scholar]
- 40. Chen N, Yin D, Lun B, Guo X. LncRNA GAS8‐AS1 suppresses papillary thyroid carcinoma cell growth through the miR‐135b‐5p/CCND2 axis. Biosci Rep. 2019;39(1). [DOI] [PMC free article] [PubMed] [Google Scholar]
- 41. Xue Y, Ni T, Jiang Y, Li Y. Long noncoding RNA GAS5 inhibits tumorigenesis and enhances radiosensitivity by suppressing miR‐135b expression in non‐small cell lung cancer. Oncol Res. 2017;25(8):1305‐1316. [DOI] [PMC free article] [PubMed] [Google Scholar]
- 42. Chen H, Mao M, Jiang J, Zhu D, Li P. Circular RNA CDR1as acts as a sponge of miR‐135b‐5p to suppress ovarian cancer progression. Onco Targets Ther. 2019;12:3869‐3879. [DOI] [PMC free article] [PubMed] [Google Scholar]
- 43. Barre‐Sinoussi F, Montagutelli X. Animal models are essential to biological research: issues and perspectives. Future Sci OA. 2015;1(4):FSO63. [DOI] [PMC free article] [PubMed] [Google Scholar]
Associated Data
This section collects any data citations, data availability statements, or supplementary materials included in this article.
Supplementary Materials
Supporting information.