

Abstract
The ongoing transition from fossil to renewable feedstocks demands new efficient processes for an economically viable production of biomass‐derived commodities and fine chemicals. Novel energy‐ and material‐efficient product purification and separation will play a crucial role due to altered product and feed composition. The present study comprises the synthesis and tests of cross‐linked p‐vinylphenylboronate polymers for the separation of 18 diols, sugar alcohols, and saccharides, which can be obtained during biomass processing. The separation was based on molecular recognition, that is, esterification of the phenylboronate with vicinal diols. A correlation of the molecular complexation constant, the polymer swelling, and the maximum adsorption capacity was found. The adsorption curves over time were recorded. Preliminary results on competitive adsorption of binary mixtures showed a high potential for the separation of substrates with significantly different complexation constants. Desorption tests implied easier desorption of substrates that only adsorb on the outer polymer shell.
Keywords: adsorption, biomass, phenylboronate, polymers, separation techniques
Doesn't it swell? The adsorption of diols, sugar alcohols, and saccharides on functional phenylboronate polymers is studied. The adsorption capacity correlates with their complexation constants, and a three‐step model is proposed. Adsorption of substrates on the outer polymer surface induces swelling, which facilitates penetration of the substrates into the particle core. Promising results for separation of binary mixtures are obtained. Diols can be desorbed with 80 %EtOH/20 %H2O solution.
Introduction
Biorefining as an alternative to conventional fossil resources‐based value chains has received significant attention for the production of commodities and fine chemicals in recent years. Lignocellulose is a promising renewable carbon source, as it does not compete with the food sector and presents the most abundant terrestrial biomass available as waste streams of forestry, agriculture or paper production. [1] In this regard, diols, [2] sugar alcohols, [3] and saccharides [4] play a central role in novel lignocellulose‐based value chains. [5]
Purification and separation are major factors that need to be considered for efficient production of these intermediates, as they can become the bottleneck for an economically viable processing.[ 1 , 6 ] Separation and purification steps account for 40–50 % of the process costs in current oil refineries, and a further increase of the energy demand is envisaged for biorefineries.[ 6a , 7 ] Challenges arise from the altered feed and product composition: (i) the more polar products have a low thermal stability, low volatility, and/or high boiling points, (ii) reactions are often performed in aqueous media yielding diluted aqueous streams, (iii) product streams contain side products, which may hamper the further processing or lead to formation of undesired by‐products, and (iv) due to variations of the biomass feed a variety of the product stream composition is expected.[ 6a , 6b ]
These factors make conventional thermal separation techniques either unsuitable or unattractive, as they are combined with a high energy input. Diluted aqueous product streams of varying composition that contain side products reveal the necessity of product pre‐concentration and purification prior to further processing. There is, consequently, need for novel energy‐ and material‐efficient separation and purification techniques.
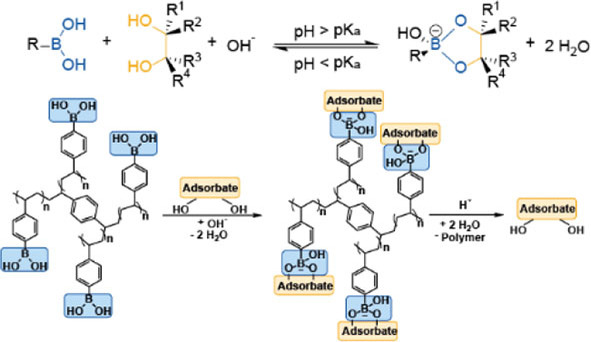
Boronic acids provide potential for the development of such processes, as they can reversibly form esters with molecules bearing vicinal diol motifs. A pH above the pK a of the boronic acid generally facilitates the esterification, whereas esters are unstable in acidic media (Figure 1). [8] Facilitated ester formation is based on a change in hybridization from the “boronic acid” form (sp2‐hybridization) to the “boronate” form (sp3‐hybridization). [9] Most importantly, esterification of the substrate bearing a vicinal diol motif takes place selectively in the presence of other organic and inorganic components. This approach, referred to as “molecular recognition”, enables a selective product separation from rather complex mixtures. [10] Because of the ongoing transition from fossil to renewable feedstocks, the utilization of boronic acids for isolation of diols and saccharides via the principle of molecular recognition has gained interest in recent years.[ 10 , 11 ] Most frequently, liquid‐liquid anionic extraction processes have been applied.[ 3 , 12 ] These processes suffer, however, from disadvantages including the necessity of an organic boronic‐acid‐containing extraction phase, and the addition of quaternary amines for charge balancing of the boronate‐substrate anionic complex.
Figure 1.
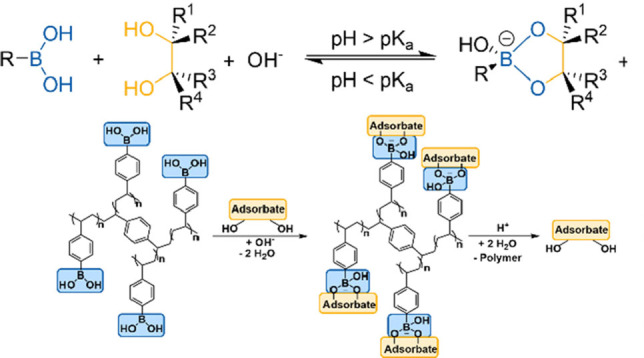
Esterification of a boronic acid with a diol forming a boronate‐diol ester: pH and pK a dependency of the esterification (up), schematic illustration of the adsorption and desorption of a diol adsorbate on a phenylboronate containing polymer (down).
Adsorption‐based separation methods can help to overcome these disadvantages. Stationary phases bearing immobilized boronic‐acid end groups have already been proposed for affinity chromatography and adsorption‐based separation of diols, saccharides, and structurally related molecules. [13] For this purpose, high boron contents are favorable for a high sorption capacity of the materials due to the stoichiometry of the process (Figure 1). We have recently studied a d‐fructose‐d‐glucose separation utilizing cross‐linked p‐vinylphenylboronic acid (p‐VPBA) polymers. [14] This work showed a high potential of the tested materials due to no boron leaching into the aqueous phase during the adsorption and no need for use of a second organic extraction phase. The composition of the polymers for a selective isolation of d‐fructose from a solution obtained after isomerization of d‐glucose was optimized.
In the present study, we explored the applicability of cross‐linked p‐VPBA polymers for the separation of 18 diols, sugar alcohols, and saccharides, which can be obtained during biomass processing. Molecular recognition offers a great opportunity for a selective separation of these compounds, which are typically obtained in diluted product streams in biorefining. This work addresses correlations between complexation affinities of the substrates with maximum attained capacities as well as time‐loading dependencies of adsorption. Competitive adsorption of binary mixtures for the separation of substrates as well as recovery of the substrates by desorption were also investigated.
Results and Discussion
Correlations of the maximal capacity of the polymers with the complexation constants
The adsorption of substrates available via biomass transformation onto 20 mol% divinylbenzene (DVB) or 20 mol% ethylene glycol dimethacrylate (EDMA) cross‐linked p‐VPBA‐polymers was studied. The substrate scope included diols, sugar alcohols, and monosaccharides. In‐depth characterization of the polymers was performed previously. [14] IR spectra and nitrogen physisorption results can be found in the Supporting Information (Figure S1 and Table S1, Supporting Information).
Figure 2 shows the sorption isotherms of the substrates. In most cases, the sorption curves presented saturation curves, which could be fitted with the Langmuir model [Eq. (S2), Supporting Information]. The sorption isotherms of ethylene glycol (EG), propylene glycol (PG), and glycerol did not show saturation in the explored concentration range due to low molecular complexation constants. Therefore, the q max values were not determined.
Figure 2.

Adsorption isotherms for the tested substrates. Conditions: substrate concentrations from 0.018 to 0.370 mol L−1 in 2.63 mL carbonate buffer at pH 10 with 20 vol % EtOH, 0.100 g 20 mol% DVB cross‐linked p‐VPBA polymer, RT. The adsorption isotherms for the EDMA cross‐linked polymer can be found in the Supporting Information.
Table 1 summarizes the results obtained for the maximum attained polymer loadings. The q max values appear to correlate with the complexation constants of the substrates. High substrate loadings up to 500–650 mgS gPolymer −1 were reached for substrates with high complexation constants log K B‐S>3. For substrates with lower log K B‐S values, lower substrate loadings of 100–400 mgS gPolymer −1 were observed. Characterization of the loaded polymers by 13C and 11B magic angle spinning (MAS) NMR supported complexation of the substrates upon adsorption (Figures S4–S7, Supporting Information). A share of sp3‐hybridized boron after adsorption exceeds that of a polymer after a blank test (entry 19, Table 1). In general, the sorption capacity correlates very well with the amount of complexed boron (Figure S8, Supporting Information). Somewhat higher amounts were detected for saccharides than for polyols. A possible explanation are different structures of the complexes, for example, a possible contribution of 2 : 1 complexation as previously observed for d‐fructose. [14]
Table 1.
Results of the adsorption.[a]
|
Entry |
Substrate |
log K B‐S[b] |
t eq, sorp. [c] [h] |
q max, DVB [d] [molS molB −1] |
q max, EDMA [d] [molS molB −1] |
q max, DVB [d] [mgS gPolymer −1] |
q max, EDMA [d] [mgS gPolymer −1] |
SD[e] [%] |
Bsp3 (MAS NMR)[f] [%] |
|---|---|---|---|---|---|---|---|---|---|
|
1 |
d‐sorbitol |
4.01 |
24 |
0.982 |
0.838 |
627 |
560 |
218 |
35 |
|
2 |
d‐xylitol |
3.38 |
7 |
0.949 |
0.847 |
506 |
472 |
215 |
35 |
|
3 |
d‐mannitol |
3.32 |
24 |
0.969 |
0.652 |
619 |
435 |
187 |
35 |
|
4 |
d‐tagatose |
3.30 |
7 |
1.085 |
0.742 |
686 |
489 |
211 |
53 |
|
5 |
d‐ribose |
– |
6 |
1.006 |
0.815 |
530 |
448 |
217 |
60 |
|
6 |
d‐allulose |
– |
5 |
0.971 |
0.678 |
614 |
448 |
217 |
63 |
|
7 |
d‐fructose[g] |
3.23 |
5 |
0.854 |
0.618 |
539 |
409 |
212 |
52 |
|
8 |
d‐arabitol |
2.66 |
7 |
0.818 |
0.657 |
436 |
351 |
171 |
30 |
|
9 |
meso‐erythritol |
– |
5 |
0.819 |
0.657 |
351 |
294 |
164 |
30 |
|
10 |
d‐ribitol |
2.38 |
5 |
0.580 |
0.482 |
310 |
269 |
110 |
17 |
|
11 |
d‐xylose |
2.20 |
5 |
0.465 |
0.311 |
245 |
171 |
61 |
33 |
|
12 |
d‐arabinose |
2.10 |
5 |
0.719 |
0.499 |
378 |
274 |
146 |
42 |
|
13 |
d‐galactose |
2.10 |
5 |
0.290 |
0.254 |
183 |
161 |
83 |
17 |
|
14 |
d‐glucose[g] |
1.81 |
5 |
0.201 |
0.171 |
127 |
113 |
68 |
26 |
|
15 |
d‐mannose |
1.69 |
5 |
0.358 |
0.186 |
226 |
123 |
54 |
38 |
|
16 |
glycerol |
1.20 |
6 |
n.a. |
n.a. |
n.a. |
n.a. |
59 |
22 |
|
17 |
propylene glycol |
0.49 |
1.5 |
n.a. |
n.a. |
n.a. |
n.a. |
42 |
6 |
|
18 |
ethylene glycol |
0.27 |
1 |
n.a. |
n.a. |
n.a. |
n.a. |
32 |
9 |
|
19 |
no substrate[g] |
– |
– |
– |
– |
– |
– |
68 |
– |
[a] Conditions: substrate concentrations from 0.018 to 0.370 mol L−1 in 2.63 mL carbonate buffer at pH 10 with 20 vol% EtOH, 0.100 g polymer, RT. [b] Molecular affinity constants of the corresponding molecular boronate‐diol esters.[ 8a , 15 ] [c] Time until reaching the sorption equilibrium. [d] Maximum polymer loadings for tested substrates upon adsorption on 20 mol % DVB and 20 mol% EDMA cross‐linked p‐VPBA polymers. [e] Swelling degree in presence of the respective substrates, conditions: 0.100 g DVB cross‐linked p‐(VPBA) polymer, 0.148 mol L−1 substrate solution in carbonate buffer at pH 10 with 20 vol % EtOH, soaking for 3–24 h. [f] Percentage of sp3‐hybridized boron diol ester estimated from 11B MAS NMR for DVB cross‐linked p‐VPBA polymer, adsorption conditions: 0.148 mol L−1 substrate solutions in carbonate buffer at pH 10 with 20 vol % EtOH. [g] SD and maximum sorption capacities reproduced from previous studies. [14]
Complexation of the phenylboronic acid moieties results in formation of ionized groups on the surface, that is, transforming the polymer into a polyelectrolyte. [14] Formation of these negatively charged groups induces the swelling of the polymer. The swelling degrees (SD) of the polymers are in good correlation with the complexation constants, that is, the swelling of materials during the adsorption seems to be indeed induced by complexation. The expansion of the polymer network takes place due to electrostatic repulsion of the groups, whereas the elastic retractive force in the gel is developed to oppose the swelling process.[ 14 , 16 ] The dry cross‐linked p‐VPBA‐polymers present nonporous impermeable materials, whereas they are transformed into a permeable state upon swelling. [17] Thus, complexation induces the swelling of the polymer matrix, favors the diffusion of the substrates into the material particles, and results in high q max values. Therefore, the excellent correlations between log K B‐S, the swelling degree, and the q max values were established (Figure 3 and Figure S3, Supporting Information). The maximum sorption capacities depend on the nature of the cross‐linker, and the q max values for a polymer with a stiff DVB cross‐linker were higher than for a more flexible EDMA cross‐linker. However, the general relationships between log K B‐S and the maximum sorption capacity were the same for both cross‐linkers, as illustrated in Figure 3.
Figure 3.
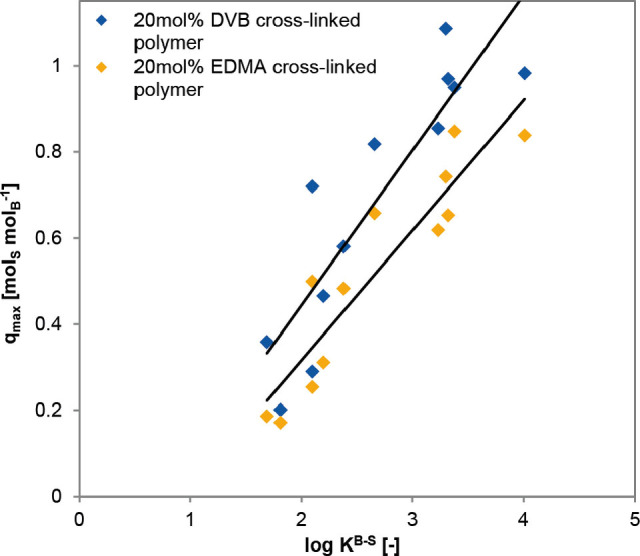
Correlation of the maximum polymer loadings and the complexation constants for the tested polymers.
The time required for equilibration was in the range of 1–24 h and varied significantly for different substrates. To get a better understanding of this observation, we recorded the adsorption profiles over time.
Time‐resolved adsorption curves
The time‐resolved adsorption curves were acquired for the 20 mol% DVB cross‐linked p‐VPBA polymers applying a stoichiometric 1 : 1 molar ratio of phenylboronic acid moieties to the substrates. A representative concentration‐time curve for d‐xylitol is shown in Figure 4a. The kinetic curves of the same shapes were observed for the other substrates (Figure S9–S11, Supporting Information). Based on the time‐dependent adsorption profiles, we conclude that the scheme of adsorption previously proposed for D‐glucose and D‐fructose [14] can be in general also used for diols, sugar alcohols, and monosaccharides (Figure 4b).
Figure 4.

Description of the steps of the adsorption process : (a) Time profile of the adsorption of d‐xylitol. Conditions: 0.148 mol L−1 d‐xylitol in 2.63 mL carbonate buffer at pH 10 with 20 vol %EtOH, 0.100 g 20 mol% DVB cross‐linked polymer, RT. (b) Schematic illustration of the adsorption process, adapted from Ref. [14] with permission. Copyright 2020, The Royal Society of Chemistry.
A typical time‐resolved adsorption curve can be tentatively divided in three regions, referred to as “Step 1”, “Step 2”, and “Step 3”. Step 1 corresponds to a quick adsorption of the substrates and lasts a few minutes. Step 2 is accompanied with a swelling of the polymers (though swelling takes place to some extend already in Step 1) and stands for an uptake of another significant portion of the substrates. However, Step 2 is slower than Step 1 and typically takes 1–3 h. Step 3 relates to a very slow uptake of the substrates, which lasts typically 2–4 h until the equilibrium is established. In Step 3, only a minor adsorption of the substrates is observed.
The higher the complexation constant log K B‐S is, the larger the substrate uptake in Step 1 is. Apparently, the complexation observed in Step 1 corresponds to interaction of a substrate with phenylboronic acid moieties on the surface and the near‐surface layer. The rates of Step 1 resemble the interaction of the substrates with molecular phenylboronic acids, exhibiting characteristic complexation times of few minutes. [8a]
Step 2 takes few hours and results in a substrate uptake comparable to Step 1. Interestingly, Step 2 is accompanied with a significant swelling of the polymer. Apparently, the charged moieties of the complexes induce swelling due to repulsion and enable an access of a sorbate to phenylboronate moieties. This suggests that Step 2 corresponds to a substrate uptake into a shell of a polymer and can be probably limited by a polymer swelling or diffusion of the substrate into a polymer shell.
Step 3 corresponds to relatively low adsorption on the polymer. In Step 3, the swelling rate of the polymers significantly decreases, and the phenylboronic acid moieties at the outer surface, near‐surface layer, and the shell are occupied with the adsorbed species. Consequently, we deduced that Step 3 corresponds to an intraparticle diffusion of a substrate to the polymer core.
In summary, adsorption of the substrates exhibiting high complexation constants log K B‐S takes several hours required for polymer swelling and penetration of the sorbates into the polymer core. The substrates with low complexation constants log K B‐S are adsorbed on the outer shell of the polymer, and the adsorption is typically completed in less than 1 h.
Competitive sorption
To explore the applicability of the polymers for the separation of biomass‐derived compounds, preliminary experiments with equimolar binary mixtures of substrates were performed. As we showed in the previous section, adsorption capacity is a function of the binding constant. Therefore, mixtures of representative substrates with a high (d‐xylitol and d‐sorbitol), a medium (d‐galactose and d‐xylose), and a low (EG and PG) affinity were tested. The results are summarized in Figure 5. The loading of a substrate with a higher complexation constant was always higher, except for a binary mixture of EG and PG. According to the results, the differences of the complexation constants as well as exact values of complexation constants seem to determine separation efficiency. Saccharides and polyols can be very efficiently separated from diols (EG and PG) since the latter exhibit very low complexation constants. Separation of saccharides and polyols from each other is also feasible, although with lower separation factors. In general, the higher the difference between binding constant is, the higher is the separation factor.
Figure 5.

Polymer loadings upon adsorption from equimolar binary mixtures, SF designates the separation factor [(q a/q b)/(c eq,a/c eq,b)]. Conditions: substrate concentrations of 0.148 mol L−1 in 2.63 mL carbonate buffer at pH 10 with 20 vol % EtOH, 0.100 g 20 mol% DVB cross‐linked polymer, 5 h, RT.
Desorption
Desorption of the substrates from the polymers was studied under batch conditions using dried loaded polymers with adsorbed substrate dispersed in various solutions. Typically, phenylboronate‐diol esters are not stable under acidic conditions. [8a] The desorption of six representative substrates with various binding constants was studied. The substrates used for the competitive adsorption in the previous section were selected. Table 2 shows the desorption results for the selected substrates. Three solutions were tested for desorption, namely: (a) a 0.5 m sulfuric acid solution with 20 vol % ethanol, (b) an 80 %:20 % v/v water‐ethanol mixture in an autoclave pressurized with CO2, and (c) an 80 %:20 % v/v ethanol‐water mixture. The conditions for the desorption were chosen to compare a typical desorption solution of H2SO4 with a more sustainable approach applying pressurized CO2. A water‐ethanol mixture without acid addition was also tested since it presents the most environmentally benign and economically attractive desorption medium. Addition of at least 20 % EtOH was necessary to enable dispersion of the polymer in the liquid phase, which is not wetted by pure water. [14]
Table 2.
Desorption efficiencies from 0.100 g polymer with adsorbed substrate using 2.63 mL desorption solution under various desorption conditions.
|
Entry |
Substrate |
Desorption efficiency [%] |
||
|---|---|---|---|---|
|
|
|
80 %:20 % v/v 0.5 m H2SO4/EtOH |
80 %:20 % v/v H2O/EtOH CO2 |
20 %:80 % v/v H2O/EtOH |
|
1 |
EG |
91 |
91 |
81 |
|
2 |
PG |
75 |
90 |
72 |
|
3 |
d‐xylitol |
71[a] |
71[a] |
6 |
|
4 |
d‐sorbitol |
68[a] |
60[a] |
3 |
|
5 |
d‐xylose |
79 |
74 |
4 |
|
6 |
d‐galactose |
91 |
97 |
5 |
[a] After three desorption cycles. The times for adsorption and desorption and desorption temperatures are provided in the Experimental Section.
The amount of acid required for cleavage of the esters is in good agreement with the complexation constants (Table 1). Weakly complexed EG and PG can be efficiently desorbed even without addition of acid into a mixture of 80 % : 20 % v/v ethanol and water. This result is important due to a lower heat of vaporization of this mixture compared to pure water of 858 vs. 2254 kJ L−1, respectively. [18] More stable complexes (i. e., exhibiting greater complexation constants log K B‐S) with sugar alcohols and monosaccharides cannot be cleaved without addition of acid. Interestingly, CO2 can be used to substitute molecular acids, such as sulfuric acid.
The number of cycles required for the desorption can be rationalized in scopes of the model proposed for the adsorption in Figure 4b: the greater the penetration depth of the substrate into a polymer grain, the lower is the readiness for desorption. High desorption efficiencies were obtained in one desorption cycle for EG, PG, d‐xylose, and d‐galactose, which are adsorbed on the outer surface and shell of the particles. More cycles were required for the desorption of d‐xylitol and d‐sorbitol, which penetrate deeply into the core of the polymer grains. Moderate desorption degrees were observed for d‐xylitol and d‐sorbitol even after three cycles, which could be explained by a limited swelling degree of the polymers under acidic conditions. [14] The desorption degree of each cycle decreases further significantly over the course of the three desorptions (Table S7, Supporting Information). The substrate adsorbed in the polymer core remains thus unavailable for the desorption solutions because of an insufficient swelling and low permeability of the polymers.
Conclusion
Functional phenylboronate polymers were successfully used for the recovery of diols, sugar alcohols, and monosaccharides from aqueous solution utilizing the principle of molecular recognition. Recording the adsorption isotherms demonstrated that the maximum polymer loadings correlate with the complexation constants and swelling degrees of the polymer reached during the adsorption. Based on the time‐resolved adsorption studies, three steps of substrate uptake can be proposed (1) a fast initial adsorption on the outer surface of the polymer particle, (2) an adsorption‐induced swelling of the polymer particle, upon which more inner sorption‐sites become available and substrate adsorption in the polymer shell occurs, and (3) a slow adsorption on sorption sites in the polymer core mainly limited by substrate diffusion. Preliminary results demonstrate a high potential of the proposed method for the separation of mixtures of substrates bearing vicinal diols motifs with sufficiently different binding constants.
Screening of the desorption conditions showed that the amount of acid required for the cleavage of esters correlates with the complexation constants. Importantly, an 80 % : 20 % v/v ethanol‐water mixture can be used for the desorption of EG and PG. Desorption of sugar alcohols and monosaccharides required acidification, and CO2 could be applied instead of molecular acids. Completeness of desorption depends on the penetration depth of the substrate into the polymer particle. Substrates with a low molecular complexation constant that only adsorb on the outer polymer shell can be efficiently desorbed, whereas substrates that also adsorb on the inner particle and the particle core remain unavailable for desorption. Subsequent studies will focus on the application and implementation of the separation process into biomass‐derived value chains and tests of complex reaction mixtures.
Experimental Section
Chemicals
p‐Vinylphenylboronic acid (p‐VPBA, 97 %) was supplied by ChemPUR. Ethylene glycol (EG, 99.8 %), propylene glycol (PG, 99 %), glycerol (>99.5 %), adonitol (ribitol, >99 %), d‐sorbitol (>99.5 %), and 2,2′‐azobis(2‐methyl‐propionitrile) (AIBN, >98 %) were provided by Sigma Aldrich. Benzyl alcohol (>99.8 %), ethanol (99.9 %), toluene (>99.7 %), sodium hydroxide microgranulate (≥98.8 %), and sulfuric acid (98 %) were obtained from GeyerChemSolute. Ethylene glycol dimethacrylate stabilized with 100 ppm mehq (EDMA, 98 %) was purchased from Th. Geyer. Diethanolamine (DEA, 99 %), d‐(+)‐mannose (99 %), and divinylbenzene (DVB, 80 % divinylbenzene: 20 % ethylbenzene mixture, 99 %) were obtained from Alfa Aesar. Sodium hydrogen carbonate (>99 %), d‐(+)‐xylose (≥99 %), xylit (xylitol, ≥98.5 %), and chloroform (>99 %) were purchased from Roth. Conc. hydrochloric acid (37 wt%) from Honeywell and d‐arabinose (>99 %) from Applichem were used. d‐(+)‐Glucose (Reag. Ph. Eur.), d‐(+)‐galactose (99 %), and sodium dihydrogen phosphate monohoydrate (Reag. Ph. Eur.) were provided by Merck. d‐Ribose (98 %), d‐(+)‐arabitol, and d‐(−)‐tagatose (99 %) were obtained from abcr. d‐Mannitol (99 %) was supplied by Fluka Analytical, and meso‐erythritol by J&K scientific. d‐allulose (d‐psicose) was kindly provided by the Pfeifer & Langen GmbH. All solutions were prepared in distilled water. Unless specified, chemicals were used without further purification. p‐VPBA was recrystallized from hot water prior to use. [19] Toluene and benzyl alcohol were dried and degassed prior to use.
Esterification of p‐VPBA
Esterification and polymerization were conducted according to a slightly modified, previously reported procedure. [14] In a typical procedure, stoichiometric amounts of p‐VPBA (16.00 g, 108 mmol) and DEA (11.36 g, 10.36 mL, 108 mmol) were added to 640 mL toluene. The mixture was refluxed at 115 °C for 2 h under successive water removal. The cooled solution was filtered over a glass frit, and the obtained iminodiethyl p‐vinylphenylboronate (yield 80–95 %) was intensively washed with toluene, dried under high vacuum, and stored in a freezer.
Synthesis of cross‐linked p‐VPBA polymers
Iminodiethyl p‐vinylphenylboronate (7.00 g, 32.3 mmol), AIBN (20 mg, 0.4 mol%), and either 20 mol% DVB (1.05 g, 1.149 mL, 6.5 mmol) or 20 mol% EDMA (1.28 g, 1.217 mL, 6.5 mmol) as a cross‐linker were added to 20 mL benzyl alcohol in a 50 mL Schlenk flask and the mixture was degassed for 30 min. Polymerization was performed under Ar atmosphere for 20 h at 80 °C. The solid product was ground, washed with chloroform, and dried in a vacuum drying oven at 60 °C. The dried polymer particles were successively washed with aqueous 1 m hydrochloric acid solution, water, and 0.5 m sodium dihydrogen phosphate buffer solution at pH 7.5. The buffer was prepared by adjustment of the pH value of the 0.5 m NaH2PO4 by a dropwise addition of 4 m NaOH. After drying, the polymers were obtained as white powders with yields of 83–97 %. [14]
Time‐resolved adsorption studies
A 0.5 m stock solution of carbonate buffer solution at pH 10 was prepared by dissolving 5.04 g sodium hydrogen carbonate in 120 mL distilled water and the pH was adjusted by dropwise addition of 4 m NaOH. The respective substrate amounts were dissolved in a mixture of 30 mL carbonate buffer solution and 7.5 mL ethanol to prepare 0.148 mol L−1 substrate solutions (Table S2, Supporting Information). Ethanol was necessary to facilitate polymer dispersion in the liquid phase. [14] 2.63 mL solution were added to 0.100 g polymer, and suspensions were stirred on a multi‐stirring plate at 500 rpm at RT for 10 min, 30 min, 1 h, 2 h, 3 h, 4 h, 5 h, and 7 h, respectively. For d‐sorbitol and d‐mannitol, additional samples were taken after 16 and 24 h. The suspensions were filtered with polyamide syringe filters (Chromafil PA 20/25) and the liquid phases were analyzed by HPLC.
Adsorption isotherms
Eight stock solutions with substrate concentrations from 0.018 to 0.370 mol L−1 were prepared by addition of the respective substrate amount (Table S3, Supporting Information) to 15 mL carbonate buffer solution at pH 10 and 3.75 mL ethanol. 2.63 mL stock solution was added to 0.100 g polymer, and suspensions were stirred for 3 h at RT on a multi‐stirring plate at 500 rpm. For d‐sorbitol and d‐mannitol, experiments were repeated with stirring for 7 h. The suspensions were filtered and analyzed by HPLC.
Competitive sorption
0.148 mol L−1 substrate solutions were prepared by adding the respective substrate amounts (Table S2, Supporting Information) to 15 mL carbonate buffer solution at pH 10 and 3.75 mL ethanol. Substrate solutions containing an equimolar binary mixture of the two substrates were used. 2.63 mL stock solution was added to 0.100 g polymer, and the solutions were stirred for 5 h at RT on a multi‐stirring plate at 500 rpm. The suspensions were filtered and analyzed by HPLC.
Desorption
0.148 mol L−1 substrate solutions were prepared in a mixture of carbonate buffer solution at pH 10 and ethanol. 0.400 g polymer were added to 10.50 mL substrate solution. After stirring for 3 h at RT, the polymer was filtered off and dried under high vacuum. Upon completion of drying, 0.100 g polymer with adsorbed substrate were added to 2.63 mL desorption solution. Three desorption conditions were tested: (i) 80 %:20 % v/v 0.5 m aq. H2SO4/ethanol solution at RT, (ii) desorption in autoclaves pressurized with 30 bar CO2 at 50 °C in 80 %:20 % v/v H2O/ethanol solution, and (iii) 20 %:80 % v/v H2O/ethanol solution at RT. Solutions of EG, PG, d‐xylose, and d‐galactose were stirred for 4 h. For d‐xylitol and d‐sorbitol, adsorption lasted 7 h, and desorption was performed for 24 h. For repetitive desorption studies, the initial amount of polymer and desorption solution was increased. The polymer was filtered off and dried after desorption and added to new desorption solution. The amount of polymer and desorption solution were adjusted for each cycle to keep the solid/liquid ratio constant.
Swelling degree
The polymer swelling in the substrate solution was assessed according to a previously reported procedure.[ 14 , 20 ] 0.100 g polymer were placed to a 15 mL centrifuge tube with a 5 mL inlay, and the tube and the inlay were filled with 0.148 mol L−1 substrate solution as soaking solution. Samples were ultra‐sonically mixed for 3–7 h and allowed to stand without stirring for 24 h. Thereafter, the supernatant liquid was removed by centrifugation. HPLC samples were taken prior and after the procedure, and the swelling degree was calculated (p. S7, Supporting Information for more details).
Determination of substrate length
The lengths of substrates were calculated using a structure optimization and a cylinder fitting function. [14] The function was reduced to a 2D solver problem by application of a rotationally symmetric cylinder of minimum diameter as fitting parameter. The Matlab® global search function from the global optimization toolbox was used as solver function. [21]
Solid‐state NMR
Adsorption experiments were performed with unlabeled material. 0.148 mol L−1 substrate solutions were prepared by adding the respective substrate amounts (Table S2, Supporting Information) to 15 mL carbonate buffer solution at pH 10 and 3.75 mL ethanol. 2.63 mL stock solution was added to 0.100 g polymer, and the solutions were stirred for 3 h at RT on a multi‐stirring plate at 500 rpm. Reaction time was extended to 24 h for d‐sorbitol and d‐mannitol. An aliquot of the solution was taken and analyzed by HPLC. The polymer was filtered off from the residual solution and dried under high vacuum. Subsequent solid‐state NMR experiments of the loaded polymers were performed on a Bruker Avance Neo NMR Spectrometer at 9.4 T with 13 kHz MAS. A 4.00 mm HX probe was used. In all cases, the 1H 90° pulse duration was 2.45 μs. For 1H‐13C cross‐polarization (CP) experiments, a 2 ms contact time with a ramp on the 1H channel was used. During acquisition, SPINAL64 heteronuclear decoupling was employed. Chemical shifts were referenced using adamantane. 11B NMR spectra were acquired using the Hahn‐echo sequence. All experiments were nominally performed at RT. However, frictional heating due to MAS results in a higher actual sample temperature (≈+15 K at 13 kHz MAS). Spectral processing was done using the Bruker TopSpin 4.0.5 software. Percentages of different boron environments were estimated from the 11B MAS NMR spectra using the “sola” module in TopSpin with manual peak picking of an adequate number of resonances. Further details on different fitting procedures can be found in the Supporting Information (pp.S12–S14, Supporting Information)
HPLC
For the determination of the concentration of the compounds, the solutions were analyzed by HPLC on a Shimadzu Prominence LC‐20 system as previously reported. [22] Two successively connected organic acid columns (CS‐Chromatography, 100 mm×8.0 mm and 300 mm×8.0 mm) were used, and the HPLC was equipped with a refractive index (RI) detector. The columns were thermostated at 40 °C, aqueous CF3COOH with a concentration of 154 μL L−1 was used as eluent at a flow rate of 1 mL min−1. Measurement time was 20 min.
Conflict of interest
The authors declare no conflict of interest.
Supporting information
As a service to our authors and readers, this journal provides supporting information supplied by the authors. Such materials are peer reviewed and may be re‐organized for online delivery, but are not copy‐edited or typeset. Technical support issues arising from supporting information (other than missing files) should be addressed to the authors.
Supporting Information
Acknowledgements
We thank Noah Avraham, Jens Heller, and Heike Bergstein for HPLC and ICP‐OES analysis. Financial support of the DFG (Project 391305926) is greatly acknowledged. G.S. acknowledges the German Federal Environmental Foundation (DBU) for fellowship support. This work partly contributed to the Cluster of Excellence “The Fuel Science Center”, which is funded by the Deutsche Forschungsgemeinschaft (DFG, German Research Foundation) under Germany's Excellence Strategy – Exzellenzcluster 2186 “The Fuel Science Center” (ID: 390919832). Open Access funding enabled and organized by Projekt DEAL.
G. Schroer, V. Toussaint, S. Bachmann, A.-C. Pöppler, C. H. Gierlich, I. Delidovich, ChemSusChem 2021, 14, 5207.
References
- 1. Delidovich I., Leonhard K., Palkovits R., Energy Environ. Sci. 2014, 7, 2803–2830. [Google Scholar]
- 2.
- 2a. Zeng A.-P., Sabra W., Curr. Opin. Biotechnol. 2011, 22, 749–757; [DOI] [PubMed] [Google Scholar]
- 2b. Ruppert A. M., Weinberg K., Palkovits R., Angew. Chem. Int. Ed. 2012, 51, 2564–2601; [DOI] [PubMed] [Google Scholar]; Angew. Chem. 2012, 124, 2614–2654; [Google Scholar]
- 2c. Delidovich I., Hausoul P. J., Deng L., Pfützenreuter R., Rose M., Palkovits R., Chem. Rev. 2016, 116, 1540–1599. [DOI] [PubMed] [Google Scholar]
- 3. Sánchez-Bastardo N., Delidovich I., Alonso E., ACS Sustainable Chem. Eng. 2018, 6, 11930–11938. [Google Scholar]
- 4.
- 4a. Harmer M. A., Fan A., Liauw A., Kumar R. K., Chem. Commun. 2009, 6610–6612; [DOI] [PubMed] [Google Scholar]
- 4b. Wang J., Xi J., Wang Y., Green Chem. 2015, 17, 737–751; [Google Scholar]
- 4c. Delidovich I., Palkovits R., ChemSusChem 2016, 541–561; [DOI] [PMC free article] [PubMed] [Google Scholar]
- 4d. Delidovich I., Palkovits R., J. Catal. 2015, 327, 1–9; [Google Scholar]
- 4e. Delidovich I., Hoffmann A., Willms A., Rose M., ACS Catal. 2017, 7, 3792–3798; [Google Scholar]
- 4f. Delidovich I., Curr. Opin. Green Sustain. Chem. 2020, 100414; [Google Scholar]
- 4g. Rosatella A. A., Simeonov S. P., Frade R. F., Afonso C. A., Green Chem. 2011, 13, 754–793; [Google Scholar]
- 4h. Rackemann D. W., Doherty W. O., Biofuels Bioprod. Biorefin. 2011, 5, 198–214. [Google Scholar]
- 5.
- 5a. Luterbacher J., Alonso D. M., Dumesic J., Green Chem. 2014, 16, 4816–4838; [Google Scholar]
- 5b. Palkovits R., Delidovich I., Philos. Trans. R. Soc. A 2018, 376, 20170064; [DOI] [PMC free article] [PubMed] [Google Scholar]
- 5c. Artz J., Palkovits R., Curr. Opin. Green Sustain. Chem. 2018, 14, 14–18. [Google Scholar]
- 6.
- 6a. Kiss A. A., Lange J.-P., Schuur B., Brilman D. W. F., van der Ham A. G., Kersten S. R., Biomass Bioenergy 2016, 95, 296–309; [Google Scholar]
- 6b. Nguyen H., DeJaco R. F., Mittal N., Siepmann J. I., Tsapatsis M., Snyder M. A., Fan W., Saha B., Vlachos D. G., Annu. Rev. Chem. Biomol. Eng. 2017, 8, 115–137; [DOI] [PubMed] [Google Scholar]
- 6c. Lange J. P., ChemSusChem 2017, 10, 245–252. [DOI] [PubMed] [Google Scholar]
- 7. Sholl D. S., Lively R. P., Nature 2016, 532, 435. [DOI] [PubMed] [Google Scholar]
- 8.
- 8a. Peters J. A., Coord. Chem. Rev. 2014, 268, 1–22; [Google Scholar]
- 8b. Van Duin M., Peters J., Kieboom A., Van Bekkum H., Tetrahedron 1984, 40, 2901–2911. [Google Scholar]
- 9.
- 9a. Yan J., Springsteen G., Deeter S., Wang B., Tetrahedron 2004, 60, 11205–11209; [Google Scholar]
- 9b. Bosch L., Fyles T., James T. D., Tetrahedron 2004, 60, 11175–11190. [Google Scholar]
- 10.
- 10a. Brennan T. C., Datta S., Blanch H. W., Simmons B. A., Holmes B. M., BioEnergy Res. 2010, 3, 123–133; [Google Scholar]
- 10b. Griffin G., Sep. Sci. Technol. 2005, 40, 2337–2351; [Google Scholar]
- 10c. Gori S. S., Raju M. V. R., Fonseca D. A., Satyavolu J., Burns C. T., Nantz M. H., ACS Sustainable Chem. Eng. 2015, 3, 2452–2457. [Google Scholar]
- 11.
- 11a. Shi J., Gladden J. M., Sathitsuksanoh N., Kambam P., Sandoval L., Mitra D., Zhang S., George A., Singer S. W., Simmons B. A., Green Chem. 2013, 15, 2579–2589; [Google Scholar]
- 11b. Caes B. R., Teixeira R. E., Knapp K. G., Raines R. T., ACS Sustainable Chem. Eng. 2015, 3, 2591–2605; [DOI] [PMC free article] [PubMed] [Google Scholar]
- 11c. John Griffin G., Shu L., J. Chem. Technol. Biotechnol. 2004, 79, 505–511; [Google Scholar]
- 11d. Li B., Relue P., Varanasi S., Green Chem. 2012, 14, 2436–2444; [Google Scholar]
- 11e. Alipour S., Green Chem. 2016, 18, 4990–4998; [Google Scholar]
- 11f. Broekhuis R. R., Lynn S., King C. J., Ind. Eng. Chem. Res. 1996, 35, 1206–1214. [Google Scholar]
- 12.
- 12a. Delidovich I., Palkovits R., Green Chem. 2016, 18, 5822–5830; [Google Scholar]
- 12b. Drabo P., Tiso T., Heyman B., Sarikaya E., Gaspar P., Förster J., Büchs J., Blank L. M., Delidovich I., ChemSusChem 2017, 10, 3252–3259; [DOI] [PubMed] [Google Scholar]
- 12c. Delidovich I., Gyngazova M. S., Sánchez-Bastardo N., Wohland J. P., Hoppe C., Drabo P., Green Chem. 2018, 20, 724–734; [Google Scholar]
- 12d. Kumar S., Sharma S., Kansal S. K., Elumalai S., ACS Omega 2020, 5, 2406–2418; [DOI] [PMC free article] [PubMed] [Google Scholar]
- 12e. Wang M., Ye F., Wang H., Yang R., Hua X., ACS Sustainable Chem. Eng. 2020, 8, 3465–3476; [Google Scholar]
- 12f. Meng Q., Yu J., Yang L., Li Y., Xian M., Liu H., Sep. Purif. Technol. 2020, 117728; [Google Scholar]
- 12g. Kruschitz A., Nidetzky B., Green Chem. 2020, 22, 4985–4994; [Google Scholar]
- 12h. Kruschitz A., Nidetzky B., Biotechnol. Adv. 2020, 107568. [DOI] [PubMed] [Google Scholar]
- 13.
- 13a. Barker S., Hatt B., Somers P., Woodbury R., Carbohydr. Res. 1973, 26, 55–64; [Google Scholar]
- 13b. Beneš M. J., Štambergova A., Scouten W. H. in Molecular Interactions in Bioseparations, Springer, 1993, pp. 313–322; [Google Scholar]
- 13c. Vente J. A., Bosch H., de Haan A. B., Bussmann P. J., Adsorpt. Sci. Technol. 2006, 24, 771–780; [Google Scholar]
- 13d. Wang M., Ye F., Wang H., Admassu H., Gasmalla M. A., Hua X., Yang R., Chem. Eng. J. 2019, 370, 1274–1285; [Google Scholar]
- 13e. Li D., Chen Y., Liu Z., Chem. Soc. Rev. 2015, 44, 8097–8123; [DOI] [PubMed] [Google Scholar]
- 13f. Zhu X., Wang M., Hua X., Yao C., Yang R., Chem. Eng. J. 2020, 126751; [Google Scholar]
- 13g. Wang M., Ye F., Wang H., Admassu H., Feng Y., Hua X., Yang R., J. Agric. Food Chem. 2018, 66, 9269–9281. [DOI] [PubMed] [Google Scholar]
- 14. Schroer G., Deischter J., Zensen T., Kraus J., Pöppler A.-C., Qi L., Scott S., Delidovich I., Green Chem. 2020, 22, 550–562. [Google Scholar]
- 15.
- 15a. Lorand J. P., Edwards J. O., J. Org. Chem. 1959, 24, 769–774; [Google Scholar]
- 15b. van den Berg R., Peters J. A., van Bekkum H., Carbohydr. Res. 1994, 253, 1–12; [DOI] [PubMed] [Google Scholar]
- 15c. Evans W., McCourtney E., Carney W., Anal. Biochem. 1979, 95, 383–386. [DOI] [PubMed] [Google Scholar]
- 16. Chu Y., Varanasi P., McGlade M., Varanasi S., J. Appl. Polym. Sci. 1995, 58, 2161–2176. [Google Scholar]
- 17. Gehrke S. H. in Responsive Gels: Volume Transitions II (Ed.: Dušek K.), Springer, Berlin, Heidelberg, 1993, pp. 81–144. [Google Scholar]
- 18.
- 18a.V. Majer, V. Svoboda, J. Pick, Heats of Vaporization of Fluids, Elsevier Science Ltd., 1989;
- 18b. VDI-Wärmeatlas, VDI-Gesellschaft Verfahrenstechnik und Chemieingenieurwesen, Springer, 2005.
- 19. Hoffmann A. K., Thomas W., J. Am. Chem. Soc. 1959, 81, 580–582. [Google Scholar]
- 20. Davankov V., Tsyurupa M., Rogozhin S., Angew. Makromol. Chem. 1976, 53, 19–27. [Google Scholar]
- 21. Matlab 2018a and Global Optimization Toolbox, The MathWorks Inc., Natick Massachusetts, United States, 2018.
- 22. Delidovich I., Palkovits R., Catal. Sci. Technol. 2014, 4, 4322–4329. [Google Scholar]
Associated Data
This section collects any data citations, data availability statements, or supplementary materials included in this article.
Supplementary Materials
As a service to our authors and readers, this journal provides supporting information supplied by the authors. Such materials are peer reviewed and may be re‐organized for online delivery, but are not copy‐edited or typeset. Technical support issues arising from supporting information (other than missing files) should be addressed to the authors.
Supporting Information