

Abstract
Variations in cell wall composition and biomechanical properties can contribute to the cellular plasticity required during complex processes such as polarized growth and elongation in microbial cells. This study utilizes atomic force microscopy (AFM) to map the cell surface topography of fission yeast, Schizosaccharomyces pombe, at the pole regions and to characterize the biophysical properties within these regions under physiological, hydrated conditions. High‐resolution images acquired from AFM topographic scanning reveal decreased surface roughness at the cell poles. Force extension curves acquired by nanoindentation probing with AFM cantilever tips under low applied force revealed increased cell wall deformation and decreased cellular stiffness (cellular spring constant) at cell poles (17 ± 4 mN/m) relative to the main body of the cell that is not undergoing growth and expansion (44 ± 10 mN/m). These findings suggest that the increased deformation and decreased stiffness at regions of polarized growth at fission yeast cell poles provide the plasticity necessary for cellular extension. This study provides a direct biophysical characterization of the S. pombe cell surface by AFM, and it provides a foundation for future investigation of how the surface topography and local nanomechanical properties vary during different cellular processes.
Keywords: AFM, elasticity, pombe, spring constant, stiffness
In this study, the authors utilize atomic force microscopy to evaluate the differential local surface topography and nanomechanical properties of fission yeast at cell pole regions relative to areas not undergoing expansion. They quantify decreased cellular stiffness at the poles, which could account for the plasticity necessary for polarized growth and expansion. These findings provide a foundation for future biophysical analyses of various cellular processes in fission yeast.
Take away
AFM was utilized to provide high‐resolution surface topography mapping of S. pombe cell surface.
Cell poles had decreased cellular stiffness, increased cell wall deformation, and decreased surface rougness compared to the cell body.
1. INTRODUCTION
Fungal cells are surrounded by an exterior cell envelope made up of the cell wall and plasma membrane that provides shape and structure, resistance to internal turgor pressure, and protection from extracellular physical and environmental stresses. Many mechanisms and proteins regulating synthesis and remodeling of the fission yeast, Schizosaccharomyces pombe, cell wall have been characterized through genetic, biochemical, and microscopic studies, but many open questions remain about the biophysical properties of the S. pombe cell wall. The fission yeast cell wall is composed of three major layers: an outer layer of galactomannan; a middle layer of α‐(1,3)‐glucans, β‐(1,3)‐glucans, and β‐(1,6)‐glucans; and an inner layer of galactomannan adjacent to the plasma membrane (Horisberger et al., 1978; Humbel et al., 2001; Kopecka et al., 1995; Sugawara et al., 2004). Despite being firm, providing support, and enabling resistance to forces, the cell wall must also be capable of plasticity and remodeling to enable cellular elongation during polarized growth or septum formation during cell division (Cortes et al., 2016; Ramos et al., 2019). Furthermore, biochemical studies reveal that the fission yeast cell wall glucan composition can differ in certain regions of the cell or throughout the cell cycle (Cortes et al., 2012; Horisberger et al., 1978; Horisberger & Rouvet‐Vauthey, 1985; Humbel et al., 2001; Munoz et al., 2013). This variation in composition at the molecular level could contribute to differences in the cellular biophysical properties, though this has not been directly evaluated. S. pombe is a widely studied model organism for polarized growth, which requires the coordination and integration of cellular signaling pathways, membrane trafficking and vesicle fusion, cytoskeletal organization, and de novo cell wall synthesis (Bendezu & Martin, 2011; Cortes et al., 2005; Feierbach & Chang, 2001; Martin et al., 2005; Martin & Arkowitz, 2014; Rincon et al., 2014; Sawin & Nurse, 1998). Experimental tools that characterize these biophysical components and their spatial and temporal fluctuations can provide valuable insight into the complex mechanisms that regulate polarized cellular growth.
Atomic force microscopy (AFM) is a scanning probe spectroscopy technique that utilizes a cantilever tip under near‐physiological conditions to map surfaces at nanoscale resolution and investigate their mechanical properties through nanoindentation of the cellular exterior (Alessandrini & Facci, 2005; Dufrene, 2002; Dufrene et al., 2017; Goss & Volle, 2019; Hansma et al., 1994; Horber & Miles, 2003). The pressure of the cantilever tip upon the cell surface under low applied force yields a force versus indentation curve that can provide a wealth of information about cellular biophysical parameters (Burks et al., 2003; Pelling et al., 2004; Velegol & Logan, 2002; Volle et al., 2008). A variety of indirect measurements or computational approaches have previously been implemented to model the mechanical properties of fission yeast cells (Abenza et al., 2015; Atilgan et al., 2015; Davi et al., 2018; Minc et al., 2009), but prior utilization of AFM in S. pombe has not expanded beyond mapping cell surface topography or evaluating ligand–receptor adhesion (Adya et al., 2006; Canetta et al., 2006; Canetta et al., 2009; Ishijima et al., 1999; Sasuga et al., 2012). To date, no direct quantification of S. pombe cell wall biophysical properties has been experimentally measured. AFM has been employed much more widely in the direct biophysical characterization of budding yeast, Saccharomyces cerevisiae, cell wall mechanical properties such as stiffness, elasticity, turgor pressure, and thickness leading to an enhanced understanding of how the cell wall and cellular turgor pressure differ during a variety of cellular processes and in response to environmental stressors (Alsteens et al., 2008; Dague et al., 2010; Dupres et al., 2010; Pelling et al., 2004; Touhami et al., 2003).
This study utilizes AFM contact mode scanning to generate high resolution images of the S. pombe cell surface topography and force extension curves generated from nanoindentation to quantify the cell wall elasticity and cellular spring constant. These biophysical components were then evaluated at the fission yeast cell body or cell pole to determine whether regions undergoing polarized growth have different mechanical properties. Regions at cell poles had decreased surface roughness, increased cell wall elasticity, and decreased cellular stiffness relative to the cell body where no active growth or expansion can occur. These findings provide a nanomechanical characterization of fission yeast by AFM that serves as the foundation for future scanning probe spectroscopic studies to advance the analyses of polarized growth, cell wall biogenesis, and cellular response to environmental changes.
2. MATERIALS AND METHODS
2.1. Preparation of dishes for cell adhesion
Plastic 50 × 9 mm petri dishes (Corning Inc., Corning, NY) were prepared for yeast cell adhesion by plasma cleaning for 3 min with PDC‐32G plasma cleaner (Harrick Plasma, Ithaca, NY). Plates were then incubated for 48 h at 4°C with 0.8 mg/mL CellTak adhesive (Corning Life Sciences, Glendale, AZ) diluted in 0.1‐M NaHCO3. Treated dishes were washed twice with ddH2O to remove excess CellTak and allowed to air dry for 5 min prior to plating cells.
2.2. Strains, growth conditions, and plating fission yeast cells for AFM
S. pombe strains used in this study are provided in Table S1. Cells were cultured in YE5S medium (Appendix A) at 25°C in mid‐log phase (OD595 < 0.6) for 36 h on a rotary wheel prior to microscopic studies. Cells for AFM imaging and analysis were centrifuged at 500 × g for 2 min and washed twice with EMM5S growth media prior to plating on CellTak treated plastic dishes; 200‐μL suspension of washed cells was added to treated dish and centrifuged at 500 × g for 20 s using a swinging bucket rotor. Dishes were washed with EMM5S (Appendix B) three times to remove nonadherent cells, and remaining cells were incubated in 100‐μL EMM5S for imaging. Preliminary experiments testing different AFM buffers also utilized HEPES (0.1‐mM HEPES, 0.01‐mM CaCl2, 0.001‐mM MgCl2, pH 7.0) or sodium acetate (18‐mM sodium acetate, 1‐mM CaCl2, 1‐mM MnCl2, pH 5.2) buffers. All imaging experiments were conducted within 90 min of adhering cells.
For imaging and analysis of cell poles by AFM, overnight liquid cultured cells were centrifuged at 500 × g for 2 min and washed twice with EMM5S medium. A 5‐μm pore diameter polycarbonate isopore membrane filter (~22‐μm thickness) (Millipore, Burlington, MA) was stacked on top of a 0.2‐μm membrane (Pall Corp, New York, NY), and both membranes were placed in a polysulfone bottle top filter (Thermo Fisher, Waltham, MA). The cell suspension was added to the membranes, and low vacuum suction was briefly applied to draw cells into membrane wells. Membranes were removed, and excess cells were washed away with EMM5S. The membrane containing cells was cut into 2 × 2 cm squares, adhered to a glass slide using double‐sided tape, further secured to the slide using paraffin wax, and incubated in 100‐μL EMM5S media for imaging.
2.3. AFM imaging and analysis
Topographical height and deflection images were obtained in scanning contact mode using an MFP‐3D AFM (Asylum Research, Santa Barbara, CA). Silicon nitride AFM pyramidal tip PNP‐TR probes (Nanoworld, Neuchatel, Switzerland) with a nominal tip radius of <10 nm and nominal spring constant of 0.32 N/m were used for all experiments. The cantilever spring constant (k cantilever) was experimentally calculated using the thermal tuning method (Hutter & Bechhoefer, 1993) prior to each experiment through the MFP‐3D software. Cells were incubated in EMM5S media throughout AFM imaging and analysis to prevent dehydration. Two‐dimensional (2D) images were exported from MFP‐3D software, and scale bars were added using NIH Image J. Following topographical imaging, force measurements were obtained from yeast cells at designated locations along the apex of curvature of the cell body or at the cell pole at a deflection set point of 4 nN to minimize damage to the cell surface. Spring constants (k cell) were calculated from the linear region of force extension curves using a two‐spring model with the equation:
| (1) |
where the slope of the linear region is the k effective and k cantilever was determined through cantilever calibration (Burks et al., 2003; Pelling et al., 2004; Velegol & Logan, 2002; Volle et al., 2008). The nonlinear region of force extension curves was analyzed by separately measuring the change in force and distance. Data processing and analysis for both regions of the extension force curves were performed using the Asylum Igor Pro MFP‐3D software. Measurement of surface peak height and roughness was determined from 2‐D exported height retrace images using NIH Image J with plugin SurfCharJ 1q to calculate root mean square values (Chinga et al., 2007).
Young's elasticity moduli were calculated from AFM extension curves by the Asylum Igor Pro MFP‐3D software using the Hertz model equation (Touhami et al., 2003; Zemła et al., 2020):
| (2) |
where F is the applied force, δ is the resulting indentation depth, E is the Young's modulus, and θ is the half‐opening angle (35° from manufacturer) (Figure S2). Notably, we used a sample Poisson of 0.03 in these calculations as this value was utilized in prior S. pombe elasticity modeling (Abenza et al., 2015; Atilgan et al., 2015; Davi et al., 2018). Modeling with the Poisson value of 0.5 commonly used for soft biological materials (Guz et al., 2014; Touhami et al., 2003) resulted in 25% lower Young's moduli (Figure S3).
3. RESULTS AND DISCUSSION
3.1. Visualization of fission yeast cells by topography mapping
AFM contact mode scanning was used to evaluate the high‐resolution topography of wildtype S. pombe cells adhered to plastic dishes. All AFM scanning and analysis was conducted in fission yeast minimal growth media (EMM5S) to maintain cell hydration and ensure cell viability. No differences in the biophysical properties of fission yeast were observed based on buffers used during imaging or the duration of incubation in EMM5S prior to analysis (Figure S1). At scan sizes of 10 μm, deflection retrace images from contact mode scanning along the surface of cells (at <1‐nN applied force) reveal the surface topography along the length of fission yeast cells, including the presence of a fission scar from completion of a previous division with a new cell pole (Figure 1a, asterisk represents division fission scar). A height retrace image of the same cell (Figure 1b) provided cellular elevation data that were used to generate a 3‐D reconstruction of the cell revealing that the peak height is 2.24 μm above the surface of the dish (Figure 1c). The height retrace image was also used for determining the optimal regions of the cell along the apex of cell curvature for taking force measurements (Figure 1b, red +) to determine the biophysical properties of the cell surface (Arfsten et al., 2010).
FIGURE 1.

Atomic force microscopy (AFM) topographical scanning of wildtype Schizosaccharomyces pombe cells. AFM (a) deflection retrace image and (b) height retrace image of a representative wildtype cell acquired in contact scanning mode at 0.35 Hz at applied force of <1 nN. Scale bar for (a,b) is 2 μm. Asterisk in (a) represents division fission scar. Red boxed region in (b) indicates 1 × 1 μm area rescanned for higher resolution shown in (d–f). Red “+” indicates points sampled for force extension curves. (c) 3‐D topography image of wildtype cell with heat map height scale ranging from 0 to 2.24 μm. (d) Deflection retrace image and (e) height retrace image of 1 × 1 μm region of interest acquired in contact scanning mode showing high resolution wildtype cell surface topography. Scale bar for (d–e) is 0.25 μm. (f) 3‐D topography image of 1 × 1 μm region from wildtype cell with heat map height scale from 0 to 178 nm [Colour figure can be viewed at wileyonlinelibrary.com]
To gain further structural insight into the fission yeast cell wall topography at high‐level resolution, a 1 × 1 μm region of interest was designated for additional contact mode scanning (Figure 1b, red box). The deflection retrace image (Figure 1d) of this area reveals nonuniform ridges in the cell wall that could represent unequal deposition or accumulation of cell wall components. This visualization of surface topography achieved by AFM scanning of live cells without fixation is comparable with other high‐resolution fixed imaging approaches such as transmission and scanning electron microscopy (Osumi et al., 1998; Sipiczki, 2016). Furthermore, these images indicate that this cell surface topography is not an artifact of fixation or air drying but instead represents native structures on the fission yeast cell surface. Analysis of height retrace images (Figure 1e) and 3‐D reconstructions of the cell surface (Figure 1f) from 10 cells reveals that these ridges extend up to 40 ± 11 nm from the average cell surface level with a calculated surface roughness (root mean square deviation) of 14 ± 3 nm (Table 1). These roughness calculations for fission yeast cells maintained in an aqueous, nonstressed environment during analysis in this study are significantly lower than AFM cell surface roughness calculations for S. pombe cells in prior studies following dehydration (69.9 ± 5.5 nm) or exposure to osmotic, thermal, ethanol, or oxidative stress (Adya et al., 2006; Canetta et al., 2006; Canetta et al., 2009). The fission yeast surface roughness is greater than AFM values reported for S. cerevisiae (~1–2 nm) or C. albicans (8.2 ± 2 nm), indicating that the S. pombe cell surface is less smooth, perhaps due to differences in cell wall composition (Ahimou et al., 2003; Alsteens et al., 2008; Dague et al., 2010; Hasim et al., 2017).
TABLE 1.
Schizosaccharomyces pombe cell surface roughness and biophysical properties
| Strain and sampling location | Roughness: RMS deviation (nm) | Highest peak (nm) | Cell wall elasticity: ∆distance (nm) | Cell wall elasticity: ∆force (nN) | Cellular spring constant (mN/m) | Young's modulus (MPa) |
|---|---|---|---|---|---|---|
| Wildtype: cell body | 14 ± 3 | 40 ± 11 | 65 ± 24 | 1.0 ± 0.3 | 44 ± 10 | 1.3 ± 0.5 |
| cdc25‐22: cell body | 13 ± 4 | 37 ± 11 | 79 ± 17 | 1.1 ± 0.3 | 40 ± 7 | 1.4 ± 0.4 |
| cdc25‐22: cell pole | 8 ± 3 | 16 ± 2 | 156 ± 26 | 1.4 ± 0.3 | 17 ± 4 | 0.5 ± 0.1 |
Note: n > 10 cells evaluated for each condition.
Abbreviation: RMS, root mean square.
3.2. Determining biophysical properties of fission yeast cells from force extension curves
After scanning the topography of the fission yeast cell wall, sites along the surface were designated for generating force curves by probing the cell with the AFM cantilever tip to determine biophysical properties of wildtype S. pombe cells. For each cell evaluated, a minimum of 100 force curves were generated at 10 different points (spaced ~0.5 μm apart) along the length of the cell (Figure 1b, red +). The extension force curves consist of the approach of the cantilever toward the surface (Figure 2a; horizontal linear region between −200 to 0 nm), the initial contact between the surface and the cantilever tip at low applied force (Figure 2a; nonlinear region beginning at 0 nm), and the indentation of the surface at higher applied force (Figure 2a; linear region of the curve). The nonlinear region of the extension curve indicates the elasticity (∆force and ∆distance) of the cell wall as it is compressed by the cantilever, whereas the linear region of the extension curve is used to determine the cellular spring constant and is related to the cellular turgor pressure providing greater resistive force to the cantilever (Arfsten et al., 2010; Arnoldi et al., 2000; Volle et al., 2008). As expected, the nonlinear region of the extension curves of wildtype cells (∆force: 1.0 ± 0.3 nN; ∆distance: 65 ± 24 nm) was significantly greater than the nonlinear region of the dish surface (∆force: 0.6 ± 0.1 nN; ∆distance: 23 ± 12 nm) indicating that the wildtype cell wall is more compressible and elastic than the solid dish surface coated with CellTak (Figure 2b; Table 1). Notably, prior ultrastructural electron microscopy imaging revealed the thickness of the outermost galactomannan layer of the fission yeast cell wall was approximately 60–70 nm (Cortes et al., 2012; Osumi et al., 1998; Osumi et al., 2006), which suggests that the initial indentation observed in the nonlinear region of these AFM force extension curves could correlate to compression of this outermost galactomannan layer prior to encountering increased resistance from the inner α‐ and β‐glucan layer and cellular turgor pressure.
FIGURE 2.

Characterization of wildtype Schizosaccharomyces pombe cell wall elasticity and cellular stiffness. (a) Representative force extension curves with 4‐nN trigger point taken on the dish surface (black) or wildtype cells (gray) adhered to a plastic petri dish. The horizontal linear region of each curve extending from −200 to 0 nm reflects the cantilever approaching the surface, and the 0‐nm point on the x‐axis indicates the point of tip contact with the surface. The initial nonlinear deflection of the force extension curve reflects the indentation of the cell wall upon initial contact, which is measured by ∆f (change in force in nN) and ∆d (change in distance in nm). The later linear deflection of the force extension curve indicates the cellular stiffness, which is related to the internal turgor pressure of the cell. (b) Plot of the elasticity (∆force vs. ∆distance) from the dish surface (black, circle) and wildtype S. pombe cell wall (gray, square) calculated from the nonlinear region of extension force curves. (Error bars indicate SD; n > 100 force curves evaluated for each surface type on >10 different dishes or cells; two asterisks indicate p < 1e‐10 determined by single factor analysis of variance [ANOVA] and paired Student's t test). (c) Box‐and‐whisker plot of the wildtype cellular spring constant (k cell) calculated from the linear region of force extension curves acquired from points at the apex of cellular curvature along the length of the cell body (as determined by the AFM height retrace topography image). The boxed region indicates the upper and lower quartiles for each data set; the median is indicated by the horizontal line within the box; the mean is indicated by an “x”; whiskers extend to high and low data points; outliers are shown as individual data points. (n > 1000 force measurements from 10 wildtype cells) [Colour figure can be viewed at wileyonlinelibrary.com]
The slope of the linear region of force extension curves was used to calculate spring constants for the dish and wildtype cell surface using Equation 1 and the experimentally determined spring constant of the cantilever. The wildtype cellular spring constant (k cell) of the S. pombe cell body was 44 ± 10 mN/m (Figure 2c; Table 1). This k cell is comparable with AFM measurements from other fungi including Aspergillus nidulans hyphae (k cell of 29 ± 2 mN/m) and Candida albicans (k cell of 51 ± 9 mN/m) (El‐Kirat‐Chatel et al., 2013; Zhao et al., 2005). AFM measurements of S. cerevisiae spring constants vary widely (15–700 mN/m) depending on the region of the cell evaluated and experimental conditions utilized, but cells characterized using methodologies and conditions most similar to those in this study yielded a k cell of 60 ± 25 mN/m (Arfsten et al., 2010; Pelling et al., 2004). Prior analyses of the S. pombe cell wall composition show the absence of chitin in the cell wall of vegetative cells, in contrast to S. cerevisiae, which could account for the lower k cell observed in the fission yeast cell wall relative to budding yeast (Arellano et al., 2000; Dallies et al., 1998; Martin‐Garcia et al., 2003; Sietsma & Wessels, 1990). Taken together, this evaluation of the fission yeast cell wall body by AFM reveals the previously uncharacterized biophysical properties of wildtype S. pombe cell wall elasticity and cellular stiffness.
3.3. Biophysical characterization of the cell pole from force extension curves
Fission yeast cells utilize polarity signaling pathways, cytoskeletal alignment, and de novo glucan synthesis to promote polarized vegetative growth through extension at cell poles (Arellano et al., 2000; Chiou et al., 2017; Cortes et al., 2012; Martin et al., 2005; Mitchison & Nurse, 1985; Munoz et al., 2013; Verde et al., 1995). The biophysical properties at these regions of active growth were evaluated to characterize differences in cell wall elasticity and/or cellular stiffness relative to the cell body where no extension or growth occurs. First, cells adhered to plastic dishes were imaged by AFM in contact scanning mode. Deflection and height retrace images were used to identify cells tips through the characteristic presence of the residual fission scar from a prior division with a newly protruding pole (Figure 3a, asterisk). The area at the cell pole was then designated as the region of interest for force mapping (Figure 3b, red box) to determine whether there were submicrometer scale local differences in the nanomechanical cellular properties at the pole. The three‐dimensional representation of this cell illustrates the topography at the pole (Figure 3c). Force mapping enabled the acquisition of 2000 force extension curves within a 2.5 × 3.0 μm region (divided into a 40 × 50 grid). Spring constants (k cell) were calculated from each force extension curve and plotted within the 40 × 50 grid to determine variations in cellular stiffness at different regions within the cell pole (Figure 3d). k cell values acquired from the area of the cell surface (as opposed to the dish) were plotted in a color‐coded surface rendering for better visualization (Figure 3e), which revealed a gradient from low k cell values (0–20 mN/m) at the apex of the cell pole to higher k cell values (60–80 mN/m) at regions further from the tip and closer to the remnant of cell wall that forms the fission scar.
FIGURE 3.

Schizosaccharomyces pombe cells adhered to dishes have decreased cellular stiffness at cell poles. Atomic force microscopy (a) deflection retrace image and (b) height retrace image of wildtype cell acquired in contact scanning mode at 0.35 Hz at applied force of <1 nN. Scale bar for (a,b) is 1 μm. Asterisk in (a) represents division fission scar. Red boxed region in (b) indicates 2.5 × 3 μm area used for generating force map shown in (d). (c) 3‐D topography image of wildtype cell with heat map height scale ranging from 0 to 2.96 μm provided. (d) Force map of spring constant (k cell) values calculated from individual force extension curves acquired within the 2.5 × 3 μm region of interest (50 × 40 grid) at wildtype cell pole. Heat map of k cell values ranging from 0 to 100 mN/nm provided. Red, orange, yellow, green, blue, and purple labels indicate locations of zones at cell pole evaluated in (f,g). (e) 3‐D color‐coded surface rendering of k cell values calculated from force extension curves on the wildtype cell pole force map shown in (d). (f,g) Measurements calculated from force extension curves were binned into 250‐nm zones (starting at the apex of the cell pole and moving progressively further away from the tip toward the fission scar) and averaged for each zone. (f) Plot of the surface elasticity (∆force vs. ∆distance) calculated from the nonlinear portion of force extension curves from each zone of the cell pole. (Error bars indicate SD; n > 20 force curves evaluated for each zone; one asterisk indicates p < 1e‐5 determined by single factor analysis of variance [ANOVA] and paired Student's t test). (g) k cell calculated from force extension curves was binned and averaged for each zone. Box‐and‐whisker plots for k cell from each zone. The boxed region indicates the upper and lower quartiles; the median is indicated by the horizontal line within the box; the mean is indicated by an “x”; whiskers extend to high and low data points; outliers are shown as individual data points. For (f,g), the most apical zone of the cell pole 0–250 nm (red); 250–500 nm (orange); 500–750 nm (yellow); 750 nm–1 μm (green); 1.0–1.25 μm (blue); 1.25–1.5 μm (purple). (n > 100 force curves evaluated for each zone; two asterisks indicate p < 1e‐10, one asterisk indicates p < 1e‐5 by single factor ANOVA and paired Student's t test) [Colour figure can be viewed at wileyonlinelibrary.com]
The cell pole was binned into 250‐nm zones starting with the region closest to the pole apex and moving inward toward the fission remnant (Figure 3d, color bar inset), and the mean ∆force/∆distance and k cell were calculated within each zone. The elasticity in the outermost 0‐ to 250‐nm region of the cell pole was greatest (∆force: 2.5 ± 0.5 nN; ∆distance: 225 ± 29 nm; Figure 3f, red, Table 2) and decreased in regions further from the cell tip apex (Figure 3f, Table 2). The outermost 0‐ to 250‐nm zone mean k cell was significantly lower (15 ± 5 mN/m; Figure 3g, red, Table 2) than all other regions measured, indicating this region had decreased stiffness relative to the rest of the cell pole. The next outermost zone (250–500 nm; Figure 3g, orange, Table 2) k cell increased to 26 ± 8 mN/m, which was significantly less than the stiffness of the 500‐ to 750‐nm region k cell (36 ± 9 mN/m; Figure 3g, yellow, Table 2). As measurements continued inward away from the pole, mean k cell values continued to increase in the 750‐nm to 1‐μm zone (43 ± 12 mN/m; Figure 3g, green, Table 2) before leveling off with no significant difference between the 1‐ to 1.25‐μm zone (49 ± 15 mN/m; Figure 3g, blue, Table 2) and the 1.25‐ to 1.5‐μm zone (49 ± 13 mN/m; Figure 3g, purple, Table 2). This suggests that regions of the cell pole have the lowest cellular stiffness and greatest elasticity and that stiffness increases further away from the apex of the cell pole. This is consistent with the need for greater flexibility and reduced rigidity at the pole as cellular extension occurs. These findings also reveal nanometer‐scale differences within zones of the cell pole that could reflect progressive maturation of the cell wall as glucans are remodeled and cross‐linked to provide increased stiffness along the cell shaft (de Medina‐Redondo et al., 2010). Prior AFM characterization of S. cerevisiae lacking cell wall remodeling or cross‐linking enzymes indicates decreased overall stiffness (Dague et al., 2010). How homologous enzymes contribute to the biophysical properties of the fission yeast cell wall is an area of future investigation.
TABLE 2.
Schizosaccharomyces pombe wildtype cell pole surface elasticity and stiffness
| Sampling location | Cell wall elasticity: ∆distance (nm) | Cell wall elasticity: ∆force (nN) | Cellular spring constant (mN/m) |
|---|---|---|---|
| 0–250 nm | 255 ± 29 | 2.5 ± 0.5 | 15 ± 5 |
| 250–500 nm | 190 ± 32 | 1.9 ± 0.3 | 26 ± 8 |
| 500–750 nm | 157 ± 16 | 1.6 ± 0.2 | 36 ± 9 |
| 750 nm–1 μm | 123 ± 9 | 1.3 ± 0.1 | 43 ± 12 |
| 1–1.25 μm | 95 ± 13 | 1.1 ± 0.1 | 49 ± 15 |
| 1.25–1.5 μm | 77 ± 8 | 1.0 ± 0.2 | 49 ± 13 |
Note: n > 20 (for cell elasticity: ∆distance and ∆force) and n > 100 (for cellular spring constant) force curves evaluated for each 250‐nm zone.
Notably, previous AFM studies of rod‐ and round‐shaped microorganisms have shown variation of k cell values dependent upon the distance at which measurements were taken relative to the apex of curvature of the cell, with a decreased k cell at periphery zones, likely due to differences in the relative applied load acting on the cantilever tip (Arfsten et al., 2010; Gaboriaud et al., 2008). Therefore, we immobilized fission yeast cells vertically in 5‐μm diameter well polycarbonate isopore membrane filters to enable force measurements at the cell pole apex of curvature. Wildtype S. pombe cells grow to an approximate length of 14 μm prior to dividing (Mitchison, 1957; Mitchison & Nurse, 1985; Moseley et al., 2009), which prevented AFM imaging of the cell pole due to the thickness of polycarbonate membrane filters (~22 μm) (note: this is why wildtype cell pole measurements are not included in Table 1). Therefore, we utilized cdc25‐22 cell cycle mutants that grow to approximately 21 μm prior to division due to delayed signaling for the onset of mitosis (Moseley et al., 2009; Nurse & Bissett, 1981; Thuriaux et al., 1978). This enabled the poles of these mutant cells to be imaged and probed while immobilized within the membrane filter wells (Figure 4a,b).
FIGURE 4.
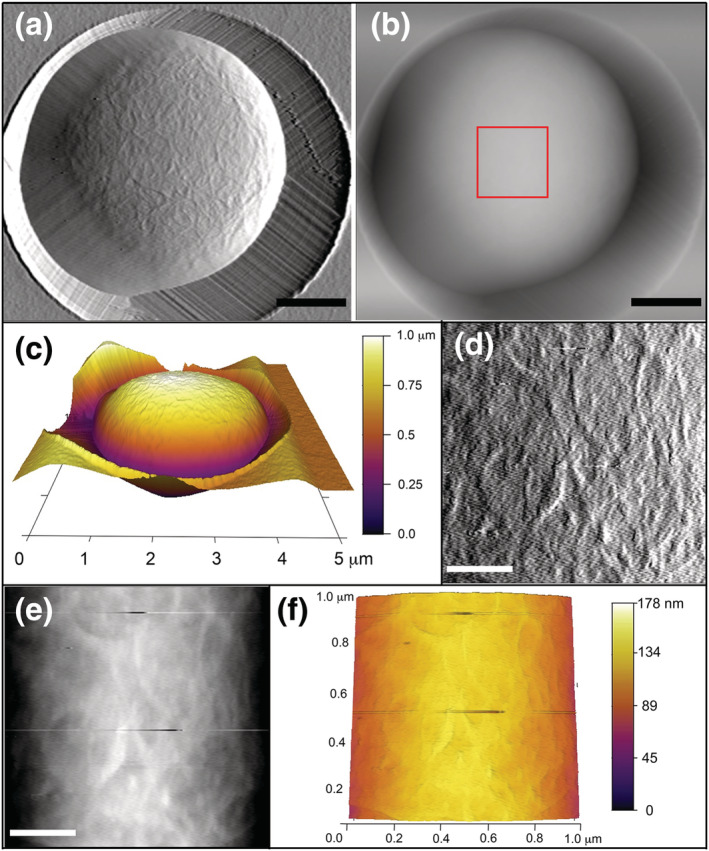
High resolution topographical scanning of Schizosaccharomyces pombe cell pole oriented vertically in a well. Atomic force microscopy (a) deflection retrace image and (b) height retrace image of cdc25‐22 cell immobilized within a 5‐μm diameter pore in a polycarbonate membrane filter. Topographical scans acquired using contact scanning mode at 0.75 Hz and applied force of <1 nN. Scale bar for (a,b) is 1 μm. Red boxed region in (b) indicates 1 × 1 μm area rescanned for higher resolution shown in (d,f). (c) 3‐D topography image of cdc25‐22 cell within 5‐μm membrane pore with heat map height scale ranging from 0 to 1.0 μm. (d) Deflection retrace image and (e) height retrace image of 1 × 1 μm region acquired in contact scanning mode showing high resolution cell pole topography. Scale bar for (d,e) is 0.25 μm. (f) 3‐D topography image of 1 × 1 μm region from cdc25‐22 cell with heat map height scale from 0 to 178 nm [Colour figure can be viewed at wileyonlinelibrary.com]
Deflection retrace images from contact mode scanning of cdc25‐22 fission yeast cells immobilized within polycarbonate membrane filters provide cell pole surface topography (Figure 4a). The height retrace image of this same cell (Figure 4b) was used to generate a 3‐D reconstruction of the cell pole inside the 5‐μm well with the cell pole extending slightly above the polycarbonate membrane (Figure 4c). The height retrace was also utilized to designate a 1 × 1 μm region at the apex of the cell pole curvature for high‐resolution scanning in contact mode (Figure 4b, red box). The deflection retrace image (Figure 4d) of this area has nonuniform cell wall ridges (also seen in the height retrace and 3‐D reconstruction [Figure 4e,f]) that are comparable in structure with those observed in the wildtype cell body (Figure 1d). However, the highest peak (16 ± 2 nm) and surface roughness calculated at the cdc25‐22 cell pole (8 ± 3 nm) was lower than either wildtype or cdc25‐22 cell body highest peak or roughness values (Table 1), indicating that the cell surface at the pole is flatter. This decreased elevation and roughness could be due to ongoing cell wall remodeling and restructuring at the pole. Despite the genetic differences, the biophysical characteristics as measured by AFM for the cell body of cdc25‐22 cells were similar to the wildtype cell body with comparable force extension curves (Figure 5a; wildtype—gray, cdc25‐22—red), ∆force (wildtype: 1.0 ± 0.3 nN; cdc25‐22: 1.1 ± 0.3 nN), ∆distance (wildtype: 65 ± 24 nm, cdc25‐22: 79 ± 17 nm) (Figure 5b), and spring constant (wildtype k cell: 44 ± 10 mN/m, cdc25‐22: 40 ± 7 mN/m) (Figure 5c, Table 1).
FIGURE 5.

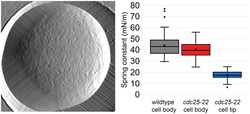
Schizosaccharomyces pombe cell poles have decreased cellular stiffness. (a) Representative force extension curves with 4‐nN trigger point taken on the plastic dish surface (black), wildtype cell body (gray), cdc25‐22 cell body (red), or cdc25‐22 cell pole (blue). (b) Plot of the surface elasticity (∆force vs. ∆distance) from the plastic dish (black, circle), wildtype S. pombe cell body (gray, square), cdc25‐22 cell body (red, triangle), or cdc25‐22 cell pole (blue, diamond) calculated from the nonlinear portion of force extension curves. (Error bars indicate SD; n > 100 force curves evaluated for each surface type on >10 different dishes or cells per condition). (c) Box‐and‐whisker plot of k cell calculated from the linear region of force extension curves from wildtype cell body (gray), cdc25‐22 cell body (red), or cdc25‐22 cell pole (blue). (n > 100 force measurements from 10 cells per condition). (d) Box‐and‐whisker plot of Young's modulus of elasticity calculated by the Hertz model (using sample Poisson of 0.03) from cellular spring constants of wildtype cell body (gray), cdc25‐22 cell body (red), or cdc25‐22 cell pole (blue). For all box‐and‐whisker plots (c,d), the boxed region indicates the upper and lower quartiles for each data set; the median is indicated by the horizontal line within the box; the mean is indicated by an “x”; whiskers extend to high and low data points; outliers are shown as individual data points. (n > 100 force measurements from 10 cells per condition). For all graphs (b–d), two asterisks indicate p < 1e‐10, and one asterisk indicates p < 1e‐5 determined by single factor analysis of variance (ANOVA) and Student's t test [Colour figure can be viewed at wileyonlinelibrary.com]
Force maps were generated from 900 force extension curves taken within 1 × 1 μm regions of interest (divided into a 30 × 30 grid) on the cell pole of immobilized cdc25‐22 cells in wells of polycarbonate membrane filters or the cell body of cdc25‐22 cells adhered to plastic dishes with CellTak adhesive. A representative force extension curve for the cdc25‐22 cell pole (Figure 5a) reveals a larger nonlinear region with a significantly greater mean ∆force (1.4 ± 0.3 nN) and ∆distance (156 ± 26 nm) than the cdc25‐22 cell body (∆force: 1.1 ± 0.3 nN; ∆distance: 79 ± 17 nm) or wildtype cell body (∆force: 1.0 ± 0.3 nN; ∆distance: 65 ± 24 nm) (Figure 5b, Table 1). This suggests that the cell wall is more compressible and elastic at the pole than along the body where cellular growth and elongation are not occurring.
The slope of the linear region of force extension curves from cdc25‐22 cell poles was decreased relative to the wildtype or cdc25‐22 cell body (Figure 5a), and the k cell of cdc25‐22 cell poles was significantly lower (17 ± 4 mN/m) than the cdc25‐22 cell body (40 ± 7 mN/m) or wildtype cell body (44 ± 10 mN/m) (Figure 5c). The k cell for cdc25‐22 cell poles immobilized in wells of polycarbonate membrane filters was not significantly different from the spring constant observed in the outermost 250‐nm bin of the force map acquired by probing wildtype cells adhered to a plastic dish with CellTak (Figure 3g, red). This suggests that the potential impact of differences in the relative applied load at the cell periphery during probing with the AFM cantilever was minimal in this study and that wildtype cell poles exhibit a decrease in stiffness relative to the cell body.
Prior AFM studies in other microorganisms have applied Hertz modeling to calculate a Young's modulus of cellular elasticity from local force extension curves and spring constants, though the applicability of this approach for microbial surfaces and how the resulting values can be compared with other measurements of elasticity moduli (such as those derived from whole cell compression experiments) is unclear and might require more complex finite element modeling (Arfsten et al., 2010; Gaboriaud & Dufrene, 2007; Mercade‐Prieto et al., 2013). However, to compare the biophysical measurements presented in this study with elasticity measurements from other fungi, we utilized the Hertz model (Equation 2) to calculate Young's moduli from the force extension curves of wildtype and cdc25‐22 S. pombe cells (Figure S2). The Young's modulus of the wildtype cell body was 1.3 ± 0.5 MPa, with the variation likely to due to local differences along the heterogenous surface of the cell (Figure 5d, Table 1). This value is consistent with estimates of the S. pombe internal turgor pressure that range from 1 to 1.5 MPa obtained by indirect methods of measurement or computational modeling (Abenza et al., 2015; Atilgan et al., 2015; Davi et al., 2018; Minc et al., 2009). Likewise, this value is similar to Young's moduli (0.7–1.6 MPa) reported for S. cerevisiae cells when calculated by Hertz modeling of AFM force extension curves (Alsteens et al., 2008; Dague et al., 2010; Pelling et al., 2004). The cdc25‐22 cell tip had a lower Young's modulus of 0.5 ± 0.1 MPa, consistent with increased elasticity in this region (Figure 5d, Table 1). However, this does not reflect decreased turgor pressure at the cell pole, as the cell wall in this region is undergoing remodeling and maturation, which could contribute to the lower observed value. Further evaluation of fluctuations in the Young's modulus of S. pombe cells in response to factors such as osmotic stress is necessary to provide additional insight into the utility of AFM force extension analysis as a tool for measuring the cellular turgor pressure in fission yeast.
This characterization of the relative biophysical properties of the S. pombe cell body and cell pole indicates that areas of the cell poles have increased cell wall elasticity and decreased cellular stiffness. This study lays the groundwork for advancing high‐resolution and quantitative analyses of the impact of various regulatory signaling pathways on cell wall elasticity during polarized cellular elongation and growth, characterizing components involved in polarized membrane trafficking during cell expansion, or evaluating the relative contributions of various cell wall glucan synthases and cross‐linking enzymes to establishing cell wall stiffness, all of which have historically been vital areas of research in the model organism S. pombe. Furthermore, this approach can be extended to studying polarized cell growth at the site of division during cytokinesis in fission yeast and determining how regulatory signaling pathways or cell wall synthase localization and activation contribute to new cell wall synthesis in this region. Additionally, using AFM to calculate the cellular spring constant (k cell) and measure changes in cellular turgor pressure can be implemented in evaluating how fission yeast cells respond to environmental changes and provide new insights into the signaling pathways involved.
CONFLICT OF INTEREST
The authors declare no conflicts of interest.
Supporting information
Figure S1. Comparison of S. pombe cellular stiffness in different imaging buffers
Wildtype S. pombe cells were incubated in 0.1 mM HEPES buffer, EMM5S fission yeast growth media, or 18 mM sodium acetate buffer during AFM imaging and probing, or with EMM5s media for 18 hours prior to and during AFM imaging and probing. Box‐and‐whisker plots of the cellular spring constants were calculated from the linear region of force extension curves for each condition. The boxed region indicates the upper and lower quartiles for each data set; the median is indicated by the horizontal line within the box; the mean is indicated by an ‘x’; whiskers extend to high and low data points; outliers are shown as individual data points. (n > 500 force measurements from 5 cells under each condition).
Figure S2. Hertz model fitting of S. pombe force extension curves to obtain Young's moduli for cell body and cell tip.
Representative force extension curves with 4nN trigger point taken from cdc25‐22 cell body (red) or cdc25‐22 cell tip (blue) were fit with the Hertz model to calculate Young's elasticity moduli at a sample Poisson of 0.03. Model fits are shown for each representative curve as a dashed line.
Figure S3. Calculation of Young's modulus for S. pombe cells using Hertz modeling with sample Poisson value of 0.5
Box‐and‐whisker plot of Young's modulus of elasticity calculated by the Hertz model (using sample Poisson of 0.5, rather than 0.03 shown in Figure 5D) from cellular spring constants of wildtype cell body (gray), cdc25‐22 cell body (red), or cdc25‐22 cell pole (blue). The boxed region indicates the upper and lower quartiles for each data set; the median is indicated by the horizontal line within the box; the mean is indicated by an ‘x’; whiskers extend to high and low data points; outliers are shown as individual data points. (n > 100 force measurements from 10 cells per condition). Two asterisks indicate p < 1e‐10, determined by single factor ANOVA and student t‐test.
Supporting Information Figure Legends
Table S1: S. pombe strains used in this study
ACKNOWLEDGMENTS
The authors wish to thank Dr. Catherine Volle, Dr. Megan Nunez, Dr. Eric Darling, Dr. Qian Chen, and Dr. James Moseley for review and feedback on the manuscript. This work was supported by a National Science Foundation Major Research Instrumentation grant (number DBI1528288).
Appendix A. YEAST EXTRACT SUPPLEMENTED (YE5S)—PER 1 L
(From Nurse Lab Fission Yeast Handbook)
| 5 g | 0.5% (w/v) | Yeast extract (BD Difco, Franklin Lakes, NJ) |
| 30 g | 3.0% (w/v) | Glucose |
| 0.225 mg | Adenine | |
| 0.225 mg | Histidine | |
| 0.225 mg | Leucine | |
| 0.225 mg | Uracil | |
| 0.225 mg | Lysine hydrochloride |
Appendix B. EDINBURGH MINIMAL MEDIUM SUPPLEMENTED (EMM5S)—PER 1 L
(From Nurse Lab Fission Yeast Handbook)
| 3 g | 14.7 mM | Potassium hydrogen phthallate | |
| 2.2 g | 15.5 mM | Na2HPO4 | |
| 5 g | 93.5 mM | NH4Cl | |
| 2% (w/v) | 111 mM | Glucose | |
| 20 mL | Salt solution | ||
| 0.26 M | MgCL2•6H2O | ||
| 4.99 mM | CaCl2•2H2O | ||
| 0.67 M | KCl | ||
| 1 mM | Na2SO4 | ||
| 1 mL | Vitamins solution | ||
| 4.2 mM | Pantothenic acid | ||
| 81.2 mM | Nicotinic acid | ||
| 55.5 mM | Inositol | ||
| 40.8 μM | Biotin | ||
| 0.1 mL | Minerals solution | ||
| 80.9 mM | Boric acid | ||
| 23.7 mM | MnSO4 | ||
| 13.9 mM | ZnSO4•7H2O | ||
| 7.4 mM | FeCL2•6H2O | ||
| 2.47 mM | Molybdic acid | ||
| 6.02 mM | KI | ||
| 1.6 mM | CuSO4•5H2O | ||
| 47.6 mM | Citric acid | ||
| 0.225 mg | Adenine | ||
| 0.225 mg | Histidine | ||
| 0.225 mg | Leucine | ||
| 0.225 mg | Uracil | ||
| 0.225 mg | Lysine hydrochloride | ||
Gibbs, E. , Hsu, J. , Barth, K. , Goss, J. W. . Characterization of the nanomechanical properties of the fission yeast (Schizosaccharomyces pombe) cell surface by atomic force microscopy. Yeast. 2021;38:480–492. 10.1002/yea.3564
Funding information National Science Foundation, Grant/Award Number: DBI1528288
REFERENCES
- Abenza, J. F. , Couturier, E. , Dodgson, J. , Dickmann, J. , Chessel, A. , Dumais, J. , & Salas, R. E. C. (2015). Wall mechanics and exocytosis define the shape of growth domains in fission yeast. Nature Communications, 6, 8400. 10.1038/ncomms9400 [DOI] [PMC free article] [PubMed] [Google Scholar]
- Adya, A. K. , Canetta, E. , & Walker, G. M. (2006). Atomic force microscopic study of the influence of physical stresses on Saccharomyces cerevisiae and Schizosaccharomyces pombe . FEMS Yeast Research, 6(1), 120–128. 10.1111/j.1567-1364.2005.00003.x [DOI] [PubMed] [Google Scholar]
- Ahimou, F. , Touhami, A. , & Dufrene, Y. F. (2003). Real‐time imaging of the surface topography of living yeast cells by atomic force microscopy. Yeast, 20(1), 25–30. 10.1002/yea.923 [DOI] [PubMed] [Google Scholar]
- Alessandrini, A. , & Facci, P. (2005). AFM: a versatile tool in biophysics. Measurement Science and Technology, 16(6), R65–R92. 10.1088/0957-0233/16/6/R01 [DOI] [Google Scholar]
- Alsteens, D. , Dupres, V. , Mc Evoy, K. , Wildling, L. , Gruber, H. J. , & Dufrene, Y. F. (2008). Structure, cell wall elasticity and polysaccharide properties of living yeast cells, as probed by AFM. Nanotechnology, 19(38), 384005. 10.1088/0957-4484/19/38/384005 [DOI] [PubMed] [Google Scholar]
- Arellano, M. , Cartagena‐Lirola, H. , Nasser Hajibagheri, M. A. , Duran, A. , & Henar Valdivieso, M. (2000). Proper ascospore maturation requires the chs1+ chitin synthase gene in Schizosaccharomyces pombe. Molecular Microbiology, 35(1), 79–89. 10.1046/j.1365-2958.2000.01678.x [DOI] [PubMed] [Google Scholar]
- Arfsten, J. , Leupold, S. , Bradtmoller, C. , Kampen, I. , & Kwade, A. (2010). Atomic force microscopy studies on the nanomechanical properties of Saccharomyces cerevisiae. Colloids and Surfaces. B, Biointerfaces, 79(1), 284–290. 10.1016/j.colsurfb.2010.04.011 [DOI] [PubMed] [Google Scholar]
- Arnoldi, M. , Fritz, M. , Bauerlein, E. , Radmacher, M. , Sackmann, E. , & Boulbitch, A. (2000). Bacterial turgor pressure can be measured by atomic force microscopy. Phys Rev E Stat Phys Plasmas Fluids Relat Interdiscip Topics, 62(1 Pt B), 1034–1044. 10.1103/physreve.62.1034 [DOI] [PubMed] [Google Scholar]
- Atilgan, E. , Magidson, V. , Khodjakov, A. , & Chang, F. (2015). Morphogenesis of the fission yeast cell through cell wall expansion. Current Biology, 25(16), 2150–2157. 10.1016/j.cub.2015.06.059 [DOI] [PMC free article] [PubMed] [Google Scholar]
- Bendezu, F. O. , & Martin, S. G. (2011). Actin cables and the exocyst form two independent morphogenesis pathways in the fission yeast. Molecular Biology of the Cell, 22(1), 44–53. 10.1091/mbc.E10-08-0720 [DOI] [PMC free article] [PubMed] [Google Scholar]
- Bezanilla, M. , Forsburg, S. L. , & Pollard, T. D. (1997). Identification of a second myosin‐II in Schizosaccharomyces pombe: Myp2p is conditionally required for cytokinesis. Mol Biol Cell, 8(12), 2693–2705. 10.1091/mbc.8.12.2693 [DOI] [PMC free article] [PubMed] [Google Scholar]
- Burks, G. A. , Velegol, S. B. , Paramonova, E. , Lindenmuth, B. E. , Feick, J. D. , & Logan, B. E. (2003). Macroscopic and nanoscale measurements of the adhesion of bacteria with varying outer layer surface composition. Langmuir, 19(6), 2366–2371. 10.1021/la026375a [DOI] [Google Scholar]
- Canetta, E. , Adya, A. K. , & Walker, G. M. (2006). Atomic force microscopic study of the effects of ethanol on yeast cell surface morphology. FEMS Microbiology Letters, 255(2), 308–315. 10.1111/j.1574-6968.2005.00089.x [DOI] [PubMed] [Google Scholar]
- Canetta, E. , Walker, G. M. , & Adya, A. K. (2009). Nanoscopic morphological changes in yeast cell surfaces caused by oxidative stress: An atomic force microscopic study. Journal of Microbiology and Biotechnology, 19(6), 547–555. 10.4014/jmb.0809.515 [DOI] [PubMed] [Google Scholar]
- Chinga, G. , Johnsen, P. O. , Dougherty, R. , Berli, E. L. , & Walter, J. (2007). Quantification of the 3D microstructure of SC surfaces. Journal of Microscopy, 227(Pt 3), 254–265. 10.1111/j.1365-2818.2007.01809.x [DOI] [PubMed] [Google Scholar]
- Chiou, J. G. , Balasubramanian, M. K. , & Lew, D. J. (2017). Cell Polarity in Yeast. Annual Review of Cell and Developmental Biology, 33, 77–101. 10.1146/annurev-cellbio-100616-060856 [DOI] [PMC free article] [PubMed] [Google Scholar]
- Cortes, J. C. , Carnero, E. , Ishiguro, J. , Sanchez, Y. , Duran, A. , & Ribas, J. C. (2005). The novel fission yeast (1,3)beta‐D‐glucan synthase catalytic subunit Bgs4p is essential during both cytokinesis and polarized growth. Journal of Cell Science, 118(Pt 1), 157–174. 10.1242/jcs.01585 [DOI] [PubMed] [Google Scholar]
- Cortes, J. C. , Ramos, M. , Osumi, M. , Perez, P. , & Ribas, J. C. (2016). The cell biology of fission yeast septation. Microbiology and Molecular Biology Reviews, 80(3), 779–791. 10.1128/MMBR.00013-16 [DOI] [PMC free article] [PubMed] [Google Scholar]
- Cortes, J. C. , Sato, M. , Munoz, J. , Moreno, M. B. , Clemente‐Ramos, J. A. , Ramos, M. , … Ribas, J. C. (2012). Fission yeast Ags1 confers the essential septum strength needed for safe gradual cell abscission. The Journal of Cell Biology, 198(4), 637–656. 10.1083/jcb.201202015 [DOI] [PMC free article] [PubMed] [Google Scholar]
- Dague, E. , Bitar, R. , Ranchon, H. , Durand, F. , Yken, H. M. , & Francois, J. M. (2010). An atomic force microscopy analysis of yeast mutants defective in cell wall architecture. Yeast, 27(8), 673–684. 10.1002/yea.1801 [DOI] [PubMed] [Google Scholar]
- Dallies, N. , Francois, J. , & Paquet, V. (1998). A new method for quantitative determination of polysaccharides in the yeast cell wall. Application to the cell wall defective mutants of Saccharomyces cerevisiae. Yeast, 14(14), 1297–1306. [DOI] [PubMed] [Google Scholar]
- Davi, V. , Tanimoto, H. , Ershov, D. , Haupt, A. , de Belly, H. , le Borgne, R. , … Minc, N. (2018). Mechanosensation dynamically coordinates polar growth and cell wall assembly to promote cell survival. Developmental Cell, 45(2), 170–182 e177. 10.1016/j.devcel.2018.03.022 [DOI] [PubMed] [Google Scholar]
- de Medina‐Redondo, M. , Arnaiz‐Pita, Y. , Clavaud, C. , Fontaine, T. , del Rey, F. , Latgé, J. P. , & de Aldana, C. R. V. (2010). β (1, 3)‐glucanosyl‐transferase activity is essential for cell wall integrity and viability of Schizosaccharomyces pombe. PLoS One, 5(11), e14046. [DOI] [PMC free article] [PubMed] [Google Scholar]
- Dufrene, Y. F. (2002). Atomic force microscopy, a powerful tool in microbiology. Journal of Bacteriology, 184(19), 5205–5213. 10.1128/jb.184.19.5205-5213.2002 [DOI] [PMC free article] [PubMed] [Google Scholar]
- Dufrene, Y. F. , Ando, T. , Garcia, R. , Alsteens, D. , Martinez‐Martin, D. , Engel, A. , … Muller, D. J. (2017). Imaging modes of atomic force microscopy for application in molecular and cell biology. Nature Nanotechnology, 12(4), 295–307. 10.1038/nnano.2017.45 [DOI] [PubMed] [Google Scholar]
- Dupres, V. , Dufrene, Y. F. , & Heinisch, J. J. (2010). Measuring cell wall thickness in living yeast cells using single molecular rulers. ACS Nano, 4(9), 5498–5504. 10.1021/nn101598v [DOI] [PubMed] [Google Scholar]
- El‐Kirat‐Chatel, S. , Beaussart, A. , Alsteens, D. , Jackson, D. N. , Lipke, P. N. , & Dufrene, Y. F. (2013). Nanoscale analysis of caspofungin‐induced cell surface remodelling in Candida albicans. Nanoscale, 5(3), 1105–1115. 10.1039/c2nr33215a [DOI] [PMC free article] [PubMed] [Google Scholar]
- Feierbach, B. , & Chang, F. (2001). Roles of the fission yeast formin for3p in cell polarity, actin cable formation and symmetric cell division. Current Biology, 11(21), 1656–1665. 10.1016/s0960-9822(01)00525-5 [DOI] [PubMed] [Google Scholar]
- Gaboriaud, F. , & Dufrene, Y. F. (2007). Atomic force microscopy of microbial cells: Application to nanomechanical properties, surface forces and molecular recognition forces. Colloids and Surfaces. B, Biointerfaces, 54(1), 10–19. 10.1016/j.colsurfb.2006.09.014 [DOI] [PubMed] [Google Scholar]
- Gaboriaud, F. , Parcha, B. S. , Gee, M. L. , Holden, J. A. , & Strugnell, R. A. (2008). Spatially resolved force spectroscopy of bacterial surfaces using force‐volume imaging. Colloids and Surfaces. B, Biointerfaces, 62(2), 206–213. 10.1016/j.colsurfb.2007.10.004 [DOI] [PubMed] [Google Scholar]
- Goss, J. W. , & Volle, C. B. (2019). Using atomic force microscopy to illuminate the biophysical properties of microbes. ACS Applied Bio Materials, 3(1), 143–155. 10.1021/acsabm.9b00973 [DOI] [PMC free article] [PubMed] [Google Scholar]
- Guz, N. , Dokukin, M. , Kalaparthi, V. , & Sokolov, I. (2014). If cell mechanics can be described by elastic modulus: Study of different models and probes used in indentation experiments. Biophysical Journal, 107(3), 564–575. 10.1016/j.bpj.2014.06.033 [DOI] [PMC free article] [PubMed] [Google Scholar]
- Hansma, P. , Cleveland, J. , Radmacher, M. , Walters, D. , Hillner, P. , Bezanilla, M. , … Prater, C. (1994). Tapping mode atomic force microscopy in liquids. Applied Physics Letters, 64(13), 1738–1740. 10.1063/1.111795 [DOI] [Google Scholar]
- Hasim, S. , Allison, D. P. , Retterer, S. T. , Hopke, A. , Wheeler, R. T. , Doktycz, M. J. , & Reynolds, T. B. (2017). β‐(1, 3)‐glucan unmasking in some Candida albicans mutants correlates with increases in cell wall surface roughness and decreases in cell wall elasticity. Infection and Immunity, 85(1), e00601‐16. [DOI] [PMC free article] [PubMed] [Google Scholar]
- Horber, J. K. , & Miles, M. J. (2003). Scanning probe evolution in biology. Science, 302(5647), 1002–1005. 10.1126/science.1067410 [DOI] [PubMed] [Google Scholar]
- Horisberger, M. , & Rouvet‐Vauthey, M. (1985). Cell wall architecture of the fission yeastSchizosaccharomyces pombe. Experientia, 41(6), 748–750. 10.1007/BF02012578 [DOI] [Google Scholar]
- Horisberger, M. , Vonlanthen, M. , & Rosset, J. (1978). Localization of alpha‐galactomannan and of wheat germ agglutinin receptors in Schizosaccharomyces pombe. Archives of Microbiology, 119(2), 107–111. 10.1007/BF00964260 [DOI] [PubMed] [Google Scholar]
- Humbel, B. M. , Konomi, M. , Takagi, T. , Kamasawa, N. , Ishijima, S. A. , & Osumi, M. (2001). In situ localization of beta‐glucans in the cell wall of Schizosaccharomyces pombe. Yeast, 18(5), 433–444. 10.1002/yea.694 [DOI] [PubMed] [Google Scholar]
- Hutter, J. L. , & Bechhoefer, J. (1993). Calibration of atomic‐force microscope tips. Review of Scientific Instruments, 64(7), 1868–1873. 10.1063/1.1143970 [DOI] [Google Scholar]
- Ishijima, S. A. , Konomi, M. , Takagi, T. , Sato, M. , Ishiguro, J. , & Osumi, M. (1999). Ultrastructure of cell wall of the cps8 actin mutant cell in Schizosaccharomyces pombe. FEMS Microbiology Letters, 180(1), 31–37. 10.1111/j.1574-6968.1999.tb08774.x [DOI] [PubMed] [Google Scholar]
- Kopecka, M. , Fleet, G. H. , & Phaff, H. J. (1995). Ultrastructure of the cell wall of Schizosaccharomyces pombe following treatment with various glucanases. Journal of Structural Biology, 114(2), 140–152. 10.1006/jsbi.1995.1013 [DOI] [PubMed] [Google Scholar]
- Martin, S. G. , & Arkowitz, R. A. (2014). Cell polarization in budding and fission yeasts. FEMS Microbiology Reviews, 38(2), 228–253. 10.1111/1574-6976.12055 [DOI] [PubMed] [Google Scholar]
- Martin, S. G. , McDonald, W. H. , Yates, J. R. 3rd , & Chang, F. (2005). Tea4p links microtubule plus ends with the formin for3p in the establishment of cell polarity. Developmental Cell, 8(4), 479–491. 10.1016/j.devcel.2005.02.008 [DOI] [PubMed] [Google Scholar]
- Martin‐Garcia, R. , Duran, A. , & Valdivieso, M. H. (2003). In Schizosaccharomyces pombe chs2p has no chitin synthase activity but is related to septum formation. FEBS Letters, 549(1–3), 176–180. 10.1016/s0014-5793(03)00812-3 [DOI] [PubMed] [Google Scholar]
- Mercade‐Prieto, R. , Thomas, C. R. , & Zhang, Z. (2013). Mechanical double layer model for Saccharomyces cerevisiae cell wall. European Biophysics Journal, 42(8), 613–620. 10.1007/s00249-013-0909-x [DOI] [PubMed] [Google Scholar]
- Minc, N. , Boudaoud, A. , & Chang, F. (2009). Mechanical forces of fission yeast growth. Current Biology, 19(13), 1096–1101. 10.1016/j.cub.2009.05.031 [DOI] [PMC free article] [PubMed] [Google Scholar]
- Mitchison, J. M. (1957). The growth of single cells. I. Schizosaccharomyces Pombe. Exp Cell Res, 13(2), 244–262. 10.1016/0014-4827(57)90005-8 [DOI] [PubMed] [Google Scholar]
- Mitchison, J. M. , & Nurse, P. (1985). Growth in cell length in the fission yeast Schizosaccharomyces pombe . Journal of Cell Science, 75, 357–376. 10.1242/jcs.75.1.357 [DOI] [PubMed] [Google Scholar]
- Moseley, J. B. , Mayeux, A. , Paoletti, A. , & Nurse, P. (2009). A spatial gradient coordinates cell size and mitotic entry in fission yeast. Nature, 459(7248), 857–860. 10.1038/nature08074 [DOI] [PubMed] [Google Scholar]
- Munoz, J. , Cortes, J. C. , Sipiczki, M. , Ramos, M. , Clemente‐Ramos, J. A. , Moreno, M. B. , Martins, I. M. , Perez, P. , & Ribas, J. C. (2013). Extracellular cell wall β(1,3)glucan is required to couple septation to actomyosin ring contraction. The Journal of Cell Biology, 203(2), 265–282. 10.1083/jcb.201304132 [DOI] [PMC free article] [PubMed] [Google Scholar]
- Nurse, P. , & Bissett, Y. (1981). Gene required in G1 for commitment to cell cycle and in G2 for control of mitosis in fission yeast. Nature, 292(5823), 558–560. 10.1038/292558a0 [DOI] [PubMed] [Google Scholar]
- Osumi, M. , Konomi, M. , Sugawara, T. , Takagi, T. , & Baba, M. (2006). High‐pressure freezing is a powerful tool for visualization of Schizosaccharomyces pombe cells: Ultra‐low temperature and low‐voltage scanning electron microscopy and immunoelectron microscopy. Microscopy, 55(2), 75–88. 10.1093/jmicro/dfl014 [DOI] [PubMed] [Google Scholar]
- Osumi, M. , Sato, M. , Ishijima, S. A. , Konomi, M. , Takagi, T. , & Yaguchi, H. (1998). Dynamics of cell wall formation in fission yeast, Schizosaccharomyces pombe . Fungal Genetics and Biology, 24(1–2), 178–206. 10.1006/fgbi.1998.1067 [DOI] [PubMed] [Google Scholar]
- Pelling, A. E. , Sehati, S. , Gralla, E. B. , Valentine, J. S. , & Gimzewski, J. K. (2004). Local nanomechanical motion of the cell wall of Saccharomyces cerevisiae . Science, 305(5687), 1147–1150. 10.1126/science.1097640 [DOI] [PubMed] [Google Scholar]
- Ramos, M. , Cortes, J. C. , Sato, M. , Rincon, S. A. , Moreno, M. B. , Clemente‐Ramos, J. A. , Osumi, M. , Perez, P. , & Ribas, J. C. (2019). Two S. pombe septation phases differ in ingression rate, septum structure, and response to F‐actin loss. Journal Cell Biology, 2019, 218(12), 4171–4194. 10.1083/jcb201808163 [DOI] [PMC free article] [PubMed] [Google Scholar]
- Rincon, S. A. , Estravis, M. , & Perez, P. (2014). Cdc42 regulates polarized growth and cell integrity in fission yeast. Biochemical Society Transactions, 42(1), 201–205. 10.1042/BST20130155 [DOI] [PubMed] [Google Scholar]
- Sasuga, S. , Abe, R. , Nikaido, O. , Kiyosaki, S. , Sekiguchi, H. , Ikai, A. , & Osada, T. (2012). Interaction between pheromone and its receptor of the fission yeast Schizosaccharomyces pombe examined by a force spectroscopy study. Journal of Biomedicine & Biotechnology, 2012, 804793–804797. 10.1155/2012/804793 [DOI] [PMC free article] [PubMed] [Google Scholar]
- Sawin, K. E. , & Nurse, P. (1998). Regulation of cell polarity by microtubules in fission yeast. The Journal of Cell Biology, 142(2), 457–471. 10.1083/jcb.142.2.457 [DOI] [PMC free article] [PubMed] [Google Scholar]
- Sietsma, J. H. , & Wessels, J. G. (1990). The occurrence of glucosaminoglycan in the wall of Schizosaccharomyces pombe . Journal of General Microbiology, 136(11), 2261–2265. 10.1099/00221287-136-11-2261 [DOI] [PubMed] [Google Scholar]
- Sipiczki, M. (2016). Visualization of fission yeast cells by transmission electron microscopy. Methods in Molecular Biology, 1369, 97–111. 10.1007/978-1-4939-3145-3_8 [DOI] [PubMed] [Google Scholar]
- Sugawara, T. , Takahashi, S. , Osumi, M. , & Ohno, N. (2004). Refinement of the structures of cell‐wall glucans of Schizosaccharomyces pombe by chemical modification and NMR spectroscopy. Carbohydrate Research, 339(13), 2255–2265. 10.1016/j.carres.2004.05.033 [DOI] [PubMed] [Google Scholar]
- Thuriaux, P. , Nurse, P. , & Carter, B. (1978). Mutants altered in the control co‐ordinating cell division with cell growth in the fission yeast Schizosaccharomyces pombe . Molecular & General Genetics, 161(2), 215–220. 10.1007/BF00274190 [DOI] [PubMed] [Google Scholar]
- Touhami, A. , Nysten, B. , & Dufrêne, Y. F. (2003). Nanoscale mapping of the elasticity of microbial cells by atomic force microscopy. Langmuir, 19(11), 4539–4543. 10.1021/la034136x [DOI] [Google Scholar]
- Velegol, S. B. , & Logan, B. E. (2002). Contributions of bacterial surface polymers, electrostatics, and cell elasticity to the shape of AFM force curves. Langmuir, 18(13), 5256–5262. 10.1021/la011818g [DOI] [Google Scholar]
- Verde, F. , Mata, J. , & Nurse, P. (1995). Fission yeast cell morphogenesis: Identification of new genes and analysis of their role during the cell cycle. The Journal of Cell Biology, 131(6 Pt 1), 1529–1538. 10.1083/jcb.131.6.1529 [DOI] [PMC free article] [PubMed] [Google Scholar]
- Volle, C. B. , Ferguson, M. A. , Aidala, K. E. , Spain, E. M. , & Nunez, M. E. (2008). Quantitative changes in the elasticity and adhesive properties of Escherichia coli ZK1056 prey cells during predation by bdellovibrio bacteriovorus 109J. Langmuir, 24(15), 8102–8110. 10.1021/la8009354 [DOI] [PubMed] [Google Scholar]
- Wu, J. , Kuhn, J. R. , Kovar, D. R. , & Pollard, T. D. (2003). Spatial and temporal pathway for assembly and constriction of the contractile ring in fission yeast cytokinesis. Developmental Cell, 5(5), 723–734. 10.1016/s1534-5807(03)00324-1 [DOI] [PubMed] [Google Scholar]
- Zemła, J. , Bobrowska, J. , Kubiak, A. , Zieliński, T. , Pabijan, J. , Pogoda, K. , Bobrowski, P. , & Lekka, M. (2020). Indenting soft samples (hydrogels and cells) with cantilevers possessing various shapes of probing tip. European Biophysics Journal, 49(6), 485–495. 10.1007/s00249-020-01456-7 [DOI] [PMC free article] [PubMed] [Google Scholar]
- Zhao, L. , Schaefer, D. , Xu, H. , Modi, S. J. , LaCourse, W. R. , & Marten, M. R. (2005). Elastic properties of the cell wall of Aspergillus nidulans studied with atomic force microscopy. Biotechnology Progress, 21(1), 292–299. 10.1021/bp0497233 [DOI] [PubMed] [Google Scholar]
Associated Data
This section collects any data citations, data availability statements, or supplementary materials included in this article.
Supplementary Materials
Figure S1. Comparison of S. pombe cellular stiffness in different imaging buffers
Wildtype S. pombe cells were incubated in 0.1 mM HEPES buffer, EMM5S fission yeast growth media, or 18 mM sodium acetate buffer during AFM imaging and probing, or with EMM5s media for 18 hours prior to and during AFM imaging and probing. Box‐and‐whisker plots of the cellular spring constants were calculated from the linear region of force extension curves for each condition. The boxed region indicates the upper and lower quartiles for each data set; the median is indicated by the horizontal line within the box; the mean is indicated by an ‘x’; whiskers extend to high and low data points; outliers are shown as individual data points. (n > 500 force measurements from 5 cells under each condition).
Figure S2. Hertz model fitting of S. pombe force extension curves to obtain Young's moduli for cell body and cell tip.
Representative force extension curves with 4nN trigger point taken from cdc25‐22 cell body (red) or cdc25‐22 cell tip (blue) were fit with the Hertz model to calculate Young's elasticity moduli at a sample Poisson of 0.03. Model fits are shown for each representative curve as a dashed line.
Figure S3. Calculation of Young's modulus for S. pombe cells using Hertz modeling with sample Poisson value of 0.5
Box‐and‐whisker plot of Young's modulus of elasticity calculated by the Hertz model (using sample Poisson of 0.5, rather than 0.03 shown in Figure 5D) from cellular spring constants of wildtype cell body (gray), cdc25‐22 cell body (red), or cdc25‐22 cell pole (blue). The boxed region indicates the upper and lower quartiles for each data set; the median is indicated by the horizontal line within the box; the mean is indicated by an ‘x’; whiskers extend to high and low data points; outliers are shown as individual data points. (n > 100 force measurements from 10 cells per condition). Two asterisks indicate p < 1e‐10, determined by single factor ANOVA and student t‐test.
Supporting Information Figure Legends
Table S1: S. pombe strains used in this study