

ABSTRACT
The surrogate threshold effect (STE) is defined as the minimum treatment effect on a surrogate that is reliably predictive of a treatment effect on the clinical outcome. It provides a framework for implementing a clinical trial with a surrogate endpoint. The aim of this study was to update our previous analysis by validating the STE for change in total hip (TH) BMD as a surrogate for fracture risk reduction; the novelty of this study was this validation. To do so, we used individual patient data from 61,415 participants in 16 RCTs that evaluated bisphosphonates (nine trials), selective estrogen receptor modulators (four trials), denosumab (one trial), odanacatib (one trial), and teriparatide (one trial) to estimate trial‐specific treatment effects on TH BMD and all, vertebral, hip, and nonvertebral fractures. We then conducted a random effects meta‐regression of the log relative fracture risk reduction against 24‐month change in TH BMD, and computed the STE as the intersection of the upper 95% prediction limit of this regression with the line of no fracture reduction. We validated the STE by checking whether the number of fractures in each trial provided 80% power and determining what proportion of trials with BMD changes ≥ STE reported significant reductions in fracture risk. We applied this analysis to (i) the trials on which we estimated the STE; and (ii) trials on which we did not estimate the STE. We found that the STEs for all, vertebral, hip, and nonvertebral fractures were 1.83%, 1.42%, 3.18%, and 2.13%, respectively. Among trials used to estimate STE, 27 of 28 were adequately powered, showed BMD effects exceeding the STE, and showed significant reductions in fracture risk. Among the validation set of 11 trials, 10 met these criteria. Thus STE differs by fracture type and has been validated in trials not used to develop the approach. © 2021 The Authors. Journal of Bone and Mineral Research published by Wiley Periodicals LLC on behalf of American Society for Bone and Mineral Research (ASBMR).
Keywords: BONE MINERAL DENSITY, FRACTURE, SURROGATE, BISPHOSPHONATES, SELECTIVE ESTROGEN RECEPTOR MODULATORS
Introduction
Surrogate endpoints such as low‐density lipoprotein (LDL) cholesterol and blood pressure help accelerate drug development. In the field of osteoporosis, we have proposed that change in bone mineral density (BMD) of the total hip could be a surrogate outcome for fracture risk reduction,( 1 ) a proposal that has been made by others.( 2 ) There are several approaches to implementing surrogate endpoints in trials,( 3 ) but one of the most promising is the surrogate threshold effect (STE).( 4 )
The surrogate threshold effect (STE) is defined as the change in the level of a marker that would predict any improvement in a disease outcome with 95% certainty. For example, a statin‐related decrease of at least 1.4 mmol/L (54 mg/dL) or more in LDL cholesterol identified a reduction in cardiovascular mortality( 5 ) and a decrease in systolic blood pressure of 7.4 mm Hg or more predicts a reduction in the risk of stroke.( 6 )
In the Foundation for the National Institutes of Health (FNIH)‐ASBMR Study to Advance BMD as a Regulatory Endpoint (SABRE) project we obtained a unique dataset of individual patient data from randomized, placebo‐controlled trials. Using this dataset, we previously conducted a meta regression of the association between treatment‐related changes in BMD and fracture risk reduction. We also calculated the STE, namely the change in BMD that would predict a significant reduction in fracture.( 1 ) The purpose of the current study is to compute the STE for different magnitudes of minimum fracture risk reduction ranging from 0% to 50%. We also tested the STE against the trials we used in the meta regression to determine whether the claims for fracture risk would have been supported. Finally, we wanted to test the application of the STE in trials not used in the meta regression to further validate the STE method.
Subjects and Methods
As described,( 1 ) we did a systematic search of published literature to identify randomized controlled trials (RCTs) of osteoporosis drugs with fracture as the outcome. We checked databases including PubMed, Embase, and Cochrane for publications between 1985 and 2018 in English using the search terms “fracture, BMD, bone mineral density and required RCT or synonyms.” We excluded small studies and studies of patients with certain conditions (eg, glucocorticoid‐induced osteoporosis).( 1 ) Strontium ranelate can artifactually increase BMD, which alters calcium hydroxyapatite in bone, so we excluded such trials.( 7 , 8 ) We attempted to collect from trial sponsors the following: complete data files, individual patient data, and study documentation. We included trials of approved osteoporosis medications, as well as trials of drugs for which approval was not sought or received. We used a standardized template including uniform fracture definitions and standardized BMD conversions. Some studies were not included in the FNIH‐SABRE databases because the sponsor was unable or unwilling to provide the data.
We created standardized fracture definitions across all trials. We excluded fractures due to major trauma, by which we meant trauma sufficient to cause a fracture in a young, healthy person. However, we included all fractures reported when trauma information was not available. We included all nonvertebral fractures without exclusion except for one study in which the category of fragility fractures had excluded more than half of nonvertebral fractures due to trauma.( 9 ) For vertebral fractures, we used the individual study definitions based on comparing baseline with follow‐up lateral spinal radiographs. Vertebral fracture definition was based on quantitative morphometry,( 10 ) semiquantitative assessment,( 11 ) or a combination of these criteria. We added a fourth category of fracture to this study that was not in our previous study,( 1 ) namely “all fractures.” This is the composite of nonvertebral and clinical or morphometric vertebral fractures.
Statistical analysis
We used Cox proportional hazard models for time to all, hip, and nonvertebral fractures with the hazard ratio (HR) as the measure of fracture reduction in order to estimate the effect of treatment within each study,. We used logistic regression with the odds ratio (OR) as the measure of fracture reduction for vertebral fractures, where the time to event was unknown,. All analyses were by intention‐to‐treat. The association between treatment and fracture risk (eg, OR or HR) that we calculated differed from the original published results in some studies, for various reasons (eg, use of a different fracture definition, exclusion of trauma, or updates to the final dataset after publication).
We conducted study‐level analyses where the unit of analysis is the study and not the individual. We plotted ORs or HRs against the between‐group difference in percentage change in BMD showing the point estimate and 95% confidence interval (CI). Next, we used a random effects meta‐regression to estimate the association of the mean percentage differences in BMD with the log HR or log ORs, accounting for their standard errors, and estimated the 95% prediction limits. The STE was defined as the BMD difference (active – placebo) where the upper 95% prediction limit crossed the relative risk of fracture of unity, 0.9, 0.8, 0.7, 0.6, or 0.5, reflecting fracture risk reductions of 0%, 10%, 20%, 30%, 40%, and 50%, respectively.
We evaluated our STE thresholds with observed BMD changes and fracture risk reductions first in the studies used to derive the STE thresholds (eg, studies in the FNIH‐SABRE database), and then in studies not included in the initial derivation set. For this comparison, we first estimated the number of subjects with fracture needed for 80% power based on the calculated HR of fracture risk. We then identified those studies which did not reach at least 80% power (Table 1, gray).( 8 , 12 , 13 , 14 , 15 , 16 , 17 , 18 , 19 , 20 , 21 , 22 , 23 , 24 , 25 , 26 ) Of the remainder, we did not have data on some (Table 1, yellow). In those for which we had data, we checked whether the difference in the change in TH BMD between active and placebo at 24 months exceeded the STE and, if so, whether the trial reported a nominally significant reduction in fracture risk (p < 0.05). If the STE was exceeded and fractures were significantly reduced, the result is shaded green in Table 1. In comparison, if the STE was exceeded and the trial did not achieve a significant reduction in fractures, the results are shaded in red (Table 1).
Table 1.
Validation of STE Estimates in trials used for the derivation of STE
| Study number used in Fig. 1 | Study name | Drug | TH BMD (%) | All Fx (>1.83%) | Vertebral Fx (>1.42%) | Hip Fx (>3.18%) | Nonvertebral Fx (>2.13%) |
|---|---|---|---|---|---|---|---|
| 1 | BZA PHASE 3( 12 ) | Bazedoxifene | 1.29 | ||||
| 2 | MORE( 13 ) | Raloxifene | 2.00 | 0.74 | 0.57 | ||
| 3 | VERT‐NORTH AMERICA( 14 ) | Risedronate | 2.18 | 0.69 | |||
| 4 | GENERATIONS( 15 ) | Arzoxifene | 2.32 | 0.85 | 0.59 | ||
| 5 | IBAN IV( 16 ) | Ibandronate (iv) | 2.37 | 0.82 | |||
| 6 | MEN's Study( 17 ) | Alendronate | 2.52 | ||||
| 7 | PEARL( 18 ) | Lasofoxifene | 2.77 | 0.74 | 0.64 | ||
| 8 | BONE( 19 ) | Ibandronate (oral) | 3.01 | 0.79 | 0.52 | ||
| 9 | FIT CLINICAL FRACTURE( 20 ) | Alendronate | 3.12 | 0.85 | 0.55 | ||
| 10 | FIT VERTEBRAL FRACTURE( 21 ) | Alendronate | 3.69 | 0.65 | 0.49 | ||
| 11 | LOFT( 22 ) | Odanacatib | 4.56 | 0.60 | 0.46 | 0.52 | 0.76 |
| 12 | ALN PHASE 3( 23 ) | Alendronate | 4.57 | ||||
| 13 | HORIZON 2301( 24 ) | Zoledronic acid (iv) | 4.69 | 0.55 | 0.32 | 0.59 | 0.75 |
| 14 | FRX PREVENTION TRIAL( 8 ) | Teriparatide (SQ) | 5.26 | 0.46 | 0.29 | ||
| 15 | FREEDOM( 25 ) | Denosumab (SQ) | 5.35 | 0.59 | 0.31 | 0.81 | |
| 16 | HORIZON 2310( 26 ) | Zoledronic acid (iv) | 5.38 | 0.65 |
We estimated the number of subjects with fracture needed for 80% power based on the calculated hazard ratio of fracture risk. We then identified those studies which did not reach at least 80% power (gray). Of the remainder, we did not have data on some (yellow), but in those for which we had data, we checked whether the change in total hip BMD between active and placebo at 24 months exceeded the STE and, if so, whether the trial showed a nominally significant reduction in fracture risk (p < 0.05). If the STE was exceeded and the trial was significant, the result is shown in green; if the STE was exceeded and the trial was not significant and the result is shown in red. The numbers in the last four columns are observed relative risk of fracture (all p < 0.05).
Fx = fracture; SQ = subcutaneous; STE = surrogate threshold effect; THBMD = total hip BMD.
To further examine the validity of our approach, we repeated the same evaluation discussed above for trials that were in our review of published trials,( 27 ) but that were not used as part of our development of the STE estimates, as well as any other large clinical trials. We did encounter a few challenges—in some studies we were unable to use change in total hip BMD at 2 years because the study duration was only for 18 months (abaloparatide( 28 )), there was measurement of BMD at 3 years and so we had to interpolate,( 23 ) or there was only femoral neck BMD (sodium fluoride,( 29 ) etidronate( 30 )) or only lumbar spine BMD (tiludronate( 31 ) and calcitonin( 32 )). In the latter cases, we used the STE estimates for change in femoral neck or lumbar spine risk ratio from our previous work.( 1 )
Results
Estimating the STE
Change in total hip BMD at 24 months, required for the STE analyses, was available for 61,415 participants. The number of participants used in each analysis depended on the specific fracture type (ie, “all,” vertebral, hip, or nonvertebral fractures). Mean net differences (% change in active minus % change in placebo groups) in total hip BMD ranged from 1.3% to 5.4% across the studies.
We included 16 trials; these enrolled mostly women (exceptions are the MENS( 21 ) study and HORIZON 2310( 20 ) [about 25% men]). The drugs tested in these trials included alendronate,( 14 , 17 , 19 , 21 ) risedronate,( 16 ) ibandronate oral,( 24 ) ibandronate iv,( 26 ) zoledronate,( 20 , 25 ) denosumab,( 12 ) bazedoxifene,( 13 ) raloxifene,( 15 ) arzoxifene,( 18 ) lasofoxifene,( 22 ) odanacatib,( 31 ) and teriparatide.( 9 )
We describe our results for the four STE estimates for the four fracture categories in Table 2. These are illustrated in Fig. 1. Note how the 95% CIs always included the regression line for all four fracture types (with the exception of the ALN Phase 3 study( 23 ) and all fractures).
Table 2.
Estimates of Change in Total Hip BMD at 24 Months on Treatment
| Minimum fracture risk reduction | STE (% difference in TH BMD between active and placebo) | |||
|---|---|---|---|---|
| All fractures | Vertebral fracture | Hip fracture | Nonvertebral fracture | |
| Any | 1.8 | 1.4 | 3.2 | 2.1 |
| >10% | 2.7 | 1.9 | 3.7 | 3.5 |
| >20% | 3.8 | 2.4 | 4.5 | 6.2 |
| >30% | 5.1 | 3.0 | 5.8 | — |
| >40% | 3.7 | — | — | |
| >50% | 4.6 | — | — | |
STE for any reduction in the four categories of fracture. STEs for different minimal treatment effects ranging from 10% to 50% are shown. The cells left blank indicate those estimates where the 95% confidence interval upper bound exceeded 10%.
STE = surrogate threshold effect.
Fig 1.
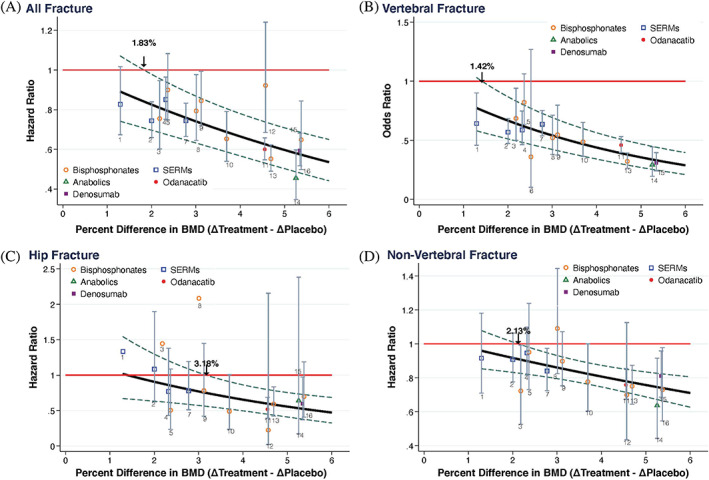
Relationship between difference in the change in total hip BMD between active and placebo groups at 24 months and the hazard or odds ratio of all, vertebral, hip and nonvertebral fractures. The red horizontal line is the ratio of 1 (no treatment effect) and the STE is the point where the upper 95% prediction limits intersects this line; eg, 1.83% for the all fracture outcome. The class of drugs is indicated in the legend. For each trial, the point estimates and 95% confidence intervals for relative risks are given and the numbers 1–16 relate to the studies listed in Table 1.
Validating the STE approach
We validated the STE approach by evaluating whether studies that met the STE BMD threshold (and also had sufficient fracture events) significantly reduced fracture risk (Table 1). Nearly all (27/28) of the combination of study and fracture types that met the STE threshold for BMD change had significant reductions in fracture risk (shown in green in Table 1). One study, namely IBAN IV, met the STE for vertebral fracture but did not significantly reduce vertebral fractures in the trial (shown in red in Table 1).
We conducted a similar analysis for published trials that we did not include in our meta‐analysis (Table 3). These included trials of tiludronate,( 32 ) nasal calcitonin,( 33 ) parathyroid hormone 1‐84 (PTH 1‐84),( 30 ) etidronate,( 34 ) clodronate,( 35 ) zoledronate,( 23 ) abaloparatide,( 28 ) sodium fluoride,( 29 ) romosozumab compared to alendronate,( 36 ) and romosozumab compared to placebo.( 37 )
Table 3.
Validation of STE Estimates in Trials Not Used for the Derivation of STEs
| Study | Active treatment | Control treatment | BMD change at 24 months (active‐control, %) | Relative risk (odds ratio or hazard ratio) | |||
|---|---|---|---|---|---|---|---|
| All Fx | Vertebral Fx | Hip Fx | Nonvertebral Fx | ||||
| Reginster and colleagues (2001)( 32 ) | Tiludronate | PBO | −0.80 | ||||
| Chesnut and colleagues (2000)( 33 ) | Calcitonin | PBO | 0.70 | ||||
| Greenspan and colleagues (2007)( 30 ) | PTH (1‐84) | PBO | 2.11 | 0.42 | |||
| Watts and colleagues (1990)( 34 ) | Etidronate | PBO | 2.90 | ||||
| McCloskey and colleagues (2004)( 35 ) | Clodronate | PBO | 3.00 | 0.54 | |||
| Reid and colleagues (2018)( 23 ) | Zoledronate | PBO | 3.30 | 0.63 | 0.45 | 0.66 | |
| Miller and colleagues (2016)( 28 ) | Abaloparatide | PBO | 4.25 | 0.14 | |||
| Riggs and colleagues (1990)( 29 ) | Sodium fluoride | PBO | 4.50 | 3.20 | |||
| Saag and colleagues (2017)( 36 ) | Romosozumab→ALN | ALN→ALN | 3.70 | 0.73 | 0.52 | ||
| Cosman and colleagues (2016)( 37 ) | Romosozumab→Dmab | PBO→Dmab | 5.90 | 0.67 | 0.25 | ||
We estimated the number of subjects with fracture needed for 80% power based on the reported hazard ratio of fracture risk. We then identified those studies which did not reach at least 80% power (gray). Of the remainder, we did not have data on some (yellow) but in those for which we had data, we checked whether the change in total hip BMD between active and placebo at 24 months exceeded the STE and, if so, whether the trial showed a nominally significant reduction in fracture risk (p < 0.05). If the STE was exceeded and the trial was significant, the result is shown in green; if the STE was exceeded and the trial was not significant the result is shown in red. The numbers in the last four columns are observed relative risk of fracture (all p < 0.05). We took change in total hip at 2 years but there were some exceptions such as abaloparatide, which was 18 months total hip BMD; with clodronate there was a measurement of BMD at 3 years so we had to interpolate; sodium fluoride, etidronate, which had 2‐year femoral neck BMD; and tiludronate and calcitonin, which had 2‐year lumbar spine BMD.
ALN = alendronate; Dmab = denosumab; PBO = placebo; STE = surrogate threshold effect.
We again validated the STE approach by evaluating whether those studies (for which we do not have individual data) that met the STE BMD threshold (and also had sufficient fracture events) significantly reduced fracture risk (Table 3). However, we had to use femoral neck or lumbar spine in some cases to identify the STE and we used the published (nominal) p value to determine whether the fracture reduction was significant. Nearly all (10/11) of the combination of study and fracture types that met the STE threshold for BMD change had significant reductions in fracture risk (shown in green in Table 3). One study, namely sodium fluoride, met the STE for nonvertebral fracture but did not significantly reduce nonvertebral fractures in the trial.
Discussion
We identified the STE estimates for change in total hip at 24 months for four different fracture locations. The choice of the threshold would be taken by the regulator, eg, US Food and Drug Administration, and the study sponsor. For the validation of the approach, we have taken the 95% prediction limits and we have taken any significant fracture risk reduction (requiring no minimal fracture risk reduction). It may be more rigorous to choose a minimal fracture risk reduction such as 30% for vertebral fracture, because many of our licensed drugs reduce fracture risk by more than this and so a lower reduction may not be clinically important.
We found that in most cases (37/39), a significant fracture reduction was observed when the BMD change exceeded the STE threshold. Importantly, this concordance between STE threshold and fracture reduction was seen both in studies that were included and those that were not included in the meta‐regression used to establish the STE, providing robust evidence for the validity of the STE approach.
There were only two studies that were not concordant. The first was a trial using a dose of intravenous ibandronate( 26 ) that was lower than the licensed dose (0.5 and 1 mg as compared to the licensed dose of 3 mg every 3 months). The study was adequately powered to detect a decrease in vertebral fractures, but not other fractures. There are two possible explanations. This could be a false negative—we would not expect all 40 studies to be concordant when we are using a p value of 0.05 as our nominal level of significance. Alternatively, the explanation may lie in the inconsistent decrease in bone turnover markers. Although the total hip BMD increase (2.4%) was greater than the STE for vertebral fracture (1.4%), the bone turnover markers were only intermittently suppressed by the 3‐monthly injection; the serum and urinary cross‐linked C‐telopeptide (CTX) were only about 10% below the placebo response 3 months after injection.( 38 ) The second was a trial of sodium fluoride,( 29 ) which had sufficient power to detect a decrease in nonvertebral fracture (which actually increased). Sodium fluoride is known to impair bone mineralization in biopsies from humans( 39 ) and minipigs( 40 ) and to reduce structural and material strength in chickens, rats, rabbits, and minipigs.( 41 ) Nowadays, the preclinical program as well as bone biopsies taken during phase 3 would identify such a problem. Moreover, our proposal to use BMD as a surrogate endpoint in future clinical trials would require preclinical evidence of the expected positive association between bone mass and strength.
Precisely how to use the STE to gain regulatory approval for a new drug in osteoporosis remains under discussion. However, one option would be to use the STE method to identify “efficacy thresholds” for a future placebo‐controlled trial of a new anti‐osteoporosis drug that would predict a significant fracture reduction. Results presented here indicate that a different “efficacy threshold” of total hip BMD change (eg, % change: active – placebo) is needed for each fracture type and that, as expected, higher changes in BMD are required for greater fracture reductions. Thus, a new anti‐osteoporosis drug could be approved based on a placebo‐controlled trial that exhibited a total hip BMD increase that exceeded these thresholds, and perhaps, depending on the magnitude of BMD change, with a statement in the drug label indicating which fracture‐specific thresholds were met. Alternatively, for simplicity, the BMD threshold for all different fracture types could be used. Finally, we have few studies of active comparators and so the application to such trials needs further work.
In conclusion, these results provide strong support for using the STE approach in the application of change in TH BMD as a surrogate marker for identifying likely fracture benefits for future clinical trials of osteoporosis treatment.
Disclosures
RE reports grants from Amgen, grants and personal fees from Immunodiagnostic Systems, grants from Alexion, grants and personal fees from Roche, personal fees from Eli Lilly, personal fees from GSK Nutrition, personal fees from Mereo, personal fees from Sandoz, grants and personal fees from Nittobo, personal fees from AbbVie, personal fees from Samsung, personal fees from Haoma Medica, personal fees from Elsevier, personal fees from CL Bio, personal fees from FNIH, personal fees from Viking, outside the submitted work. EV reports salary support from FNIH, during the conduct of the study. LYL has nothing to disclose. AC reports as an Amgen Inc. employee during the time of data collection and analysis. IP reports personal fees from Eli Lilly and Company, outside the submitted work. SK has nothing to disclose. JAC has nothing to disclose. BM is an employee and shareholder of Radius Health, and a retiree and shareholder of Eli Lilly and Company. CEM grant support from FNIH during the conduct of the study. DCB has nothing to disclose. MB received a grant from the FNIH in relation to the submitted work, and grants from Amgen and Radius Pharma unrelated to this work. DMB reports personal fees from Merck, personal fees from Amgen, personal fees from Asahi‐Kasei, personal fees from Effx during the conduct of the study, personal fees from Eli Lilly, and personal fees from University of Pittsburgh outside the submitted work.
Peer Review
The peer review history for this article is available at https://publons.com/publon/10.1002/jbmr.4433.
Acknowledgments
The Bone Quality Project thanks the following groups for their contribution and support: Scientific and financial support for the FNIH Bone Quality Project are made possible through direct contributions to FNIH by: AgNovos Healthcare, American Society for Bone and Mineral Research, Amgen Inc., Daiichi Sankyo, Inc., Dairy Research Institute, Eli Lilly and Company, Merck Sharp & Dohme Corp., Inc., and Roche Diagnostics Corporation. In‐kind data to support the project was provided by Actavis, Amgen Inc., Bayer Schering Pharma Oy, Eli Lilly and Company, GlaxoSmithKline, Merck Sharp & Dohme Corp., NIH National Institute of Arthritis and Musculoskeletal and Skin Diseases and National Heart, Lung, and Blood Institute, Novartis, Pfizer, Inc., Roche Diagnostics Corporation, and Sermonix. We acknowledge Lucy Wu, MPH (UCSF) for her assistance throughout the project and in preparation of the manuscript.
Authors’ roles: RE study design, data compilation, drafting, interpretation and revision of manuscript, review of manuscript. DCB, DMB, MB: study design, drafting, interpretation and revision of manuscript, review of manuscript. EV: statistical analysis and interpretation, creation of figures, revision of manuscript. LYL: statistical analysis and interpretation; creation of figures and tables; revision and review of manuscript. IP, AC, SK, JAC, BM: revision and review of manuscript. CEM: statistical analysis and interpretation, review of manuscript.
Data Availability Statement
Data Sharing Statement As stated above, all study data were acquired by requesting IPD from study sponsors. An overarching data use agreement was created between all parties and individual data use agreements were created between individual study sponsors, FNIH and UCSF. Per the data sharing agreements that we have with each sponsor, the data can be used for surrogate marker analyses including any surrogate qualification processes with regulatory authorities. However, other uses of the data are restricted by this agreement and UCSF is not allowed to share the data.
References
- 1. Black DM, Bauer DC, Vittinghoff E, et al. Treatment‐related changes in bone mineral density as a surrogate biomarker for fracture risk reduction: meta‐regression analyses of individual patient data from multiple randomised controlled trials. Lancet Diabetes Endocrinol. 2020;8(8):672‐682. [DOI] [PubMed] [Google Scholar]
- 2. Miller PD. Bone strength and surrogate markers: the first, second, and third fiddle. J Bone Miner Res. 2012;27(8):1623‐1626. [DOI] [PubMed] [Google Scholar]
- 3. Ciani O, Buyse M, Drummond M, Rasi G, Saad ED, Taylor RS. Time to review the role of surrogate end points in health policy: state of the art and the way forward. Value Health. 2017;20(3):487‐495. [DOI] [PubMed] [Google Scholar]
- 4. Amur S, LaVange L, Zineh I, Buckman‐Garner S, Woodcock J. Biomarker qualification: toward a multiple stakeholder framework for biomarker development, regulatory acceptance, and utilization. Clin Pharmacol Ther. 2015;98(1):34‐46. [DOI] [PubMed] [Google Scholar]
- 5. Johnson KR, Freemantle N, Anthony DM, Lassere MN. LDL‐cholesterol differences predicted survival benefit in statin trials by the surrogate threshold effect (STE). J Clin Epidemiol. 2009;62(3):328‐336. [DOI] [PubMed] [Google Scholar]
- 6. Lassere MN, Johnson KR, Schiff M, Rees D. Is blood pressure reduction a valid surrogate endpoint for stroke prevention? An analysis incorporating a systematic review of randomised controlled trials, a by‐trial weighted errors‐in‐variables regression, the surrogate threshold effect (STE) and the biomarker‐surrogacy (BioSurrogate) evaluation schema (BSES). BMC Med Res Methodol. 2012;12:27. [DOI] [PMC free article] [PubMed] [Google Scholar]
- 7. Blake GM, Fogelman I. Long‐term effect of strontium ranelate treatment on BMD. J Bone Miner Res. 2005;20(11):1901‐1904. [DOI] [PubMed] [Google Scholar]
- 8. Nielsen SP, Slosman D, Sorensen OH, et al. Influence of strontium on bone mineral density and bone mineral content measurements by dual X‐ray absorptiometry. J Clin Densitom. 1999;2(4):371‐379. [DOI] [PubMed] [Google Scholar]
- 9. Neer RM, Arnaud CD, Zanchetta JR, et al. Effect of parathyroid hormone (1‐34) on fractures and bone mineral density in postmenopausal women with osteoporosis. N Engl J Med. 2001;344(19):1434‐1441. [DOI] [PubMed] [Google Scholar]
- 10. Eastell R, Cedel SL, Wahner HW, Riggs BL, Melton LJ 3rd. Classification of vertebral fractures. J Bone Miner Res. 1991;6(3):207‐215. [DOI] [PubMed] [Google Scholar]
- 11. Genant HK, Wu CY, Vankuijk C, Nevitt MC. Vertebral fracture assessment using a semiquantitative technique. J Bone Miner Res. 1993;8:1137‐1148. [DOI] [PubMed] [Google Scholar]
- 12. Cummings SR, San Martin J, McClung MR, et al. Denosumab for prevention of fractures in postmenopausal women with osteoporosis. N Engl J Med. 2009;361(8):756‐765. [DOI] [PubMed] [Google Scholar]
- 13. Silverman SL, Christiansen C, Genant HK, et al. Efficacy of bazedoxifene in reducing new vertebral fracture risk in postmenopausal women with osteoporosis: results from a 3‐year, randomized, placebo‐, and active‐controlled clinical trial. J Bone Miner Res. 2008;23(12):1923‐1934. [DOI] [PubMed] [Google Scholar]
- 14. Black DM, Cummings SR, Karpf DB, et al. Randomised trial of effect of alendronate on risk of fracture in women with existing vertebral fractures. Lancet. 1996;348(9041):1535‐1541. [DOI] [PubMed] [Google Scholar]
- 15. Ettinger B, Black DM, Mitlak BH, et al. Reduction of vertebral fracture risk in postmenopausal women with osteoporosis treated with raloxifene: results from a 3‐year randomized clinical trial. Multiple Outcomes of Raloxifene Evaluation (MORE) Investigators. JAMA. 1999;282(7):637‐645. [DOI] [PubMed] [Google Scholar]
- 16. Harris ST, Watts NB, Genant HK, et al. Effects of risedronate treatment on vertebral and nonvertebral fractures in women with postmenopausal osteoporosis: a randomized controlled trial. Vertebral Efficacy With Risedronate Therapy (VERT) Study Group. JAMA. 1999;282(14):1344‐1352. [DOI] [PubMed] [Google Scholar]
- 17. Liberman U, Weiss SR, Broll J, et al. Effect of oral alendronate on bone mineral density and the incidence of fractures in postmenopausal osteoporosis. N Engl J Med. 1995;333(22):7. [DOI] [PubMed] [Google Scholar]
- 18. Cummings SR, McClung M, Reginster JY, et al. Arzoxifene for prevention of fractures and invasive breast cancer in postmenopausal women. J Bone Miner Res. 2011;26(2):397‐404. [DOI] [PubMed] [Google Scholar]
- 19. Cummings SR, Black DM, Thompson DE, et al. Effect of alendronate on risk of fracture in women with low bone density but without vertebral fractures: results from the Fracture Intervention Trial. JAMA. 1998;280(24):2077‐2082. [DOI] [PubMed] [Google Scholar]
- 20. Lyles KW, Colón‐Emeric CS, Magaziner JS, et al. Zoledronic acid and clinical fractures and mortality after hip fracture. N Engl J Med. 2007;357(18):1799‐1809. [DOI] [PMC free article] [PubMed] [Google Scholar]
- 21. Orwoll E, Ettinger M, Weiss S, et al. Alendronate for the treatment of osteoporosis in men. N Engl J Med. 2000;343(9):604‐610. [DOI] [PubMed] [Google Scholar]
- 22. Cummings SR, Ensrud K, Delmas PD, et al. Lasofoxifene in postmenopausal women with osteoporosis. N Engl J Med. 2010;362(8):686‐696. [DOI] [PubMed] [Google Scholar]
- 23. Reid IR, Horne AM, Mihov B, et al. Fracture prevention with zoledronate in older women with osteopenia. N Engl J Med. 2018;379(25):2407‐2416. [DOI] [PubMed] [Google Scholar]
- 24. Chesnut CH 3rd, Skag A, Christiansen C, et al. Effects of oral ibandronate administered daily or intermittently on fracture risk in postmenopausal osteoporosis. J Bone Miner Res. 2004;19(8):1241‐1249. [DOI] [PubMed] [Google Scholar]
- 25. Black DM, Delmas PD, Eastell R, et al. Once‐yearly zoledronic acid for treatment of postmenopausal osteoporosis. N Engl J Med. 2007;356(18):1809‐1822. [DOI] [PubMed] [Google Scholar]
- 26. Recker R, Stakkestad JA, Chesnut CH III, et al. Insufficiently dosed intravenous ibandronate injections are associated with suboptimal antifracture efficacy in postmenopausal osteoporosis. Bone. 2004;34(5):890‐899. [DOI] [PubMed] [Google Scholar]
- 27. Bouxsein ML, Eastell R, Lui LY, et al. Change in bone density and reduction in fracture risk: a meta‐regression of published trials. J Bone Miner Res. 2019;34(4):632‐642. [DOI] [PubMed] [Google Scholar]
- 28. Miller PD, Hattersley G, Riis BJ, et al. Effect of abaloparatide vs placebo on new vertebral fractures in postmenopausal women with osteoporosis: a randomized clinical trial. JAMA. 2016;316(7):722‐733. [DOI] [PubMed] [Google Scholar]
- 29. Riggs BL, Hodgson SF, O'Fallon WM, et al. Effect of fluoride treatment on the fracture rate in postmenopausal women with osteoporosis. N Engl J Med. 1990;322:802‐809. [DOI] [PubMed] [Google Scholar]
- 30. Greenspan SL, Bone HG, Ettinger MP, et al. Effect of recombinant human parathyroid hormone (1‐84) on vertebral fracture and bone mineral density in postmenopausal women with osteoporosis: a randomized trial. Ann Intern Med. 2007;146(5):326‐339. [DOI] [PubMed] [Google Scholar]
- 31. McClung MR, O'Donoghue ML, Papapoulos SE, et al. Odanacatib for the treatment of postmenopausal osteoporosis: results of the LOFT multicentre, randomised, double‐blind, placebo‐controlled trial and LOFT extension study. Lancet Diabetes Endocrinol. 2019;7(12):899‐911. [DOI] [PubMed] [Google Scholar]
- 32. Reginster JY, Christiansen C, Roux C, Fechtenbaum J, Rouillon A, Tou KP. Intermittent cyclic tiludronate in the treatment of osteoporosis. Osteoporos Int. 2001;12(3):169‐177. [DOI] [PubMed] [Google Scholar]
- 33. Chesnut C III, Silverman S, Andriano K, et al. A randomized trial of nasal spray salmon calcitonin in postmenopausal women with established osteoporosis: the Prevent Recurrence of Osteoporotic Fractures study. Am J Med. 2000;109:267‐276. [DOI] [PubMed] [Google Scholar]
- 34. Watts NB, Harris ST, Genant HK, et al. Intermittent cyclical etidronate treatment of postmenopausal osteoporosis. N Engl J Med. 1990;323:73‐79. [DOI] [PubMed] [Google Scholar]
- 35. McCloskey E, Selby P, Davies M, et al. Clodronate reduces vertebral fracture risk in women with postmenopausal or secondary osteoporosis: results of a double‐blind, placebo‐controlled 3‐year study. J Bone Miner Res. 2004;19(5):728‐736. [DOI] [PubMed] [Google Scholar]
- 36. Saag KG, Petersen J, Brandi ML, et al. Romosozumab or alendronate for fracture prevention in women with osteoporosis. N Engl J Med. 2017;377(15):1417‐1427. [DOI] [PubMed] [Google Scholar]
- 37. Cosman F, Crittenden DB, Adachi JD, et al. Romosozumab treatment in postmenopausal women with osteoporosis. N Engl J Med. 2016;375(16):1532‐1543. [DOI] [PubMed] [Google Scholar]
- 38. Stakkestad JA, Benevolenskaya LI, Stepan JJ, et al. Intravenous ibandronate injections given every three months: a new treatment option to prevent bone loss in postmenopausal women. Ann Rheum Dis. 2003;62(10):969‐975. [DOI] [PMC free article] [PubMed] [Google Scholar]
- 39. Roschger P, Fratzl P, Klaushofer K, Rodan G. Mineralization of cancellous bone after alendronate and sodium fluoride treatment: a quantitative backscattered electron imaging study on minipig ribs. Bone. 1997;20(5):393‐397. [DOI] [PubMed] [Google Scholar]
- 40. Fratzl P, Schreiber S, Roschger P, Lafage MH, Rodan G, Klaushofer K. Effects of sodium fluoride and alendronate on the bone mineral in minipigs: a small‐angle X‐ray scattering and backscattered electron imaging study. J Bone Miner Res. 1996;11(2):248‐253. [DOI] [PubMed] [Google Scholar]
- 41. Lafage MH, Balena R, Battle MA, et al. Comparison of alendronate and sodium fluoride effects on cancellous and cortical bone in minipigs. A one‐year study. J Clin Invest. 1995;95(5):2127‐2133. [DOI] [PMC free article] [PubMed] [Google Scholar]
Associated Data
This section collects any data citations, data availability statements, or supplementary materials included in this article.
Data Availability Statement
Data Sharing Statement As stated above, all study data were acquired by requesting IPD from study sponsors. An overarching data use agreement was created between all parties and individual data use agreements were created between individual study sponsors, FNIH and UCSF. Per the data sharing agreements that we have with each sponsor, the data can be used for surrogate marker analyses including any surrogate qualification processes with regulatory authorities. However, other uses of the data are restricted by this agreement and UCSF is not allowed to share the data.