

Abstract
Objective
Guselkumab, a human monoclonal antibody specific to interleukin‐23p19, demonstrated efficacy and safety versus placebo through week 24 of the phase III DISCOVER‐2 trial in biologic‐naive patients with psoriatic arthritis (PsA). Here we report 1‐year DISCOVER‐2 findings.
Methods
Adults with active PsA (≥5 swollen and ≥5 tender joints; C‐reactive protein level ≥0.6 mg/dl) despite standard nonbiologic treatment were randomized to receive subcutaneous injections of guselkumab 100 mg every 4 weeks, guselkumab 100 mg at week 0, week 4 and every 8 weeks thereafter, or placebo with crossover to guselkumab 100 mg every 4 weeks at week 24. We primarily evaluated clinical efficacy through week 52 by imputing missing data (nonresponse for categorical end points; no change/using multiple imputation for continuous end points). Observed radiographic scores and adverse events (AEs) were summarized.
Results
Of 739 randomized, treated patients, 93% completed week 52. The proportions of patients in whom a ≥20% improvement from baseline in American College of Rheumatology criteria (ACR20) was achieved were maintained after week 24, reaching 71% (173 of 245) and 75% (185 of 248) for patients randomized to receive treatment every 4 weeks or every 8 weeks, respectively, by week 52. The proportions of patients in whom ACR50/ACR70 and skin responses, minimal or very low disease activity, and dactylitis or enthesitis resolution were achieved at week 24 were also maintained through week 52. Further, low levels of radiographic progression, along with improvements in physical function and health‐related quality of life, were sustained through week 52 with continued guselkumab treatment. Few patients experienced serious infections through week 52, with no evidence of a dosing regimen response or increase from weeks 0–24 (4 of 493 [0.8%]) to weeks 24–52 (3 of 493 [0.6%]) among guselkumab‐randomized patients. No patient developed an opportunistic infection or died.
Conclusion
In biologic‐naive PsA patients, guselkumab provided sustained improvements across diverse manifestations and maintained a favorable risk–benefit profile through week 52.
INTRODUCTION
Psoriatic arthritis (PsA), a heterogenous chronic inflammatory disorder, can encompass peripheral arthritis, psoriasis, enthesitis, dactylitis, and axial involvement. Current therapies vary in their ability to address the protean manifestations of PsA. Not all patients respond to each treatment, and some who experience an initial response lose the effect over time (1, 2, 3). In the Corrona registry, ~30% of tumor necrosis factor inhibitors (TNFi) started by PsA patients were discontinued within 1 year, and biologic‐exposed patients demonstrated lower TNFi drug persistence than biologic‐naive patients (4). The high proportion (80%) of these patients discontinuing the index TNFi because of inadequate efficacy (5) highlights the need to consider other modes of action to treat these PsA patients. Guselkumab (Janssen Biotech), a fully human monoclonal antibody specific to the p19 subunit of interleukin‐23 (IL‐23), was approved to treat adults with moderate‐to‐severe plaque psoriasis in 2017. More recently, guselkumab was the first selective IL‐23 inhibitor approved in the US, as well as in Canada, Ecuador, and Brazil, to treat active PsA (6).
IL‐23, comprising a p19 subunit and a p40 subunit shared with IL‐12, is an upstream regulatory cytokine that modulates the expansion and survival of human CD4+ IL‐17–producing Th17 cells, CD8+ IL‐17–producing Tc17 cells, and innate immune cell subsets, all of which represent sources of downstream effector cytokines (e.g., IL‐17A, IL‐17F, TNF, and IL‐22) known to drive inflammatory disease (7, 8, 9, 10). Preclinical data suggested that the IL‐23/Th17 pathway, and overexpression of IL‐23 in particular, is a key driver of arthritis, psoriasiform lesions, enthesitis, and sacroiliitis, all features of PsA (11, 12).
Guselkumab demonstrated robust benefit in patients with moderate‐to‐severe psoriasis (13, 14, 15). The high specificity and affinity of guselkumab for the IL‐23p19 subunit (16) augured the ability of guselkumab to also treat PsA, and clinical data have borne that out (17, 18, 19). In recent reports of the 24‐week placebo‐controlled portions of 2 pivotal trials of guselkumab in PsA (DISCOVER‐1 [ClinicalTrials.gov identifier: NCT03162796] and DISCOVER‐2 [ClinicalTrials.gov identifier: NCT03158285]), guselkumab 100 mg every 4 weeks or every 8 weeks significantly improved signs and symptoms of joint and skin disease (18, 19), and guselkumab 100 mg every 4 weeks significantly inhibited the progression of structural damage (19).
Herein we report the results of DISCOVER‐2, the larger of these pivotal trials, through 52 weeks. Results include 1‐year clinical and radiographic data for biologic‐naive patients randomized to receive guselkumab, and the effects of guselkumab in patients randomized to receive placebo followed by guselkumab beginning at week 24.
PATIENTS AND METHODS
Patients
As previously reported, 739 adults with PsA were enrolled and treated in DISCOVER‐2 (19). Participants had active PsA (≥5 tender and ≥5 swollen joints; C‐reactive protein [CRP] ≥0.6 mg/dl) despite standard nonbiologic treatment (disease‐modifying antirheumatic drugs [DMARDs], apremilast, or nonsteroidal antiinflammatory drugs [NSAIDs]) and were naive for biologic agents and JAK inhibitors. Patients provided written informed consent.
Study design
This phase III, randomized, double‐blind, placebo‐controlled, 3‐arm study was conducted at 118 sites (in Bulgaria, the Czech Republic, Estonia, Latvia, Lithuania, Malaysia, Poland, Russia, Spain, Taiwan, Turkey, Ukraine, and the US). The trial design includes a 6‐week screening period (beginning July 13, 2017), a 100‐week treatment phase (placebo‐controlled from week 0 to week 24 and active treatment from week 24 to week 100), and 12 weeks of safety follow‐up. Data collected through week 52 (last visit September 10, 2019) are reported herein.
Participants were randomized 1:1:1 to receive subcutaneous injections of guselkumab 100 mg every 4 weeks; guselkumab 100 mg at week 0, week 4, and then every 8 weeks; or placebo every 4 weeks until starting guselkumab 100 mg every 4 weeks at week 24. Central randomization and blinding details were previously reported (19). Patients could continue baseline use of stable doses of selected nonbiologic DMARDs (limited to either methotrexate ≤25 mg/week, sulfasalazine ≤3 gm/day, hydroxychloroquine ≤400 mg/day, or leflunomide ≤20 mg/day), oral glucocorticoids ≤10 mg/day of prednisone or equivalent dose, and NSAIDs or other analgesics up to regionally approved doses.
DISCOVER‐2 (ClinicalTrials.gov identifier: NCT03158285) is being conducted according to Declaration of Helsinki and Good Clinical Practice guidelines. The protocol was approved by governing ethics bodies.
Procedures
Study visits were scheduled for screening, baseline (week 0), week 2, and week 4, and then every 4 weeks. Independent assessors evaluated joints for tenderness (n = 68) and swelling (n = 66, excluding hips), enthesitis (Leeds Enthesitis Index [LEI]; total score 0–6 as summed for 6 nontender [score 0] or tender [score 1] anatomic sites) (20), and dactylitis (Dactylitis Severity Score; total score 0–60 as summed for each finger and toe, scored on a scale of 0–3, where 0 = no dactylitis, 1 = mild dactylitis, 2 = moderate dactylitis, and 3 = severe dactylitis) (21, 22). Patients reported their pain level (on a 0–10‐cm visual analog scale [VAS]), global impression of disease activity (0–10‐cm VAS), and physical function (Health Assessment Questionnaire [HAQ] disability index [DI] [0–3 scale]) (23). Investigators completed the global assessment of disease activity (0–10‐cm VAS), and serum CRP level (mg/dl) was determined.
Single radiographs of the hands (posteroanterior) and feet (anteroposterior), obtained at week 0 and week 24 (or at discontinuation if before week 24) for the first reading session and at week 0, week 24, and week 52 (or at discontinuation if between weeks 24 and 52) for the second reading session, were independently evaluated by 2 central primary readers, with a third reader for adjudication (assignment of readers to primary reader/adjudicator roles differed between reading sessions; see Supplementary Methods, available on the Arthritis & Rheumatology website at http://onlinelibrary.wiley.com/doi/10.1002/art.41553/abstract). Readers were blinded with regard to clinical data and radiograph ordering when scoring films using the modified Sharp/van der Heijde score (SHS) for PsA (24).
Investigators assessed the severity of skin disease using the Investigator’s Global Assessment of psoriasis (IGA; total score 0–4 as averaged across induration, erythema, and scaling, graded on a scale of 0–4, where 0 = cleared, 1 = minimal, 2 = mild, 3 = moderate, and 4 = severe) (25). The Psoriasis Area and Severity Index (PASI; total score 0–72) (26) assessed the extent (percentage of body surface area [BSA] affected) and degree of associated redness, thickness, and scaling (each graded on a scale of 0–4, where 0 = none and 4 = maximum).
The Short Form 36 (SF‐36) health survey (27) physical component summary (PCS) and mental component summary (MCS) scores were used to assess health‐related quality of life (HRQoL). The presence of suicidal ideation/behavior or nonsuicidal self‐injurious behavior was surveyed using electronic Columbia‐Suicide Severity Rating Scale [eC‐SSRS] questionnaires (28). Adverse events (AEs) and routine hematology and chemistry parameters were monitored. Details of guselkumab pharmacokinetic and immunogenicity assessments have been reported previously (19).
Outcome measures
Outcome measures assessed through week 52 included American College of Rheumatology criteria for 20% improvement (ACR20), ACR50, and ACR70 responses; change from baseline in the Disease Activity Score in 28 joints using the CRP; IGA skin response (score 0/1 and ≥2 grade improvement) and skin response assessed as ≥75%, ≥90%, or 100% improvement in the PASI (PASI75, PASI90, and PASI100, respectively), all among patients with ≥3% BSA with psoriasis and IGA ≥2 at baseline; changes from week 0 to week 2, week 24 to week 52, and week 0 to week 52 in total PsA‐modified SHS score and component erosion and joint space narrowing subscores, derived from week 0, week 24, and week 52 images read in the second session; change from baseline in HAQ DI score and proportions of patients with a HAQ DI response (reduction ≥0.35 among patients with a baseline score ≥0.35) or HAQ DI score normalized to ≤0.5; resolution of enthesitis and changes from baseline in LEI scores in patients with enthesitis at baseline and resolution of dactylitis and changes from baseline in Dactylitis Severity Score in patients with dactylitis at baseline, both pooled across DISCOVER‐1 and DISCOVER‐2 (see Statistical analysis); changes from baseline in SF‐36 PCS and MCS scores; and achievement of minimal disease activity (29) and very low disease activity (30).
Safety outcomes included AEs, serious AEs (SAEs), AEs resulting in discontinuation of study drug, infections, serious infections, injection‐site reactions, malignancies, major adverse cardiovascular events (MACE; predefined as cardiovascular death, nonfatal myocardial infarction, or nonfatal stroke), suicidal ideation or behavior (based on eC‐SSRS questionnaire or reported AEs), and clinical laboratory abnormalities classified by National Cancer Institute (NCI) Common Terminology Criteria for AEs (CTCAE) grade.
Statistical analysis
DISCOVER‐2 sample size estimates were previously reported (19). All patients who continued treatment at week 24 received guselkumab; no formal hypothesis testing was planned.
As previously reported (19), treatment failure rules were applied to all clinical efficacy analyses through week 24, i.e., patients who discontinued study treatment, terminated study participation, initiated or increased doses of DMARDs or oral glucocorticoids, or initiated protocol‐prohibited PsA treatment were considered nonresponders for binary end points, or as having no change from baseline for continuous end points. Missing data were imputed as nonresponders for binary end points, and using multiple imputation (MI; assumed to be missing‐at‐random) for continuous end points. Radiographic data through week 24 were imputed using MI with no treatment failure rules. The week 24 data have been reported previously (19) and are provided herein as context for evaluating week 52 data.
The statistical analysis plan prespecified summarizing observed efficacy data from week 24 to week 52 for patients continuing study treatment after week 24 (n = 712) (Figure 1). We also evaluated clinical (but not radiographic) efficacy data in all treated patients by randomized group (n = 739) with post hoc application of missing data imputation rules. Data missing due to treatment discontinuation were considered nonresponders for binary end points, or as having no change from baseline for continuous end points. Data missing for other reasons were imputed as nonresponders for binary end points, and using MI (assumed to be missing‐at‐random) for continuous end points. In this analysis, data provided for the 246 patients randomized to receive placebo followed by guselkumab every 4 weeks included 238 patients who crossed over to guselkumab treatment every 4 weeks and 8 patients who received only placebo prior to discontinuing treatment. Results based on these imputed data are the focus of this article; observed ACR responses are shown for reference.
Figure 1.
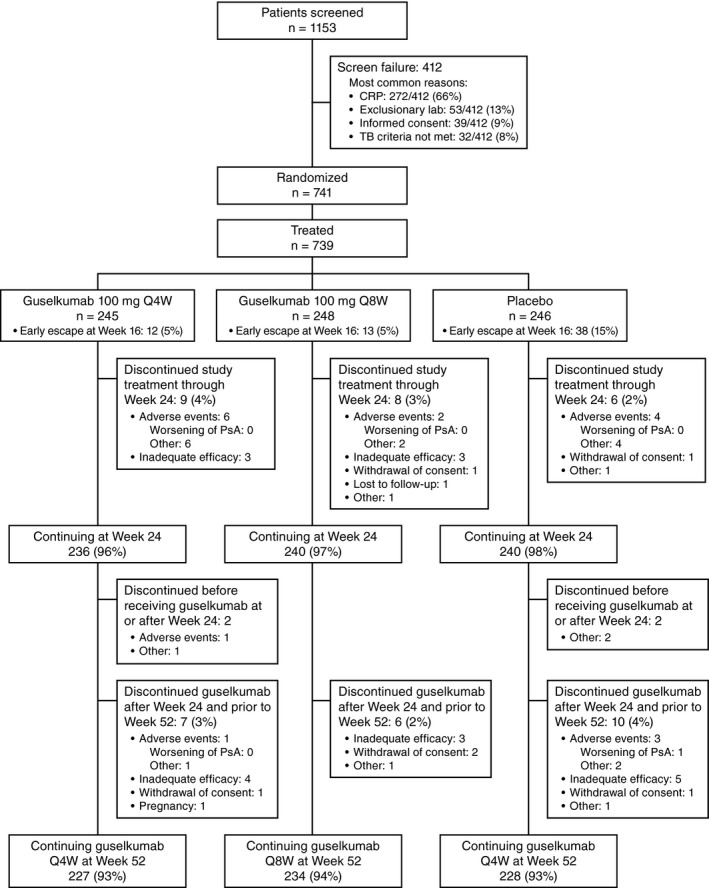
Disposition of the patients with psoriatic arthritis (PsA) through week 52 of the DISCOVER‐2 trial. CRP = C‐reactive protein; TB = tuberculosis; Q4W = every 4 weeks.
Observed changes in SHS scores derived from the study’s second reading session were summarized via descriptive statistics for patients who continued treatment at week 24 (see Supplementary Figure 1, available on the Arthritis & Rheumatology website at http://onlinelibrary.wiley.com/doi/10.1002/art.41553/abstract). Cumulative probability plots show the observed cumulative distribution of these scores, ranked from the lowest to highest (31), by study period (i.e., week 0 to week 24 and week 24 to week 52). Among patients with observed scores at baseline and ≥1 in‐window postbaseline visit, a post hoc analysis was conducted to estimate annual radiographic progression by randomized treatment group. Further details of the analysis, which used linear extrapolation and MI of radiographic scores derived from both the first and second reading sessions, are provided in the Supplementary Methods.
To increase sample size and reliability, dactylitis and enthesitis data among patients with these conditions at baseline were prespecified to be summarized by pooling data across DISCOVER‐1 (18) and DISCOVER‐2 (19) at week 24. Pooled results are also reported at week 52 (reported in the main text); individual DISCOVER‐1 and DISCOVER‐2 data are summarized in the Supplementary Results, available on the Arthritis & Rheumatology website at http://onlinelibrary.wiley.com/doi/10.1002/art.41553/abstract.
AEs were summarized for treated patients who experienced at least 1 event. To account for the shorter period of placebo (24 weeks) compared to active treatment (52 weeks), incidences of AEs, SAEs, AEs leading to discontinuation of study agent, infections, and serious infections were also summarized as the number of patients or the number of events (Supplementary Methods) per 100 patient‐years of follow‐up, along with corresponding exact 95% confidence intervals (95% CIs). Deriving from the incidences of patients with these AEs in the combined guselkumab and placebo groups, the number needed to harm (NNH), i.e., patients needing to be treated for an additional AE, was calculated as: R0 = 1−e(−Placebo patients with events/Placebo patient‐years); R1 = 1−e(−Guselkumab patients with events/Guselkumab patient‐years); and NNH = 1/(R1 − R0). Only positive NNH values are reported.
RESULTS
Patient disposition and baseline characteristics
The vast majority of randomized and treated patients (689 of 739 [93%]) completed the study through week 52; 7% of the patients discontinued study agent early, most commonly due to AEs or inadequate efficacy. The frequency of discontinuation was comparable across treatment groups (Figure 1). Of the patients who were randomized to receive placebo, 238 crossed over to guselkumab 100 mg every 4 weeks, and a total of 731 patients received guselkumab 100 mg for 608 patient‐years (average follow‐up 43.4 weeks, or 0.8 years).
Baseline characteristics of the 739 patients in the DISCOVER‐2 study have been reported previously (19). Briefly, female (48%) and male (52%) participants had PsA for, on average, >5 years with no biologic treatment. At baseline, participants averaged 12–13 swollen and 20–22 tender joints, with median serum CRP levels of 1.2–1.3 mg/dl, across randomized groups. Nearly three‐fourths (73%) of the patients had ≥3% BSA psoriasis involvement and an IGA score of ≥2 at week 0, while only 2% of the patients had clear skin (IGA 0) at enrollment. Approximately one‐half had a psoriasis IGA score of 3–4 (46%) or dactylitis (45%), and two‐thirds had enthesitis (68%). Patients started the study with impaired physical function and HRQoL, as evidenced by their mean HAQ DI scores (1.2–1.3; range 0–3), mean SF‐36 PCS scores (32.4–33.3), and mean SF‐36 MCS scores (47.2–48.4) (US general population norms 50.0). Baseline radiographic data showed an imbalance in total PsA‐modified SHS scores between the guselkumab every 4 weeks group and the other 2 treatment groups (Table 1).
Table 1.
Observed PsA‐modified SHS from the second reading session of DISCOVER‐2 (images obtained at week 0, week 24, and week 52)*
| Guselkumab every 4 weeks | Guselkumab every 8 weeks | Placebo (weeks 0–24) → guselkumab every 4 weeks (weeks 24–52) | ||||||||||
|---|---|---|---|---|---|---|---|---|---|---|---|---|
|
Baseline (n = 232) |
Weeks 0–24 (n = 232) |
Weeks 24–52 (n = 229) |
Weeks 0–52 (n = 229) |
Baseline (n = 238) |
Weeks 0–24 (n = 238) |
Weeks 24–52 (n = 235) |
Weeks 0–52 (n = 235) |
Baseline (n = 231) |
Weeks 0–24 (n = 231) |
Weeks 24–52 (n = 230) |
Weeks 0–52 (n = 230) |
|
| Baseline total PsA‐modified SHS | ||||||||||||
| Mean ± SD | 25.37 ± 40.24 | – | – | – | 22.39 ± 37.87 | – | – | – | 22.96 ± 39.45 | – | – | – |
| Median | 8.00 | – | – | – | 10.50 | – | – | – | 9.00 | – | – | – |
| Range | (0.0–283.0) | – | – | – | (0.0–254.5) | – | – | – | (0.0–204.4) | – | – | – |
| IQR | (3.00–28.75) | – | – | – | (2.50–26.50) | – | – | – | (3.00–22.00) | – | – | – |
| Mean ± SD change in PsA‐modified SHS | ||||||||||||
| Total† | – | 0.46 ± 2.46 | 0.62 ± 2.53 | 1.07 ± 3.84 | – | 0.73 ± 2.50 | 0.23 ± 1.81 | 0.97 ± 3.62 | – | 1.00 ± 3.19 | 0.25 ± 1.64 | 1.25 ± 3.51 |
| Erosion | – | 0.31 ± 1.88 | 0.39 ± 1.72 | 0.70 ± 2.63 | – | 0.57 ± 2.04 | 0.10 ± 1.42 | 0.67 ± 2.71 | – | 0.75 ± 2.31 | 0.17 ± 1.28 | 0.92 ± 2.50 |
| JSN | – | 0.15 ± 0.97 | 0.23 ± 1.09 | 0.38 ± 1.63 | – | 0.16 ± 0.78 | 0.13 ± 0.70 | 0.29 ± 1.27 | – | 0.25 ± 1.14 | 0.07 ± 0.64 | 0.33 ± 1.36 |
Intraclass correlation (ICC) estimates for the total psoriatic arthritis (PsA)–modified Sharp/van der Heijde score (SHS) at baseline, week 24, and week 52 were 0.92, 0.93, and 0.93, respectively. ICC estimates for changes in the total PsA‐modified SHS during weeks 0–24, weeks 24–52, and weeks 0–52 were 0.69, 0.58, and 0.76, respectively. IQR = interquartile range; JSN = joint space narrowing.
The smallest detectable change in the total PsA‐modified SHS was 1.85 for weeks 0–24, 1.91 for weeks 24–52, and 2.39 for weeks 0–52.
Pharmacokinetics and immunogenicity
See Supplementary Results for details on the pharmacokinetics and immunogenicity of guselkumab.
Efficacy
As previously reported, the DISCOVER‐2 primary end point was met, i.e., an ACR20 response was achieved at week 24 in significantly greater proportions of patients treated with guselkumab every 4 weeks (64%) and patients treated with guselkumab every 8 weeks (64%) than patients treated with placebo (33%) (both P < 0.0001) (19). Numerical increases in the proportions of patients in whom an ACR20 response was achieved were observed after week 24. By week 52, 71% of the patients randomized to receive guselkumab every 4 weeks (173 of 245) and 75% of the patients randomized to receive guselkumab every 8 weeks (185 of 248) had ≥20% improvement from baseline in ACR components (Figure 2A). An ACR50 response was achieved at week 52 in nearly one‐half, and an ACR70 response was achieved at week 52 in more than one‐quarter of the patients randomized to receive guselkumab every 4 weeks or every 8 weeks (Figures 2C and E). Consistent patterns were evident for observed ACR responses (Figures 2B, D, and F).
Figure 2.
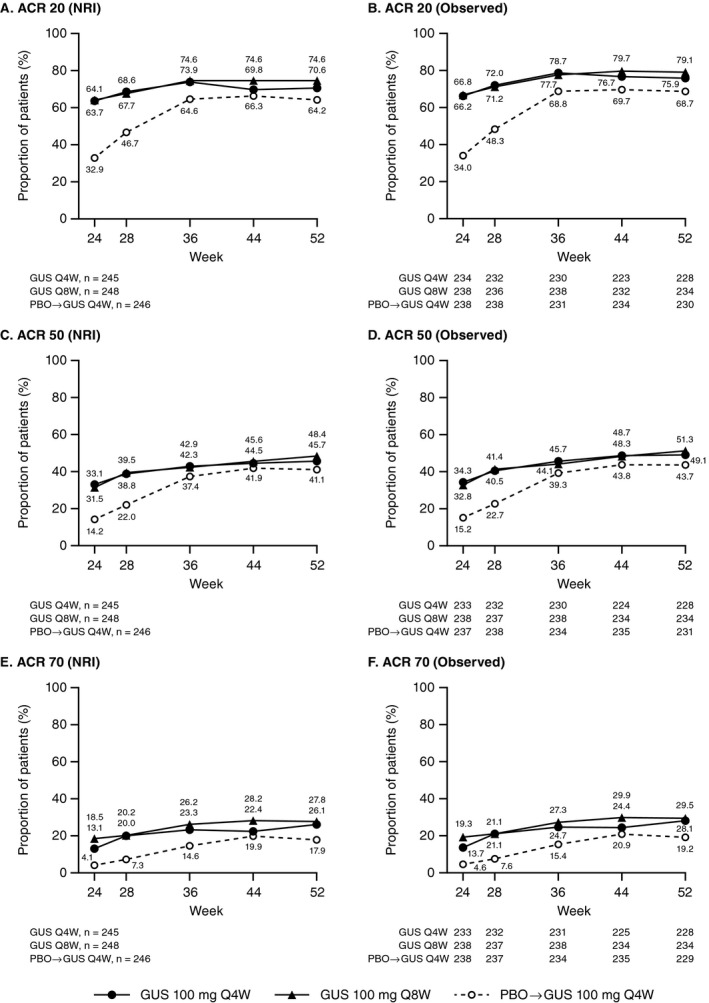
Proportions of patients with psoriatic arthritis who met the American College of Rheumatology criteria for 20% improvement (ACR20), ACR50, or ACR70 from week 24 through week 52. A, C, and E, Proportions of patients treated with guselkumab every 4 weeks (GUS Q4W), guselkumab every 8 weeks, or placebo (PBO) followed by guselkumab every 4 weeks who met the ACR20 (A), ACR50 (C), and ACR70 (E) criteria, with application of data handling rules using nonresponder imputation (NRI; see Patients and Methods). Week 24 data were reported previously (19) and are shown here for reference. Among 246 patients randomized to receive placebo, 238 crossed over to guselkumab treatment every 4 weeks (after week 24 response assessments), and 8 received placebo only before discontinuing treatment. B, D, and F, Observed data for the proportion of patients in each treatment group who met the ACR20 (B), ACR50 (D), and ACR70 (F) criteria. Observed data are shown for patients continuing study treatment at week 24, as prespecified in the statistical analysis plan.
For radiographs obtained at week 0, week 24, and week 52, intraclass correlation coefficients (ICCs) indicated good reader reliability for absolute scores (ICC 0.92–0.93) and moderate reader reliability for change scores (ICC 0.58–0.76) (Table 1). The smallest detectable changes in PsA‐modified SHS total scores were 1.85 during weeks 0–24, 1.91 during weeks 24–52, and 2.39 during weeks 0–52 (Supplementary Figure 1). In the guselkumab every 4 weeks group, observed mean changes in total PsA‐modified SHS scores were 0.46 and 0.62 during weeks 0–24 and weeks 24–52, respectively. Respective mean changes in the guselkumab every 8 weeks group were 0.73 and 0.23 (Table 1 and Supplementary Figure 1).
Among patients with observed PsA‐modified SHS scores at baseline and ≥1 in‐window postbaseline visit, the least squares mean (LSM) change from baseline at week 52, based on a post hoc analysis employing linear extrapolation and MI of scores from both reading sessions (see Supplementary Methods), was estimated to be 2.16 for placebo (95% CI 1.56, 2.75). The estimated annual LSM changes for guselkumab every 4 weeks (1.10 [95% CI 0.48, 1.71]) and guselkumab every 8 weeks (1.13 [95% CI 0.52, 1.73]) yielded LSM differences from placebo of −1.06 (95% CI −1.89, −0.23) and −1.03 (95% CI −1.85, −0.20), respectively.
When pooling DISCOVER‐1 and DISCOVER‐2 patients with dactylitis or enthesitis at baseline, rates of resolution and improvements in dactylitis severity or LEI scores seen at week 24 were maintained at week 52, at which time 75% of the patients who were randomized to receive guselkumab every 4 weeks or every 8 weeks had resolution of dactylitis and 58% had resolution of enthesitis (Table 2). Response patterns within each trial were consistent (Supplementary Tables 1 and 2, available on the Arthritis & Rheumatology website at http://onlinelibrary.wiley.com/doi/10.1002/art.41553/abstract).
Table 2.
Pooled DISCOVER‐1 and DISCOVER‐2 dactylitis and enthesitis data through week 52*
|
Guselkumab every 4 weeks (n = 373)† |
Guselkumab every 8 weeks (n = 375)† |
Placebo (weeks 0–24) → guselkumab every 4 weeks (weeks 24–52) |
||||
|---|---|---|---|---|---|---|
| Week 24‡ | Week 52 | Week 24‡ | Week 52 | Week 24‡ | Week 52 | |
| No. with dactylitis at week 0 | 159 | 159 | 160 | 160 | 154¶ | 154 |
| % with resolution | 63.5 | 74.8 | 59.4 | 75.6 | 42.2 | 70.1 |
| LSM change (95% CI) | −6.0 (−6.8, −5.1) | −6.5 (−7.1, −5.8) | −6.1 (−6.9, −5.3) | −7.1 (−7.8, −6.5) | −4.2 (−5.0, −3.4) | −6.6 (−7.3, −5.9) |
| No. with enthesitis at week 0 | 243 | 243 | 230 | 230 | 255# | 255 |
| % with resolution | 44.9 | 57.6 | 49.6 | 57.8 | 29.4 | 61.6 |
| LSM change (95% CI) | −1.6 (−1.8, −1.4) | −1.8 (−2.0, −1.6) | −1.5 (−1.7, −1.3) | −1.8 (−2.0, −1.6) | −1.0 (−1.2, −0.8) | −1.8 (−2.0, −1.7) |
Data are summarized by treatment group with application of missing data handling rules (see Patients and Methods). LSM = least squares mean; 95% CI = 95% confidence interval.
Numbers of pooled randomized patients.
Week 24 data were previously reported (19) and are shown here for reference.
Of these 372 patients, 352 crossed over to guselkumab treatment every 4 weeks (post–week 24 response assessments); 20 received placebo only before discontinuing treatment.
Of these 154 patients, 142 crossed over to guselkumab treatment every 4 weeks (post–week 24 response assessments); 12 received placebo only before discontinuing treatment.
Of these 255 patients, 243 crossed over to guselkumab treatment every 4 weeks (post–week 24 response assessments); 12 received placebo only before discontinuing treatment.
In patients with ≥3% of BSA with psoriasis involvement and an IGA score of ≥2 at baseline, the robust skin response rates at week 24 afforded by guselkumab every 4 weeks and every 8 weeks were maintained at week 52, at which time 79% and 74% of patients, respectively, had an IGA score of 0/1 and a ≥2‐grade decrease from baseline, and 62% and 58%, respectively, achieved clear skin (IGA 0). Also at week 52, a PASI75 response was achieved in 86% of patients treated with guselkumab every 4 weeks and 86% of those treated with guselkumab every 8 weeks, a PASI90 response was achieved in 77% of patients treated with guselkumab every 4 weeks and 74% of patients treated with guselkumab every 8 weeks, and a PASI100 response was achieved in 58% of patients treated with guselkumab every 4 weeks and 53% of patients treated with guselkumab every 8 weeks (Table 3).
Table 3.
Summary of skin, patient‐reported, and composite end point outcomes through week 52 of the DISCOVER‐2 trial*
| Guselkumab every 4 weeks | Guselkumab every 8 weeks | Placebo (weeks 0–24) → guselkumab every 4 weeks (weeks 24–52) | ||||
|---|---|---|---|---|---|---|
| Week 24† | Week 52 | Week 24† | Week 52 | Week 24† | Week 52 | |
| No. with ≥3% BSA psoriasis and IGA ≥2 at week 0 | 184 | 184 | 176 | 176 | 183‡ | 183‡ |
| IGA score of 0/1 and ≥2‐grade decrease | 68.5 | 79.3 | 70.5 | 74.4 | 19.1 | 79.2 |
| IGA score of 0 | 50.5 | 62.5 | 50.0 | 58.0 | 7.7 | 62.8 |
| PASI75 | 78.3 | 86.4 | 79.0 | 85.8 | 23.0 | 83.1 |
| PASI90 | 60.9 | 76.6 | 68.8 | 74.4 | 9.8 | 72.1 |
| PASI100 | 44.6 | 57.6 | 45.5 | 52.8 | 2.7 | 51.9 |
| No. with HAQ DI available | 245 | 245 | 248 | 248 | 246§ | 246§ |
| LSM change (95% CI) |
−0.40 (−0.46, −0.34) |
−0.49 (−0.56, −0.42) |
−0.37 (−0.43, −0.31) |
−0.45 (−0.52, −0.38) |
−0.13 (−0.19, −0.07) |
−0.35 (−0.42, −0.29) |
| No. with HAQ DI ≥0.5 at week 0 | 225 | 225 | 221 | 221 | 227 | 227 |
| HAQ DI <0.5 | 25.8 | 32.9 | 20.8 | 25.3 | 12.3 | 24.7 |
| No. with HAQ DI ≥0.35 at week 0 | 228 | 228 | 228 | 228 | 236¶ | 236¶ |
| ≥0.35 improvement | 56.1 | 58.8 | 50.0 | 57.5 | 31.4 | 47.5 |
| No. with SF‐36 scores available | 245 | 245 | 248 | 248 | 246§ | 246§ |
| PCS, LSM change (95% CI) |
7.04 (6.14, 7.94) |
8.64 (7.60, 9.68) |
7.39 (6.50, 8.29) |
8.97 (7.94, 10.00) |
3.42 (2.53, 4.32) |
7.53 (6.49, 8.56) |
| MCS, LSM change (95% CI) |
4.22 (3.14, 5.29) |
4.43 (3.37, 5.49) |
4.17 (3.10, 5.23) |
4.31 (3.26, 5.36) |
2.14 (1.07, 3.22) |
4.04 (2.99, 5.10) |
| No. with data on composite indices available | 245 | 245 | 248 | 248 | 246§ | 246§ |
| Minimal disease activity | 18.8 | 34.3 | 25.0 | 31.0 | 6.1 | 29.7 |
| Very low disease activity | 4.9 | 11.4 | 4.4 | 16.1 | 1.2 | 6.5 |
Data are summarized by treatment group with application of missing data handling rules (see Patients and Methods). Except where indicated otherwise, values are the percent of patients. BSA = body surface area; IGA = Investigator’s Global Assessment of psoriasis; PASI75 = ≥75% improvement in the Psoriasis Area and Severity Index; HAQ DI = Health Assessment Questionnaire disability index; LSM = least squares mean; 95% CI = 95% confidence interval; SF‐36 = Short Form 36; PCS = physical component summary; MCS = mental component summary.
Week 24 data were previously reported (19) and are shown here for reference.
Of these 183 patients, 176 crossed over to guselkumab treatment every 4 weeks (post–week 24 response assessments); 7 received placebo only before discontinuing treatment.
Of these 246 patients, 238 crossed over to guselkumab treatment every 4 weeks (post–week 24 response assessments); 8 received placebo only before discontinuing treatment.
Of these 236 patients, 229 crossed over to guselkumab treatment every 4 weeks (post–week 24 response assessments); 7 received placebo only before discontinuing treatment.
Improvements in physical function seen in the guselkumab every 4 weeks and every 8 weeks groups at week 24 were sustained through week 52 (LSM change in HAQ DI −0.49 and −0.45, respectively). Among patients with a baseline HAQ DI score ≥0.35 in the guselkumab every 4 weeks and every 8 weeks groups, nearly 60% had improvements in HAQ DI ≥0.35 at week 52. Also by week 52, 33% and 25% of the patients in the guselkumab every 4 weeks and every 8 weeks groups, respectively, with a HAQ DI ≥0.5 at baseline saw normalized physical function, i.e., HAQ DI <0.5. Consistently, guselkumab every 4 weeks or every 8 weeks continued to numerically improve physical aspects of HRQoL through week 52, at which time LSM changes in SF‐36 PCS score were 8.6 and 9.0, respectively. The LSM improvements in mental components of HRQoL were maintained through week 52 (SF‐36 MCS score 4.4 and 4.3, respectively) (Table 3).
Utilizing validated PsA composite indices, minimal disease activity was achieved in >30% of the patients in the guselkumab every 4 weeks and guselkumab every 8 weeks groups, and very low disease activity was achieved in 11% and 16% of the patients in the guselkumab every 4 weeks and every 8 weeks groups, respectively, at week 52 (Table 3).
In patients who received guselkumab every 4 weeks from week 24 to week 52 following treatment with placebo, clinical response rates at week 52 (e.g., ACR20 in 64%, IGA score of 0/1 in 79%, HAQ DI response in 48%, and minimal disease activity in 30%) were consistent with those observed in patients randomized to receive guselkumab (Tables 2 and 3 and Figure 2). Also in patients who crossed over from placebo to guselkumab every 4 weeks, mean changes in total PsA‐modified SHS scores were 1.00 from week 0 to week 24 and 0.25 from week 24 to week 52 (Table 1 and Supplementary Figure 1).
Safety
Consistent with findings through week 24 of DISCOVER‐2 (19), the most commonly reported AEs (>5% of patients in any guselkumab treatment group) through week 52 included upper respiratory tract infection (7% of patients randomized to treatment every 4 weeks, 7% of patients randomized to treatment every 8 weeks, and 10 per 100 patient‐years for all guselkumab‐treated patients), nasopharyngitis (7%, 8%, and 9 per 100 patient‐years, respectively), bronchitis (6%, 2%, and 4 per 100 patient‐years, respectively), and investigator‐reported laboratory investigations, including increased alanine aminotransferase (ALT) level (12%, 9%, and 13 per 100 patient‐years, respectively) and increased aspartate aminotransferase (AST) level (7%, 7%, and 5 per 100 patient‐years, respectively). When evaluating AEs with >5 events per 100 patient‐years in any group, common AEs also included neutropenia and leukopenia (Supplementary Table 3, available on the Arthritis & Rheumatology website at http://onlinelibrary.wiley.com/doi/10.1002/art.41553/abstract). Across all AEs, time‐adjusted incidences were 109 and 110 per 100 patient‐years during weeks 0–52 for patients receiving guselkumab every 4 weeks or every 8 weeks, respectively (Table 4).
Table 4.
Patients with AE categories of interest through week 52 of the DISCOVER‐2 trial*
|
Placebo → guselkumab 100 mg every 4 weeks |
Guselkumab 100 mg (weeks 0–52) |
||||
|---|---|---|---|---|---|
|
Placebo (weeks 0–24) |
Every 4 weeks (weeks 24–52) |
Every 4 weeks | Every 8 weeks | All guselkumab | |
| No. of treated patients | 246 | 238† | 245 | 248 | 731 |
| Years of follow‐up, mean | 0.5 | 0.5 | 1.0 | 1.0 | 0.8 |
| Overall patient‐years, no. | 115 | 127 | 239 | 243 | 608 |
| All AEs | |||||
| Patient‐years, no. | 86 | 102 | 140 | 140 | 383 |
| Number (%) of patients | 100 (40.7) | 87 (36.6) | 152 (62.0)‡ | 155 (62.5)‡ | 394 (53.9) |
| Incidence per 100 patient‐years (95% CI) |
116.95 (95.16, 142.25) |
84.94 (68.03, 104.77) |
108.66 (92.07, 127.37) |
110.40 (93.70, 129.21) |
102.95 (93.03, 113.63) |
| SAEs | |||||
| Patient‐years, no. | 113 | 124 | 233 | 238 | 595 |
| Number (%) of patients | 7 (2.8) | 10 (4.2) | 11 (4.5)§ | 10 (4.0)§ | 31 (4.2) |
| Incidence per 100 patient‐years (95% CI) |
6.19 (2.49, 12.76) |
8.04 (3.86, 14.79) |
4.72 (2.36, 8.45) |
4.20 (2.02, 7.73) |
5.21 (3.54, 7.39) |
| AEs causing study agent discontinuation | |||||
| Patient‐years, no. | 114 | 127 | 236 | 242 | 605 |
| Number (%) of patients | 4 (1.6) | 4 (1.7) | 9 (3.7)¶ | 3 (1.2)¶ | 16 (2.2) |
| Incidence per 100 patient‐years (95% CI) |
3.51 (0.96, 8.99) |
3.16 (0.86, 8.08) |
3.81 (1.74, 7.23) |
1.24 (0.26, 3.63) |
2.65 (1.51, 4.30) |
| Infections | |||||
| Patient‐years, no. | 104 | 116 | 197 | 204 | 516 |
| Number (%) of patients | 45 (18.3) | 41 (17.2) | 67 (27.3)# | 71 (28.6)# | 179 (24.5) |
| Incidence per 100 patient‐years (95% CI) |
43.25 (31.55, 57.88) |
35.47 (25.45, 48.11) |
34.09 (26.42, 43.29) |
34.89 (27.25, 44.01) |
34.71 (29.81, 40.19) |
| Serious infections | |||||
| Patient‐years, no. | 115 | 126 | 237 | 241 | 605 |
| Number (%) of patients | 1 (0.4)** | 3 (1.3)†† | 3 (1.2)‡‡ | 3 (1.2)§§ | 9 (1.2) |
| Incidence per 100 patient‐years (95% CI) |
0.87 (0.02, 4.85) |
2.37 (0.49, 6.94) |
1.26 (0.26, 3.69) |
1.24 (0.26, 3.63) |
1.49 (0.68, 2.82) |
95% CI = 95% confidence interval; SAEs = serious adverse events.
These 238 patients received placebo during weeks 0–24; only adverse events reported during weeks 24–52, after starting guselkumab, are summarized.
One hundred thirteen (46.1%) of the patients receiving guselkumab 100 mg every 4 weeks and 114 (46.0%) of the patients receiving guselkumab 100 mg every 8 weeks reported AEs during weeks 0–24 (19).
Eight (3.3%) of the patients receiving guselkumab 100 mg every 4 weeks and 3 (1.2%) of the patients receiving guselkumab 100 mg every 8 weeks reported SAEs during weeks 0–24 (19).
Seven (2.9%) of the patients receiving guselkumab 100 mg every 4 weeks and 2 (0.8%) of the patients receiving guselkumab 100 mg every 8 weeks discontinued study agent due to AEs during weeks 0–24 (19).
Forty‐nine (20.0%) of the patients receiving guselkumab 100 mg every 4 weeks and 40 (16.1%) of the patients receiving guselkumab 100 mg every 8 weeks reported infections during weeks 0–24 (19).
Post‐procedural fistula while receiving placebo prior to week 24 (19).
One patient each with influenza/tracheitis, pericarditis, and pneumonia while receiving guselkumab 100 mg every 4 weeks during weeks 24–52.
One patient each with acute hepatitis B, oophoritis, and influenzal pneumonia prior to week 24 (19).
One patient had pyrexia prior to week 24 (19) and urinary tract infection during weeks 24–52, and 1 patient each had cystitis and diverticulitis during weeks 24–52.
No deaths occurred through week 52. Overall, 4% of guselkumab‐treated patients (31 of 731) had SAEs, with similar proportions observed in the guselkumab every 4 weeks and every 8 weeks groups (Table 4). Eighteen (58%) of 31 guselkumab‐treated patients with SAEs were receiving methotrexate, 1 (3%) received leflunomide, and 12 (39%) did not receive any nonbiologic DMARDs. Lower limb fracture, goiter, pneumonia (1 identified as influenzal in origin), and pulmonary embolism each occurred in 2 guselkumab‐treated patients. Other SAEs were singular events. One patient each with serious influenza/pneumonia, ischemic stroke, and acute hepatitis B in the guselkumab every 4 weeks group discontinued treatment. Most SAEs in guselkumab‐treated patients resolved by week 52. Exceptions were extrapyramidal disorder, endometrial hyperplasia, and acute hepatitis B, each in 1 patient who received guselkumab every 4 weeks during weeks 0–52.
Guselkumab and placebo were each discontinued due to AEs by ~2% of patients. Nine guselkumab‐treated patients (NNH 164) and 1 placebo‐treated patient had serious infections through week 52. Serious infections were reported by similar proportions of patients receiving guselkumab every 4 weeks (1%) and those receiving guselkumab every 8 weeks (1%) during weeks 0–52, and by similar proportions of the 493 guselkumab‐randomized patients during weeks 0–24 (4 patients [0.8%]) (19) and weeks 24–52 (3 patients [0.6%]) (Table 4). No patient had active tuberculosis (TB) or an opportunistic infection through week 52. Among 75 patients (10%) who were required to start treatment for latent TB prior to the first study agent administration, 2 (1 receiving placebo and 1 receiving guselkumab every 4 weeks [see below]) were reported to have isoniazid‐induced liver injury. No AEs of inflammatory bowel disease were reported in guselkumab‐treated patients.
No malignancies were reported during weeks 24–52, while 2 were reported during weeks 0–24 (melanoma in situ in the guselkumab every 8 weeks group and renal clear cell cancer in the placebo group) (19). No MACE occurred during weeks 24–52; 1 event (ischemic stroke in the guselkumab every 4 weeks group) was reported prior to week 24 (19).
One patient, who received guselkumab every 8 weeks, reported suicidal ideation during weeks 24–52; 2 patients (1 each in the placebo and guselkumab every 4 weeks groups) did so during weeks 0–24 (19). No events of self‐injurious or suicidal behavior were reported through week 52. Injection‐site reactions related to guselkumab injections occurred in 1.4% of guselkumab‐treated patients (10 of 731) through week 52 (see Supplementary Results).
Through week 52, decreased neutrophil counts of NCI CTCAE grade 2 or higher (<1.5 × 10⁹/liter) were infrequent, occurring in 3.7% of patients (9 of 243) who received guselkumab every 4 weeks from week 0 and 3.6% of patients (9 of 247) who received guselkumab every 8 weeks from week 0. Fewer than 1% of guselkumab‐treated patients (5 of 731) had decreased neutrophil counts of grade 3 or higher, including 4 with grade 3 values (<1.0–0.5 × 10⁹/liter) and 1 with grade 4 values (<0.5 × 10⁹/liter). These findings were generally transient and reversible, resolved spontaneously without treatment, and did not require discontinuation of study agent. No associated infections were seen, except a case of mild nasopharyngitis temporally associated with grade 2 neutropenia. Decreased white blood cell counts of NCI CTCAE grade 2 (<3.0–2.0 × 10⁹/liter) occurred in 2.1% of patients (5 of 243) who received guselkumab every 4 weeks from week 0 and 2.4% of patients (6 of 247) who received guselkumab every 8 weeks from week 0; no guselkumab‐treated patient exhibited leukopenia of grade 3 or 4 (>2.0 × 10⁹/liter) (Supplementary Table 4, available on the Arthritis & Rheumatology website at http://onlinelibrary.wiley.com/doi/10.1002/art.41553/abstract).
Through week 52, elevated ALT and/or AST concentrations of NCI CTCAE grade 2 or higher (>3 times the upper limit of normal [ULN]) occurred in 7.4% and 6.6%, respectively, of 243 patients receiving guselkumab every 4 weeks from week 0 and 2.0% and 3.2%, respectively, of 247 patients receiving guselkumab every 8 weeks from week 0. No additional grade 3 ALT or AST values (>5–20 times the ULN), which were uncommon during weeks 0–24 (1.4% and 1.2%, respectively, of 493 guselkumab‐randomized patients) (19), occurred after week 24. No grade 4 ALT or AST values (>20 times the ULN) occurred through week 52 (Supplementary Table 4). No instance of elevated liver function test findings satisfied the criteria for Hy’s Law (total bilirubin >2 times the ULN and ALT or AST ≥3 times the ULN) among guselkumab‐treated patients. Most abnormal findings were transient, resolved, and did not require discontinuation of study agent. As exceptions and as reported previously, 2 patients randomized to receive guselkumab every 4 weeks discontinued guselkumab prior to week 24 (1 each with acute hepatitis B and isoniazid‐induced liver injury) (19). Another patient, in the guselkumab every 4 weeks group, had an extended interruption of treatment before week 24 (owing to physician concerns surrounding alcohol use, hepatic steatosis, and chronic cholecystitis with persistently elevated transaminase levels [AST dominant]). One patient who switched from placebo to guselkumab every 4 weeks, with nonalcoholic fatty liver disease, had a grade 1 ALT elevation (>1–3 times the ULN) at week 52 and discontinued guselkumab after week 52.
Increased ALT and AST concentrations occurred in 26% and 25%, respectively, of 436 guselkumab‐treated patients receiving methotrexate, and in 24% and 20%, respectively, of 292 such patients not receiving methotrexate, at baseline.
Total bilirubin elevations in guselkumab‐treated patients were either grade 1 (>1–1.5 times the ULN; 5% of all guselkumab‐treated patients) or grade 2 (>1.5–3 times the ULN; 1% of all guselkumab‐treated patients) (Supplementary Table 4). All such elevations were <2 times the ULN and not associated with direct bilirubin elevation.
DISCUSSION
Through week 52 of DISCOVER‐2, a pivotal phase III guselkumab trial that enrolled biologic‐naive PsA patients with extensive disease activity despite standard treatments, guselkumab 100 mg every 4 weeks and every 8 weeks provided clinically meaningful and sustained benefits to participants. The significant improvements in arthritis symptoms, psoriatic lesions, dactylitis and enthesitis, physical function, and physical components of HRQoL achieved at week 24 of DISCOVER‐2 (19) were maintained at week 52. Further, numerical improvements seen through week 52 suggested that a further 6 months of guselkumab 100 mg every 4 weeks or every 8 weeks may provide added benefit across response measures. In placebo‐treated patients who initiated guselkumab every 4 weeks at week 24, the onset and magnitude of the guselkumab effect confirmed initial observations in patients receiving guselkumab every 4 weeks from week 0 to week 24.
Structural joint damage, exhibited by nearly half of PsA patients within 2 years of symptom onset, often progresses to irreversible damage and disability (32). Understandably, inhibiting structural damage progression is a key PsA treatment goal (2, 3). The guselkumab every 4 weeks regimen significantly inhibited structural damage progression, as measured by mean changes in total PsA‐modified SHS scores, during weeks 0–24 (19). At the group level, limited radiographic progression was also observed during weeks 24–52 in patients who continued guselkumab every 4 weeks or every 8 weeks and in patients who initiated guselkumab every 4 weeks at week 24. Mean changes in PsA‐modified SHS scores during weeks 0–52 were numerically similar for the guselkumab every 4 weeks and every 8 weeks regimens. It should be noted, however, that the average PsA‐modified SHS score at baseline was numerically higher in the guselkumab every 4 weeks group, and a higher baseline radiographic score is a known risk factor for further radiographic progression (33). Overall, minimal radiographic progression was seen in the vast majority of patients, while only a few patients in each treatment group exhibited clinically meaningful progression of structural damage, through 1 year.
PsA is a complex, clinically diverse, chronic inflammatory disorder driven by excess IL‐23/Th‐17–mediated cytokines. The ability of selective IL‐23 inhibition with guselkumab to sustain improvements in disparate areas of disease through up to 1 year is encouraging in a disorder that can recur after loss of initial response and that can be recalcitrant to biologics (1, 34). Further, given the growing consensus surrounding the ultimate goal of PsA therapy and treatment‐to‐target, i.e., absence of symptoms for those with early disease or limited joint damage or low levels of disease activity for patients presenting with established disease and/or irreversible damage (35), minimal disease activity responses at week 52 suggest that treatment target was achieved in nearly one‐third of these guselkumab‐treated patients, who were biologic‐naive and on average had PsA for >5 years at study outset. Thus, guselkumab was shown to offer a novel mechanism, i.e., binding to the p19 subunit of IL‐23 but not the p40 subunit it shares with IL‐12, to target the key upstream regulatory cytokine implicated in PsA pathogenesis and elicit sustained clinical response.
Importantly, the favorable risk–benefit profile observed through week 24 (19) was supported by findings through week 52, representing a total of 608 patient‐years of follow‐up. Relative to previously reported data through week 24 of DISCOVER‐2 (19), no increase in the incidence of serious infections occurred with continued guselkumab every 4 weeks or every 8 weeks. No patient had active TB or an opportunistic infection, and no deaths occurred, through week 52. No additional malignancies or MACE occurred after week 24, and inflammatory bowel disease was not reported in any patient while receiving guselkumab.
Interpretation of findings through 1 year of DISCOVER‐2 is hampered by a shorter duration of placebo than active treatment. To address this, we estimated numbers of patients with AEs per 100 patient‐years assuming a constant incidence over time, a customary approach to standardize AE data for comparative purposes. Further, because interpretation of observed efficacy data from clinical trial extensions can also be confounded by enriching the long‐term data set with responders, we conservatively summarized clinical efficacy responses by imputing data missing due to discontinued treatment as nonresponse or no change from baseline. Joint counts were not adjusted for the presence of dactylitis in the same digit, as these disease domains were independently assessed. However, as ACR response rates were consistent in patients with or without dactylitis at baseline (data not shown), we do not anticipate any impact on study conclusions. One year is a limited period for assessing patient retention and safety, as well as the structural damage and disability that trail extended periods of untreated systemic inflammation in this chronic condition. Data obtained during the second year of DISCOVER‐2 will augment current knowledge of the guselkumab risk–benefit profile and further our understanding of longer‐term radiographic outcomes with both guselkumab dosing regimens.
In conclusion, guselkumab 100 mg every 4 weeks or every 8 weeks effectively treated the diverse manifestations of active PsA in biologic‐naive patients. The overall treatment effect observed during the 24‐week placebo‐controlled period was well maintained, and the risk–benefit profile remained favorable for both guselkumab regimens, through week 52 of DISCOVER‐2.
AUTHOR CONTRIBUTIONS
All authors were involved in drafting the article or revising it critically for important intellectual content, and all authors approved the final version to be published. Dr. McInnes had full access to all of the data in the study and takes responsibility for the integrity of the data and the accuracy of the data analysis.
Study conception and design
Hsia, Kollmeier, Xu, Subramanian
Acquisition of data
Hsia, Kollmeier, Xu, Subramanian
Analysis and interpretation of data
McInnes, Rahman, Gottlieb, Hsia, Kollmeier, Chakravarty, Xu, Subramanian, Agarwal, Sheng, Jiang, Zhou, Zhuang, van der Heijde, Mease.
ROLE OF THE STUDY SPONSOR
Janssen Research & Development facilitated the study design, provided writing assistance for the manuscript, and reviewed and approved the manuscript prior to submission. The authors independently collected the data, interpreted the results, and had the final decision to submit the manuscript for publication. Substantive manuscript review was provided by Diane D. Harrison, MD, MPH (consultant funded by Janssen), May Shawi, PhD (Janssen), and Chetan Karyekar, MD (Janssen). Programming support was provided by Michelle Pupuk, BS (Janssen). Manuscript preparation and submission assistance was provided by Michelle L. Perate, MS (consultant funded by Janssen). Janssen Research & Development also approved this manuscript prior to submission.
Supporting information
Supplementary Material
A video abstract of this article can be found at https://players.brightcove.net/656326989001/default_default/index.html?videoId=6207835525001.
ClinicalTrials.gov identifier: NCT03158285.
Supported by Janssen Research & Development, LLC.
Dr. McInnes has received consulting fees, speaking fees, and/or honoraria from AbbVie, Boehringer Ingelheim, Bristol Myers Squibb, Celgene, Eli Lilly, Janssen, Novartis, Pfizer, and UCB (less than $10,000 each) and research grants from those companies. Dr. Rahman has received consulting fees from Abbott, AbbVie, Amgen, Bristol Myers Squibb, Celgene, Eli Lilly, Janssen, Novartis, and Pfizer (less than $10,000 each) and a research grant from Janssen. Dr. Gottlieb has received honoraria as an advisory board member and consultant for AnaptypsBio, Avotres Therapeutics, Beiersdorf, Boehringer Ingelheim, Bristol‐Myers‐Squibb, Eli Lilly, Janssen, LEO Pharma, Novartis, Sun Pharmaceuticals UCB, and XBiotech (stock options only) (less than $10,000 each) and research/educational grants from Boehringer Ingelheim, Janssen, Novartis, Sun Pharmaceuticals, UCB, and XBiotech (all paid to Mt. Sinai School of Medicine). Drs. Hsia, Kollmeier, Chakravarty, Xu, Subramanian, Agarwal, Sheng, Zhou, and Zhuang own stock or stock options in Johnson & Johnson. Mr. Jiang has served as a consultant to Janssen Research & Development, LLC. Dr. van der Heijde has received consulting fees from AbbVie, Amgen, Astellas, AstraZeneca, Boehringer Ingelheim, Bristol Myers Squibb, Celgene, Cyxone, Daiichi, Eisai, Eli Lilly, Galápagos, Gilead, GlaxoSmithKline, Janssen, Merck, Novartis, Pfizer, Regeneron, Roche, Sanofi, Takeda, and UCB (less than $10,000 each) and serves as the director of Imaging and Rheumatology BV. Dr. Mease has received consulting fees, speaking fees, and/or honoraria from AbbVie, Amgen, Boehringer Ingelheim, Bristol Myers Squibb, Celgene, Eli Lilly, Galápagos, Genentech, Gilead, GlaxoSmithKline, Janssen, Novartis, Pfizer, Sun Pharmaceuticals, and UCB (less than $10,000 each) and research support from those companies.
The data sharing policy of Janssen Pharmaceutical Companies of Johnson & Johnson is available at https://www.janssen.com/clinical‐trials/transparency. As noted on that site, requests for access to the study data can be submitted through Yale Open Data Access (YODA) Project site at http://yoda.yale.edu.
References
- 1. Costa L, Perricone C, Chimenti MS, del Puente A, Caso P, Peluso R, et al. Switching between biological treatments in psoriatic arthritis: a review of the evidence. Drugs R D 2017;17:509–22. [DOI] [PMC free article] [PubMed] [Google Scholar]
- 2. Gossec L, Smolen JS, Ramiro S, de Wit M, Cutolo M, Dougados M, et al. European League Against Rheumatism (EULAR) recommendations for the management of psoriatic arthritis with pharmacological therapies: 2015 update. Ann Rheum Dis 2016;75:499–510. [DOI] [PubMed] [Google Scholar]
- 3. Coates LC, Kavanaugh A, Mease PJ, Soriano ER, Acosta‐Felquer ML, Armstrong AW, et al. Group for Research and Assessment of Psoriasis and Psoriatic Arthritis 2015 treatment recommendations for psoriatic arthritis. Arthritis Rheumatol 2016;68:1060–71. [DOI] [PubMed] [Google Scholar]
- 4. Harrold LR, Stolshek BS, Rebello S, Collier DH, Mutebi A, Wade SW, et al. Impact of prior biologic use on persistence of treatment in patients with psoriatic arthritis enrolled in the US Corrona registry. Clin Rheumatol 2017;36:895–901. [DOI] [PubMed] [Google Scholar]
- 5. Mease PJ, Accortt NA, Rebello S, Etzel CJ, Harrison RW, Aras GA, et al. Persistence of tumor necrosis factor inhibitor or conventional synthetic disease‐modifying antirheumatic drug monotherapy or combination therapy in psoriatic arthritis in a real‐world setting. Rheumatol Int 2019;39:1547–58. [DOI] [PubMed] [Google Scholar]
- 6. TREMFYA® (guselkumab) injection, for subcutaneous use. Horsham (PA). Janssen Biotech, Inc.; 2020. URL: http://www.janssenlabels.com/package‐insert/product‐monograph/prescribin g‐information/TREMFYA‐pi.pdf. [Google Scholar]
- 7. Ciric B, El‐behi M, Cabrera R, Zhang GX, Rostami A. IL‐23 drives pathogenic IL‐17‐producing CD8+ T cells. J Immunol 2009;182:5296–305. [DOI] [PubMed] [Google Scholar]
- 8. Ness‐Schwickerath K, Jin C, Morita C. Cytokine requirements for the differentiation and expansion of IL‐17A‐ and IL‐22‐producing human Vγ2Vδ2 T cells. J Immunol 2010;184:7268–80. [DOI] [PMC free article] [PubMed] [Google Scholar]
- 9. Teng M, Bowman E, McElwee J, Smyth MJ, Casanova JL, Cooper AM, et al. IL‐12 and IL‐23 cytokines: from discovery to targeted therapies for immune‐mediated inflammatory diseases. Nat Med 2015;21:719–29. [DOI] [PubMed] [Google Scholar]
- 10. Teunissen M, Munneke J, Bernink J, Spuls PI, Res PC, te Velde A, et al. Composition of innate lymphoid cell subsets in the human skin: enrichment of NCR+ ILC3 in lesional skin and blood of psoriasis patients. J Invest Dermatol 2014;134:2351–60. [DOI] [PubMed] [Google Scholar]
- 11. Suzuki E, Mellins ED, Gershwin ME, Nestle FO, Adamopoulos IE. The IL‐23/IL‐17 axis in psoriatic arthritis [review]. Autoimmun Rev 2014;13:496–502. [DOI] [PMC free article] [PubMed] [Google Scholar]
- 12. Girolomoni G, Strohal R, Puig L, Bachelez H, Barker J, Boehncke WH, et al. The role of IL‐23 and the IL‐23/TH 17 immune axis in the pathogenesis and treatment of psoriasis. J Eur Acad Dermatol Venereol 2017;31:1616–26. [DOI] [PMC free article] [PubMed] [Google Scholar]
- 13. Blauvelt A, Papp KA, Griffiths CE, Randazzo B, Wasfi Y, Shen YK, et al. Efficacy and safety of guselkumab, an anti‐interleukin‐23 monoclonal antibody, compared with adalimumab for the continuous treatment of patients with moderate to severe psoriasis: results from the phase III, double‐blinded, placebo‐ and active comparator‐controlled VOYAGE 1 trial. J Am Acad Dermatol 2017;76:405–17. [DOI] [PubMed] [Google Scholar]
- 14. Reich K, Armstrong AW, Foley P, Song M, Wasfi Y, Randazzo B, et al. Efficacy and safety of guselkumab, an anti‐interleukin‐23 monoclonal antibody, compared with adalimumab for the treatment of patients with moderate to severe psoriasis with randomized withdrawal and retreatment: results from the phase III, double‐blind, placebo‐ and active comparator‐controlled VOYAGE 2 trial. J Am Acad Dermatol 2017;76:418–31. [DOI] [PubMed] [Google Scholar]
- 15. Reich K, Armstrong AW, Langley RG, Flavin S, Randazzo B, Li S, et al. Guselkumab versus secukinumab for the treatment of moderate‐to‐severe psoriasis (ECLIPSE): results from a phase 3, randomised controlled trial. Lancet 2019;394:831–9. [DOI] [PubMed] [Google Scholar]
- 16. Zhuang Y, Calderon C, Marciniak SJ Jr, Bouman‐Thio E, Szapary P, Yang TY, et al. First‐in‐human study to assess guselkumab (anti‐IL‐23 mAb) pharmacokinetics/safety in healthy subjects and patients with moderate‐to‐severe psoriasis. Eur J Clin Pharmacol 2016;72:1303–10. [DOI] [PubMed] [Google Scholar]
- 17. Deodhar A, Gottlieb AB, Boehncke WH, Dong B, Wang Y, Zhuang Y, et al, on behalf of the CNTO1959PSA2001 Study Group . Efficacy and safety of guselkumab in patients with active psoriatic arthritis: a randomised, double‐blind, placebo‐controlled, phase 2 study. Lancet 2018;391:2213–24. [DOI] [PubMed] [Google Scholar]
- 18. Deodhar A, Helliwell PS, Boehncke WH, Kollmeier AP, Hsia EC, Subramanian RA, et al, on behalf of the DISCOVER‐1 Study Group . Guselkumab in patients with active psoriatic arthritis who were biologic‐naive or had previously received TNFα inhibitor treatment (DISCOVER‐1): a double‐blind, randomised, placebo‐controlled phase 3 trial. Lancet 2020;395:1115–25. [DOI] [PubMed] [Google Scholar]
- 19. Mease PJ, Rahman P, Gottlieb AB, Kollmeier AP, Hsia EC, Xu XL, et al, on behalf of the DISCOVER‐2 Study Group . Guselkumab in biologic‐naive patients with active psoriatic arthritis (DISCOVER‐2): a double‐blind, randomised, placebo‐controlled phase 3 trial. Lancet 2020;395:1126–36. [DOI] [PubMed] [Google Scholar]
- 20. Healy PJ, Helliwell PS. Measuring clinical enthesitis in psoriatic arthritis: assessment of existing measures and development of an instrument specific to psoriatic arthritis. Arthritis Rheum 2008;59:686–91. [DOI] [PubMed] [Google Scholar]
- 21. Gladman DD, Inman RD, Cook RJ, Maksymowych WP, Braun J, Davis JC, et al. International spondyloarthritis interobserver reliability exercise—the INSPIRE study: II. Assessment of peripheral joints, enthesitis, and dactylitis. J Rheumatol 2007;34:1740–5. [PubMed] [Google Scholar]
- 22. Gladman DD, Ziouzina O, Thavaneswaran A, Chandran V. Dactylitis in psoriatic arthritis: prevalence and response to therapy in the biologic era. J Rheumatol 2013;40:1357–9. [DOI] [PubMed] [Google Scholar]
- 23. Fries JF, Spitz P, Kraines RG, Holman HR. Measurement of patient outcome in arthritis. Arthritis Rheum 1980;23:137–45. [DOI] [PubMed] [Google Scholar]
- 24. Van der Heijde D, Sharp J, Wassenberg S, Gladman DD. Psoriatic arthritis imaging: a review of scoring methods. Ann Rheum Dis 2005;64 Suppl 2:ii61–4. [DOI] [PMC free article] [PubMed] [Google Scholar]
- 25. Langley RG, Feldman SR, Nyirady J, van de Kerkhof P, Papavassilis C. The 5‐point Investigator ’ s Global Assessment (IGA) Scale: a modified tool for evaluating plaque psoriasis severity in clinical trials. J Dermatolog Treat 2015;26:23–31. [DOI] [PubMed] [Google Scholar]
- 26. Fredriksson T, Pettersson U. Severe psoriasis—oral therapy with a new retinoid. Dermatologica 1978;157:238–44. [DOI] [PubMed] [Google Scholar]
- 27. Ware JE Jr, Kosinski M, Keller SK. SF‐36 physical and mental health summary scales: a user’s manual. Boston: The Health Institute, New England Medical Center; 1994. [Google Scholar]
- 28. Mundt JC, Greist JH, Gelenberg AJ, Katzelnick DJ, Jefferson JW, Modell JG. Feasibility and validation of a computer‐automated Columbia‐Suicide Severity Rating Scale using interactive voice response technology. J Psychiatr Res 2010;44:1224–8. [DOI] [PubMed] [Google Scholar]
- 29. Coates LC, Fransen J, Helliwell PS. Defining minimal disease activity in psoriatic arthritis: a proposed objective target for treatment. Ann Rheum Dis 2010;69:48–53. [DOI] [PubMed] [Google Scholar]
- 30. Coates LC, Helliwell PS. Defining low disease activity states in psoriatic arthritis using novel composite disease instruments. J Rheumatol 2016;43:371–5. [DOI] [PubMed] [Google Scholar]
- 31. Landewé R, van der Heijde D. Radiographic progression depicted by probability plots: presenting data with optimal use of individual values. Arthritis Rheum 2004;50:699–706. [DOI] [PubMed] [Google Scholar]
- 32. Van der Heijde D, Gladman DD, Kavanaugh A, Mease PJ. Assessing structural damage progression in psoriatic arthritis and its role as an outcome in research. Arthritis Res Ther 2020;22:18. [DOI] [PMC free article] [PubMed] [Google Scholar]
- 33. Geijer M, Lindqvist U, Husmark T, Alenius GM, Larsson PT, Teleman A, et al. The Swedish Early Psoriatic Arthritis Registry 5‐year followup: substantial radiographic progression mainly in men with high disease activity and development of dactylitis. J Rheumatol 2015;42:2110–7. [DOI] [PubMed] [Google Scholar]
- 34. Fagerli KM, Lie E, van der Heijde D, Heiberg MS, Kalstad S, Rødevand E, et al. Switching between TNF inhibitors in psoriatic arthritis: data from the NOR‐DMARD study. Ann Rheum Dis 2013;72:1840–4. [DOI] [PubMed] [Google Scholar]
- 35. Mease PJ, Coates LC. Considerations for the definition of remission criteria in psoriatic arthritis. Semin Arthritis Rheum 2018;47:786–96. [DOI] [PubMed] [Google Scholar]
Associated Data
This section collects any data citations, data availability statements, or supplementary materials included in this article.
Supplementary Materials
Supplementary Material