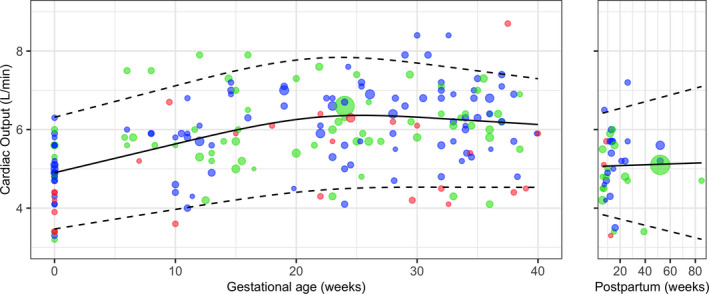
Figure 3.

Reference curve of absolute CO values during pregnancy and in the postpartum period, with mean (solid line), and 5th and 95th percentiles (dashed lines) weighted by study sample size. Size of individual plots indicates sample size of point estimate and their colour indicates study quality: red, low quality; green, moderate quality; blue, high quality. Studies with multiple measurements during pregnancy are plotted per measurement.
