Abstract
Stroke is a major cause of vascular cognitive dysfunction, such as memory impairment. We aimed to explore the neural substrates underlying verbal memory impairment in subcortical stroke patients by the methods of voxel‐wise cerebral blood flow (CBF) and the functional covariance network (FCN). Sixty patients with chronic subcortical stroke and 60 normal controls (NCs) were recruited into this study. We used a three‐dimensional pseudo‐continuous arterial spin‐labeling imaging to measure alterations in CBF and FCNs. We mapped the overall CBF alterations in a voxel‐wise manner and compared CBF measurements using a two‐sample t test. Correlations between CBF and verbal memory were also investigated. Subsequently, we constructed FCNs by calculating the correlation between specific regions and all other voxels of a whole brain, separately within the two groups. Thereafter, by comparing differences of the FCN patterns between the patient and NC groups, we investigated the connection alterations within the FCN maps. The stroke patients showed verbal short‐term memory (VSTM) deficits compared to NCs. The patients exhibited decreased CBF in the ipsilesional insula and ventral sensorimotor network, and increased CBF in contralesional frontal cortical and subcortical regions (putamen and thalamus). Meanwhile, the CBF in the ipsilesional insula was positively correlated, and the contralesional frontal cortical was negativity correlated, with VSTM scores. Moreover we found that stroke patients exhibited disordered connection within FCNs compared to NCs. The study suggests that the underlying imaging biomarker of VSTM impairment in patients with subcortical stroke was associated with disconnection of the frontal lobe network.

Keywords: cerebral blood flow, cognitive, connectivity, imaging biomarker, magnetic resonance, stroke
Stroke is a major cause of vascular cognitive dysfunction. In this study, the methods of voxel‐wise CBF and functional covariance network (FCN) were applied to explore the neural substrates underlying memory impairment in subcortical stroke. The FCNs were constructed and the connection alterations within FCN maps were investigated. The patients showed memory deficits, and exhibited decreased CBF in ipsilesional cortical regions and increased CBF in contralesional frontal cortical and subcortical regions. Moreover the patients exhibited disordered connection within frontal‐FCN. The study suggests that the underlying imaging biomarker of memory impairment in subcortical stroke patients was associated with disconnection of frontal‐network.
Abbreviations
- 3D TOF MRA
three‐dimensional time of flight magnetic resonance angiography
- 3D‐pcASL
three‐dimensional pseudo‐continuous arterial spin‐labeling
- 3D‐T1WI
three‐dimensional T1‐weighted images
- CBF
cerebral blood flow
- cFWE
cluster level family‐wise error
- ES
effect size
- ESWAN
enhanced susceptibility‐weighted angiography
- FA
flip angle
- FCN
functional covariance network
- FLAIR
fluid‐attenuated inversion recovery
- FMA
Fugl–Meyer assessment
- FOV
field of view
- IFG
inferior frontal gyrus
- MFG
middle frontal gyrus
- MNI
Montreal Neurological Institute
- NC
normal control
- Pr
partial correlation coefficient
- RAVLT
Rey Auditory Verbal Learning Test
- ROI
region of interest
- SFG
superior frontal gyrus
- SMA
supplement motor area
- STG
superior temporal gyrus
- TE
echo time
- TI
inversion time
- TR
repetition time
- VLTM
verbal long‐term memory
- VSTM
verbal short‐term memory
1. INTRODUCTION
Patients with ischemic stroke often suffer from cognitive impairment, which exerts a negative impact on their quality of life (Delavaran et al., 2017). Memory impairment is one of the most common symptoms of cognitive decline in stroke patients, as shown by clinical indicators (Brainin et al., 2015; de Lima Ferreira et al., 2018). In addition, memory impairment has also been observed in cortical stroke patients, which is unsurprising since the cortical structures (i.e., frontal cortex, temporal cortex, and parietal cortex) play an essential role in memory function (Ahmed et al., 2018). Recently, numerous studies have reported that subcortical strokes also affect memory (Corbett et al., 1994; Diao et al., 2017), and that patients with the basal ganglia stroke have short‐ and long‐term memory disorders (Middleton & Strick, 2000). However, few studies have assessed the memory impairment in patients with a subcortical infarction involving the motor pathway who recovered movement. Their memory or cognitive impairments are likely to be ignored, since they no longer exhibit physical disabilities. However, the memory impairment could exert further influence on their daily lives, including the ability to retrieve information, store information, and learn new skills. The neurological biomarkers of stroke‐induced memory impairment in patients with chronic subcortical stroke remain to be elucidated.
The quantitative perfusion imaging to calculate cerebral blood flow (CBF) plays an important role in the study of post‐stroke neuronal activity. CBF refers to the amount of arterial blood arriving at, or perfusing, an area of neural tissue within a given time, expressed in units of ml/min/100 g. There is an intricate relationship between CBF and neural activity, with increasing regional neurological demands closely followed by increasing blood flow to that region. The three‐dimensional pseudocontinuous arterial spin‐labeled (3D‐pcASL) technique is a type of perfusion MRI technique for non‐invasive quantitative measuring CBF with good test‐retest repeatability by taking advantage of intra‐arterial blood hydrone as a freely diffusible trace (Alsop et al., 2015). Many researchers have demonstrated that CBF is typically disrupted in brain regions adjacent to or far from stroke lesions in patients with acute stroke (Hernandez et al., 2012; Wang, Miao et al., 2019). Previous studies have shown that the abnormalities of CBF in the distal neural regions may lead to cognitive deficits and alterations in multiple regions (Love et al., 2002; Siegel et al., 2016). However, an increasing number of studies have shown that cerebral changes after stroke are characterized not only by regional changes but also by altered patterns in cortical connectivity (Grefkes & Fink, 2014; Rehme & Grefkes, 2013). Brain perfusion in different regions may change synchronously as functional connectivity networks in order to conduct functional activity (Zhu et al., 2013, 2015). Perfusion‐based functional network connectivity analysis provides direct and quantitative measurements of the physiology and metabolism of specific networks in the brain (Buxton et al., 2004; Jann et al., 2015). Network‐specific quantitative CBF measured by ASL can indicate the baseline metabolic activity, which may be related to the strength of functional connectivity of the corresponding network (Aslan et al., 2011; Liang et al., 2013). During brain development, the vascular distribution of venules and capillaries of functionally linked areas becomes similar, leading to similar CBF values in maturity. This cannot be assessed in a single subject, but by looking at the correlation across subjects one can tease out brain regions in which the variability in a target region matches that in a seed region. Furthermore, assuming functional connectivity persists into maturity, it is likely that these correlations will be retained, but they may be vulnerable to disruption by disease.
CBF functional networks were constructed by calculating the cross‐subject CBF covariance between different brain regions. Several studies on methodological characteristics have confirmed the validity of connectivity maps obtained with perfusion imaging techniques (Chuang et al., 2008; Viviani et al., 2011; Zou et al., 2009). Furthermore, cerebral network measurements, based on CBF‐derived functional connectivity, have been used in a variety of neuropsychiatric disorders (Cui et al., 2017; Zhu et al. 2015). Structural covariance networks subjected to voxel‐based morphometry have been widely used to investigate the covariance pattern of gray matter volumes among different cortical regions (Montembeault et al., 2016; Wang, Zhao, et al., 2019). In the functional covariance network (FCN) method, the amplitude covariance of low‐frequency fluctuations in BOLD signals across subjects is measured to study the interregional correlation of brain activity (Zhang et al., 2011). Liu et al., (2016) applied this method to the identification of the alteration of CBF covariance network of schizophrenic individuals. In our study, we used the FCN method to examine the correlations among CBF variations in different brain regions, and to reveal the underlying neurological mechanism of subcortical stroke‐induced memory impairment.
In this study, the 3D‐pcASL imaging was used to investigate the alterations in CBF connectivity in patients with subcortical stroke. The Rey Auditory Verbal Learning Test (RAVLT) was used to score the episodic memory function in patients. By exploring the correlations between the altered imaging indices and episodic memory scores, we aimed to elucidate the neural biomarkers of memory deficit in patients with subcortical infarctions involving well‐restored motor pathways.
2. MATERIALS AND METHODS
2.1. Participant selection
The study was conducted in the First Affiliated Hospital of Zhengzhou University and Tianjin Medical University General Hospital. This is an exploratory study. The study protocol was approved and pre‐registered by the Institutional Review Board (Chinese Clinical Trial Registry, ChiCTR1900027064). Written informed consent was obtained from all participants. In addition, we combined the data from two centers with the possibility of large variation; therefore, it was important to develop a strict protocol to ensure data quality.
The inclusion criteria were as follows: (a) all patients were first‐onset stroke patients and showed motor deficits in the upper and lower extremities at the onset of stroke; (b) the stroke was present for more than 6 months, ensuring that the patients were in the stable, chronic phase; (c) a single lesion of ischemic infarct confined to the inner capsule and adjacent areas; and (d) good global motor function, assessed using the whole extremity Fugl–Meyer assessment (FMA), with all scores greater than 90/100.
The exclusion criteria were: (a) recurrent stroke, which was determined by clinical history and MRI evaluation; (b) patients with hemorrhagic transformation; (c) a medical history of neurological or psychiatric disorders; (d) the presence of lacunae and microbleeds on T2‐weighted images and enhanced susceptibility‐weighted angiography (ESWAN) images; and (e) severe white matter hyperintensity (T2 fluid‐attenuated inversion recovery [FLAIR] images) with a Fazekas scale score >1 (Fazekas et al., 1987).
The G* Power software (version 3.1) was used for sample size estimation. Parameters are as follows: two tails, effect size d = 0.8, alpha error prob = 0.05, power = 0.8, allocation ratio = 1. Then the sample size of each group is 26. We also calculate the sample size for chi‐square test, linear regression and correlation test, and after data quality control, 60 right‐handed patients (44 males and 16 females; mean age, 55.0 years; age range, 40–75 years) with subcortical infarctions, and 60 healthy controls (34 males and 26 females; mean age, 55.4 years; age range, 40–75 years) were recruited for this study. The RAVLT was used to assess the verbal short‐term memory (VSTM) level of the subcortical stroke patients.
2.2. Magnetic resonance data acquisition
Magnetic resonance images were acquired in both hospitals using 3.0‐T MRI scanners (Discovery MR750; General Electric). Snug and comfortable foam padding was used to minimize head movement, and earplugs were used to reduce scanner noise. Sagittal 3D T1‐weighted images were acquired using a brain volume sequence with the following parameters: repetition time (TR) = 8.2 ms, echo time (TE) = 3.2 ms, inversion time (TI) = 450 ms, flip angle (FA) = 12°, field of view (FOV) = 256 mm ×256 mm, matrix = 256 × 256, slice thickness = 1.0 mm, no gap, and 188 sagittal slices. Resting‐state perfusion imaging was obtained using the pcASL sequence with 3D spiral acquisition and background suppression with the following parameters: TR = 5,025 ms, TE = 11.1 ms, post‐label delay = 2025 ms, spiral in readout of eight arms with 512 sample points, FA = 111°, FOV = 240 × 240 mm, reconstruction matrix = 128, slice thickness =3 mm, no gap, 48 axial slices, number of excitations = 3, and 1.9 × 1.9 mm in‐plane resolution. The T2 FLAIR sequences were acquired in the axial plane with the following parameters: TR = 8,500 ms, TE = 157.73 ms, FA = 111°, TI = 2,100 ms, matrix = 256 × 256, number of slices = 20, and slice thickness = 5.0 mm. The ESWAN sequences were acquired in the axial plane using the following parameters: TR = 35.7 ms, TE = 3.8 ms, FA = 20°, matrix = 320 × 256, FOV = 220 mm ×220 mm, number of slices = 80, slice thickness = 2.0 mm. The 3D Time of Flight (TOF) magnetic resonance angiography (MRA) sequences were acquired in system using the follow parameters: TR = 20 ms, TE = 3.69 mm, matrix = 320 × 320, FOV = 220 × 220 mm, slice thickness = 0.6 mm, slab = 4, and number of slices/slab = 40. During the resting state scans, all participants were instructed to close their eyes but stay awake, relax, and stay still as long as possible, not thinking about anything special.
2.3. Verbal memory assessment
The RAVLT is a powerful neuropsychological tool that is used for assessing episodic memory by providing scores for evaluating different aspects of memory (Ferreira & Campagna, 2014). The RAVLT is sensitive to verbal memory deficits caused by a variety of neurological diseases, which is widely used for the cognitive assessment in clinical research and practice. It includes the verbal short‐term memory (VSTM) and the verbal long‐term memory (VLTM) tests. The RAVLT consists of five free‐recall trials of a 15 words list. In each trial, the examiner read a word aloud every two seconds, and the participants must listen carefully. Then participants were asked to recall as many of the presented words as possible after the presentation. The total number of correctly recalled words in all 5 trials was recorded as a VSTM score. Finally, participants were asked to recall words again after a 20‐min interruption (trial 6). The number of the correctly recalled words in trial 6 was recorded as the VLTM score.
2.4. Image processing
MRI data were analyzed using SPM8 (http://www.fil.ion.ucl.ac.uk/spm/). Pre‐processing first involved quality assurance that was visually performed for each cerebral blood flow image and allowing for the removal of corrupted images. Then, to improve statistical robustness, the imaging data of all 24 patients with lesions in the right hemisphere were flipped to the left side along the sagittal midline before image processing (Wang et al., 2014). For all patients, we defined the left side as the ipsilesional hemisphere, and the right side as the contralesional hemisphere. No randomization was performed to allocate subjects and no blinding was performed, as only two groups of subjects (patient and normal control) were recruited in this study, and the subjects enrolled in this study were chronic infarctions involving well‐restored motor pathways and no special treatment protocols were performed. Stroke lesions were primarily located in the basal ganglia, internal capsule, thalamus, and corona radiata. The lesion incidence map of stroke patients is shown in Figure 1. The stroke location was determined by an experienced neuroradiologist using three‐dimensional T1‐weighted images (3D‐T1WI). At first, we spatially normalized the 3D‐T1WI to the standard Montreal Neurological Institute (MNI) space. Then, the lesions were manually delineated slice by slice on the normalized 3D‐T1WI using the MRIcron software (www.mricro.com). In this way, a lesion mask was generated for each subject. Finally, the lesion masks of all stroke patients were averaged and overlaid onto the MNI template.
FIGURE 1.
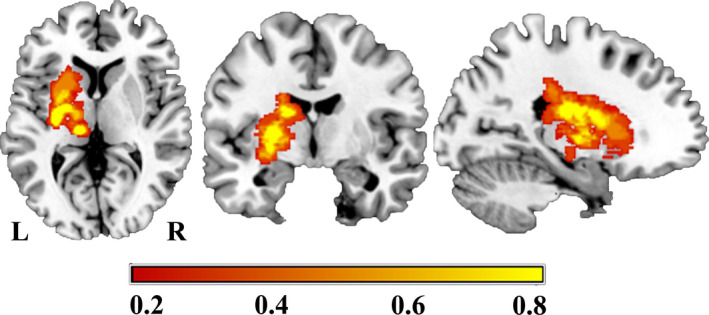
Lesion incidence map for the stroke patients (n = 60). The color bar represents the lesion incidence frequency in each voxel
The resting‐state CBF maps were preprocessed as follows. First, perfusion images were calculated by subtracting the label images from the reference images and quantitative CBF maps were calculated by vendor provided Functool. Second, CBF maps were coregistered to the high‐resolution 3DT1‐weighted image. Subsequently, the T1 images were segmented into gray matter, white matter, and CSF probabilistic masks, and were normalized to standard MNI space using a unified normalization‐segmentation algorithm. The gray matter probabilistic mask was re‐sectioned to the same resolution as the CBF map and converted to a binary mask at a density threshold of 0.2, to exclude voxels with small amounts of gray matter. Then, CBF maps were written to the anatomical image and normalized using the individual normalization parameters derived from the segmentation algorithm. Next, CBF maps were multiplied by the binary gray mask resulting in an image of predominantly gray matter perfusion. The normalized CBF maps were resampled to 2 ×2 × 2 mm isotropic voxel size and smoothed with an 8 mm isotropic Gaussian kernel. Finally, to reduce inter‐subject variations, the CBF images were normalized by dividing the mean CBF of the whole brain.
2.5. Cerebral blood flow analyses
To assess the overall CBF changes in patients with chronic subcortical stroke, we performed a two‐sample t test analysis of CBF maps generated from voxel‐based analyses. The differences in normalized CBF between the two groups were compared. For each participant, the normalized CBF value of each cluster with a significant group difference was extracted for the analysis based on a region of interest (ROI). We used Cohen's d (Parker & Hagan‐Burke, 2007) to describe the effect size (ES) of each ROI. In the statistical analyses the age, sex, years of education, and scanner variables of the individuals were controlled as confounding covariates for regression. Multiple comparisons were corrected using the non‐stationary cluster level family‐wise error (cFWE) method, with a correction threshold of p < .05.
2.6. Functional covariance network for mapping synchronized CBF alterations
To investigate the neurological imaging biomarkers of stroke‐induced memory impairment in patients with subcortical stroke, we used the FCNs method to map brain connectivity patterns on resting‐state CBF datasets through correlation analyses of CBF across subjects (i.e., CBF‐FCNs). We constructed the FCN by selecting seeding regions from those with significant inter‐group differences in CBF analyses, to investigate the synchronization of interregional CBF changes. For the patient group and the normal control group, the averaged CBF values of each seeding region were extracted from each participant and used as a regressor in the general linear model in SPM 8 to generate CBF‐FCN t‐maps. The FCN t‐maps for each ROI reflected the covarying CBF between the seed ROI and a brain region. Subsequently, linear interaction analysis based on multiple regression was used to detect FCN alterations of the patients compared with the normal controls, and the CBF‐FCN mask was used to combine data from patients and normal controls. Multiple comparisons were calibrated using the cFWE method, with a corrected threshold of p < .05. The age, sex, years of education, and scanner variables were modeled as covariates in the regression analyses.
2.7. Statistical analyses
In this study, the SPM 8 (http://www.fil.ion.ucl.ac.uk/spm/) and SPSS 22.0 (IBM Corp.) software were used for statistical analysis. The Shapiro–Wilk statistic was first used to test for normality. A two‐sample t test was used to detect differences in age and years of education between the patients and normal controls. The Chi‐square test was used to test sex differences between the two groups. A general linear model was used to compare verbal memory scores, CBF, and CBF connectivity between stroke patients and normal controls with controlling factors including age, sex, years of education, and scanner variables. Cohen d was used to describe effect size. We used partial correlation analysis to test the correlation between lesion volume, verbal memory scores, and the altered imaging indices. The multiple comparison corrections with cFWE were calibrated for between‐group comparisons. The differences were treated as significant if the corrected p < 0.05.
3. RESULTS
3.1. Demographic and clinical parameters
The detailed demographics, clinical features, and behavioral data are displayed in Table 1. There were no significant inter‐group differences in age (p = .837), sex (p = .056), and the years of education (p = .107). Compared with normal controls, the stroke patients performed worse in the VSTM testing (p = .003), while there was no significant difference (p = .099) in the VLTM testing between the two groups. The global motor functions of all the patients were good, with the upper extremity FMA score >60/66, and the whole extremity FMA score >90/100.
TABLE 1.
Demographic and clinical data of the stroke patients and the normal controls
| Variable | Stroke patients | Normal controls | p |
|---|---|---|---|
| Number | 60 | 60 | — |
| Age (y) | 55.1 ± 8.6 | 55.4 ± 8.2 | 0.837 |
| Sex (M—F) | 44—16 | 34—26 | 0.056 |
| Education (no. of years) | 10.0 ± 3.4 | 11.0 ± 2.9 | 0.107 |
| Verbal short‐term memory | 43.9 ± 9.3 | 48.7 ± 8.2 | 0.003* |
| Fugl–Meyer Assessment score | |||
| Upper extremity | 65.4 ± 1.4 | — | — |
| Whole extremity | 98.8 ± 2.6 | — | — |
The bold values indicate significant differences between the stroke and normal control groups (p < .05); Data are presented by the mean ± the standard deviation (range) for the continuous data.
3.2. Cerebral blood flow changes in normalized CBF
The voxel‐wise CBF differences between stroke patients and normal controls are shown in Figure 2 and Table 2.The brain regions with significant differences were extracted and defined as ROIs in order to facilitate further analysis. Compared with the normal control group, stroke patients showed significantly lower CBF in the affected hemisphere, mainly involving insular cortex, Rolandic operculum, inferior frontal gyrus (IFG), superior temporal gyrus (STG), and precentral gyrus (ROI1; Figure 2a), which are important components of the ventral sensorimotor network. In addition, the stroke patients displayed significantly higher CBF in the contralesional hemisphere compared to the normal control group, mainly involving the putamen, thalamus, insular lobe, and caudate nucleus (ROI2; Figure 2b), as well as the middle frontal gyrus (MFG), superior frontal gyrus (SFG), and precentral gyrus (ROI3; Figure 2c). Moreover in order to further verify these results, we measured the CBF values of bilateral basal ganglia regions (infarcted area and infarct mirror area) in the normal control and stroke groups, based on hand‐drawn regions, which was respectively performed by two senior radiologists using the drawing tool available in the MRIcron software (see the Figure S1). We calculated the mean value of the CBF of each subjects from the two raters and considered this mean value as the CBF value of the subjects. In addition, the CBF values were normalized by dividing the mean CBF of the whole brain. Then, a paired t test was used to perform statistical analysis on CBF values of the left and right basal ganglia in the patient and normal control groups. The results showed that the CBF values of bilateral basal ganglia were significant different in the patient group, indicating that the CBF was significantly higher in the contralesional than the ipsilesional (p = .015) basal ganglia, while there was no difference in CBF values in these areas among normal controls (p = .054) (Table 3). In addition, we further performed two t tests to analyze the differences between patients and normal controls in the left side and the right side, respectively, in order to determine whether there was a significant difference in the stroke lesion regions. The results showed that there was no significant difference in CBF between the patient group and the normal group on the left side (ipsilesional; p = .601), while the CBF value of the patients was significantly higher than that of the normal controls in the right side (contralesional; p = .004) (Table 3).
FIGURE 2.
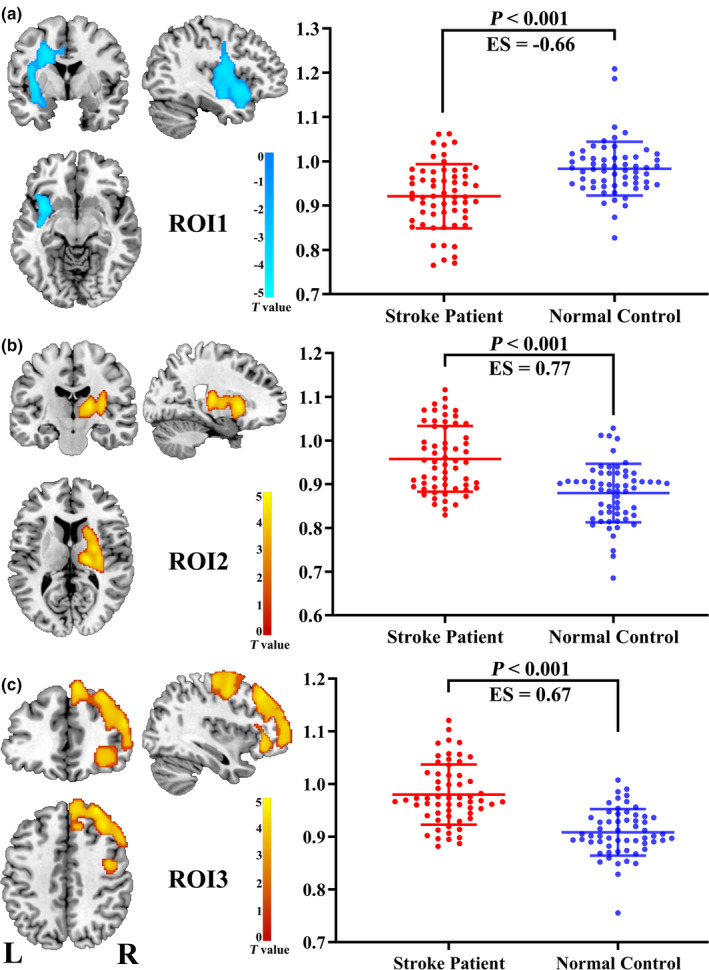
Brain regions showing significant differences between stroke patients (n = 60) and normal controls (n = 60) in the CBF comparison. Abbreviations: CBF, cerebral blood flow; ES, effect size; L: left; R: right; ROI: region of interest
TABLE 2.
Brain regions with significant intergroup differences in CBF and CBF connection
| Brain region | Cluster size (voxels) | Peak intensity | MNI Coordinates (x, y, z) | CBF values (normalized) |
|---|---|---|---|---|
| Left insular cortical, rolandic operculum, IFG, STG, and precentral gyrus ( ROI1) | 2,306 | −4.99 | −36, 10, −10 | 1.05 ± 0.11 |
| Right putamen, thalamus (ROI2) | 1910 | 5.23 | 18, −18, 10 | 0.87 ± 0.09 |
| Right MFG, SFG, precentral gyrus (ROI3) | 6,199 | 4.72 | 34, 32, 50 | 1.09 ± 0.10 |
| Bilateral MFG, precentral, SFG, SMA | 10,536 | 6.31 | −6, 26, 54 | 1.10 ± 0.09 |
| Right hippocampus | 418 | −5.6 | 32, −4, −20 | 1.10 ± 0.12 |
| Left precentral | 323 | 4.74 | −50, −4, 42 | 1.10 ± 0.13 |
| Left Insula, putamen | 690 | 4.84 | −38, 4, 6 | 1.32 ± 0.14 |
| Left IFG, MFG, SFG | 1625 | 5.25 | −38, 24, 32 | 0.90 ± 0.09 |
| Left MFG | 301 | 5.38 | −26, 8, 54 | 1.10 ± 0.10 |
| Left mSFG, anterior cingulate, SMA | 1,141 | 6.14 | −6, 26, 54 | 1.10 ± 0.11 |
| Right putamen | 358 | 5.43 | 30, −2, −16 | 0.95 ± 0.07 |
| Right PCG, calcarine | 830 | −8.94 | 22, −58, 18 | 0.92 ± 0.08 |
| Left SFG, MFG, mSFG, IFG, anterior cingulate | 9,368 | −6.21 | −24, 26, 52 | 0.94 ± 0.07 |
Abbreviations: CBF, cerebral blood flow; IFG, inferior frontal gyrus; MFG, middle frontal gyrus, MNI, Montreal Neurological Institute; mSFG, medial superior frontal gyrus; PCG, posterior cingulate gyrus; ROI, region of interest; SFG, superior frontal gyrus; SMA, supplement motor area.
TABLE 3.
CBF values of the stroke patients and normal controls based on hand‐drawn regions
| Hand‐drawn Regions | CBF values (normalized) | p | |
|---|---|---|---|
| Stroke patients (n = 60) | Normal controls (n = 60) | ||
| Left basal ganglia | 1.03 ± 0.13 | 0.99 ± 0.12 | 0.601 |
| Right basal ganglia | 1.057 ± 0.12 | 0.97 ± 50.12 | 0.004* |
| p | 0.015* | 0.054 | — |
The bold values indicate significant differences between the inter‐groups (p < .05); Data are presented by the mean ± the standard deviation (range) for the continuous data.
3.3. Brain normalized CBF‐based functional covariance network
We constructed FCNs by calculating the correlation between the CBF value of each ROI and all other voxels of the whole brain. The CBF‐FCNs maps of each ROI are displayed in Figure 3 and Table 2 (p < .05, cFWE corrected). We found that the FCNs of the three ROIs from intergroup differences of normalized CBF exhibited different covariance connection patterns between the two groups. In the ROI1‐associated FCN, the control group showed a positive connection in the bilateral temporal‐insular lobes, basal ganglia, hippocampus, and anterior cingulate, in which the correlation areas were apparently larger in the affected hemisphere than in the contralateral hemisphere, and showed a negative connection in the bilateral frontal lobes, while the patients group only showed a significant positive network connection pattern, without any negative correlations (Figure 3a). In the ROI2‐associated FCN, the normal control group displayed a positive connection pattern in the contralesional insula, basal ganglia, thalamus, STG, IFG, and anterior cingulate, whereas the stroke patient group showed not only a positive connection pattern in these regions, but also negative connections in the bilateral occipital lobes, where the visual cortex was located (Figure 3b). In the ROI3‐associated FCN, the normal control group displayed positive connections in the bilateral frontal lobes, temporal lobe, contralesional posterior cingulate and thalamus, and negative connectivity in bilateral temporal lobes, basal ganglia, and ipsilesional anterior cingulate, while the patients group only showed positive connections in the contralesional frontal lobe (Figure 3c).
FIGURE 3.
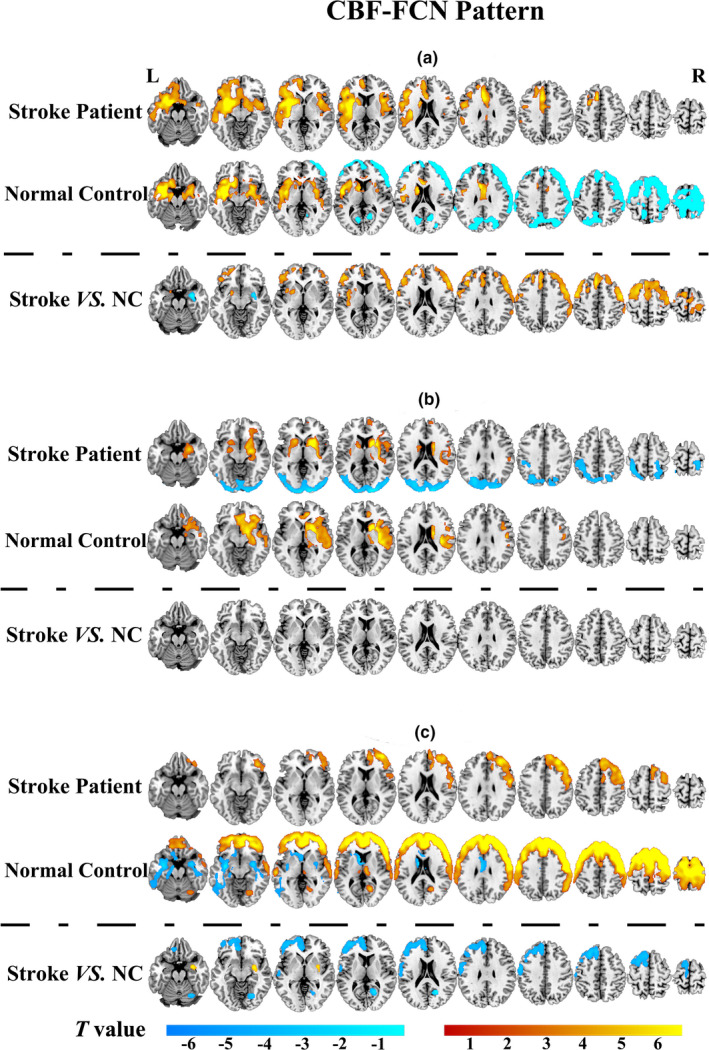
CBF‐FCN pattern and group differences between stroke patients (n = 60) and normal controls (n = 60) within the FCN. (a) the ROI1‐associated FCN; (b) the ROI2‐associated FCN; (c) the ROI3‐associated FCN. The colour in yellow to red indicated positive connections, and slight green to blue indicated negative connections (p < .05 with cFWE correction). Abbreviations: CBF, cerebral blood flow; FCN, functional covariance network; L: left; NC, normal control; R: right
In the ROI1‐associated FCN, compared with the normal control group, the stroke patients displayed significantly activated CBF connections in the bilateral MFG, SFG, supplement motor area (SMA), precentral gyrus, postcentral gyrus, ipsilesional insula, putamen and anterior cingulate, and decreased CBF connections in contralesional putamen, hippocampus and amygdala (Figure 3a: Stroke VS. NC). However, there was no significant intergroup differences within ROI2‐associated FCN after correction for multiple comparisons (Figure 3b: Stroke VS. NC). In the ROI3‐associated FCN, the stroke patients displayed significantly decreased CBF connections in the ipsilesional SFG, MFG, postcentral, SMA, anterior cingulate and contralesional posterior cingulate, and significantly activated CBF connections in the contralesional putamen and amygdala, when compared with the normal control group (Figure 3c: Stroke VS.NC).
As shown in Figure 4, we further used CBF and CBF connections of significant intergroup regions to construct the brain network connection matrix in order to reveal the disordered CBF connections in stroke patients and to compare them with normal controls. Most CBF connections were interrupted, while a few CBF connections were slightly activated in stroke patients as compared with normal controls. The CBF covariance based on these regions were also visualized in a node‐edge manner (Figure 5), where the nodes indicated the regions to be investigated, the edges indicated the significant correlations between CBF connections of specific regions (nodes), and the edge color represented the strength of the correlation coefficients. Green to blue indicated negative connections, and yellow to red indicated positive connections. This node‐edge graph made it more intuitive to identify the differences in the CBF covariance network between groups.
FIGURE 4.
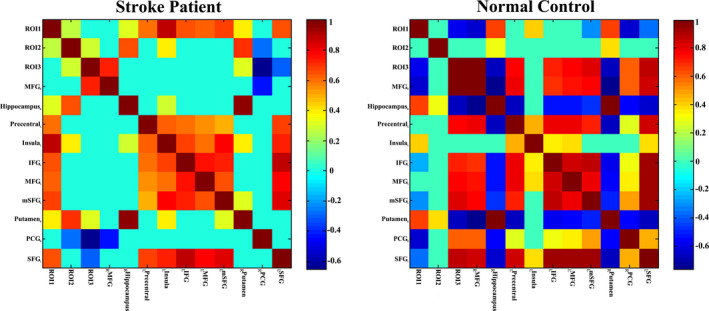
CBF covariance matrix both stroke patients (n = 60) and normal controls (n = 60) in the cortical and subcortical regions. The bar indicates the partial correlation coefficient between ROI‐specific CBF measures. Only the significant correlations that survive cluster level FWE correction are shown; the non‐significant correlations are changed to zero (slight green in the grid panel). Abbreviations: FEW, family‐wise error; L, left; R, right
FIGURE 5.
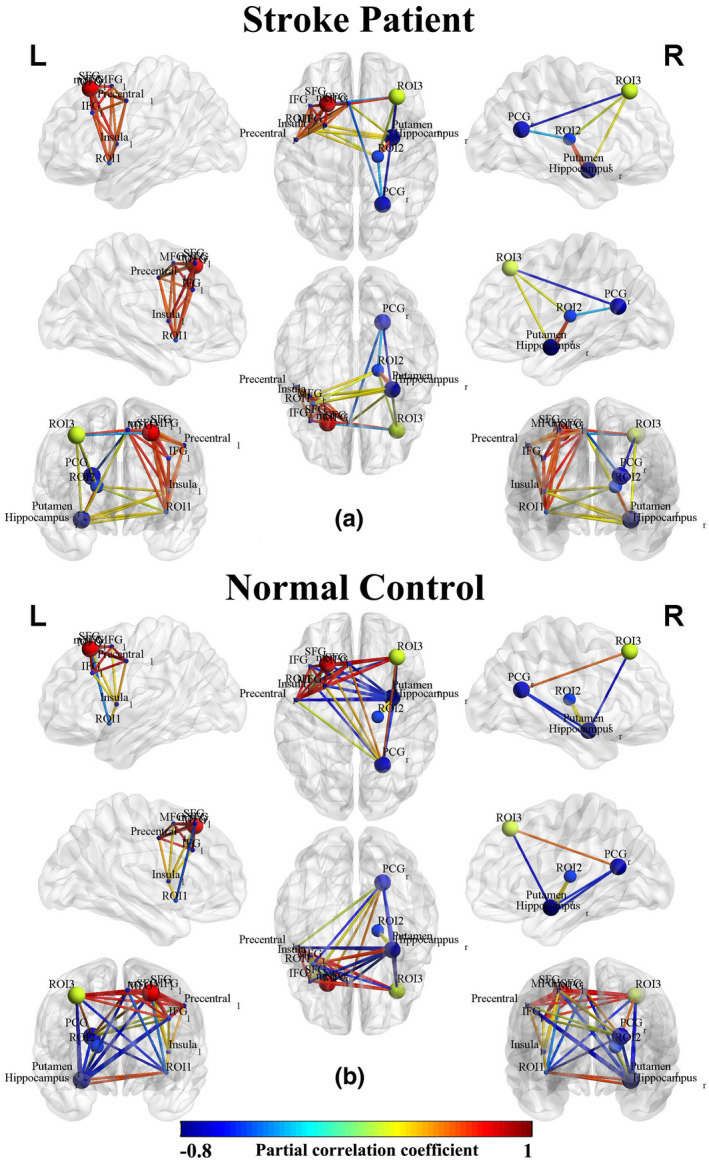
CBF connections in stroke patients (n = 60) and normal controls (n = 60) within the CBF‐associated FCN. The nodes indicate the CBF and CBF covariance measures of specific ROIs. The edges in blue to red indicate significant CBF connections (p < .05) measured by partial correlation coefficients between the regional CBF of ROIs, where the color indicates the value of a partial correlation. Abbreviations: CBF, cerebral blood flow; IFG, inferior frontal gyrus; MFG, middle frontal gyrus; mSFG, medial part of SFG; PCG, posterior cingulate gyrus; ROI, region of interest; SFG, superior frontal gyrus
To further analyze the ROI‐based CBF connection differences, we plotted node‐edge graphs in Figure 6. In the ROI1‐based CBF connection network, stroke patients mainly displayed connection activation, with some negative connections absent or converted to mild positive connection (Figure 6a,b). In the ROI3‐based CBF connection network, stroke patients showed a different connection mode, mainly characterized by the disconnection or disappearance of some connections compared to normal controls (Figure 6c, d).
FIGURE 6.
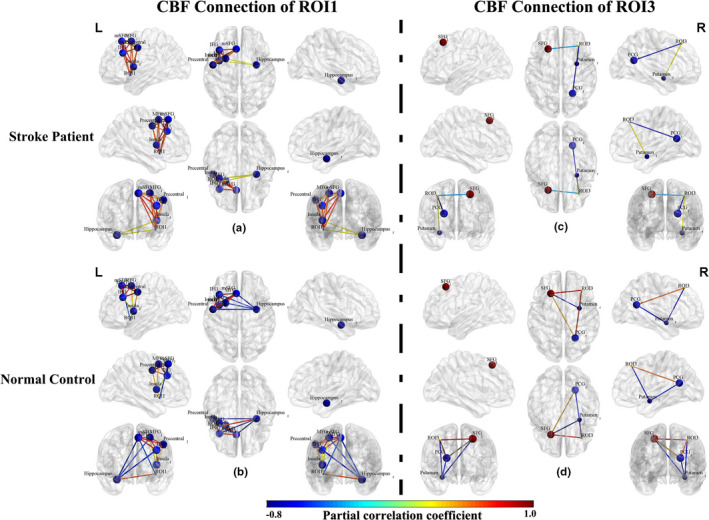
CBF connections in stroke patients (n = 60) and normal controls (n = 60) within the ROI1‐ and ROI3‐associated FCN. The nodes indicate the CBF and CBF covariance measures of specific regions of interest (ROI). The edges in blue to red indicate the significant CBF connections (p < .05) measured by partial correlation coefficients between the regional CBF of ROIs, where the color indicates the value of a partial correlation. Abbreviations: CBF, cerebral blood flow; FCN, functional covariance network; IFG, inferior frontal gyrus; MFG, middle frontal gyrus; mSFG, medial part of SFG; PCG, posterior cingulate gyrus; SFG, superior frontal gyrus
3.4. Correlation analyses
There was a significant positive correlation between the VSTM and VLTM scores (p =.001, Figure 7). In addition, there was a significant positive correlation between the decreased CBF value of ROI1 (Figure 8a) and the VSTM scores (partial correlation coefficient [pr] = 0.245, p = .004; Figure 8c), and significant negative correlation between the increased CBF values of ROI3 (Figure 8b) and the VSTM scores (pr = −0.215, p = .010; Figure 8d). In these statistics, age, sex, years of education, and scanner variables of the individuals were treated as covariates.
FIGURE 7.
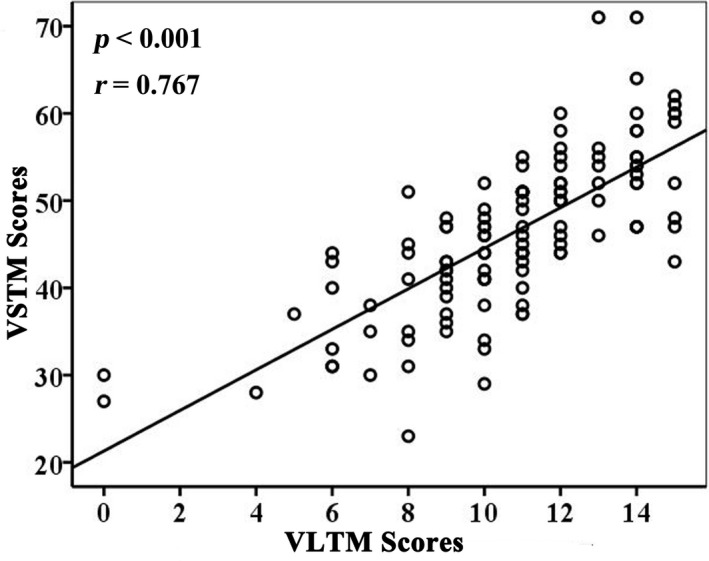
Correlations between VLTM and VSTM scores in stroke patients (n = 60). Abbreviations: VLTM, verbal long‐term memory; VSTM, verbal short‐term memory
FIGURE 8.
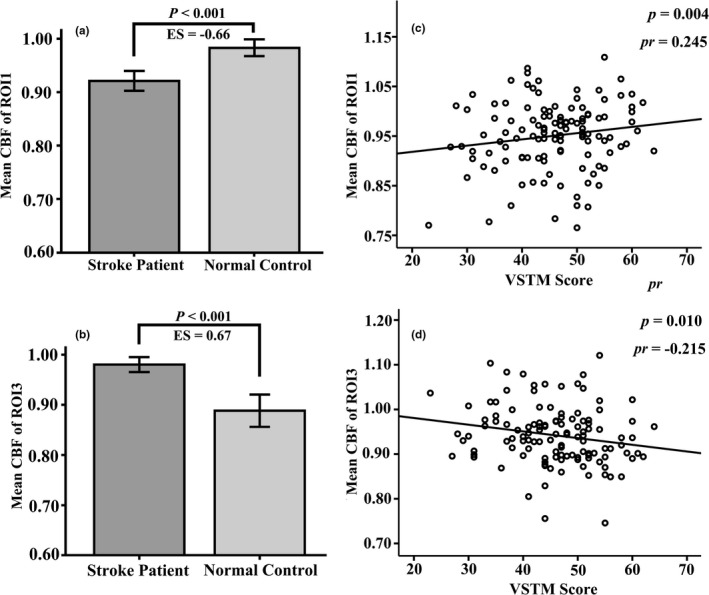
Correlations between CBF values and VSTM scores in storke patients (n = 60) and normal controls (n = 60). (a) The correlations between CBF of ipsilesional ROI1 with VSTM. (b) The correlations between CBF of ipsilesional ROI3 with VSTM. Abbreviations: CBF, cerebral blood flow; ES, effect size; VSTM, verbal short‐term memory
4. DISCUSSION
In this study, we found that CBF in the ipsilesional insular cortical, Rolandic operculum, IFG, STG, and precentral gyrus (Figure 2a) decreased in subcortical stroke patients. These regions are important components of the ventral sensorimotor network. An ischemic infarct can affect the blood supply to lesioned regions, and thus cause an interruption to the structural and functional connections between the cortical and subcortical regions. As the basal ganglia regions (infarct region) has abundant nerve fiber connections with the insular lobe and the frontal‐temporal lobe, a subcortical infarction can interrupt these connecting fibers and destroy the cortical‐subcortical nerve loop, thereby affecting the function of the corresponding cortical region. In addition, the study also found a significant positive correlation between the CBF of these regions and the VSTM score, which suggests that decreased CBF may contribute to short‐term memory impairment. It is well‐known that the insular cortex is part of the neocortex located in the lateral temporal lobe, and is believed to be involved in functions of perception, motor control, self‐awareness, cognitive functioning, and interpersonal experience. The decreased CBF observed in the ipsilesional insular cortical may imply the impairment of verbal memory function in patients with subcortical stroke. This is in line with the previous studies that indicate the insular cortex is involved in taste verbal memory processes (Jones et al., 2010; Wiest et al., 2014).
In addition, we found increased CBF in the contralesional putamen, thalamus, insular lobe and caudate nucleus (Figure 2b). This indicates that there is a significant CBF increase in the mirror area of the lesion, which may be a functional compensation for the ipsilesional impaired regions. In this study, we also found that stroke patients have significantly increased CBF in contralesional MFG, SFG, and precentral gyrus compared with the normal control group (Figure 2c), which are important areas for advanced cognitive function. Moreover the increased CBF in the regions was negatively correlated with VSTM scores. The frontal cortex serves as a memory processing region (Manes et al., 1999), and damage to it could cause memory deficits. In our study, the increased CBF in these cerebral regions appears to be a compensatory mechanism for the patient's functional deficit.
To further explore the underlying neural imaging prognostic biomarker of our findings, we applied the FCN method from the perspective of brain connectivity. Cerebral connectivity can reflect a wide range of multi‐synaptic connections between brain regions and the importance of functional relationships between connected brain regions. Therefore, cerebral connection analyses can be used to investigate the effect of stroke and to understand how the brain changes following lesion‐induced neurological impairment and functional recovery. For instance, a previous study demonstrated that functional deficits may result from an impairment in the anatomical connections of the brain and enhanced functional connections between the anatomically connected regions of impairment may reflect a compensatory mechanism for functional deficits (Vidal‐Pineiro et al., 2018). In addition, the regional CBFs in different brain regions that responds to neuronal activity are not independent, and they may change synchronously in the same functional network in order to achieve functional neuronal activity.
Perfusion‐based cerebral connection analysis can provide direct measurements of the physiology and metabolism of specific networks. The baseline metabolic activity may be related to the strength of functional connections in the corresponding network. In this study, we conducted brain network analyses based on the CBF maps. Our results showed that the FCN patterns of the three ROIs, from intergroup differences of normalized CBF of patients, were significantly different from those of normal controls. Further cerebral network connection analyses found disordered CBF connections in chronic stroke patients, with most CBF connections interrupted and only a few CBF connections slightly activated. For the ROI1‐associated FCN, stroke patients displayed significantly increased CBF in the bilateral MFG, SFG, SMA, precentral gyrus, postcentral gyrus, ipsilesional insula, putamen, and anterior cingulate, and decreased CBF connections in the contralesional putamen, hippocampus, and amygdala compared with normal controls. In the cerebral connections of these regions, the stroke patients mainly displayed connection activation, with some negative connections disappearing or converted to mild positive connections. In other words, the brain connections within the ROI1‐associated FCN were mainly activated, although the CBF in the ventral sensorimotor network and insular cortex (ROI1) of stroke patients were decreased. This result may indicate that these activated brain connections were a potential compensation for motor and cognitive impairment in stroke patients. In the ROI3‐associated FCN, the stroke patients displayed significantly decreased CBF connections in the ipsilesional SFG, MFG, postcentral, SMA, anterior cingulate, and contralesional posterior cingulate, and significantly activated CBF connections in the contralesional putamen and amygdala, when compared to the normal control group. Furthermore, stroke patients showed a disordered connection mode, mainly characterized by deactivated or absent interregional connections in the ROI3‐based CBF connection network. These results may indicate that the potential reason for increased CBF in the contralesional frontal lobe (ROI3) was related to the impairment of short‐term memory function. It indicates that the underlying imaging prognostic biomarkers of memory impairment in subcortical stroke patients may relate to disconnection of the frontal lobe network. In ROI2‐associated FCN, despite there being some differences in the observed connection patterns, there were no significant intergroup differences after correcting for multiple comparisons.
The aberrant changes of CBF in these cortical and subcortical regions may imply verbal memory dysfunction, and the increase in CBF in these regions was intended to compensate for the memory deficit. This finding is in line with neuroimaging studies based on blood oxygen level‐dependent functional magnetic resonance imaging in post‐stroke cognitive decline, for example, reduced functional connectivity (Stradecki‐Cohan et al., 2017), regional homogeneity (Liu et al., 2014), and disordered brain networks (Duncan & Owen, 2000) in the frontal‐parietal cognitive network. This implies that stroke‐induced cognitive dysfunction may result from functional disconnection of these cognitive cortical regions.
Our results showed that VSTM was defective in patients with chronic subcortical stroke with good global motor function recovery, when compared to normal controls. However, VLTM was not significantly different between the two groups. This finding suggests that the capacity impairment in VSTM is more severe than in VLTM among patients with chronic subcortical stroke. VSTM refers to the fact that a small amount of information in the mind is active and readily available for a short period, reflecting the ability to learn new facts and episodes; VSTM plays an important role in daily life and work. The VLTM reflects the ability to store information. As is well‐known, all memories pass through short‐term storage to end up in long‐term storage. In addition, we found a significant positive correlation between VSTM and VLTM scores. This implies that impaired VSTM capacity will affect the ability to form long‐term memories.
There are some limitations of this study. First, based on the previous literature (Zhang et al., 2014), the CBF data were flipped along the midline from the right hemisphere to the left hemisphere. This method cannot appropriately differentiate the CBF covariance network between two hemispheres. In future, we will expand the sample size to investigate alterations in the left or right hemisphere connectivity in patients with subcortical stroke, in order to further validate the results. Second, a zero time‐lagged correlation was used in the connectivity analyses, and the possible causal relationships between the altered CBF regions could not be quantified. Therefore, dynamic alteration patterns of CBF connectivity and the causal relationships between different regions after a subcortical stroke need to be further investigated.
In conclusion, this study identified altered CBF connectivity in multiple cortical and subcortical regions, which may suggest that subcortical stroke‐induced alterations may exist beyond the motor system and manifest as the involvement of cognitive functional systems. This study also identified that decreased CBF in the ipsilesional insula, and disconnection within the contralesional frontal lobe network accounts for the underlying mechanism of short‐term memory impairment in patients with subcortical stroke. In addition, our results revealed the disordered CBF connection patterns in chronic subcortical stroke patients, highlighting the importance of both regional CBF and inter‐regional connection properties in studies of brain dysfunction after stroke.
CONFLICTS OF INTEREST
All authors declare that they have no conflict of interest.
ACKNOWLEDGEMENTS
The authors thank patients and their caregivers for generously supporting this study.
All experiments were conducted in compliance with the ARRIVE guidelines.
Wang C, Miao P, Liu J, et al. Validation of cerebral blood flow connectivity as imaging prognostic biomarker on subcortical stroke. J Neurochem. 2021;159:172–184. 10.1111/jnc.15359
Funding information
This study was supported by the Natural Science Foundation of China (81601467, 81601472, 81871327), and Henan Province Young Talent Lifting Project of China (2021HYTP012).
Contributor Information
Caihong Wang, Email: fccwangch@zzu.edu.com.
Jingliang Cheng, Email: fccchengjl@zzu.edu.com.
REFERENCES
- Ahmed, S. , Loane, C. , Bartels, S. , Zamboni, G. , Mackay, C. , Baker, I. , Husain, M. , Thompson, S. , Hornberger, M. , & Butler, C. (2018). Lateral parietal contributions to memory impairment in posterior cortical atrophy. NeuroImage: Clinical, 20, 252–259. 10.1016/j.nicl.2018.07.005 [DOI] [PMC free article] [PubMed] [Google Scholar]
- Alsop, D. C. , Detre, J. A. , Golay, X. , Günther, M. , Hendrikse, J. , Hernandez‐Garcia, L. , Lu, H. , MacIntosh, B. J. , Parkes, L. M. , Smits, M. , van Osch, M. J. P. , Wang, D. J. J. , Wong, E. C. , & Zaharchuk, G. (2015). Recommended implementation of arterial spin labeled perfusion MRI for clinical applications: A consensus of the ISMRM Perfusion Study Group and the European Consortium for ASL in Dementia. Magnetic Resonance in Medicine, 73, 102–116. 10.1002/mrm.25197 [DOI] [PMC free article] [PubMed] [Google Scholar]
- Aslan, S. , Huang, H. , Uh, J. , Mishra, V. , Xiao, G. , van Osch, M. J. , & Lu, H. (2011). White matter cerebral blood flow is inversely correlated with structural and functional connectivity in the human brain. NeuroImage, 56, 1145–1153. 10.1016/j.neuroimage.2011.02.082 [DOI] [PMC free article] [PubMed] [Google Scholar]
- Brainin, M. , Tuomilehto, J. , Heiss, W.‐D. , Bornstein, N. M. , Bath, P. M. W. , Teuschl, Y. , Richard, E. , Guekht, A. , & Quinn, T. (2015). Post‐stroke cognitive decline: An update and perspectives for clinical research. European Journal of Neurology, 22, 229–238, e213–226. 10.1111/ene.12626 [DOI] [PubMed] [Google Scholar]
- Buxton, R. B. , Uludag, K. , Dubowitz, D. J. , & Liu, T. T. (2004). Modeling the hemodynamic response to brain activation. NeuroImage, 23, S220–S233. 10.1016/j.neuroimage.2004.07.013 [DOI] [PubMed] [Google Scholar]
- Chuang, K. H. , van Gelderen, P. , Merkle, H. , Bodurka, J. , Ikonomidou, V. N. , Koretsky, A. P. , Duyn, J. H. , & Talagala, S. L. (2008). Mapping resting‐state functional connectivity using perfusion MRI. NeuroImage, 40, 1595–1605. 10.1016/j.neuroimage.2008.01.006 [DOI] [PMC free article] [PubMed] [Google Scholar]
- Corbett, A. , Bennett, H. , & Kos, S. (1994). Cognitive dysfunction following subcortical infarction. Archives of Neurology, 51, 999–1007. 10.1001/archneur.1994.00540220045013 [DOI] [PubMed] [Google Scholar]
- Cui, L.‐B. , Chen, G. , Xu, Z.‐L. , Liu, L. , Wang, H.‐N. , Guo, L. I. , Liu, W.‐M. , Liu, T.‐T. , Qi, S. , Liu, K. , Qin, W. , Sun, J.‐B. , Xi, Y.‐B. , & Yin, H. (2017). Cerebral blood flow and its connectivity features of auditory verbal hallucinations in schizophrenia: A perfusion study. Psychiatry Res Neuroimaging, 260, 53–61. 10.1016/j.pscychresns.2016.12.006 [DOI] [PubMed] [Google Scholar]
- de Lima Ferreira, G. , de Oliveira, L. M. V. , Montoril, M. H. , Diniz, C. M. , & Santana, R. F. (2018). Clinical validation of the nursing diagnosis of impaired memory in patients with a stroke. Japan Journal of Nursing Science, 16, 136–144. 10.1111/jjns.12220 [DOI] [PubMed] [Google Scholar]
- Delavaran, H. , Jonsson, A. C. , Lovkvist, H. , Iwarsson, S. , Elmstahl, S. , Norrving, B. , & Lindgren, A. (2017). Cognitive function in stroke survivors: A 10‐year follow‐up study. Acta Neurologica Scandinavica, 136, 187–194. 10.1111/ane.12709 [DOI] [PubMed] [Google Scholar]
- Diao, Q. , Liu, J. , Wang, C. , Cheng, J. , Han, T. , & Zhang, X. (2017). Regional structural impairments outside lesions are associated with verbal short‐term memory deficits in chronic subcortical stroke. Oncotarget, 8, 30900–30907. 10.18632/oncotarget.15882 [DOI] [PMC free article] [PubMed] [Google Scholar]
- Duncan, J. , & Owen, A. M. (2000). Common regions of the human frontal lobe recruited by diverse cognitive demands. Trends in Neurosciences, 23, 475–483. 10.1016/S0166-2236(00)01633-7 [DOI] [PubMed] [Google Scholar]
- Fazekas, F. , Chawluk, J. B. , Alavi, A. , Hurtig, H. I. , & Zimmerman, R. A. (1987). MR signal abnormalities at 1.5 T in Alzheimer’s dementia and normal aging. AJR. American Journal of Roentgenology, 149, 351–356. 10.2214/ajr.149.2.351 [DOI] [PubMed] [Google Scholar]
- Ferreira, C. A. , & Campagna, O. I. (2014). The Rey Auditory Verbal Learning Test: Normative data developed for the Venezuelan population. Archives of Clinical Neuropsychology, 29, 206–215. 10.1093/arclin/act070 [DOI] [PubMed] [Google Scholar]
- Grefkes, C. , & Fink, G. R. (2014). Connectivity‐based approaches in stroke and recovery of function. The Lancet Neurology, 13, 206–216. 10.1016/S1474-4422(13)70264-3 [DOI] [PubMed] [Google Scholar]
- Hernandez, D. A. , Bokkers, R. P. , Mirasol, R. V. , Luby, M. , Henning, E. C. , Merino, J. G. , Warach, S. , & Latour, L. L. (2012). Pseudocontinuous arterial spin labeling quantifies relative cerebral blood flow in acute stroke. Stroke, 43, 753–758. 10.1161/STROKEAHA.111.635979 [DOI] [PMC free article] [PubMed] [Google Scholar]
- Jann, K. , Gee, D. G. , Kilroy, E. , Schwab, S. , Smith, R. X. , Cannon, T. D. , & Wang, D. J. (2015). Functional connectivity in BOLD and CBF data: Similarity and reliability of resting brain networks. NeuroImage, 106, 111–122. 10.1016/j.neuroimage.2014.11.028 [DOI] [PMC free article] [PubMed] [Google Scholar]
- Jones, C. L. , Ward, J. , & Critchley, H. D. (2010). The neuropsychological impact of insular cortex lesions. Journal of Neurology, Neurosurgery and Psychiatry, 81, 611–618. 10.1136/jnnp.2009.193672 [DOI] [PubMed] [Google Scholar]
- Liang, X. , Zou, Q. , He, Y. , & Yang, Y. (2013). Coupling of functional connectivity and regional cerebral blood flow reveals a physiological basis for network hubs of the human brain. Proceedings of the National Academy of Sciences of the United States of America, 110, 1929–1934. 10.1073/pnas.1214900110 [DOI] [PMC free article] [PubMed] [Google Scholar]
- Liu, F. , Zhuo, C. , & Yu, C. (2016). Altered cerebral blood fow covariance network in schizophrenia. Frontiers in Neuroscience, 10, 308. [DOI] [PMC free article] [PubMed] [Google Scholar]
- Liu, J. , Qin, W. , Wang, H. , Zhang, J. , Xue, R. , Zhang, X. , & Yu, C. (2014). Altered spontaneous activity in the default‐mode network and cognitive decline in chronic subcortical stroke. Journal of the Neurological Sciences, 347, 193–198. 10.1016/j.jns.2014.08.049 [DOI] [PubMed] [Google Scholar]
- Love, T. , Swinney, D. , Wong, E. , & Buxton, R. (2002). Perfusion imaging and stroke: A more sensitive measure of the brain bases of cognitive deficits. Aphasiology, 16, 873–883. 10.1080/02687030244000356 [DOI] [PMC free article] [PubMed] [Google Scholar]
- Manes, F. , Springer, J. , Jorge, R. , & Robinson, R. G. (1999). Verbal memory impairment after left insular cortex infarction. Journal of Neurology, Neurosurgery and Psychiatry, 67, 532–534. 10.1136/jnnp.67.4.532 [DOI] [PMC free article] [PubMed] [Google Scholar]
- Middleton, F. A. , & Strick, P. L. (2000). Basal ganglia output and cognition: Evidence from anatomical, behavioral, and clinical studies. Brain and Cognition, 42, 183–200. 10.1006/brcg.1999.1099 [DOI] [PubMed] [Google Scholar]
- Montembeault, M. , Rouleau, I. , Provost, J. S. , & Brambati, S. M. (2016). Altered gray matter structural covariance networks in early stages of Alzheimer's disease. Cerebral Cortex, 26, 2650–2662. 10.1093/cercor/bhv105 [DOI] [PMC free article] [PubMed] [Google Scholar]
- Parker, R. I. , & Hagan‐Burke, S. (2007). Useful effect size interpretations for single case research. Behavior Therapy, 38, 95–105. 10.1016/j.beth.2006.05.002 [DOI] [PubMed] [Google Scholar]
- Rehme, A. K. , & Grefkes, C. (2013). Cerebral network disorders after stroke: Evidence from imaging‐based connectivity analyses of active and resting brain states in humans. Journal of Physiology, 591, 17–31. 10.1113/jphysiol.2012.243469 [DOI] [PMC free article] [PubMed] [Google Scholar]
- Siegel, J. S. , Snyder, A. Z. , Ramsey, L. , Shulman, G. L. , & Corbetta, M. (2016). The effects of hemodynamic lag on functional connectivity and behavior after stroke. Journal of Cerebral Blood Flow and Metabolism, 36, 2162–2176. 10.1177/0271678X15614846 [DOI] [PMC free article] [PubMed] [Google Scholar]
- Stradecki‐Cohan, H. M. , Cohan, C. H. , Raval, A. P. , Dave, K. R. , Reginensi, D. , Gittens, R. A. , Youbi, M. , & Perez‐Pinzon, M. A. (2017). Cognitive deficits after cerebral ischemia and underlying dysfunctional plasticity: Potential targets for recovery of cognition. Journal of Alzheimer's Disease, 60, S87–S105. 10.3233/JAD-170057 [DOI] [PubMed] [Google Scholar]
- Vidal‐Pineiro, D. , Sneve, M. H. , Nyberg, L. H. , Mowinckel, A. M. , Sederevicius, D. , Walhovd, K. B. , & Fjell, A. M. (2018). Maintained frontal activity underlies high memory function over 8 years in aging. Cerebral Cortex, 29, 3111–3123. 10.1093/cercor/bhy177 [DOI] [PubMed] [Google Scholar]
- Viviani, R. , Messina, I. , & Walter, M. (2011). Resting state functional connectivity in perfusion imaging: Correlation maps with BOLD connectivity and resting state perfusion. PLoS One, 6, e27050. 10.1371/journal.pone.0027050 [DOI] [PMC free article] [PubMed] [Google Scholar]
- Wang, C. , Miao, P. , Liu, J. , Wei, S. , Guo, Y. , Li, Z. , Zheng, D. , & Cheng, J. (2019). Cerebral blood flow features in chronic subcortical stroke: Lesion location‐dependent study. Brain Research, 1706, 177–183. 10.1016/j.brainres.2018.11.009 [DOI] [PubMed] [Google Scholar]
- Wang, C. , Qin, W. , Zhang, J. , Tian, T. , Li, Y. , Meng, L. , Zhang, X. , & Yu, C. (2014). Altered functional organization within and between resting‐state networks in chronic subcortical infarction. Journal of Cerebral Blood Flow and Metabolism, 34, 597–605. 10.1038/jcbfm.2013.238 [DOI] [PMC free article] [PubMed] [Google Scholar]
- Wang, C. , Zhao, L. , Luo, Y. , Liu, J. , Miao, P. , Wei, S. , Shi, L. , & Cheng, J. (2019). Structural covariance in subcortical stroke patients measured by automated MRI‐based volumetry. NeuroImage: Clinical, 22, 101682. 10.1016/j.nicl.2019.101682 [DOI] [PMC free article] [PubMed] [Google Scholar]
- Wiest, R. , Abela, E. , Missimer, J. , Schroth, G. , Hess, C. W. , Sturzenegger, M. , Wang, D. J. J. , Weder, B. , & Federspiel, A. (2014). Interhemispheric cerebral blood flow balance during recovery of motor hand function after ischemic stroke—a longitudinal MRI study using arterial spin labeling perfusion. PLoS One, 9, e106327. 10.1371/journal.pone.0106327 [DOI] [PMC free article] [PubMed] [Google Scholar]
- Zhang, J. , Meng, L. , Qin, W. , Liu, N. , Shi, F. D. , & Yu, C. (2014). Structural damage and functional reorganization in ipsilesional M1 in well‐recovered patients with subcortical stroke. Stroke, 45, 788–793. 10.1161/STROKEAHA.113.003425 [DOI] [PubMed] [Google Scholar]
- Zhang, Z. , Liao, W. , Zuo, X.‐N. , Wang, Z. , Yuan, C. , Jiao, Q. , Chen, H. , Biswal, B. B. , Lu, G. , & Liu, Y. (2011). Resting‐state brain organization revealed by functional covariance networks. PLoS One, 6, e28817. 10.1371/journal.pone.0028817 [DOI] [PMC free article] [PubMed] [Google Scholar]
- Zhu, J. J. , Zhuo, C. J. , Qin, W. , Xu, Y. J. , Xu, L. X. , Liu, X. Y. , & Yu, C. S. (2015). Altered resting‐state cerebral blood flow and its connectivity in schizophrenia. Journal of Psychiatric Research, 63, 28–35. 10.1016/j.jpsychires.2015.03.002 [DOI] [PubMed] [Google Scholar]
- Zhu, S. , Fang, Z. , Hu, S. , Wang, Z. , & Rao, H. (2013). Resting state brain function analysis using concurrent BOLD in ASL perfusion fMRI. PLoS One, 8, e65884. 10.1371/journal.pone.0065884 [DOI] [PMC free article] [PubMed] [Google Scholar]
- Zou, Q. , Wu, C. W. , Stein, E. A. , Zang, Y. , & Yang, Y. (2009). Static and dynamic characteristics of cerebral blood flow during the resting state. NeuroImage, 48, 515–524. 10.1016/j.neuroimage.2009.07.006 [DOI] [PMC free article] [PubMed] [Google Scholar]


