

Summary
Ectomycorrhizal plants trade plant‐assimilated carbon for soil nutrients with their fungal partners. The underlying mechanisms, however, are not fully understood. Here we investigate the exchange of carbon for nitrogen in the ectomycorrhizal symbiosis of Fagus sylvatica across different spatial scales from the root system to the cellular level.
We provided 15N‐labelled nitrogen to mycorrhizal hyphae associated with one half of the root system of young beech trees, while exposing plants to a 13CO2 atmosphere. We analysed the short‐term distribution of 13C and 15N in the root system with isotope‐ratio mass spectrometry, and at the cellular scale within a mycorrhizal root tip with nanoscale secondary ion mass spectrometry (NanoSIMS).
At the root system scale, plants did not allocate more 13C to root parts that received more 15N. Nanoscale secondary ion mass spectrometry imaging, however, revealed a highly heterogenous, and spatially significantly correlated distribution of 13C and 15N at the cellular scale.
Our results indicate that, on a coarse scale, plants do not allocate a larger proportion of photoassimilated C to root parts associated with N‐delivering ectomycorrhizal fungi. Within the ectomycorrhizal tissue, however, recently plant‐assimilated C and fungus‐delivered N were spatially strongly coupled. Here, NanoSIMS visualisation provides an initial insight into the regulation of ectomycorrhizal C and N exchange at the microscale.
Keywords: carbon, ectomycorrhiza, Fagus sylvatica (beech), NanoSIMS, nitrogen (N), recent photosynthates, reciprocal rewards, resource exchange
Introduction
Ectomycorrhizal (EM) fungi play an important role in the nitrogen (N) nutrition of trees in boreal and temperate forests. They use their extensive extraradical hyphal network to take up organic and inorganic N compounds from the forest soil, and deliver N to their host plants in exchange for carbon (C). Moreover, ectomycorrhizal fungi are able to facilitate the decomposition of complex soil organic N by excreting extracellular enzymes (Shah et al., 2013; Lindahl & Tunlid, 2015; Wang et al., 2020), employing oxidative mechanisms (Shah et al., 2016) or stimulating free‐living microbial decomposers (Gorka et al., 2019). Such N‐foraging activities of EM hyphae are, however, energy‐ and C‐demanding. Given that EM hyphae depend solely on their host plants for C supply, it would not be surprising if ectomycorrhizal plants have evolved mechanisms to specifically support those of their associated fungal partners that are actively foraging for N.
It is known that plants allocate a greater share of C to resource‐foraging roots (Eissenstat et al., 2015; Chen et al., 2016; Cheng et al., 2016). Recently, Bogar et al. (2019) showed in a split‐root experiment with ectomycorrhizal Pinus muricata seedlings that plants directed recent photosynthates preferentially to roots and mycorrhizas that had access to an additional nitrogen source. This indicates that a similar mechanism to that which supplies resource‐foraging roots with greater C investments (Eissenstat et al., 2015; Chen et al., 2016; Cheng et al., 2016) could also be employed to supply resource‐foraging mycorrhizal hyphae (Bogar et al., 2019).
There are two differences, from a plant perspective, between supporting foraging roots and foraging ectomycorrhizal hyphae. The first difference is that the root system of a single tree is usually colonized by many different individual fungal partners (Lang & Polle, 2011), which are heterogeneously distributed at small scales. Even neighbouring root tips can be associated with different mycorrhizal fungal individuals or species (Lang et al., 2011; Gorka et al., 2019). In order to support a specific N‐foraging mycorrhiza, plants would thus need to be able to allocate C at a very small scale, by distinguishing among different mycorrhizal root tips along a fine root. The second differences is that, in contrast to the strategy of supporting foraging roots, the unconditional support of foraging mycorrhizal hyphae is naturally linked to the risk of being exploited, as fungi could take the C while keeping the nutrients for themselves (Corrêa et al., 2012; Näsholm et al., 2013). It has been suggested that such cheating strategies of ectomycorrhizal fungi could be species‐specific (Pena & Polle, 2013) and also dependent on N availability (Albarracín et al., 2013).
The risk of being exploited could be lowered if C for nutrient exchange between plants and EM fungi were regulated by reciprocal rewards, that is, if C transfer to foraging fungal hyphae were dependent on the nutrients the plant receives in return (Kiers et al., 2011; Fellbaum et al., 2014; Walder & van der Heijden, 2015). It has been suggested that mycorrhizal plants and their fungal partners have evolved strategies for the recognition of more beneficial symbiotic partners, allowing them to direct more resources to partners that deliver more in return (Steidinger & Bever, 2014; Werner et al., 2014; Wyatt et al., 2014). The potential existence of such a control has been shown for the arbuscular mycorrhizal symbiosis, where in simplified experimental systems, plant roots delivered more C to fungal partners that provided more nutrients (phosphorus (P) or N), and vice versa (Bever et al., 2009; Fellbaum et al., 2011, 2014; Kiers et al., 2011, 2016). However, in this regard much less is known about the ectomycorrhizal symbiosis.
The control over nutrient transfer between plants and mycorrhizal fungi takes place at the symbiotic interface – that is, within the Hartig net in the ectomycorrhizal symbiosis. A key role in this control is ascribed to the symbiosis‐specific expression of carbon and nutrient transporter genes of both partners (López et al., 2008; Nehls, 2008; Hortal et al., 2017). It is possible that such a symbiosis‐controlled C transfer to a certain mycorrhizal partner at a particular location in the root system creates a local C sink for the plant, drawing further plant C to that location. However, very little is known about the mechanisms of resource exchange at the cellular scale at the ectomycorrhizal symbiotic interface. One reason for this is that standard methods used to trace isotopically labelled elements through the plant–soil system (e.g. isotope‐ratio mass spectrometry) are unable to distinguish between plant and fungal tissue within mycorrhizas. Nanoscale secondary ion mass spectrometry (NanoSIMS) has the potential to overcome this problem by enabling mapping of the distribution of multiple isotopes and elements at a spatial resolution of down to 50 nm, which allows tracking of photoassimilated C and fungal‐derived N at a subcellular scale in mycorrhizal tissue (Kaiser et al., 2015).
The aim of this study was to investigate whether plants allocate more of their recently photoassimilated C to fungal partners that deliver more N in the ectomycorrhizal symbiosis of European beech (Fagus sylvatica), and if so, at which spatial scale such a ‘plant response’ occurs. Specifically, we asked the following questions: (i) Are beech trees allocating recent photosynthates to parts of the root system associated with N‐delivering mycorrhizal fungi, and if so, is this happening only on a coarse scale (i.e. between larger parts of the root system) or also on a finer scale (i.e. among parts of fine roots and individual mycorrhizal root tips)? (ii) How are recently assimilated C and fungus‐delivered N compounds spatially distributed at the cellular scale in the ectomycorrhizal tissue? (iii) Is there any evidence for a mechanism for a targeted exchange of C and N at the cellular scale? Are recent photosynthates spatially linked to N recently taken up by mycorrhizal fungi?
We exposed young beech trees (F. sylvatica) in split‐root boxes to a 13C‐CO2 enriched atmosphere, and simultaneously provided a 15N labelled nutrient solution to ectomycorrhizal fungi that were associated with one half of the root system. Within 24–48 h after label application we determined the total 13C and 15N content of roots, root segments (2–4 cm) and individual mycorrhizal root tips via elemental analysis–isotope‐ratio mass spectrometry (EA‐IRMS). Cross‐sections of a mycorrhizal root tip were prepared for analysis with NanoSIMS to visualize the spatial distribution of 13C and 15N at the cellular and subcellular scales.
Materials and Methods
Pot cultivation of Fagus sylvatica and their natural ectomycorrhizal fungi
Young (c. 3–4‐yr‐old) beech trees (Fagus sylvatica L.) colonized by natural mycorrhizal communities were collected from a temperate beech forest (Klausenleopoldsdorf, Lower Austria; stagnic‐gleyic brown earth over flysch sandstone). Twenty‐seven trees were planted into ‘split‐root’ boxes, dividing each plant's root system into two halves growing into distinct ‘soil compartments’ (Fig. 1). Each soil compartment was further connected, via a 35 µm nylon mesh (penetrable by fungal hyphae but not plant roots), to an exclusive ‘litter compartment’ (Fig. 1). The mesh consisted of two layers with a solid plastic grid in between, which created an air gap, preventing water flow from one compartment into the other (Gorka et al., 2019). Soil compartments were filled with a mixture of soil (A‐horizon collected from the site, 4 mm sieved) and perlite (soil : perlite ratio of 8 : 1, v/v). Litter compartments (17 × 60 × 125 mm) were filled with beech litter collected from the same site.
Fig. 1.

Experimental design of split‐root boxes. Shown is an illustration of the split‐root box setup (a) and a photograph of one of the experimental trees growing in such a box shortly before harvest (b). Plants were grown for c. 1 yr in split‐root boxes (155 × 135 × 125 mm) with their root systems divided between two separated compartments, each filled with soil (‘soil compartments’, each 121 × 60 × 125 mm inside). The plant stems were stabilized using a cylinder filled with quartz sand. Each soil compartment was connected to a litter compartment (17 × 60 × 125 mm inside) by a double‐layered 35 µm nylon mesh, which allowed fungal hyphae, but not roots, to grow through. A solid plastic grid was placed in between the mesh layers, which creates an air gap to prevent the exchange of water and solutes between the soil and litter compartments. The two litter compartments were separated by a solid wall from each other, and were filled with beech leaf litter to foster hyphal growth from both root system halves into their respective litter compartments. After 1 yr of growth, we added a 15N labelled ammonium chloride (NH4) and amino acid (AA) solution to only one of the two litter compartments to provide an additional N source, accessible to one half of the plant's root system via its associated mycorrhiza. Within 24 h of the N addition we exposed the plant's canopies to 13C‐labelled CO2 using a gas‐tight acrylic glass incubation chamber.
Trees were grown for 1 yr (July 2014–June 2015) in the split‐root boxes in an ‘open’ glasshouse under ambient (outdoor) sunlight and temperature and were watered regularly. Examination of selected plant roots under the stereomicroscope showed abundant mycorrhizal colonisation at the time of transfer from the forest to the split‐root boxes, as well as during the experimental harvest 1 yr later (see the supplementary material in a previous article by Gorka et al., 2019). Amplicon sequencing of the internal transcribed spacer (ITS) region of extracted DNA showed that mycorrhizal community composition in the litter compartments and rhizospheres of the plants was similar, indicating that mycorrhizal hyphae had grown from the plant roots into the litter compartments (Gorka et al., 2019). For more details on the experimental setup see the study by Gorka et al. (2019), which presents additional results from the same experiment.
Double stable isotope (13C, 15N) pulse labelling
We provided a 15N‐labelled N source to mycorrhizal hyphae associated with one half of the root system, but not to the roots directly, by adding 12 ml of a 15N‐labelled NH4 and amino acid mix to one of the two litter compartments (in eight split‐root boxes). The second litter compartment of each box received water as control. The 15N labelled NH4 and amino acid mix consisted of 15N‐NH4Cl (98 at%, 54.5 mg l−1, i.e. 1 mM N; Sigma‐Aldrich) and an Algal Amino Acid mixture (U‐15N 98 at%; 140 mg l−1, c. 1 mM N based on an assumed average amino acid molar weight of 140 g mol−1; Cambridge Isotope Laboratories, Cambridge, UK), dissolved in water. Twenty‐four hours after the 15N labelling, the canopies of these eight trees, plus four trees which only received water on both sides, were exposed to 13CO2 for 6 h 20 min at c. 90 at% (1500 ppm) using a gas‐tight acrylic glass incubation chamber, with which plant canopies can be exposed exclusively to the chamber atmosphere, while keeping soil and litter compartments outside, thereby preventing direct contact between them and the 13CO2 (for details, see the earlier study by Gorka et al., 2019). Gas samples were retrieved from the labelling chamber at regular intervals and analysed for CO2 concentration and isotopic ratio using a headspace gas sampler (GasBench II; Thermo Fisher Scientific, Bremen, Germany) interfaced to a continuous flow isotope‐ratio mass spectrometer (Delta Advantage V; Thermo Electron, Bremen, Germany). Four additional planted split‐root boxes were kept without any 13C or 15N labelling to serve as natural abundance controls. A preliminary experiment had been conducted to determine optimal harvest times, with the aim of harvesting plants as soon as possible after both 13C and 15N were detectable in plant roots.
Plant harvest: root segments and root tips
Plants were kept in the dark overnight after the 13CO2 labelling (to allow further belowground transport of the photoassimilated C) and were harvested over 10 h during the next day (i.e. 19–29 h after the start of the 6 h labelling period, referred to as c. 24 h after labelling from now on). Boxes were carefully taken apart and aboveground biomass was clipped and stored before excavation of the belowground parts. Roots were taken out of each soil compartment, rinsed with tap water and kept moist in water containers for further analysis. Each root system half was further separated into 4–5 approximately equally sized segments, from which mycorrhizal root colonisation was roughly estimated under stereomicroscopes (Gorka et al., 2019). A number of individual branched root tips (c. 3–5 mm, for an example see Supporting Information Fig. S1), with each branch clearly representing the same ‘morphotype’ (established by visual identification under the microscope; Agerer, 1989), were sampled from each root system. Each of these branched root tips was further separated into three smaller pieces (‘individual root tips’), which were stored either at −20°C (for ITS sequencing), air dried (for bulk isotope analysis via EA‐IRMS) or in liquid N2 after ultra‐rapid cooling by plunge freezing in liquid propane (for NanoSIMS). Litter compartments did not contain any roots, proving that roots had been successfully prevented from growing into these compartments by the mesh barrier. Litter compartments were also harvested and analysed, the results of which can be found in the earlier study by Gorka et al. (2019).
Bulk isotope analysis of root segments and root‐tips
Isotopic ratios (13C : 12C and 15N : 14N) of individual mycorrhizal root tips were analysed using an elemental analyzer (EA 1110 elemental analyzer, CE Instruments, Wigan, UK) coupled to an isotope‐ratio mass spectrometer (IRMS, Finnigan MAT DeltaPlus; Fisher Scientific, Vienna, Austria). Root segments were ground, and their bulk isotope ratios were measured by IRMS. Isotopic enrichment was calculated as the difference in relative isotopic enrichment between labelled and unlabelled control samples (i.e. as at% excess (APE)).
Sequencing of the internal transcribed spacer region
DNA was extracted from the mycorrhizal root tip taken from the same branch as the root tip used for the NanoSIMS analysis using a phenol‐chloroform protocol based on physical shearing of the cells by four bead beating steps (adapted from the method described by Angel, 2012). DNA was eluted in 30 µl Low TE buffer and stored at −80°C before sequencing. The fungal ITS1 region was amplified via polymerase chain reaction (PCR) with the primer pair ITS1F (5′ CTT GGT CAT TTA GAG GAA GTA A 3′) (Gardes & Bruns, 1993) and ITS2 (5′ GCT GCG TTC TTC ATC GAT GC 3′, used as the reverse primer) (White et al., 1990). Amplicons were prepared for sequencing on the Illumina MiSeq platform (Illumina, San Diego, CA, USA) using the multiplexed barcoded amplicon approach, as described by Herbold et al. (2015). For further details see the earlier study by Gorka et al. (2019). The sequence data were deposited in the National Center for Biotechnology Information (NCBI) Short Read Archive under study accession no. PRJNA606050.
Preparation of mycorrhizal root tips for nanoscale secondary ion mass spectrometry analysis
To minimize potential losses of labile compounds such as sugars and amino acids, a low‐temperature freeze substitution method was used (Kilburn & Clode, 2014; Kaiser et al., 2015). Mycorrhizal root tips were dissected and immediately frozen in liquid propane (−183°C) using a plunge freezer (EM CPC; Leica Microsystems, Vienna, Austria). Samples were freeze‐substituted in 10% acrolein in diethyl ether in a −80°C freezer for 3 wk followed by a controlled warm‐up to room temperature (1.5°C h−1) in an automated freeze substitution system (AFS2; Leica Microsystems). Subsequently, they were washed in diethyl ether, and embedded and infiltrated in pure LR‐white resin (following a modified protocol after Kilburn & Clode, 2014; Kaiser et al., 2015). Heat polymerisation was performed at 40°C under vacuum. Cross‐sections, 1 µm in thickness, were cut with glass knives using an ultramicrotome UC7 (Leica Microsystems), mounted on glass slides and subsequently stained with toluidine blue. Suitable analysis areas for subsequent NanoSIMS imaging were selected using light microscopy at ×40 magnification (Leica CTR 6500; Leica Microsystems). Consecutive sections were deposited onto indium tin oxide (ITO) coated glass slides (7.1 × 7.1 × 1.1 mm; Praezisions Glas & Optik GmbH, Iserlohn, Germany) and sputter‐coated with a gold/palladium (Au : Pd; 80 : 20) layer of 40 nm (nominal thickness) to prevent electric charging through the NanoSIMS measurement process.
Nanoscale secondary ion mass spectrometry analysis
Nanoscale secondary ion mass spectrometry elemental and isotope analysis was performed using a NanoSIMS 50L instrument (Cameca, Gennevilliers, France) at the University of Vienna. Measurements were made using a 16 keV Cs+ primary ion beam with simultaneous detection of seven secondary ion species, 13C−, 12C−, 13C12C−, 12C12C−, 12C15N−, 12C14N−, 31P−, as well as secondary electrons. Sixteen images were acquired on a cross‐section of one 13C and 15N labelled mycorrhizal root tip (Fig. 2) in a mosaic array, each measuring 70 × 70 µm (with a 20 µm overlap, yielding a total image size of 200 × 200 µm). Acquiring consecutive and partly overlapping NanoSIMS images from the same sample initially led to a bias in measured 15N signatures due to adsorption of N2 with a natural isotopic abundance in areas that had already been measured; this was solved by additional pre‐sputtering between acquisition of individual images (Notes S1; Figs S2, S3). In addition, four images encompassing all mycorrhizal tissue types were acquired on a cross‐section of a mycorrhizal root tip taken from a tree which had not received any 13C or 15N, as a natural abundance control. Images were recorded as multilayer image stacks with a 512 × 512 pixel image resolution and c. 70 nm physical resolution (probe size), with a total per‐pixel dwell time of 13.5 ms. For more technical detail on the NanoSIMS measurements and data evaluation see Methods S1.
Fig. 2.

13C and 15N enrichments (at% excess, APE) of root system halves (a, b), individual fine root segments (c) and mycorrhizal root tips (d) from six beech trees grown in split‐root boxes. Mycorrhizal fungi associated with one half of the root system had access to an additional source of 15N‐labelled nitrogen (dark blue bars, closed circles) whereas mycorrhizas associated with the other half of the root system had no access to the labelled nitrogen source (light blue bars, open circles), but could have received it through internal redistribution within the plant. Trees were exposed to 13C‐labelled CO2 24 h after 15N addition and 24 h before harvest. (a, b) Bars show the mean 13C and 15N enrichment of the root system halves (calculated as the weighted mean of all measured segments of each root system half) of six plant replicates (error bar, ± SE, n = 6). (c) The lines depict linear regressions of carbon and nitrogen isotope enrichment in individual root segments (dark blue line: N‐amended side, P = 0.014, R 2 = 0.1416, n = 35; light blue line: N‐free side, P < 0.0001, R 2 = 0.39, n = 32). (d) 13C and 15N enrichments of individual root tips of N‐amended and unamended sides. Root tip data in (d) are represented on logarithmic scales. No significant correlation was found for this relationship. The specific root tip analysed using nanoscale secondary ion mass spectrometry (NanoSIMS) is marked in red (N).
Nanoscale secondary ion mass image data evaluation
Image data were processed utilizing the OpenMIMS plugin (Center for Nano Imaging, https://nano.bwh.harvard.edu/MIMSsoftware) for the image analysis software ImageJ (National Institutes of Health, Bethesda, MD, USA). Carbon isotope composition images displaying the 13C/(12C+13C) isotope fraction, designated at%13C, were inferred from the C2 − secondary ion signal intensity distribution images via per‐pixel calculation of 13C12C−/(2·12C12C−+13C12C−) intensity ratios. Similarly, nitrogen isotope composition images displaying the 15N/(14N+15N) isotope fraction, designated at%15N, were inferred from the 12CN− secondary ion signal intensity maps via per‐pixel calculation of 12C15N−/(12C15N−+12C14N−) intensity ratios. Atomic percentage excess values were determined relative to the 13C and 15N isotope fractions (at%) measured on an unlabelled control sample (Table 1). CN− secondary ion maps were used for visualization of cellular structures. Taking into account the dual stable isotope labelling of the samples, the total CN− signal intensity was obtained via per‐pixel calculation of 12C14N−(1+R13C/12C) + 12C15N−(1+R13C/12C) values, where R13C/12C refers to the carbon isotope ratio, inferred from the C2 − signal intensities (R13C/12C =13C12C−/(2·12C12C−)). Overlay images, combining structural with chemical information, were created using Adobe Photoshop CS6. Multi‐tile mosaic images were assembled with Adobe InDesign CS6.
Table 1.
Mean stable isotope signatures (at%13C and 15N) of individual regions of interest (ROIs) defined for different ectomycorrhizal tissue types (left‐most column) across NanoSIMS images from cross‐sections of an ectomycorrhizal root tip of Fagus sylvatica that had been exposed to 13CO2 and 15N labelling, and from one which had not been exposed (unlabelled control).
| Label | Control | ||||||||||||||
|---|---|---|---|---|---|---|---|---|---|---|---|---|---|---|---|
| n | at%13C | at%15N | n | at%13C | at%15N | ||||||||||
| Mean | RSD | Min | Max | Mean | RSD | Min | Max | Mean | RSD | Mean | RSD | ||||
| CW | HE | 425 | 1.29 | 0.46 | 1.05 | 5.11 | 3.93 | 1.29 | 0.48 | 21.30 | 20 | 1.08 | 0.01 | 0.37 | 0.02 |
| HM | 371 | 1.14 | 0.06 | 1.06 | 1.77 | 3.27 | 0.43 | 0.82 | 7.46 | 29 | 1.07 | 0.01 | 0.37 | 0.02 | |
| HN | 322 | 1.22 | 0.11 | 1.08 | 2.53 | 3.55 | 0.41 | 0.92 | 8.38 | 104 | 1.07 | 0.01 | 0.37 | 0.03 | |
| PC | 82 | 1.17 | 0.06 | 1.09 | 1.49 | 2.15 | 0.46 | 0.92 | 5.66 | 34 | 1.07 | 0.01 | 0.37 | 0.03 | |
| E | 34 | 1.47 | 0.44 | 1.12 | 4.22 | 1.70 | 0.64 | 0.76 | 4.10 | 16 | 1.06 | 0.00 | 0.36 | 0.03 | |
| VT | 88 | 1.67 | 0.81 | 1.13 | 6.68 | 2.39 | 0.35 | 0.67 | 3.88 | 76 | 1.07 | 0.01 | 0.37 | 0.04 | |
| L | HE | 217 | 1.16 | 0.14 | 0.98 | 2.72 | 6.10 | 0.48 | 0.31 | 16.86 | 11 | 1.06 | 0.01 | 0.37 | 0.04 |
| HM | 225 | 1.12 | 0.05 | 1.03 | 1.41 | 5.54 | 0.44 | 0.55 | 11.77 | 20 | 1.06 | 0.00 | 0.37 | 0.04 | |
| HN | 124 | 1.20 | 0.14 | 1.03 | 2.10 | 4.19 | 0.60 | 0.53 | 11.63 | 53 | 1.07 | 0.01 | 0.37 | 0.04 | |
| PC | 116 | 1.09 | 0.03 | 1.05 | 1.25 | 0.98 | 0.85 | 0.41 | 3.21 | 45 | 1.06 | 0.00 | 0.38 | 0.02 | |
| E | 24 | 1.10 | 0.05 | 1.07 | 1.30 | 1.12 | 0.76 | 0.47 | 2.57 | 10 | 1.07 | 0.00 | 0.37 | 0.02 | |
| VT | 61 | 1.14 | 0.10 | 1.06 | 1.59 | 1.56 | 0.86 | 0.44 | 4.23 | 48 | 1.06 | 0.01 | 0.37 | 0.06 | |
| Resin | 117 | 1.07 | 0.02 | 0.99 | 1.22 | 0.47 | 0.49 | 0.19 | 1.39 | 25 | 1.06 | 0.00 | 0.38 | 0.02 | |
CW, cell wall; E, endodermis; HE, extended hyphae; HM, hyphae mantle; HN, hyphae Hartig net; L, lumen; n, number of analysed ROIs; PC, plant cortex; RSD, relative standard deviation; VT, vascular tissue.
Approximately 2200 regions of interest (ROIs) were defined across all NanoSIMS images and were annotated to plant and fungal tissues on the basis of the secondary electron signal intensity maps, distinguishing between cell wall and lumen within and between cells, respectively (ImageJ/OpenMIMS). Plant and fungal tissue was further classified into subcategories, from the outside to the inside of the mycorrhizal root tip as follows: external (i.e. emanating) hyphae (HE), hyphae mantle (HM), hyphae Hartig net (HN), parenchyma plant cortex (PC), endodermis (E) and vascular tissue (VT). Average secondary ion signal intensities were extracted from each area and used for calculation of the ROI specific carbon and nitrogen isotope compositions.
Statistics
Statistical calculations were performed in R v.3.3.2 (R Core Team, 2016); linear and segmented linear regression analyses were employed, the latter using the package segmented (Muggeo, 2003, https://cran.r‐project.org/web/packages/segmented/index.html). Graphs were plotted using the package ggplot2 (Wickham, 2016; http://ggplot2.org/). Normal distribution was tested for using the Kolmogorov–Smirnov test. Variance homogeneity was tested using the F‐test. Since the data did not meet these requirements, a generalized linear model (GLM) was applied, combined with the post‐hoc Tukey test in the past (Paleontological statistics) software package (Hammer et al., 2001). Means were considered to be significantly different from each other for P < 0.05. Line‐scan analysis (see Fig. 8) was performed with a resolution of 3 pixels per data point.
Fig. 8.

13C and 15N distribution pattern in individual hyphae emanating from an ectomycorrhizal root tip of beech (Fagus sylvatica) associated with fungi from the genus Thelephora 24 h after the plant has been exposed to a 13C‐CO2 atmosphere and 48 h after the fungi accessed a 15N‐labelled N source. Selected images (a–c) showing representative examples of external hyphae at high, medium and low isotopic enrichments. (d) Breakpoint linear regression analysis showing 13C and 15N enrichment (at% excess, APE) within regions of interest (ROIs) of all external hyphae in the cross‐section of the root tip; the open triangles and the dashed line represent the cell walls; the closed circles and the solid line represent the lumen; (d) also shows the positions of both the cell walls (CW) and lumen (L) of the selected hyphae in the regression analyses: a, relatively low 15N and almost no 13C enrichment, below breakpoint (BP); b, medium enrichment, around the BP; and c, high enrichment, above the BP. The line plots on the right side of each image series show isotopic enrichment profiles across each of the three selected hyphae (solid red line: at%13C; dashed blue line: at%15N) obtained from line‐scan analysis at the positions indicated by the white lines in panels (a)‐I, (b)‐I and (c)‐I. The colour scales at the bottom of the 13C and 15N NanoSIMS images range from blue (natural abundance) to red (high isotopic enrichment). Bars: (a–c) 1 µm.
Results
Distribution of photoassimilated carbon and fungus‐delivered nitrogen at the root system scale
Our experimental setup allowed tracing of the allocation of recent photosynthates through the root system at different spatial scales. At the largest scale we distinguished between root system halves that received additional N via their mycorrhizal partners, and those that did not (Fig. 2a,b). Root segments and root tips of the ‘N‐amended’ side of the box (i.e. those connected to litter compartments which had received 15N‐labelled compounds) were significantly and highly enriched in 15N (root segments up to 0.6 at%15N excess, root tips up to 3.5 at%15N excess, Fig. 2). Root segments and root tips from the 15N‐unamended side, by contrast, were only slightly and occasionally enriched above natural abundance levels (Fig. 2). There was no difference in the overall 13C enrichment (at%13C excess) between the N‐amended and N‐unamended sides of the root system at that scale (Fig. 2b). However, we found a significant correlation between 13C and 15N enrichment of cm‐sized individual root segments in each side of the pot (Fig. 2c). The slope of the regression was steeper for the side of the plant that received 15N directly via their associated fungal hyphae (15Nexc = 0.25 × 13Cexc – 0.06, P = 0.014, R 2 = 0.1416), as root segments were generally more highly enriched in 15N (APE 15N: mean = 0.15, med = 0.09, SD = 0.16, SE = 0.027, n = 35). Root segments of the unamended side were, on average, much less enriched in 15N (mean = 0.01, med = 0.003, SD = 0.013, SE = 0.0023, n = 32). However, the correlation between the 13C and 15N enrichment of root segments in the 15N unamended side of the plant, which presumably received 15N only by internal translocation within the plant, was more significant and explained more of the variation compared to that of the 15N‐amended side (15Nexc = 0.029 × 13Cexc – 0.013, P < 0.0001, R 2 = 0.39; Fig. 2c).
The distribution of 15N was more heterogeneous across individual root tips compared to root segments on the N amended sides (mean = 0.28, SD = 0.88, SE = 0.16, n = 29); many samples were only slightly enriched, and a few were highly enriched (min = 0.0, max = 3.5, med = 0.003; Fig. 2d). There was no significant correlation between 13C and 15N across root tips of the N‐amended sides; however, the four root tips which showed a 15N enrichment of > 0.1 APE were also in the upper range of measured 13C enrichments (i.e. between 0.68 and 2.28 at%13C excess). On the 15N unamended sides only 11 out of 21 root tips were labelled above the natural abundance level (mean = 0.004, med = 0.001, max = 0.07) and there was no correlation between 13C and 15N. Similar to root segments, there was no difference in the overall mean of 13C enrichment of root tips between N‐amended and ‐unamended sides (Fig. 2d).
For analysis of 13C and 15N distributions at a smaller scale (i.e. in the tissue within a single mycorrhizal root tip) we selected one of the root tips with above‐average 15N enrichment (0.777 APE 15N and 0.682 APE 13C, Fig. 2d), under the assumption that it actively participated in the nutrient delivery from the litter compartment to the plant.
Internal transcribed spacer sequencing of the adjacent branch of this root tip revealed that the fungal community associated with this root tip was dominated by two fungal operational taxonomical units (OTUs) belonging to the genus Thelephora (constituting 35% and 23% relative abundance, with both OTUs having the identifier SH1502189.08FU according to the UNITE database; similar sequences of the same identifier have often been classified as Thelephora terrestris). All other OTUs occurred at < 1.3% relative abundance, indicating that this specific root tip was colonized by T. terrestris.
Heterogenous distribution of photoassimilated carbon and fungus‐delivered nitrogen at the cellular scale within a mycorrhizal root tip
Our NanoSIMS analysis revealed a snapshot of the in situ spatial distribution of isotopically enriched plant photosynthates and fungus‐delivered nitrogen compounds (13C, 15N; Figs 3, 4, 5, 6) in the cross‐section of an ectomycorrhizal root tip formed by F. sylvatica and T. terrestris, 24 h after photosynthesis and 48 h after the 15N‐labelled N source was added to the fungal compartment. On average, the isotopic enrichment within ROIs ranged from 0 to 20.9 at%15N excess and 0 to 5.61 at%13C excess. The highest 15N content was observed in external hyphae (up to 21 at% in cell walls, CW; and 16 at% in lumen, L), followed by fungal cells of the mantle and the Hartig net (Table 1). The plant tissue inside this root tip was also significantly enriched in 15N, with up to 4.23 at%15N in vascular tissue and epidermal cells, and up to 5.66 at%15N in plant cortex cells (Figs 4, S4; Table 1), thereby demonstrating that 15N has been passed on from the fungi to the plant. The plant cells of the vascular tissue showed the highest 13C content (6.68 at%), followed by external hyphal cells (up to 5.11 at%), which exhibited higher maxima than any of the ROIs from the plant cells of the endodermis or plant cortex. Fungal cells showed, on average, a similar 13C content to plant cortex cells.
Fig. 3.
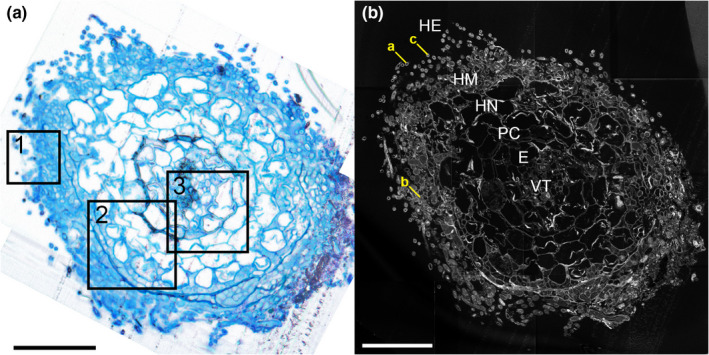
(a) Light microscopy image of a cross‐section of an ectomycorrhizal root tip of beech (Fagus sylvatica) associated with fungi from the genus Thelephora, stained with toluidine blue. Squares refer to the areas shown in Fig. 4. (b) Total CN− secondary ion signal intensity distribution image, visualizing the cellular structure of a consecutive section analysed using NanoSIMS. E, endodermis; HE, extended hyphae; HM, mantle hyphae; HN, Hartig net; PC, plant cortex; VT, vascular tissue. Labels ‘a’, ‘b’ and ‘c’ indicate external hyphae selected for linescan analysis (Fig. 8). Bars, 50 µm.
Fig. 4.

Nanoscale secondary ion mass spectrometry (NanoSIMS) images from three selected areas (indicated in Fig. 3) of the root tip cross‐section (shown as an assembled mosaic image in Figs 5, 6). Isotopic label content is displayed as at%13C and at%15N. Colour scales range from the natural isotope abundance (determined on an unlabelled control) to 3 at%13C and 20 at%15N. Image series from left to right: Total CN− signal intensity distribution, visualizing the cellular structure (a, d, g); overlay of the CN− and at%13C distribution images (b, e, h), overlay of the CN− and at%15N images (c, f, i). Colours depicting the natural abundances of 13C and 15N were omitted in the overlay images to allow for a better visualisation of the structural information (NanoSIMS images displaying solely at%13C and at%15N information are provided in Supporting Information Figs S6, S7, with colour‐blind friendly versions in Figs S8, S9). E, endodermis; HE, extended hyphae; HM, mantle hyphae; HN, Hartig net; PC, plant cortex; VT, vascular tissue. Red arrows indicate (a) the septate hyphae structure and (e) a punctual 13C enrichment in Hartig net hyphae. Bars, 10 µm.
Fig. 5.

Nanoscale secondary ion mass spectrometry (NanoSIMS) visualization of the spatial distribution of 13C enrichment within an ectomycorrhizal root tip of beech (Fagus sylvatica) associated with fungi from the genus Thelephora 24 h after the plant has been exposed to a 13C‐CO2 atmosphere and 48 h after the fungi accessed a 15N‐labelled N source. Shown is an overlay of the total CN− secondary ion signal intensity distribution image (Supporting Information Fig. S10) and the corresponding 13C label distribution image (Fig. S6) acquired on a cross‐section of the sampled root tip. The picture consists of 16 individual images (each 50 × 50 µm), assembled as a mosaic. The isotopic label content is presented as at%13C, displayed on a false colour scale ranging from the natural abundance value (dark blue, determined on an unlabelled control) to 3 at%13C (red). For a better visualization of areas enriched in 13C, colouring representing the natural abundance of the isotope is omitted in the overlay image (NanoSIMS images displaying solely at%13C information are provided in Fig. S6, with a colour‐blind friendly version in Fig. S8). White arrows indicate external hyphae exhibiting low 13C and 15N enrichment, which typically show 15N in the centre of the hyphal cross‐section (decoupled from 13C enrichment), whereas red arrows indicate those with overall high 13C and 15N enrichment, where 13C and 15N are typically co‐localized in the outer ring of a hyphal cross‐section (cf. Fig. 8). Bar, 50 µm.
Fig. 6.

Nanoscale secondary ion mass spectrometry (NanoSIMS) visualization of the spatial distribution of 15N enrichment within an ectomycorrhizal root tip of beech (Fagus sylvatica) associated with fungi from the genus Thelephora 24 h after the plant has been exposed to a 13C‐CO2 atmosphere and 48 h after the fungi accessed a 15N‐labelled N source. Shown is an overlay of the total CN− signal intensity distribution image (Supporting Information Fig. S8) and the corresponding 15N label distribution image (Fig. S7), acquired on a cross‐section of the sampled root tip. The picture consists of 16 individual images, assembled as a mosaic (each 50 × 50 µm). The isotopic label content is presented in terms of at%, displayed on a false‐colour scale ranging from the natural abundance value (dark blue, determined on an unlabelled control) to 20 at%15N (red). For a better visualization of areas enriched in 15N, colouring representing the natural abundance of the isotope is omitted in the overlay image (NanoSIMS images displaying solely at%15N information are provided in Fig. S7, with a colour‐blind friendly version in Fig. S9). White arrows indicate external hyphae exhibiting low 13C and 15N enrichment, which typically show 15N in the centre of the hyphal cross‐section (decoupled from 13C enrichment), whereas red arrows indicate those with overall high 13C and 15N enrichment, where 13C and 15N are typically co‐localized in the outer ring of a hyphal cross‐section (cf. Fig. 8). Bar, 50 µm.
There was a clearly heterogeneous distribution of 13C and 15N, with strong local enrichments, especially in hyphae emanating from the mantle into the soil (‘external hyphae’, HE; Figs 5, 6). These few extraordinary hyphae (c. 10 out of 200) showed by far the highest relative isotopic enrichments (max. 5.11 at%13C, 21.3 at%15N) of all fungal tissues (Fig. 3b,c). By contrast, the majority of hyphae showed only slight 13C enrichment, with 75% of all defined ROIs being within the lowest 2.1% of all measured 13C enrichment values (< 0.12 at%13C excess). Only 3.4% and 0.09% of all measured ROIs showed no significant enrichment in 13C and 15N, respectively.
A closer visual inspection of the 16 NanoSIMS images taken from the cross‐section of the mycorrhizal root tip also revealed interesting details regarding the spatial distribution of labelled C and N at the sub‐cellular scale (Figs 4, 5, 6). Especially in fungal cells of the Hartig net, 13C‐labelled compounds derived from recent photosynthesis appeared often as collections of ‘droplets’ inside individual fungal cells (Figs 4e, 5). This pattern is less visible in the fungal mantle cells, which are also overall less enriched in 13C, and is not visible in the external hyphae. The CN− secondary ion signal intensity distribution image, which displays structural details, reveals that the outer ring or ‘cell walls’ of cross‐sectioned external hyphae is/are characterized by a septate‐like structure (Fig. 4a). Interestingly, these outer cell areas often carry particularly high co‐enrichments of 15N and 13C, as visible in the overlay images (Figs 4b,c, 5, 6).
Strong spatial correlation between recent photosynthates and fungus‐delivered nitrogen at cellular scales
We found a strong spatial correlation (Spearman rank correlation, r s_fungi = 0.45, P < 0.0001, r s_plant = 0.81, P < 0.0001) between 13C and 15N enrichment across 2090 ROIs defined from plant and fungal tissues in 16 individual NanoSIMS images obtained from one root tip cross‐section (Fig. 7). There is a strong linear relationship between 15N and 13C at low 13C enrichment, but only up to a certain threshold of 13C and 15N, after which there is either no longer a significant correlation or a correlation with a slope that is much less steep (Fig. 7; Table 2). We performed a model selection procedure based on the log likelihood information criteria (AIC/BIC), where a breakpoint regression model was chosen over log transformation models of 13C and/or 15N (Table S1). The regression slope breakpoint occurs at lower 13C enrichment in plant tissue than fungal tissue, except for the plant vascular tissue (Table 2). We found different trends in cell walls and lumen, with the relationship at high enrichment levels being mainly characterized by strong 13C labelling in cell walls.
Fig. 7.

Spatial correlation of relative 13C and 15N enrichment in plant (green) and fungal (purple) tissues. Each data point represents 13C and 15N enrichment (in at% excess, APE) of one region of interest (ROI) obtained from NanoSIMS images (Supporting Information Figs S6, S7) of a complete cross‐section of an ectomycorrhizal root tip of beech (Fagus sylvatica). Regions of interest were grouped according to tissue type (fungus: external hyphae, hyphal mantle, Hartig net; plant: plant cortex, endodermis, vascular tissue). For each tissue type ROIs were further categorized into lumen (circles) and cell walls (triangles). (a, b) Overview correlations combining lumen and cell wall ROIs of plant cortex and external hyphae, respectively. Lines represent the fit of a logarithmic regression model (fungi: R 2 = 0.51, P < 2.2e− 16; plant: R 2 = 0.75, P < 2.2e− 16). (c) Segmented linear regression analyses for each tissue type. Significant correlations are depicted as solid lines; nonsignificant correlations depicted as dashed lines. Breakpoints of regressions (in c) are located at the kink of each line. Coefficients of determination (R 2), significance values (P) and slopes of correlations depicted in (c) are provided in Table 2. The axis scales are optimized for the data ranges of each correlation; correlations with fixed axis scales for better comparisons among tissue types are provided in Fig. S5.
Table 2.
Segmented linear regression analysis of isotopic enrichment (at% excess, APE 13C and 15N) of regions of interest (ROIs) of distinct tissue types measured by nanoscale secondary ion mass spectrometry (NanoSIMS) on a cross‐section of an ectomycorrhizal root tip of Fagus sylvatica shortly (1 and 2 d for 13C and 15N, respectively) after exposure to 13CO2 and 15N labelling.
| Segmented linear model | ||||||||||
|---|---|---|---|---|---|---|---|---|---|---|
| Total | Low | High | ||||||||
| BP | SE | R 2 | R 2 | a | P | R 2 | a | P | ||
| Fungi | CW | 1.93 | 0.096 | 0.65 | 0.54 | 7.77 | *** | 0.45 | −1.50 | * |
| L | 0.06 | 0.005 | 0.39 | 0.30 | 64.09 | *** | 0.05 | 3.27 | *** | |
| Plant | CW | 0.14 | 0.016 | 0.28 | 0.18 | 9.94 | *** | 0.09 | 0.32 | *** |
| L | 0.11 | 0.01 | 0.76 | 0.62 | 20.09 | *** | 0.10 | ns | ||
| HE | CW | 1.493 | 0.084 | 0.78 | 0.62 | 8.86 | *** | 0.04 | ns | |
| L | 0.088 | 0.01 | 0.48 | 0.33 | 53.09 | *** | 0.21 | 4.90 | *** | |
| HM | CW | 0.111 | 0.013 | 0.28 | 0.22 | 21.42 | *** | 0.00 | ns | |
| L | 0.063 | 0.006 | 0.45 | 0.36 | 77.51 | *** | 0.00 | ns | ||
| HN | CW | 0.13 | 0.024 | 0.18 | 0.07 | 12.13 | *** | 0.10 | 2.54 | *** |
| L | 0.056 | 0.013 | 0.40 | 0.27 | 52.64 | *** | 0.12 | 4.59 | ** | |
| PC | CW | 0.311 | 0.112 | 0.69 | 0.71 | 13.54 | *** | Na | ||
| L | 0.049 | 0.006 | 0.83 | 0.71 | 27.24 | *** | 0.41 | 8.32 | * | |
| E | CW | 0.33 | 0.658 | 0.18 | 0.17 | 21.95 | ns | 0.26 | ns | |
| L | 0.031 | 0.009 | 0.81 | 0.42 | 23.00 | * | 0.40 | ns | ||
| VT | CW | 1.283 | 0.595 | 0.32 | 0.07 | 1.12 | * | 0.08 | ns | |
| L | 0.212 | 0.037 | 0.70 | 0.54 | 13.76 | *** | 0.07 | ns | ||
a, regression slope; BP, estimated breakpoint of segmented linear regression; CW, cell wall; E, endodermis; HE, extended hyphae; HM, hyphae mantle; HN, hyphae Hartig net; L, lumen; P, significance level (*, P < 0.05; **, P < 0.01; ***, P < 0.001; ns, not significant; na, not applicable); PC, plant cortex; R 2, coefficient of determination; SE, standard error; VT, vascular tissue.
Sub‐cellular spatial distribution of photoassimilates and nitrogen in external hyphae
We observed two typical patterns of 13C and 15N spatial distribution in cross‐sectioned external hyphae within all NanoSIMS images (indicated in Figs 5, 6), three examples of which are outlined in more detail in Fig. 8. These two patterns can be summarised as follows: first, when hyphae had a relatively low overall enrichment of 13C (i.e. they were located below the regression breakpoint, Fig. 8a,d), 15N was mainly located in the middle of the hyphae (Fig. 8a, further examples are indicated by white arrows in Figs 5, 6), while 13C enrichment was observed in the outer parts of cross‐sectioned hyphae (i.e. not spatially correlated with 15N at that scale); second, at relatively high 13C (and 15N) enrichments (i.e. above the regression breakpoint, Fig. 8c,d) 15N and 13C were present all over the cross‐section, but their enrichments peaked in the outer ring of the hyphae, where they were strongly spatially correlated (Fig. 8c,d and red arrows in Figs 5, 6).
Discussion
We conducted a 13C and 15N double labelling experiment to trace the path of recently assimilated plant C and fungus‐delivered N through an ectomycorrhizal system. If plants allocate more C to N‐delivering fungal partners, we expect 13C and 15N to be correlated at a given spatial scale – that is, across root segments, root tips or cells within a root tip. While we observed no link between 13C and 15N at the root system scale, we found a surprisingly strong spatial correlation within the mycorrhizal tissue of a single root tip.
Our plants received a significant amount of 15N‐enriched N within 48 h via mycorrhizal fungi associated with half of their root system. On average, 20.2 µg of excess 15N was found in each plant, corresponding to c. 7% of the 15N added to the litter compartments (Gorka et al., 2019). The majority of this N was found in the root system half connected to the 15N‐receiving litter compartment (Fig. 2a). Despite the differences in additional N uptake between the two root system halves, photoassimilated C was equally allocated to both (Fig. 2b), indicating that plants did not allocate more C to parts of the root system which had access to greater quantities of N. We did, however, observe a correlation between at%13C and at%15N across individual cm‐sized root segments in each of the root system halves (Fig. 2c). This correlation, though, was far more significant in root segments of the N‐unamended side, where 15N could only arrive by internal redistribution within the plant (Fig. 2c). This indicates that 13C was more likely to be attracted to places that the newly obtained 15N had been relocated to – so that they could be used together for growth or maintenance, for example – rather than to the places colonized by N‐delivering fungal partners. These results are in contrast to the findings of Bogar et al. (2019) who showed, also in a split‐root experiment, that Pinus seedlings directed recent photosynthates preferentially to roots and mycorrhizas that had access to an additional nitrogen source. The different outcomes may be the result of the different temporal scales of the experiments, as Bogar et al. (2019) supplied additional nitrogen over a time period of four months, while we only provided a one‐time addition shortly before 13CO2 labelling. It could, however, also be attributed to differences in C allocation strategies in specific host‐symbiont pairings.
The enrichment of 13C and 15N across mycorrhizal root tips was much more heterogenous than that observed in the root segments. Although there was no significant correlation, it seems that root tips with a high 15N enrichment were also always highly enriched in 13C, whereas root tips with a high 13C enrichment did not necessarily show a high 15N enrichment (Fig. 2d). This could mean that plants not only gave more C to N‐delivering fungi, but also to fungi bringing other benefits/nutrients, which we did not measure. In addition, as the roots of our plants were colonized by different fungal species, it could also be the result of fungal‐species specific plant C allocation (Pena & Polle, 2013). Interestingly, there were no root tips with high 15N but low 13C, demonstrating that plants may indeed need to invest recently photoassimilated C into the acquisition of N from fungi.
Nanoscale secondary ion mass spectrometry imaging revealed novel insights into the spatial distribution of recent photosynthates and fungus‐delivered N at the cellular scale in an ectomycorrhizal root tip. Many of the external hyphae in our root cross‐section were significantly, and highly, labelled in 15N, indicating that they had been rapidly taking up 15N from the litter compartment. The fact that the vascular bundle of the root was also highly enriched in 15N (up to 5 APE), indicates that the fungi passed on a considerable share of the N they took up to the plants. The high heterogeneity in 15N enrichment across individual external fungal hyphae (ranging from 0.48 to 21.30 at%15N enrichment) could be the result of hyphal ends growing into different areas of soil and litter compartments, allowing some hyphae to access more 15N than others. Surprisingly, the heterogenous spatial distribution of 15N was matched by a similarly heterogenous distribution of 13C (Figs 5, 6). In particular, external fungal hyphae that were extraordinarily highly enriched in 15N were also extraordinarily highly enriched in 13C, with values often almost as high as those of the plant's phloem (up to 5.11 at%13C, Table 1).
The high heterogeneity of 13C distribution across the fungal mantle and external hyphae, and its strong link to the 15N distribution, is astonishing. To the best of our knowledge, our study is the first, or one of the first, to visualize the distribution of recent photosynthates and fungus‐delivered N at the scale of individual cells in the ectomycorrhizal tissue. Bücking & Heyser (2001) investigated the small‐scale distribution of 14C‐labelled photosynthates and 33P‐labelled P in longitudinal sections of ectomycorrhizal root tips of poplar seedlings using microautoradiography. In contrast to our results, they reported a homogenous distribution of photosynthates across the fungal sheath, which could perhaps be ascribed to a longer incubation period of 5 d after their seedlings were exposed to a 14CO2 pulse, or a lower spatial resolution.
Relative enrichments of 13C and 15N were significantly spatially correlated across the whole root tip cross‐section (Figs 7, S5), indicating that N recently taken up by mycorrhizal fungi is coupled to recently plant‐assimilated C within the mycorrhizal tissue. When interpreting this pattern, we have to bear in mind the fact that our NanoSIMS analysis represents a snapshot in time shortly (c. 24 h) after 13C entered the plant via photosynthesis and 15N was taken up by mycorrhizal fungi. The 13C and 15N distribution we observe in the plant and fungal cells could be the result of a variety of physiological processes, including solute transfer, growth, and the build‐up of storage compounds.
The strong co‐location of 13C and 15N in plant and fungal cells could in principle reflect growth processes which utilize both plant‐assimilated C and N from fungal uptake. For the emanating (‘external’) fungal hyphae in our cross‐sections however, we think that this would be an unlikely scenario. Fungal hyphae grow in a polarized manner, by apical extension exclusively at the hyphal tip (requiring a specialised enzymatic machinery and a long‐range tip‐ward transport of secretory vesicles; Lew, 2011; Riquelme, 2013; Steinberg et al., 2018). These growing tips of ectomycorrhizal hyphae emanating from roots are located downstream in the soil, or in our case – as indicated by high 15N enrichments – most likely in the litter compartments. The growth of new hyphal tissue in emanating hyphae within a few µm around the root can only occur if new hyphal branches form there. Given that we captured around 200 individual emanating hyphae in our NanoSIMS images, we think – even if some new hyphal branches may have formed in the last 24 h – that a large proportion of them likely represent hyphae that were already established, and thus would grow only at their remote tips. We therefore think that growth processes are insufficient to explain the strong correlation between at%13C and at%15N we observed across external hyphae.
The observation that 15N enrichment was on average higher in fungal cells than plant cells (Fig. S4) is probably due to the fact that fungi had access to the 15N first. However, it could also reflect an accumulation of 15N in fungal tissue which is not transferred to the host plant. It has been hypothesised that ectomycorrhizal fungi hoard N in N‐limited situations (Corrêa et al., 2012; Näsholm et al., 2013). Although fungal storage of N in the mantle is in principle possible, we did not find strong signs of accumulation of N in fungal tissues. In fact, strong correlations only occurred between the relative isotopic enrichments (i.e. in at% or APE, Figs 7, S5) in fungal tissues, but there was no systematic increase in total N with relative enrichments of 15N (or 13C) (Fig. S5). This indicates that the freshly taken up 15N did not accumulate on top of the existing N, but rather replaced it. For example, a relative enrichment of around 20 at%15N in external hyphae without a corresponding increase in total N means that one fifth of their N has been replaced by the new labelled source (which had a relative enrichment of 99 at%15N) within 48 h. This points towards a rapid turnover of N in external hyphae, which we might expect to occur under the active transport of N. We therefore think that it is more likely that the relative 15N enrichment of external hyphae reflects N in active transport processes towards the plant–fungal interface, rather than growth or local storage of N.
Characteristics and qualities of at%13C : at%15N regressions (i.e. slope, R 2) substantially differed between ectomycorrhizal tissue types (Table 2; Figs 7, S5). For example, the slope of the regression (which can be interpreted as the increase in 15N per increase in 13C) was much steeper in the lumen compared to the cell walls across all fungal tissues (Table 2). These differences indicate that the spatial distribution of recently photoassimilated C and fungus‐delivered N was governed by different mechanisms in the different tissue types.
Interestingly, we found biphasic trends of correlations between 13C and 15N in all tissues forming the mycorrhizal root tip (Fig. 7). In all cases, a strong linear relationship between 15N and 13C enrichment occurred up to a certain threshold, from which further increases in 13C enrichment were accompanied by only marginal enrichments in 15N. Different explanations are possible for such a pattern. One could be that substantially different mechanisms are driving the pattern below and above the breakpoint; for example, it could be caused by transport processes below the threshold but reflect growth of new tissue above it. Alternatively, certain ‘threshold’ amounts of labile N could trigger changes in cell metabolism, signalling or transporter activity, which may increase the C sink strength of the tissue. Finally, under the assumption that the observed spatial patterns reflect transport processes, the observed ‘threshold’ relationship could indicate that obtaining larger quantities of N requires a disproportionately higher C investment compared to smaller quantities (Kummel & Salant, 2006). This could be because small quantities may be readily accessible by the existing fungal hyphal network, whereas larger ones may require additional C‐costly hyphal growth and foraging (e.g. fan formation).
Interestingly, we identified contrasting spatial patterns of 13C and 15N distribution in cross‐sectioned external hyphae at low and high isotopic enrichments (Fig. 8). These patterns are difficult to interpret as not much is known about the bi‐directional transfer of C and N in ectomycorrhizal hyphae. Solutes can be transported in fungal mycelia by a variety of mechanisms, such as diffusion, mass flow, motor‐driven vesicular transport or cytoplasmic streaming (Cairney, 2005; Lew, 2011). Nitrogen is known to be transported in the form of amino acids through fungal hyphae (Cruz et al., 2007; Chalot & Plassard, 2011; Koide et al., 2014). It has recently been proposed that this happens within a dynamic network of vacuoles linked by tubules through the ectomycorrhizal mycelia (Ashford & Allaway, 2002; Darrah et al., 2006; Fricker et al., 2018; Nehls & Plassard, 2018). Vacuole transport, however, is based on diffusion, and is therefore relatively slow (Fricker et al., 2018). The fact that the added N‐compounds in our system have travelled a distance of c. 8 cm within 48 h indicate that nondiffusion‐based transport mechanisms, such as mass‐flow or cytoplasmic streaming, were also involved. In both mass‐flow and cytoplasmic streaming, nutrients are channelled through the septal pores in the middle of the hyphae, which may explain why N appears to be highest in the center of the cross‐sectioned hyphae in the ‘relatively low isotopic enrichment’ type (Fig. 8a, white arrows in Figs 5, 6). The observed colocation of high 13C and 15N enrichments in the outer ring of ‘relatively high isotopic enrichment’ hyphae (Fig. 8c, red arrows in Figs 5, 6), on the other hand, could represent temporary storage of 13C and 15N co‐labelled amino acids in the dynamic tubular vacuole network, which has been suggested to be linked to hyphal walls (Ashford & Allaway, 2002; Darrah et al., 2006), and to serve as temporary storage for N in the form of amino acids upon their export to the plant as NH4 (Nehls & Plassard, 2018). The co‐location of high 13C and 15N enrichments in the outer ring, could, however, alternatively also resemble growth of newly branched hyphal tips, with the obvious limitations discussed in the paragraph on growth above. We also cannot rule out the possibility that the high isotopic enrichments in the outer ring could be a result of bacteria colonizing the hyphal surface and feeding on hyphal exudates (Gorka et al., 2019).
We analysed twenty 70 × 70 µm fields of view using NanoSIMS to visualize the isotopic distribution of C and N in a complete cross‐section of an ectomycorrhizal root tip. While our results provide novel insights into the spatial distribution of recent photosynthates and fungus‐delivered N in the ectomycorrhizal tissue, they nonetheless only allow conclusions to be drawn for one specific ectomycorrhizal association. Further studies are needed to understand whether different ectomycorrhizal associations exhibit different C and N distribution patterns, and to assess their temporal dynamics. Still, our results demonstrate the power of combining stable isotope tracing with NanoSIMS to investigate C and N exchange at the cellular scale in the mycorrhizal symbiosis, and highlight the fact that processes governing this exchange may operate even at the small‐scale of individual emanating fungal hyphae.
Author contributions
CK conceived the idea for the study, and developed the experimental design together with AR and DW. WM, SG, JW, VM, MD and RG carried out the experimental work under the supervision of CK, AR and DW. RG and MD did preliminary tests. MD carried out the sequencing analysis of the root tip sample. PC, M Wagner, M Weidinger, SR and AS contributed to the development of the method of visualizing labile C and N compounds in ectomycorrhizal tissue using NanoSIMS. WM carried out NanoSIMS sample preparation with support from SR. AS performed the NanoSIMS measurements. WM did the image processing and data analysis and wrote the first draft of the paper, supported by CK. All co‐authors contributed to the paper revision, and CK wrote the final version of the paper.
Supporting information
Fig. S1 Macro photography of an ectomycorrhizal root tip of beech.
Fig. S2 12C14N− secondary ion signal intensity distribution images recorded in the first analysis run.
Fig. S3 12C14N− secondary ion signal intensity distribution and inferred at%15N distribution of consecutive fields of view without additional pre‐sputtering.
Fig. S4 Stable isotope enrichment of 13C and 15N in plant and fungal tissues measured on a cross‐section of an ectomycorrhizal root tip of beech (Fagus sylvatica) determined via NanoSIMS.
Fig. S5 Correlations between relative abundances of 13C and 15N (at%), and total N in regions of interest (ROIs) of a cross‐section of a mycorrhizal root.
Fig. S6 Nanoscale secondary‐ion mass (NanoSIMS) visualization of the 13C label distribution in a beech ectomycorrhizal root tip cross‐section.
Fig. S7 NanoSIMS visualization of the 15N label distribution in a beech ectomycorrhizal root tip cross‐section.
Fig. S8 Colour‐blind friendly NanoSIMS visualization of the 13C label distribution in a beech ectomycorrhizal root tip cross‐section.
Fig. S9 Colour‐blind friendly NanoSIMS visualization of the 15N label distribution in a beech ectomycorrhizal root tip cross‐section.
Fig. S10 NanoSIMS total CN− secondary ion signal intensity distribution image of a beech ectomycorrhizal root tip cross‐section (Fagus sylvatica and Thelephora fungi), visualizing the cellular structure of the sample.
Methods S1 Additional methodological details of the NanoSIMS analysis.
Notes S1 Potential bias of 15N measurements due to N2 adsorption during consecutive NanoSIMS analyses of multiple fields of view on one sample.
Table S1 Regression analysis of 13C vs 15N isotope enrichment (at% excess, APE) in distinct tissue types of an ectomycorrhizal root tip.
Please note: Wiley Blackwell are not responsible for the content or functionality of any Supporting Information supplied by the authors. Any queries (other than missing material) should be directed to the New Phytologist Central Office.
Acknowledgements
Microscopy work was performed at the Core Facility Cell Imaging and Ultrastructure Research, University of Vienna, which is a member of the Vienna Life‐Science Instruments (VLSI) initiative. We particularly wish to thank Prof. Irene Lichtscheidl and Peter Schweiger for thoughtful discussions and support during experimental set up and method development, and Dr. Jean‐Marie Volland for aid in method development. We thank Heinz Pfeiffer from the workshop of the Faculty of Life Sciences, University of Vienna, for building the split‐root boxes and the labelling chamber, Thomas Joch for help with planting and Katharina Ranefeld for support with the design and layout of Fig. 1. We thank the University of Vienna for supporting the NanoSIMS facility of the Centre for Microbiology and Environmental Systems Science. We thank the editor and four anonymous reviewers for thoughtful comments which helped to improve the manuscript.
Data availability
The data that support the findings of this study are openly available on Zenodo at 10.5281/zenodo.5035482 (Mayerhofer et al., 2021). The sequence data were deposited in the National Center for Biotechnology Information (NCBI) Short Read Archive under study accession no. PRJNA606050.
References
- Agerer R. 1989. Colour atlas of ectomycorrhizae. Schwäbisch Gmünd, Germany: Einhorn‐Verlag+Druck. [Google Scholar]
- Albarracín MV, Six J, Houlton BZ, Bledsoe CS. 2013. A nitrogen fertilization field study of carbon‐13 and nitrogen‐15 transfers in ectomycorrhizas of Pinus sabiniana . Oecologia 173: 1439–1450. [DOI] [PubMed] [Google Scholar]
- Angel R. 2012. Total nucleic acid extraction from soil. Protocol exchange . [WWW document] URL https://www.nature.com/protocolexchange/protocols/2484 [accessed 20 July 2021].
- Ashford AE, Allaway WG. 2002. The role of the motile tubular vacuole system in mycorrhizal fungi. Plant and Soil 244: 177–187. [Google Scholar]
- Bever JD, Richardson SC, Lawrence BM, Holmes J, Watson M. 2009. Preferential allocation to beneficial symbiont with spatial structure maintains mycorrhizal mutualism. Ecology Letters 12: 13–21. [DOI] [PubMed] [Google Scholar]
- Bogar L, Peay K, Kornfeld A, Huggins J, Hortal S, Anderson I, Kennedy P. 2019. Plant‐mediated partner discrimination in ectomycorrhizal mutualisms. Mycorrhiza 29: 97–111. [DOI] [PubMed] [Google Scholar]
- Bücking H, Heyser W. 2001. Microautoradiographic localization of phosphate and carbohydrates in mycorrhizal roots of Populus tremula x Populus alba and the implications for transfer processes in ectomycorrhizal associations. Tree Physiology 21: 101–107. [DOI] [PubMed] [Google Scholar]
- Cairney JWG. 2005. Basidiomycete mycelia in forest soils: dimensions, dynamics and roles in nutrient distribution. Mycological Research 109: 7–20. [DOI] [PubMed] [Google Scholar]
- Chalot M, Plassard C. 2011. Ectomycorrhiza and nitrogen provision to the host tree. In: Polacco JC, Todd CD, eds. Ecological aspects of nitrogen metabolism in plants. Hoboken, NJ, USA: John Wiley & Sons, 69–94. [Google Scholar]
- Chen W, Koide RT, Adams TS, DeForest JL, Cheng L, Eissenstat DM. 2016. Root morphology and mycorrhizal symbioses together shape nutrient foraging strategies of temperate trees. Proceedings of the National Academy of Sciences, USA 113: 8741–8746. [DOI] [PMC free article] [PubMed] [Google Scholar]
- Cheng L, Chen W, Adams TS, Wei X, Li L, McCormack ML, Deforest JL, Koide RT, Eissenstat DM. 2016. Mycorrhizal fungi and roots are complementary in foraging within nutrient patches. Ecology 97: 2815–2823. [DOI] [PubMed] [Google Scholar]
- Corrêa A, Gurevitch J, Martins‐Loução MA, Cruz C. 2012. C allocation to the fungus is not a cost to the plant in ectomycorrhizae. Oikos 121: 449–463. [Google Scholar]
- Cruz C, Egsgaard H, Trujillo C, Ambus P, Requena N, Martins‐Loução MA, Jakobsen I. 2007. Enzymatic evidence for the key role of arginine in nitrogen translocation by arbuscular mycorrhizal fungi. Plant Physiology 144: 782–792. [DOI] [PMC free article] [PubMed] [Google Scholar]
- Darrah PR, Tlalka M, Ashford A, Watkinson SC, Fricker MD. 2006. The vacuole system is a significant intracellular pathway for longitudinal solute transport in basidiomycete fungi. Eukaryotic Cell 5: 1111–1125. [DOI] [PMC free article] [PubMed] [Google Scholar]
- Eissenstat DM, Kucharski JM, Zadworny M, Adams TS, Koide RT. 2015. Linking root traits to nutrient foraging in arbuscular mycorrhizal trees in a temperate forest. New Phytologist 208: 114–124. [DOI] [PubMed] [Google Scholar]
- Fellbaum CR, Gachomo EW, Beesetty Y, Choudhari S, Strahan GD, Pfeffer PE, Kiers ET, Bucking H. 2011. Carbon availability triggers fungal nitrogen uptake and transport in arbuscular mycorrhizal symbiosis. Proceedings of the National Academy of Sciences, USA 109: 2666–2671. [DOI] [PMC free article] [PubMed] [Google Scholar]
- Fellbaum CR, Mensah JA, Cloos AJ, Strahan GE, Pfeffer PE, Kiers ET, Bücking H. 2014. Fungal nutrient allocation in common mycorrhizal networks is regulated by the carbon source strength of individual host plants. New Phytologist 203: 646–656. [DOI] [PubMed] [Google Scholar]
- Fricker MD, Heaton LLM, Jones NS, Boddy L. 2018. The mycelium as a network. In: Heitman J, Howlett B, Crous P, Stukenbrok E, James T, Gow N, eds. The fungal kingdom. Washington, DC, USA: American Society for Microbiology, 335–367. [Google Scholar]
- Gardes M, Bruns TD. 1993. ITS primers with enhanced specificity for basidiomycetes, application to the identification of mycorrihiza and rusts. Molecular Ecology 2: 113–118. [DOI] [PubMed] [Google Scholar]
- Gorka S, Dietrich M, Mayerhofer W, Gabriel R, Wiesenbauer J, Martin V, Zheng Q, Imai B, Prommer J, Weidinger M et al. 2019. Rapid transfer of plant photosynthates to soil bacteria via ectomycorrhizal hyphae and its interaction with nitrogen availability. Frontiers in Microbiology 10: 168. [DOI] [PMC free article] [PubMed] [Google Scholar]
- Hammer Ø, Harper DAT, Ryan PD. 2001. PAST: paleontological statistics software package for education and data analysis. Palaeontologia Electronica 4: 9. [Google Scholar]
- Herbold CW, Pelikan C, Kuzyk O, Hausmann B, Angel R, Berry D, Loy A. 2015. A flexible and economical barcoding approach for highly multiplexed amplicon sequencing of diverse target genes. Frontiers in Microbiology 6: 1–8. [DOI] [PMC free article] [PubMed] [Google Scholar]
- Hortal S, Plett KL, Plett JM, Cresswell T, Johansen M, Pendall E, Anderson IC. 2017. Role of plant–fungal nutrient trading and host control in determining the competitive success of ectomycorrhizal fungi. The ISME Journal 11: 2666–2676. [DOI] [PMC free article] [PubMed] [Google Scholar]
- Kaiser C, Kilburn MR, Clode PL, Fuchslueger L, Koranda M, Cliff JB, Solaiman ZM, Murphy DV. 2015. Exploring the transfer of recent plant photosynthates to soil microbes: mycorrhizal pathway versus direct root exudation. New Phytologist 205: 1537–1551. [DOI] [PMC free article] [PubMed] [Google Scholar]
- Kiers ET, Duhamel M, Beesetty Y, Mensah JA, Franken O, Verbruggen E, Fellbaum CR, Kowalchuk GA, Hart MM, Bago A et al. 2011. Reciprocal rewards stabilize cooperation in the mycorrhizal symbiosis. Science 333: 880–882. [DOI] [PubMed] [Google Scholar]
- Kiers ET, West SA, Wyatt GAK, Gardner A, Bücking H, Werner GDA. 2016. Misconceptions on the application of biological market theory to the mycorrhizal symbiosis. Nature Plants 2: 16063. [DOI] [PubMed] [Google Scholar]
- Kilburn MR, Clode PL. 2014. Elemental and isotopic imaging of biological samples using NanoSIMS. In: Kuo J, ed. Electron microscopy: methods and protocols, methods in molecular biology. New York, NY, USA: Springer Science & Business Media, 733–755. [DOI] [PubMed] [Google Scholar]
- Koide RT, Fernandez C, Malcolm G. 2014. Determining place and process: functional traits of ectomycorrhizal fungi that affect both community structure and ecosystem function. New Phytologist 201: 433–439. [DOI] [PubMed] [Google Scholar]
- Kummel M, Salant SW. 2006. The economics of mutualisms: optimal utilization of mycorrhizal mutualistic partners by plants. Ecology 87: 892–902. [DOI] [PubMed] [Google Scholar]
- Lang C, Polle A. 2011. Ectomycorrhizal fungal diversity, tree diversity and root nutrient relations in a mixed Central European forest. Tree Physiology 31: 531–538. [DOI] [PubMed] [Google Scholar]
- Lang C, Seven J, Polle A. 2011. Host preferences and differential contributions of deciduous tree species shape mycorrhizal species richness in a mixed Central European forest. Mycorrhiza 21: 297–308. [DOI] [PMC free article] [PubMed] [Google Scholar]
- Lew RR. 2011. How does a hypha grow? The biophysics of pressurized growth in fungi. Nature Reviews Microbiology 9: 509–518. [DOI] [PubMed] [Google Scholar]
- Lindahl BD, Tunlid A. 2015. Ectomycorrhizal fungi – potential organic matter decomposers, yet not saprotrophs. New Phytologist 205: 1443–1447. [DOI] [PubMed] [Google Scholar]
- López MF, Dietz S, Grunze N, Bloschies J, Weiß M, Nehls U. 2008. The sugar porter gene family of Laccaria bicolor: function in ectomycorrhizal symbiosis and soil‐growing hyphae. New Phytologist 180: 365–378. [DOI] [PubMed] [Google Scholar]
- Mayerhofer W, Schintlmeister A, Dietrich M, Gorka S, Woebken D, Richter A, Kaiser C. 2021. Data set for the article “Recently photoassimilated Carbon and fungus‐delivered Nitrogen are spatially correlated at the cellular scale in the ectomycorrhizal tissue of Fagus sylvatica”. Zenodo . doi: 10.5281/zenodo.5035482. [DOI] [PMC free article] [PubMed]
- Muggeo VMR. 2003. Estimating regression models with unknown breakpoints. Statistics in Medicine 22: 3055–3071. [DOI] [PubMed] [Google Scholar]
- Näsholm T, Högberg P, Franklin O, Metcalfe D, Keel SG, Campbell C, Hurry V, Linder S, Högberg MN. 2013. Are ectomycorrhizal fungi alleviating or aggravating nitrogen limitation of tree growth in boreal forests? New Phytologist 198: 214–221. [DOI] [PubMed] [Google Scholar]
- Nehls U. 2008. Mastering ectomycorrhizal symbiosis: the impact of carbohydrates. Journal of Experimental Botany 59: 1097–1108. [DOI] [PubMed] [Google Scholar]
- Nehls U, Plassard C. 2018. Nitrogen and phosphate metabolism in ectomycorrhizas. New Phytologist 220: 1047–1058. [DOI] [PubMed] [Google Scholar]
- Pena R, Polle A. 2013. Attributing functions to ectomycorrhizal fungal identities in assemblages for nitrogen acquisition under stress. The ISME Journal 8: 321–330. [DOI] [PMC free article] [PubMed] [Google Scholar]
- R Core Team . 2016. R: a language and environment for statistical computing. Vienna, Austria: R Foundation for Statistical Computing. [WWW document] URL https://www.R‐project.org/ [accessed 26 July 2021]. [Google Scholar]
- Riquelme M. 2013. Tip growth in filamentous fungi: a road trip to the apex. Annual Review of Microbiology 67: 587–609. [DOI] [PubMed] [Google Scholar]
- Shah F, Nicolás C, Bentzer J, Ellström M, Smits M, Rineau F, Canbäck B, Floudas D, Carleer R, Lackner G et al. 2016. Ectomycorrhizal fungi decompose soil organic matter using oxidative mechanisms adapted from saprotrophic ancestors. New Phytologist 209: 1705–1719. [DOI] [PMC free article] [PubMed] [Google Scholar]
- Shah F, Rineau F, Canbäck B, Johansson T, Tunlid A. 2013. The molecular components of the extracellular protein‐degradation pathways of the ectomycorrhizal fungus Paxillus involutus . New Phytologist 200: 875–887. [DOI] [PMC free article] [PubMed] [Google Scholar]
- Steidinger BS, Bever JD. 2014. The coexistence of hosts with different abilities to discriminate against cheater partners: an evolutionary game‐theory approach. The American Naturalist 183: 762–770. [DOI] [PubMed] [Google Scholar]
- Steinberg G, Penalva MA, Riquelme M, Wösten HA, Harris SD. 2018. Cell biology of hyphal growth. In: Heitman J, Crous PW, James TY, Howlett BJ, Stukenbrook EH, Gow NAR, eds. The fungal kingdom. Washington, DC, USA: American Society for Microbiology, 231–266. [Google Scholar]
- Walder F, van der Heijden M. 2015. Regulation of resource exchange in the arbuscular mycorrhizal symbiosis. Nature Plants 1: 1–7. [DOI] [PubMed] [Google Scholar]
- Wang T, Tian Z, Tunlid A, Persson P. 2020. Nitrogen acquisition from mineral‐associated proteins by an ectomycorrhizal fungus. New Phytologist 228: 697–711. [DOI] [PubMed] [Google Scholar]
- Werner GDA, Strassmann JE, Ivens ABF, Engelmoer DJP, Verbruggen E, Queller DC, Noe R, Johnson NC, Hammerstein P, Kiers ET. 2014. Evolution of microbial markets. Proceedings of the National Academy of Sciences, USA 111: 1237–1244. [DOI] [PMC free article] [PubMed] [Google Scholar]
- White TJ, Bruns T, Lee S, Taylor JW. 1990. Amplification and direct sequencing of fungal ribosomal RNA genes for phylogenetics. In: Innis MA, Gelfand DH, Sninsky JJ, White TJ, eds. PCR protocols: a guide to methods and applications. New York, NY, USA: Academic Press, 315–322. [Google Scholar]
- Wickham H. 2016. ggplot2: elegant graphics for data analysis. New York, NY, USA: Springer‐Verlag. [Google Scholar]
- Wyatt GAK, Kiers ET, Gardner A, West SA. 2014. A biological market analysis of the plant–mycorrhizal symbiosis. Evolution 68: 2603–2618. [DOI] [PubMed] [Google Scholar]
Associated Data
This section collects any data citations, data availability statements, or supplementary materials included in this article.
Data Citations
- Mayerhofer W, Schintlmeister A, Dietrich M, Gorka S, Woebken D, Richter A, Kaiser C. 2021. Data set for the article “Recently photoassimilated Carbon and fungus‐delivered Nitrogen are spatially correlated at the cellular scale in the ectomycorrhizal tissue of Fagus sylvatica”. Zenodo . doi: 10.5281/zenodo.5035482. [DOI] [PMC free article] [PubMed]
Supplementary Materials
Fig. S1 Macro photography of an ectomycorrhizal root tip of beech.
Fig. S2 12C14N− secondary ion signal intensity distribution images recorded in the first analysis run.
Fig. S3 12C14N− secondary ion signal intensity distribution and inferred at%15N distribution of consecutive fields of view without additional pre‐sputtering.
Fig. S4 Stable isotope enrichment of 13C and 15N in plant and fungal tissues measured on a cross‐section of an ectomycorrhizal root tip of beech (Fagus sylvatica) determined via NanoSIMS.
Fig. S5 Correlations between relative abundances of 13C and 15N (at%), and total N in regions of interest (ROIs) of a cross‐section of a mycorrhizal root.
Fig. S6 Nanoscale secondary‐ion mass (NanoSIMS) visualization of the 13C label distribution in a beech ectomycorrhizal root tip cross‐section.
Fig. S7 NanoSIMS visualization of the 15N label distribution in a beech ectomycorrhizal root tip cross‐section.
Fig. S8 Colour‐blind friendly NanoSIMS visualization of the 13C label distribution in a beech ectomycorrhizal root tip cross‐section.
Fig. S9 Colour‐blind friendly NanoSIMS visualization of the 15N label distribution in a beech ectomycorrhizal root tip cross‐section.
Fig. S10 NanoSIMS total CN− secondary ion signal intensity distribution image of a beech ectomycorrhizal root tip cross‐section (Fagus sylvatica and Thelephora fungi), visualizing the cellular structure of the sample.
Methods S1 Additional methodological details of the NanoSIMS analysis.
Notes S1 Potential bias of 15N measurements due to N2 adsorption during consecutive NanoSIMS analyses of multiple fields of view on one sample.
Table S1 Regression analysis of 13C vs 15N isotope enrichment (at% excess, APE) in distinct tissue types of an ectomycorrhizal root tip.
Please note: Wiley Blackwell are not responsible for the content or functionality of any Supporting Information supplied by the authors. Any queries (other than missing material) should be directed to the New Phytologist Central Office.
Data Availability Statement
The data that support the findings of this study are openly available on Zenodo at 10.5281/zenodo.5035482 (Mayerhofer et al., 2021). The sequence data were deposited in the National Center for Biotechnology Information (NCBI) Short Read Archive under study accession no. PRJNA606050.