

Abstract
Myalgic encephalomyelitis/chronic fatigue syndrome (ME/CFS) patients suffer from a variety of physical and neurological complaints indicating the central nervous system plays a role in ME/CFS pathophysiology. Diffusion tensor imaging (DTI) has been used to study microstructural changes in neurodegenerative diseases. In this study, we evaluated DTI parameters to investigate microstructural abnormalities in ME/CFS patients. We estimated DTI parameters in 25 ME/CFS patients who met Fukuda criteria (ME/CFSFukuda), 18 ME/CFS patients who met International Consensus Criteria (ICC) (ME/CFSICC) only and 26 healthy control (HC) subjects. In addition to voxel‐based DTI‐parameter group comparisons, we performed voxel‐based DTI‐parameter interaction‐with‐group regressions with clinical and autonomic measures to test for abnormal regressions. Group comparisons between ME/CFSICC and HC detected significant clusters (a) with decreased axial diffusivity (p = .001) and mean diffusivity (p = .01) in the descending cortico‐cerebellar tract in the midbrain and pons and (b) with increased transverse diffusivity in the medulla. The mode of anisotropy was significantly decreased (p = .001) in a cluster in the superior longitudinal fasciculus region. Voxel‐based group comparisons between ME/CFSFukuda and HC did not detect significant clusters. For ME/CFSICC and HC, DTI parameter interaction‐with‐group regressions were abnormal for the clinical measures of information processing score, SF36 physical, sleep disturbance score and respiration rate in both grey and white matter regions. Our study demonstrated that DTI parameters are sensitive to microstructural changes in ME/CFSICC and could potentially act as an imaging biomarker of abnormal pathophysiology in ME/CFS. The study also shows that strict case definitions are essential in investigation of the pathophysiology of ME/CFS.
Keywords: diffusion tensor imaging, myalgic encephalomyelitis/chronic fatigue syndrome, tissue microstructure, white matter
Diffusion tensor imaging parameters showed microstructural changes (especially in the brainstem) in ME/CFS and could potentially act as an imaging biomarker of abnormal pathophysiology in ME/CFS. This study also shows that strict case definitions are essential in investigation of the pathophysiology of ME/CFS.
List of Abbreviations
- AD
axial diffusivity
- BA
Bodmann area
- CST
corticospinal tract
- DTI
diffusion tensor imaging
- FA
fractional anisotropy
- HC
healthy control
- HRV
heart rate variability
- ICC
International Consensus Criteria
- MD
mean diffusivity
- ME/CFS
myalgic encephalomyelitis/chronic fatigue syndrome
- MO
mode of anisotropy
- MRI
magnetic resonance imaging
- Phys_all
SF36 physical
- Procinfo
information processing score
- RD
radial diffusivity
- Resp
respiratory rate
- SDS
sleep disturbance score
1. INTRODUCTION
Myalgic encephalomyelitis/chronic fatigue syndrome (ME/CFS) is a complex illness characterized by a range of symptoms that includes fatigue, malaise, headaches, sleep disturbances, difficulties with concentration and cognitive function and muscle pain (Baker & Shaw, 2007). The cognitive symptoms include deficits in memory, attention, reaction time, information processing speed and free memory recall (Cockshell & Mathias, 2010). The severity of ME/CFS has been classified according to Fukuda criteria (Fukuda, 1994), Canadian Consensus Criteria (CCC) (Carruthers et al., 2003) and International Consensus Criteria (ICC) (Carruthers et al., 2011). The original case definition (Fukuda, 1994) was used for clinical and research purposes. However, as knowledge in the field progressed (over the last 30 years), more data have been incorporated into case definitions and more stringent criteria evolved, for example, Canadian (CCC) and ICC. For example, the Fukuda classification requires subjects to meet fatigue severity criteria and exhibit four of eight other symptoms but do not include the specific neurocognitive and cardiorespiratory or thermoregulatory impairments now required in the ICC criteria (Carruthers et al., 2011). Hence, the ICC is more selective for ME/CFS patients compared with the Fukuda definition. Notwithstanding, as research progressed over the years, sometimes more than one case definition was retained to permit comparisons with earlier studies. Therefore, the ‘Fukuda’ group may contain subjects without critical symptoms required by ICC, and today would not be regarded as having ME/CFS using the more contemporary definition (Brown et al., 2013).
No precise underlying causes of ME/CFS have been identified. Brain imaging has been performed using several MRI techniques to advance our understanding of the pathophysiology of ME/CFS (Barnden et al., 2015; Barnden et al., 2019; Kimura et al., 2019; Thapaliya et al., 2020; Zeineh et al., 2014). Qualitative analysis of structural imaging showed a higher percentage (78%) of abnormal brain scans in ME/CFS patients compared with healthy controls (21%) (de Lange et al., 2008). The global and regional grey and white matter volumes were decreased in ME/CFS patients (Barnden et al., 2015; Okada et al., 2004; Puri et al., 2012). Increased T1‐weighted and T2‐weighted signal intensity was also reported in ME/CFS patients (Barnden et al., 2018; Natelson et al., 1993). The ratio of T1‐weighted and T2‐weighted images also showed higher signal intensity in white matter and basal ganglia regions (Thapaliya et al., 2020) that could be due to higher myelin and/or iron density. However, structural findings yielded inconsistent atrophy and signal intensity (Cope & David, 1996). Functional neuroimaging using single‐photon emission computed tomography (SPECT) showed lowered regional cerebral blood flow in ME/CFS patients (Costa et al., 1995; Goldstein et al., 1995). Another study using positron emission tomography (PET) detected neuroinflammation in ME/CFS (Nakatomi et al., 2014). Blood oxygen level‐dependent (BOLD) used to study brain abnormalities in ME/CFS demonstrated impaired connectivity within the brainstem (Barnden et al., 2019) and decreased functional connectivity in primary cognitive networks (Boissoneault et al., 2016; Shan et al., 2018a). The temporal complexity of BOLD responses, a measure of information capacity, was lower in multiple regions in ME/CFS and could explain 40% of the variance in SF36 physical scores (Shan et al., 2018b). Brain perfusion studies showed lowered cerebral blood flow in ME/CFS (Biswal et al., 2011), but there were no differences in monozygotic twins with CFS and twin healthy controls (Lewis et al., 2001). No neuroimaging technique has provided a clear pathophysiological understanding of ME/CFS nor served as a biomarker.
Diffusion tensor imaging (DTI) is a technique that provides information on the structure of axons and their myelin sheath by measuring the random motion of water molecules (Basser et al., 1994a; Basser et al., 1994b). During the processing of diffusion tensor magnetic resonance imaging data, multiple DTI parameters are estimated. Fractional anisotropy (FA), axial diffusivity (AD), mean diffusivity (MD), radial diffusivity (RD) and mode of anisotropy (MO) have been used to study white matter integrity, axonal damage and myelin loss in neurodegenerative diseases including multiple sclerosis, amyotrophic lateral sclerosis, Alzheimer's, epilepsy, Parkinson's, traumatic brain injury, Crigler–Najjar syndrome type I and Fabry disease (Arfanakis et al., 2002; Baek et al., 2020; Filippi et al., 2001; Maller et al., 2014; Mayo et al., 2017; Razek et al., 2020; Ulivi et al., 2020; Zheng et al., 2014). The main advantage of DTI over conventional structural MRI is its sensitivity to tissue microstructure (Nucifora et al., 2007). Despite this, only two studies have used DTI techniques (FA) to study microstructural changes in ME/CFS patients (Kimura et al., 2019; Zeineh et al., 2014). The first study (Zeineh et al., 2014) showed increased FA values in the right arcuate fasciculus in ME/CFS patients whereas the second study (Kimura et al., 2019) showed a significant decrease in FA in the genu of the corpus callosum and right anterior limb of the internal capsule. These inconsistent findings in ME/CFS motivated further investigation here with the additional DTI parameters AD, MD, RD, MO and transverse eigenvalues (λ2 and λ3). The specific aims of this exploratory study were to investigate tissue microstructural abnormalities in ME/CFS patients using DTI parameters and eigenvalues and to explore interaction‐with‐group regressions between DTI parameter images and clinical and autonomic measures.
2. MATERIALS AND METHODS
2.1. Participant recruitment
The study was approved by the local human ethics (HREC/15/QGC/63 and GU:2014/838) committee of Griffith University and the Gold Coast University Hospital where scanning was performed. Written informed consent was obtained from all individuals. Fifty‐six ME/CFS patients and 26 age‐matched healthy control subjects were recruited (see Table 1 for demographic information) through an online Lime survey. Of the 56 ME/CFS patients reviewed by a clinician (DS) experienced in ME/CFS, 13 ME/CFS patients were excluded due to other conditions (attention deficit hyperactivity disorder, autoimmune disease, microvascular disease or body mass index [BMI] > 35). After these exclusions, 25 ME/CFS patients met Fukuda criteria (Fukuda, 1994), and 18 ME/CFS patients met ICC criteria (Carruthers et al., 2011). Healthy control subjects were included in this study if they had no exclusionary medical disorder and no abnormal physical function. Effect sizes for DTI parameters, particularly for ICC case‐definition ME/CFS, were not available from previous studies. Thus, a priori statistical estimation of the required sample size was not possible. This is an exploratory study that reports significant results for the 18 ICC subjects available.
TABLE 1.
Demographic and clinical characteristics of patients with ME/CFS and HCs
| ME/CFS Fukuda (n = 25) | ME/CFS ICC (n = 18) | HCs (n = 26) | p value | |
|---|---|---|---|---|
| Age | 49.8 ± 12.22 | 43.26 ± 10.72 | 43.10 ± 13.7 | .1 a , .89 b |
| M/F | 5/20 | 6/12 | 9/17 | N/A |
| HRV (%) | 20.21 ± 11.03 | 27.32 ± 16.12 | 21.05 ± 8.71 | .77 a , .19 b |
| Phys_all | 29 ± 13.08 | 27.32 ± 16.12 | 84.41 ± 17.42 | <.001 |
| Resp | 4.02 ± 2.15 | 4.06 ± 1.28 | 4.07 ± 1.10 | .92 a , .96 b |
| SDS | 6.52 ± 1.82 | 7.06 ± 1.98 | 1.96 ± 1.53 | <.001 a,b |
| Procinfo | 5.8 ± 1.82 | 6.7 ± 1.35 | 1.5 ± 1.02 | <.001 a,b |
Note: Subscripts a and b are the p values for ME/CFSFukuda versus HCs and ME/CFSICC versus HCs, respectively.
Abbreviations: HC, healthy control; HRV, heart rate variability; ME/CFS, myalgic encephalomyelitis/chronic fatigue syndrome; SDS, sleep disturbance score.
2.2. Clinical measures
Clinical measures incorporated into voxel‐based DTI parameter regressions were collected as follows. The 36‐item short‐form health survey questionnaire (SF36) (Alonso et al., 1995) was completed by all subjects, and the SF36 physical (Phys_all) and mental scores were extracted. An information processing score (Procinfo) and a sleep disturbance score (SDS) were obtained via a survey: ‘In the past month, how severe were the following symptoms (on a scale of 1 to 10, 1 being not a problem, 10 being extremely severe)’ for symptoms ‘Difficulty processing information?’ and ‘Sleep disturbances?’. Heart rate (HR), heart rate variability (HRV) and respiratory rate (Resp) were extracted from the power spectra of the pulse oximeter and respiration strap data recorded during a 15‐min resting‐state fMRI acquired in the same scanning session (HR and Resp from the frequency of the primary peak and HRV from the full width at half maximum of the primary HR peak). Stroop effect, a cognitive performance measure, was estimated from the Stroop colour‐word test conducted during a 15‐min task fMRI acquired in the same scanning session (Shan et al., 2018a).
2.3. MRI scans and data processing
The diffusion data were acquired using a 3T Skyra MRI scanner (Siemens Healthcare, Erlangen, Germany) with a 64‐channel head–neck coil (Nova Medical, Wilmington, USA). Diffusion images were acquired for 64 noncollinear gradient directions at single‐shell b values (3000 s/mm2), and one image was acquired with no diffusion gradient. Other settings were repetition time/echo time = 5035/114.8 ms, field of view (FOV) = 230 × 230, matrix = 96 × 96, voxel dimension of 2.4 × 2.4 × 2.4 mm3 and 60 slices. The acquisition time was 11.26 min. MR images were acquired in both patients and healthy control (HC) with the same scanner, using the same scanning parameters.
2.4. Post‐processing of diffusion data
Diffusion‐weighted data were denoised using the ‘dwidenoise’ command that estimates noise levels (Cordero‐Grande et al., 2019; Veraart, Fieremans, & Novikov, 2016) and denoises based on random matrix theory (Veraart, Novikov, et al., 2016). The eddy current‐induced distortion correction and motion correction between DWI volumes and within the volumes were corrected using the ‘dwipreproc’ command also available in MRtrix3 (https://www.mrtrix.org/) software. The diffusion tensor, its three eigenvalues and FA images were then calculated using tools provided with FMRIB's Diffusion Toolbox (FDT), part of FMRIB Software Library FSL (Smith et al., 2004) (http://www.fmrib.ox.ac.uk/fsl). DTI parameters FA, AD, RD, MD, MO, λ2 and λ3 were calculated using ‘dtifit’. Each subject's FA map was non‐linearly registered to Montreal Neurological Institute (MNI) standard space using the tract‐based spatial statistics (TBSS) toolkit of FSL (target = FSL_HCP1065_FA_1mm, FA threshold = 0.25). Non‐FA images (AD, RD, MD, MO, λ2 and λ3) were processed in the same manner by applying the deformations obtained from the FA coregistration.
2.5. Voxel‐based statistics
Voxel‐based statistical analysis of the FA, AD, MD, RD, MO, λ2 and λ3 of the two groups was performed with SPM12. For each, to test for group differences, a two‐sample T test was performed controlling for age and gender. Voxel clusters in the T statistic map were defined using an uncorrected voxel p‐value threshold of .004 and a cluster size threshold of 100 voxels. Statistical inference was measured with the false discovery rate corrected cluster p value (cluster p‐FDR). Significant clusters were overlaid on T1‐weighted image (mni_icbm152_t1_tal_nlin_sym_09a). We also performed voxel‐based FA, AD, MD, RD, MO, λ2 and λ3 interaction‐with‐group regressions with clinical parameters to test for different relationships in ME/CFSICC and HC groups, that is, an abnormal relationship in ME/CFS. Voxel clusters were formed using an uncorrected voxel p‐value threshold of .001. The eight clinical parameters used as regressors were HR, HRV, Phys_all, Procinfo, SF36 mental score, Resp, SDS and Stroop. One ME/CFSICC patient was omitted from group interaction analysis due to missing clinical information (Procinfo, Phys_all and SDS). Clinical and autonomic measures outliers (one‐Procinfo, one‐SDS and two‐Resp) ME/CFSICC data were also omitted from group interaction analysis. The FDR after accounting for the multiple interaction regressions performed was also computed. All tests were controlled for age and gender. Cluster locations were identified with the xjview toolbox (https://www.alivelearn.net/xjview).
2.6. Correction for multiple regression
Correction for multiple regressions was performed similar to Barnden et al. (2015). The present analysis consisted of N = (1 + 9) * 2 * 7 = 140 regressions, where in brackets ‘1’ refers to the categorical (group) comparison of ME/CFS and HC and 9 refers to the autonomic and clinical regressors. The ×2 accounts for both positive and negative comparisons/regressions for each statistical design and ×7 accounts for the seven image types (FA, AD, MD, RD, λ2 and λ3). We computed false discovery rate (FDR), the expected portion of false positives among all N regressions (Benjamini & Hochberg, 1995) when upper bound q = 0.05 was specified for the acceptable FDR. The k strongest results with p values p 1, …, p k that satisfied p 1, …, p k < q(k/N) were then deemed significant. Then, the regressions that survived the FDR threshold were reported. All regressions were adjusted for age and gender.
3. RESULTS
An FDR of 0.05 for the 140 statistical designs applied here was achieved by requiring a cluster p < .018.
3.1. Group comparison: ME/CFSFukuda versus HC
We performed a group comparison between 25 ME/CFSFukuda and 26 HCs for all seven DTI parameters. None of the DTI parameters showed a statistically significant cluster (p < .05) despite relaxing the p‐uncorrected voxel threshold to .005. ME/CFSFukuda subjects were excluded from subsequent analysis.
3.2. Group comparison: ME/CFSICC versus HC
We performed voxel‐based analysis on FA, AD, MD, RD, λ2 and λ3 images estimated for 18 ME/CFSICC and 26 HCs. Figure 1 shows significant clusters with decreased AD, MD and λ2 in the midbrain and pons in the brainstem in ME/CFS patients as well as in the superior longitudinal fasciculus (SLF) region for MO. Figure 2 shows significant clusters with increased λ3 in the dorsal medulla for ME/CFSICC. RD showed significant group differences between ME/CFSICC and HC, but significance was lost after adjusting for multiple comparison. Group comparison of FA did not show any significant differences between ME/CFSICC and HC. Statistics of clusters detected in group comparisons of DTI parameter images are presented in Table 2.
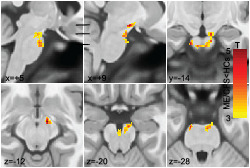
FIGURE 1.
Results of voxel‐based group comparisons of AD, MD and MO. (a) Sections through a significant cluster with decreased AD in ME/CFSICC. This single cluster tracks fibres from the motor and premotor cortices which project to the cerebellum. No single section shows the full extent of the cluster, but we summarize it in six sections. Sagittal sections (x = +5, +9) show this AD deficit cluster extending from the midbrain to the ventral pons. Horizontal bars indicate the level of the three axial sections which show the cluster in the frontopontine tract (z = −12, x = +9) in the midbrain superior cerebellar peduncle and its descent through the vertical extent of the midbrain (z = −20) to the ventral pons middle cerebellar peduncle which crosses to the opposite side (z = −28, y = −4, x = +5). (b) MD was significantly decreased in similar regions to AD as shown in sagittal (x = +5), axial (z = −20) and coronal (y = −16) planes. MD and λ2 clusters were the same. MO was significantly decreased at a focus in the superior longitudinal fasciculus as shown in sagittal (x = +32), axial (z = +21) and coronal (y = +2) planes. SPM T maps are shown in yellow‐red. AD, axial diffusivity; MD, mean diffusivity; MO, mode of anisotropy; ME/CFS, myalgic encephalomyelitis/chronic fatigue syndrome
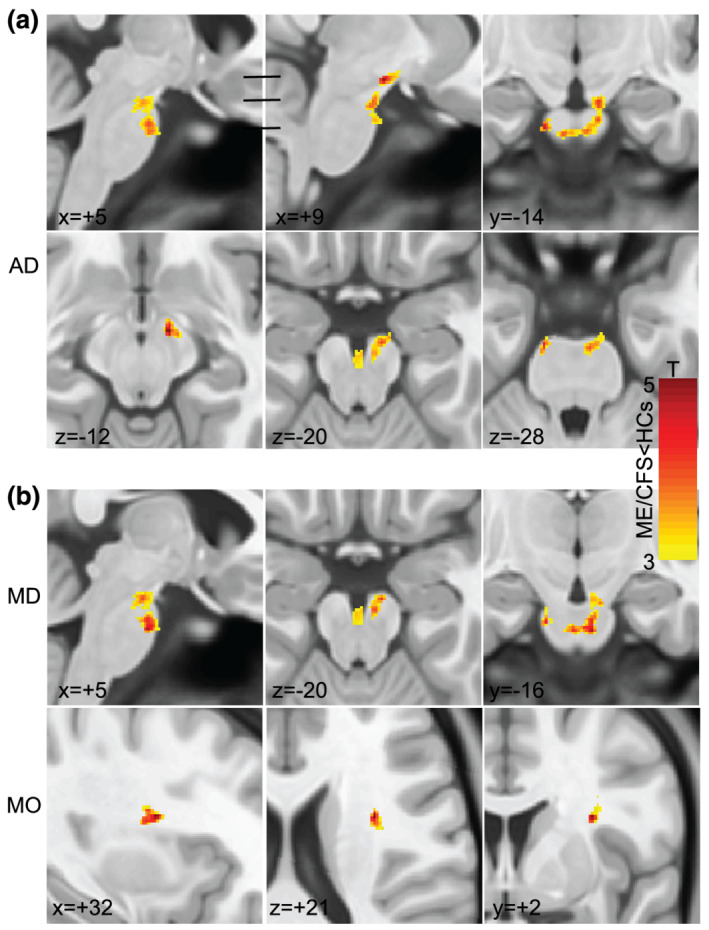
FIGURE 2.
Results of the voxel‐based ME/CFSICC versus HC group comparison of λ3 shown in sagittal (x = −2), coronal (y = −43) and axial (z = −58) planes. Superimposed SPM T maps (yellow‐red) locate significant ME/CFSICC increases in λ3 in the medulla near the sensory decussation. λ3 is an eigenvalue transverse to the fibres. HC, healthy control; ME/CFS, myalgic encephalomyelitis/chronic fatigue syndrome
TABLE 2.
Cluster statistics of AD, MD, MO, λ2 and λ3, where a voxel‐based group comparison detected ME/CFSICC values less than (top) or greater than (below) HCs
| DTI parameter | Area | Peak x y z (mm) | Cluster p‐FDR | Cluster size (voxels) |
|---|---|---|---|---|
| AD | Midbrain/pons | −12 −15 −29 | .001 | 653 |
| MD | Midbrain/pons | 5 −16 −32 | .01 | 436 |
| MO | SLF | 32 2 21 | .001 | 202 |
| λ2 | Midbrain/pons | 5 −16 −32 | .003 | 463 |
| λ3 | Medulla | 9 −36 −51 | .014 | 362 |
Note: Clusters were formed with an uncorrected voxel p threshold of .004.
Abbreviations: AD, axial diffusivity; DTI, diffusion tensor imaging; FDR, false discovery rate; HC, healthy control; MD, mean diffusivity; ME/CFS, myalgic encephalomyelitis/chronic fatigue syndrome; MO, mode of anisotropy; SLF, superior longitudinal fasciculus.
3.3. Regression with clinical measures
DTI interaction‐with‐group regressions were performed with nine clinical scores: Phys_all, SF36 mental, Procinfo, SDS, HR, HRV, Resp, Stroop effect and mean Stroop test reaction time. Significant FA, AD, MD, RD or MO interaction‐with‐group regressions were detected for five regressors. Clusters detected with ME/CFSICC regression slopes significantly different to HC slopes are listed in Table 3. λ2 and λ3 interaction‐with‐group regressions also detected significant clusters with an abnormal ME/CFSICC regression and are listed in Table S1.
TABLE 3.
Details of significant clusters from voxel‐wise AD, MD, RD, FA and MO interaction‐with‐group regressions with five clinical regressors (second column)
| DTI parameter | Regressor | Region | Peak x y z | Cluster P FDR | No. of voxels |
|---|---|---|---|---|---|
| AD | − Procinfo | Superior corona radiata | −20 17 38 | <.001 | 864 |
| Precentral gyrus | −25 −17 51 | <.001 | 1000 | ||
| Fusiform gyrus | −49 −5 −27 | <.001 | 1147 | ||
| Cerebelum_9_L | −8 −50 −53 | .006 | 280 | ||
| Hippocampus | −23 −40 −1 | .014 | 232 | ||
| Parahippocampal gyrus | 17 −35 −1 | .005 | 309 | ||
| Inferior occipito‐frontal fasiculus | −37 −1 −7 | .006 | 279 | ||
| Thalamus | −9 −6 17 | .014 | 238 | ||
| + Resp | BA‐9 | −6 39 24 | .001 | 416 | |
| MD | − Procinfo | Corpus callosum | 9 29 8 | .001 | 339 |
| Middle temporal gyrus | −35 0 −38 | .001 | 358 | ||
| Posterior cingulate | −6 −42 3 | .017 | 192 | ||
| Hippocampus | −25 −40 −2 | .002 | 287 | ||
| Parahippocampal gyrus | 17 −37 0 | .001 | 359 | ||
| BA‐36 | −20 −6 −34 | .017 | 196 | ||
| External capsule | −30 9 −11 | .002 | 290 | ||
| + Resp | BA‐9 | −6 39 24 | .001 | 361 | |
| RD | − Procinfo | Middle temporal gyrus | −35 0 −38 | <.001 | 339 |
| Corpus callosum | 9 28 9 | <.001 | 339 | ||
| Hippocampus | −25 −40 −2 | .001 | 297 | ||
| Posterior cingulate | −6 −42 3 | .004 | 210 | ||
| Parahippocampal gyrus | 16 −37 0 | <.001 | 379 | ||
| Unicate fasciculus | −35 3 −10 | .002 | 240 | ||
| BA‐36 | −20 −6 −34 | .004 | 207 | ||
| + Resp | BA‐9 | −6 39 24 | .001 | 310 | |
| Cerebellar tonsil | 26 −39 −41 | .011 | 190 | ||
| + Phys_all | BA‐2 | −47 −29 40 | .014 | 150 | |
| − Procinfo | Superior corona radiata | −15 12 40 | .004 | 173 | |
| CST | −28 −20 52 | .001 | 221 | ||
| Optical radiation | −28 −58 27 | .015 | 132 | ||
| − SDS | BA‐44 | −42 7 25 | .002 | 220 | |
| MO | − Procinfo | Superior corona radiata | 26 −19 25 | <.001 | 135 |
Note: Clusters were formed with an uncorrected voxel p threshold of .001 for Resp, Procinfo and Phys_all and .0015 for SDS. Cluster statistical inference is given by P FDR. Only clusters exceeding 100 voxels in extent are reported. The sign of the regressor is the sign of the slope for the ME/CFSICC regression.
Abbreviations: AD, axial diffusivity; DTI, diffusion tensor imaging; FA, fractional anisotropy; MD, mean diffusivity; ME/CFS, myalgic encephalomyelitis/chronic fatigue syndrome; MO, mode of anisotropy; RD, radial diffusivity; SDS, sleep disturbance score.
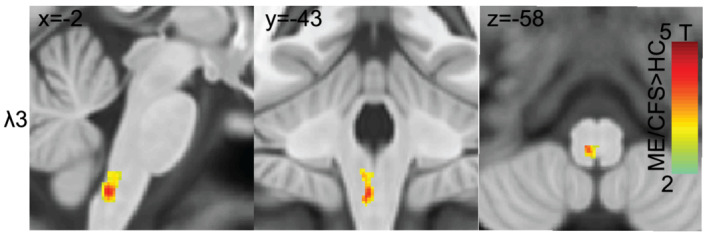
Figure 3 shows six of statistically valid (cluster P FDR < .018) clusters detected for AD, MD and RD interaction‐with‐group regressions with Procinfo. The DTI parameters AD, MD and RD formed significant clusters in the hippocampus and parahippocampal gyrus. MD and RD both showed a significant cluster in the corpus callosum, posterior cingulate and Brodmann area (BA)‐36. MD also formed a significant cluster in the external capsule.
FIGURE 3.
For ME/CFSICC and HCs, significant clusters from interaction‐with‐group regressions with information processing score for AD, MD and RD and corresponding scatter plots of the cluster mean for individual subjects. Sections through clusters are shown on a reference brain (mni_icbm152_t1_tal_nlin_sym_09a template), and the label identifies the cluster location. Voxel colour‐encoded T statistics are shown in clusters formed with a voxel p (uncorrected) threshold = .001. The plots and clusters labelled ‘AD, MD, RD’ were essentially the same for all three metrics. The red and blue triangles belong to HCs and ME/CFSICC, respectively. AD, axial diffusivity; MD, mean diffusivity; RD, radial diffusivity; BA, Brodmann area; HC, healthy control; ME/CFS, myalgic encephalomyelitis/chronic fatigue syndrome
Voxel‐based FA interaction‐with‐group regressions with Phys all and SDS yielded the clusters in Figure 4. MD and RD regressions with Resp also revealed significant clusters (see Figure 5). FA versus Phys_all detected a significant cluster in BA‐2 and FA versus SDS in BA‐44. MD and RD versus Resp revealed significant clusters in BA‐9 and RD only showed significant cluster in the cerebellar tonsil (see Figure 5). The plots in Figures 3, 4, 5 illustrate the value of interaction‐with‐group regressions which test for opposite regressions in the two groups and detect regions with abnormal ME/CFS dependence. The variance associated with age and gender was removed from the plotted means.
FIGURE 4.
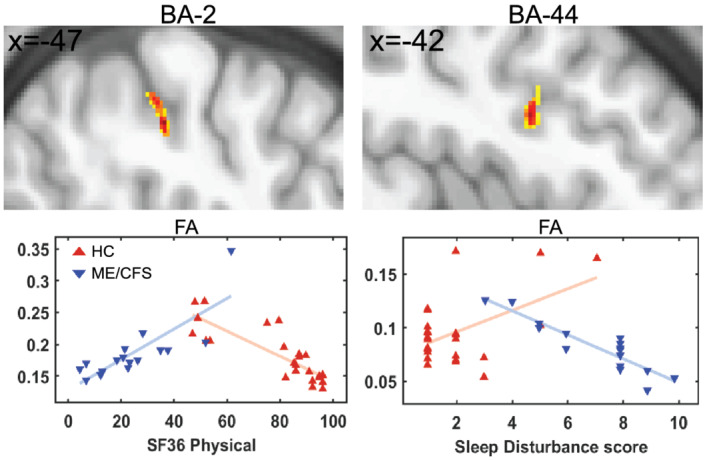
Significant clusters and scatter plots for FA of individual ME/CFSICC and HCs. Significant clusters in upper panels were obtained from voxel‐based FA interaction‐with‐group regressions (ME/CFSICC × HCs) for two clinical regressors (Phys_all and SDS). On the same reference brain as Figure 3, cluster sections show the colour coded T statistic for voxel p (uncorrected) < .001. The red and blue triangles show HCs and ME/CFSICC, respectively. FA, fractional anisotropy; BA, Brodmann area; Phys_all, SF36 physical score; SDS, sleep disturbance score; HC, healthy control; ME/CFS, myalgic encephalomyelitis/chronic fatigue syndrome
FIGURE 5.
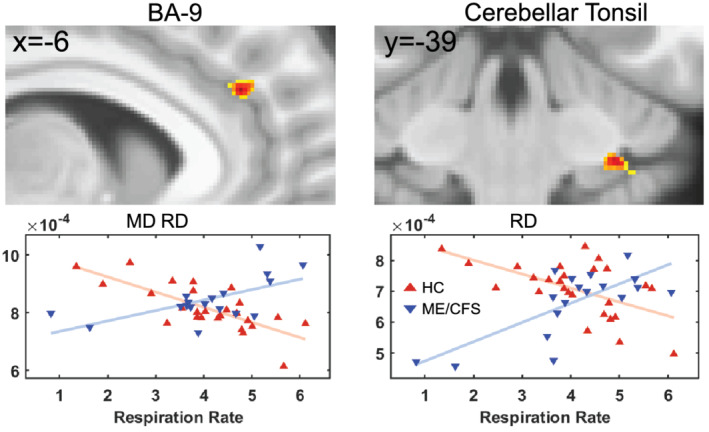
For ME/CFSICC and HCs, significant clusters from interaction‐with‐group regressions with respiration rate for AD, MD and RD and corresponding scatter plots of the cluster mean for individual subjects. Sections through clusters are shown on the same reference brain as Figure 3, and the label above identifies their location. Cluster voxel values are colour‐encoded T statistics with a threshold voxel p (uncorrected) = .001. The plots and clusters labelled ‘MD, RD’ were essentially the same for both metrics. The red and blue triangles belong to HCs and ME/CFSICC, respectively. MD, mean diffusivity; RD, radial diffusivity; BA, Brodmann area; HC, healthy control; ME/CFS, myalgic encephalomyelitis/chronic fatigue syndrome
4. DISCUSSION
Our study is the first to demonstrate that ME/CFS patients have DTI differences in white matter regions, particularly in the brainstem. It was remarkable that a brainstem cluster with AD and MD deficits followed descending fibres through the midbrain to crossing fibres of the pontine nuclei. Voxel‐based DTI interaction‐with‐group regressions with clinical and autonomic parameters tested for locations where the regressions have an opposite sign for the two groups and detected this phenomenon in widespread brain regions, some in grey matter. To our knowledge, this is the first study to investigate axonal microstructural changes of brainstem regions and to perform DTI interaction‐with‐group regressions with clinical measures relevant to ME/CFS patients. Our novel findings show that DTI parameters provide insights into the pathophysiology of ME/CFS and may potentially be imaging biomarkers. It also demonstrates that only the stricter ICC case definition of ME/CFS could identify the neuropathology of this illness.
4.1. Group comparison
For multiple DTI parameters, our study found significant differences between ME/CFSICC patients and HC in the brainstem and SLF areas. It has been reported that 89% of ME/CFS patients have memory and concentration problems and difficulties in processing complex information (Jason et al., 1999). In studies involving neuropsychological tests of attention, working memory and processing speed, ME/CFS subjects did significantly worse than HCs (Marcel et al., 1996; Vercoulen et al., 1998). Here, we detected diffusion deficits in the frontopontine tract within the midbrain extending to crossing fibres of the pontine nuclei. The primary motor cortex connects through the frontopontine tract to the ipsilateral pontine nucleus in the ventral pons and then via pontocerebellar projections to the contralateral cerebellum (Glickstein & Doron, 2008; Kratochwil et al., 2017). Pontine nuclei are involved in motor activity (Kratochwil et al., 2017) via the cerebellum. These AD deficits may be related to reports of impairment in central motor mechanisms accompanying motor response preparation for some tasks (Paul et al., 2008; Rasouli et al., 2017) and range of motion (Rowe et al., 2014).
Increased λ3 diffusivity in the mediodorsal medulla (Figure 2) appears to involve the medial lemniscus where it forms from the crossing fibres of the sensory decussation which connect gracile and cuneate fasciculi ascending from the spine (Naidich et al., 2009).
We also observed a relative MO deficit in ME/CFSICC patients in the SLF which is involved in core processes such as attention, memory, emotions and language (Schmahmann et al., 2008). A DTI study in Gulf War illness showed a correlation between abnormality of the SLF and fatigue (Rayhan et al., 2013) and dysfunction in SLF regions in ME/CFS patients (Kimura et al., 2019).
Thus, brainstem and SLF impairment may underlie some of the core affective symptoms observed in ME/CFS. The changes in diffusivity parameters reported here could relate to different axon calibre or axonal and myelin density (Sen & Basser, 2005). A similar pattern of decreased AD and MO has been reported in an amyotrophic lateral sclerosis study in the brainstem corticospinal tract (Baek et al., 2020). It is also worth noting that neuroinflammation has been observed in the brainstem regions of ME/CFS (Nakatomi et al., 2014). In addition, the decrement of MD could be caused by cell proliferation (Alexander et al., 2007).
Recently, we demonstrated a higher degree of myelination in ME/CFS patients in brainstem tracts using the ratio of T1‐weighted and T2‐weighted images (Thapaliya et al., 2020). An fMRI study showed impaired brainstem reticular activation system connectivity in ME/CFS patients (Barnden et al., 2019). Our observed ME/CFSICC decrement in λ2 and increment in λ3 (Table 2) in the medulla indicates an asymmetry in radial diffusivity which may represent discrete white matter damage (Maller et al., 2014). We could not directly compare all of our DTI parameter findings with previous ME/CFS findings because of the lack of studies.
A previous DTI study reported increased FA values in the right arcuate fasciculus (Zeineh et al., 2014) and decreased FA values in the genu of the corpus callosum and right anterior limb of the internal capsule in ME/CFS patients (Kimura et al., 2019). Interestingly, we did not find any significant differences in FA that confirm these findings (Kimura et al., 2019; Zeineh et al., 2014) which could be due to the differences in b values and gradient directions (Schilling et al., 2017). It has also been shown that higher b values provides better contrast, greater sensitivity to tissue diffusivity and less T2 shine through (Burdette et al., 2001; DeLano et al., 2000). Cihangiroglu et al. (2009) also showed significantly higher contrast to noise ratio in the pons at b = 3000 than at b = 1000 s/mm2. A study of traumatic brain injury also did not find significant differences in FA values when compared with HC (Maller et al., 2014). Further rationale for our inability to find significant FA differences could be due to the presence of the large number of crossing fibres (Lazar et al., 2008) in these white matter regions (Jensen & Helpern, 2010; Lazar et al., 2008). In addition, we did not find significant differences in DTI parameters when we compared HC and the more broadly classified ME/CFSFukuda. Thus, the more stringent ICC case definition was necessary to identify the neuropathology of this illness (Carruthers et al., 2011) by including more functionally impaired and symptomatic ME/CFS patients with regard to both mental and physical health when compared with a group who only meet the Fukuda criteria (Brown et al., 2013).
4.2. Interaction‐with‐group regressions
Voxel‐based DTI parameter interaction‐with‐group regressions with clinical measures yielded multiple clusters (Table 3 and Figures 3, 4, 5). The Procinfo cluster in the corpus callosum is consistent with its crucial role in cognitive function (Musiek, 1986). ME/CFS patients have reported a significant decrease in memory function that impairs learning and retrieval capacity. This is consistent with our finding that DTI parameters (AD, MD and RD) showed abnormal regressions with Procinfo in the hippocampus and parahippocampal gyrus (Figure 3 and Table 3) that are involved in the encoding of memories and their retrieval (Squire et al., 2004) and processing different types of stimuli (Blood et al., 1999; Lane et al., 1997). An Alzheimer's study also reported abnormalities in the hippocampus and BA‐36 (Ackl et al., 2005) and an animal study in Rhesus Macaques reported memory impairment after damaging the parahippocampal gyrus (Alvarado & Bachevalier, 2005). Abnormalities in the external capsule were associated with cognitive function in patients with subcortical silent lacunar infarcts (Chen et al., 2015), and abnormalities in the posterior cingulate were associated with memory impairment and multitasking in patients with amnesia and splenial tumours (Rudge & Warrington, 1991; Valenstein et al., 1987). BA‐36 that is located in the parahippocampal gyrus showed that brain activation was greater in controls than in Alzheimer's patients during encoding of colour pictures using fMRI (Rombouts et al., 2000) and was also reported abnormal in epilepsy (Vismer et al., 2015).
FA interaction‐with‐group regressions with Phys_all showed a significant cluster in BA‐2 regions which is consistent with activation of BA‐2 when pressure stimuli were applied to the index, middle, ring and little fingers in an fMRI study (Choi et al., 2015). Our SDS showed a significant cluster in BA‐44 (inferior frontal gyrus) which is similar to an fMRI study that showed activation of the inferior frontal gyrus after sleep deprivation (Vartanian et al., 2014). Another study using fMRI on mindfulness showed prefrontal cortex (BA‐9) was associated with attention‐to‐breathing (Doll et al., 2016). A study showed involvement of prefrontal cortex in sleep breathing disorder compared with HCs (Pereira et al., 2017) that is similar to our finding in Resp. The cerebellar tonsil that is part of the cerebellum is involved in cardiovascular and respiratory function (Harper et al., 1998; Paton et al., 1991; Rector et al., 2006). The involvement of the cerebellum in respiration seems to be central to respiratory challenges, such as hypoxia or hypercapnia (Macey et al., 2005; Parsons et al., 2001). Another study using PET also showed the involvement of multiple areas of the cerebellum including cerebellar tonsils as a physiological effect of hypercapnia (Parsons et al., 2001).
4.3. Limitations
A limitation of this study is that changes in the DTI parameters especially MD and RD do not permit us to discriminate between changes in axonal myelination, axonal density, microglia, oedema, axonal diameter, organization or gliosis (Alexander et al., 2019; Bihan & Johansen‐Berg, 2012; Jones et al., 2013; Mori & Zhang, 2006). DTI is also sensitive to thermal noise, physiologic fluctuations and partial volume averaging between voxels in different tissues (Alexander et al., 2007). Another limitation is that some of the clinical scores in this study were obtained from questionnaires which, by their subjective nature, may limit interpretation of our findings. This study was a cross‐sectional study. Longitudinal studies should be performed to test progressive microstructural changes in ME/CFS. Furthermore, our male sample size meeting ICC criteria is half of the female sample size. Further studies with larger male and female sample sizes are necessary to confirm our findings.
5. CONCLUSION
Our DTI study detected axonal microstructural abnormalities in ME/CFS patients. The group analysis using a voxel‐based method detected differences in diffusion metrics in ascending and descending tracts in the medulla, pons and midbrain of the brainstem in ME/CFS patients, but only for those meeting ICC criteria. This demonstrated the importance of strict case definitions for ME/CFS. Our DTI parameter interaction‐with‐group regressions with clinical measures showed involvement of multiple brain regions. These novel analyses can contribute to understanding the pathophysiology of ME/CFS patients. Brainstem abnormality may be an imaging diagnostic marker for ME/CFS.
CONFLICT OF INTEREST
The authors report no conflict of interest.
AUTHOR CONTRIBUTIONS
KT designed the project, conducted the data analysis, deigned the methodology, wrote the original draft and reviewed and edited the manuscript. LB supervised the study, designed the methodology and reviewed and edited the manuscript. DS supervised the study and reviewed and edited the manuscript. SMG supervised the study and reviewed and edited the manuscript.
PEER REVIEW
The peer review history for this article is available at https://publons.com/publon/10.1111/ejn.15413.
Supporting information
Table S1 Significant clusters from λ2 and λ3 voxel‐wise interaction‐with‐group regressions with five clinical regressors. Clusters were formed with an uncorrected voxel p threshold of 0.001 for Procinfo and Resp and exceeded 100 voxels in extent. The sign of the regressor is the sign of the slope of the regression for the ME/CFSICC group. BA=Brodmann Area.
ACKNOWLEDGEMENTS
This study was supported by the Stafford Fox Medical Research Foundation (Award No. 216285HTCF2), the Judith Jane Mason and Harold Stannett Williams Memorial Foundation (Award No. MAS2015F024), Mr. Douglas Stutt (Award No, 22042000000), the Blake‐Beckett Foundation (Grant No. 4579), Ian and Talei Stewart (Award No, 22063300000) and Buxton Foundation (Grant No. 22065100000) and McCusker Charitable Foundation (Award No. 22048500000). We are also thankful to Zack Shan, Kevin Finegan and Sandeep Bhuta for helping us in data collection and the patients and HCs who donated their time and effort to participate in this study.
Thapaliya, K. , Marshall‐Gradisnik, S. , Staines, D. , & Barnden, L. (2021). Diffusion tensor imaging reveals neuronal microstructural changes in myalgic encephalomyelitis/chronic fatigue syndrome. European Journal of Neuroscience, 54(6), 6214–6228. 10.1111/ejn.15413
Funding information Buxton Foundation, Grant/Award Number: 22065100000; McCusker Charitable Foundation, Grant/Award Number: 22048500000; Blake‐Beckett Foundation, Grant/Award Number: 4579; Ian and Talei Stewart, Grant/Award Number: 22063300000; Mr. Douglas Stutt, Grant/Award Number: 22042000000; Judith Jane Mason and Harold Stannett Williams Memorial Foundation, Grant/Award Number: MAS2015F024; Stafford Fox Medical Research Foundation, Grant/Award Number: 216285HTCF2
DATA AVAILABILITY STATEMENT
The study data are available upon reasonable request and following approval from the study group.
REFERENCES
- Ackl, N. , Ising, M. , Schreiber, Y. A. , Atiya, M. , Sonntag, A. , & Auer, D. P. (2005). Hippocampal metabolic abnormalities in mild cognitive impairment and Alzheimer's disease. Neuroscience Letters, 384, 23–28. 10.1016/j.neulet.2005.04.035 [DOI] [PubMed] [Google Scholar]
- Alexander, A. L. , Lee, J. E. , Lazar, M. , & Field, A. S. (2007). Diffusion tensor imaging of the brain. Neurotherapeutics, 4, 316–329. 10.1016/j.nurt.2007.05.011 [DOI] [PMC free article] [PubMed] [Google Scholar]
- Alexander, D. C. , Dyrby, T. B. , Nilsson, M. , & Zhang, H. (2019). Imaging brain microstructure with diffusion MRI: Practicality and applications. NMR in Biomedicine, 32, e3841. 10.1002/nbm.3841 [DOI] [PubMed] [Google Scholar]
- Alonso, J. , Prieto, L. , & Anto, J. M. (1995). The Spanish version of the SF‐36 Health Survey (the SF‐36 health questionnaire): An instrument for measuring clinical results. Medicina Clínica, 104, 771–776. [PubMed] [Google Scholar]
- Alvarado, M. C. , & Bachevalier, J. (2005). Comparison of the effects of damage to the perirhinal and parahippocampal cortex on transverse patterning and location memory in rhesus macaques. The Journal of Neuroscience, 25, 1599–1609. 10.1523/JNEUROSCI.4457-04.2005 [DOI] [PMC free article] [PubMed] [Google Scholar]
- Arfanakis, K. , Hermann, B. P. , Rogers, B. P. , Carew, J. D. , Seidenberg, M. , & Meyerand, M. E. (2002). Diffusion tensor MRI in temporal lobe epilepsy. Magnetic Resonance Imaging, 20, 511–519. 10.1016/S0730-725X(02)00509-X [DOI] [PubMed] [Google Scholar]
- Baek, S.‐H. , Park, J. , Kim, Y. H. , Seok, H. Y. , Oh, K.‐W. , Kim, H.‐J. , Kwon, Y.‐J. , Sim, Y. , Tae, W.‐S. , Kim, S. H. , & Kim, B.‐J. (2020). Usefulness of diffusion tensor imaging findings as biomarkers for amyotrophic lateral sclerosis. Scientific Reports, 10, 5199. 10.1038/s41598-020-62049-0 [DOI] [PMC free article] [PubMed] [Google Scholar]
- Baker, R. , & Shaw, E. J. (2007). Diagnosis and management of chronic fatigue syndrome or myalgic encephalomyelitis (or encephalopathy): Summary of NICE guidance. BMJ, 335, 446–448. 10.1136/bmj.39302.509005.AE [DOI] [PMC free article] [PubMed] [Google Scholar]
- Barnden, L. R. , Crouch, B. , Kwiatek, R. , Burnet, R. , & Del Fante, P. (2015). Evidence in chronic fatigue syndrome for severity‐dependent upregulation of prefrontal myelination that is independent of anxiety and depression. NMR in Biomedicine, 28, 404–413. 10.1002/nbm.3261 [DOI] [PMC free article] [PubMed] [Google Scholar]
- Barnden, L. R. , Shan, Z. Y. , Staines, D. R. , Marshall‐Gradisnik, S. , Finegan, K. , Ireland, T. , & Bhuta, S. (2018). Hyperintense sensorimotor T1 spin echo MRI is associated with brainstem abnormality in chronic fatigue syndrome. NeuroImage: Clinical, 20, 102–109. 10.1016/j.nicl.2018.07.011 [DOI] [PMC free article] [PubMed] [Google Scholar]
- Barnden, L. R. , Shan, Z. Y. , Staines, D. R. , Marshall‐Gradisnik, S. , Finegan, K. , Ireland, T. , & Bhuta, S. (2019). Intra brainstem connectivity is impaired in chronic fatigue syndrome. NeuroImage: Clinical, 24, 102045. 10.1016/j.nicl.2019.102045 [DOI] [PMC free article] [PubMed] [Google Scholar]
- Basser, P. J. , Mattiello, J. , & Lebihan, D. (1994a). Estimation of the effective self‐diffusion tensor from the NMR spin echo. Journal of Magnetic Resonance, Series B, 103, 247–254. 10.1006/jmrb.1994.1037 [DOI] [PubMed] [Google Scholar]
- Basser, P. J. , Mattiello, J. , & Lebihan, D. (1994b). MR diffusion tensor spectroscopy and imaging. Biophysical Journal, 66, 259–267. 10.1016/S0006-3495(94)80775-1 [DOI] [PMC free article] [PubMed] [Google Scholar]
- Benjamini, Y. , & Hochberg, Y. (1995). Controlling the false discovery rate: A practical and powerful approach to multiple testing. Journal of the Royal Statistical Society. Series B (Methodological), 57, 289–300. 10.1111/j.2517-6161.1995.tb02031.x [DOI] [Google Scholar]
- Bihan, D. L. , & Johansen‐Berg, H. (2012). Diffusion MRI at 25: Exploring brain tissue structure and function. NeuroImage, 61, 324–341. 10.1016/j.neuroimage.2011.11.006 [DOI] [PMC free article] [PubMed] [Google Scholar]
- Biswal, B. , Kunwar, P. , & Natelson, B. H. (2011). Cerebral blood flow is reduced in chronic fatigue syndrome as assessed by arterial spin labeling. Journal of the Neurological Sciences, 301, 9–11. 10.1016/j.jns.2010.11.018 [DOI] [PMC free article] [PubMed] [Google Scholar]
- Blood, A. J. , Zatorre, R. J. , Bermudez, P. , & Evans, A. C. (1999). Emotional responses to pleasant and unpleasant music correlate with activity in paralimbic brain regions. Nature Neuroscience, 2, 382–387. 10.1038/7299 [DOI] [PubMed] [Google Scholar]
- Boissoneault, J. , Letzen, J. , Lai, S. , O'Shea, A. , Craggs, J. , Robinson, M. E. , & Staud, R. (2016). Abnormal resting state functional connectivity in patients with chronic fatigue syndrome: An arterial spin‐labeling fMRI study. Magnetic Resonance Imaging, 34, 603–608. 10.1016/j.mri.2015.12.008 [DOI] [PMC free article] [PubMed] [Google Scholar]
- Brown, A. A. , Jason, L. A. , Evans, M. A. , & Flores, S. (2013). Contrasting case definitions: The ME International Consensus Criteria vs. the Fukuda et al. CFS criteria. North American Journal of Psychology, 15, 103–120. [PMC free article] [PubMed] [Google Scholar]
- Burdette, J. H. , Durden, D. D. , Elster, A. D. , & Yen, Y.‐F. (2001). High b‐value diffusion‐weighted MRI of normal brain. Journal of Computer Assisted Tomography, 25, 515–519. 10.1097/00004728-200107000-00002 [DOI] [PubMed] [Google Scholar]
- Carruthers, B. M. , Jain, A. K. , De Meirleir, K. L. , Peterson, D. L. , Klimas, N. G. , Lerner, A. M. , Bested, A. C. , Flor‐Henry, P. , Joshi, P. , & Powles, A. P. (2003). Myalgic encephalomyelitis/chronic fatigue syndrome: Clinical working case definition, diagnostic and treatment protocols. Journal of Chronic Fatigue Syndrome, 11, 7–115. 10.1300/J092v11n01_02 [DOI] [Google Scholar]
- Carruthers, B. M. , van de Sande, M. I. , Meirleir, K. L. D. , Klimas, N. G. , Broderick, G. , Mitchell, T. , Staines, D. , Powles, A. C. P. , Speight, N. , Vallings, R. , Bateman, L. , Baumgarten‐Austrheim, B. , Bell, D. S. , Carlo‐Stella, N. , Chia, J. , Darragh, A. , Jo, D. , Lewis, D. , Light, A. R. , … Stevens, S. (2011). Myalgic encephalomyelitis: International Consensus Criteria. Journal of Internal Medicine, 270, 327–338. 10.1111/j.1365-2796.2011.02428.x [DOI] [PMC free article] [PubMed] [Google Scholar]
- Chen, Y. , Wang, A. , Tang, J. , Wei, D. , Li, P. , Chen, K. , Wang, Y. , & Zhang, Z. (2015). Association of white matter integrity and cognitive functions in patients with subcortical silent lacunar infarcts. Stroke, 46, 1123–1126. [DOI] [PubMed] [Google Scholar]
- Choi, M.‐H. , Kim, H.‐S. , Baek, J.‐H. , Lee, J.‐C. , Park, S.‐J. , Jeong, U.‐H. , Gim, S.‐Y. , Kim, S.‐P. , Lim, D.‐W. , & Chung, S.‐C. (2015). Differences in activation area within Brodmann area 2 caused by pressure stimuli on fingers and joints. Medicine (Baltimore), 94(38), e1657. 10.1097/MD.0000000000001657 [DOI] [PMC free article] [PubMed] [Google Scholar]
- Cihangiroglu, M. , Uluğ, A. M. , Firat, Z. , Bayram, A. , Kovanlikaya, A. , & Kovanlikaya, I. (2009). High b‐value diffusion‐weighted MR imaging of normal brain at 3T. European Journal of Radiology, 69, 454–458. 10.1016/j.ejrad.2007.11.023 [DOI] [PubMed] [Google Scholar]
- Cockshell, S. J. , & Mathias, J. L. (2010). Cognitive functioning in chronic fatigue syndrome: A meta‐analysis. Psychological Medicine, 40, 1253–1267. 10.1017/S0033291709992054 [DOI] [PubMed] [Google Scholar]
- Cope, H. , & David, A. S. (1996). Neuroimaging in chronic fatigue syndrome. Journal of Neurology, Neurosurgery, and Psychiatry, 60, 471–473. 10.1136/jnnp.60.5.471 [DOI] [PMC free article] [PubMed] [Google Scholar]
- Cordero‐Grande, L. , Christiaens, D. , Hutter, J. , Price, A. N. , & Hajnal, J. V. (2019). Complex diffusion‐weighted image estimation via matrix recovery under general noise models. NeuroImage, 200, 391–404. 10.1016/j.neuroimage.2019.06.039 [DOI] [PMC free article] [PubMed] [Google Scholar]
- Costa, D. C. , Tannock, C. , & Brostoff, J. (1995). Brainstem perfusion is impaired in chronic fatigue syndrome. QJM, 88, 767–773. [PubMed] [Google Scholar]
- de Lange, F. P. , Koers, A. , Kalkman, J. S. , Bleijenberg, G. , Hagoort, P. , van der Meer, J. W. M. , & Toni, I. (2008). Increase in prefrontal cortical volume following cognitive behavioural therapy in patients with chronic fatigue syndrome. Brain, 131, 2172–2180. 10.1093/brain/awn140 [DOI] [PubMed] [Google Scholar]
- DeLano, M. C. , Cooper, T. G. , Siebert, J. E. , Potchen, M. J. , & Kuppusamy, K. (2000). High‐b‐value diffusion‐weighted MR imaging of adult brain: Image contrast and apparent diffusion coefficient map features. American Journal of Neuroradiology, 21, 1830–1836. [PMC free article] [PubMed] [Google Scholar]
- Doll, A. , Hölzel, B. K. , Mulej Bratec, S. , Boucard, C. C. , Xie, X. , Wohlschläger, A. M. , & Sorg, C. (2016). Mindful attention to breath regulates emotions via increased amygdala–prefrontal cortex connectivity. NeuroImage, 134, 305–313. 10.1016/j.neuroimage.2016.03.041 [DOI] [PubMed] [Google Scholar]
- Filippi, M. , Cercignani, M. , Inglese, M. , Horsfield, M. A. , & Comi, G. (2001). Diffusion tensor magnetic resonance imaging in multiple sclerosis. Neurology, 56, 304–311. 10.1212/WNL.56.3.304 [DOI] [PubMed] [Google Scholar]
- Fukuda, K. (1994). The chronic fatigue syndrome: A comprehensive approach to its definition and study. Annals of Internal Medicine, 121, 953–959. 10.7326/0003-4819-121-12-199412150-00009 [DOI] [PubMed] [Google Scholar]
- Glickstein, M. , & Doron, K. (2008). Cerebellum: Connections and functions. Cerebellum, 7, 589–594. 10.1007/s12311-008-0074-4 [DOI] [PubMed] [Google Scholar]
- Goldstein, J. A. , Mena, I. , Jouanne, E. , & Lesser, I. (1995). The assessment of vascular abnormalities in late life chronic fatigue syndrome by brain SPECT. Journal of Chronic Fatigue Syndrome, 1, 55–79. [Google Scholar]
- Harper, R. M. , Gozal, D. , Bandler, R. , Spriggs, D. , Lee, J. , & Alger, J. (1998). Regional brain activation in humans during respiratory and blood pressure challenges. Clinical and Experimental Pharmacology and Physiology, 25, 483–486. 10.1111/j.1440-1681.1998.tb02240.x [DOI] [PubMed] [Google Scholar]
- Jason, L. A. , Richman, J. A. , Rademaker, A. W. , Jordan, K. M. , Plioplys, A. V. , Taylor, R. R. , McCready, W. , Huang, C. F. , & Plioplys, S. (1999). A community‐based study of chronic fatigue syndrome. Archives of Internal Medicine, 159, 2129–2137. 10.1001/archinte.159.18.2129 [DOI] [PubMed] [Google Scholar]
- Jensen, J. H. , & Helpern, J. A. (2010). MRI quantification of non‐Gaussian water diffusion by kurtosis analysis. NMR in Biomedicine, 23, 698–710. 10.1002/nbm.1518 [DOI] [PMC free article] [PubMed] [Google Scholar]
- Jones, D. K. , Knösche, T. R. , & Turner, R. (2013). White matter integrity, fiber count, and other fallacies: The do's and don'ts of diffusion MRI. NeuroImage, 73, 239–254. 10.1016/j.neuroimage.2012.06.081 [DOI] [PubMed] [Google Scholar]
- Kimura, Y. , Sato, N. , Ota, M. , Shigemoto, Y. , Morimoto, E. , Enokizono, M. , Matsuda, H. , Shin, I. , Amano, K. , Ono, H. , Sato, W. , & Yamamura, T. (2019). Brain abnormalities in myalgic encephalomyelitis/chronic fatigue syndrome: Evaluation by diffusional kurtosis imaging and neurite orientation dispersion and density imaging. Journal of Magnetic Resonance Imaging, 49, 818–824. 10.1002/jmri.26247 [DOI] [PubMed] [Google Scholar]
- Kratochwil, C. F. , Maheshwari, U. , & Rijli, F. M. (2017). The long journey of pontine nuclei neurons: From rhombic lip to cortico‐ponto‐cerebellar circuitry. Front Neural Circuits, 11, 33. 10.3389/fncir.2017.00033 [DOI] [PMC free article] [PubMed] [Google Scholar]
- Lane, R. D. , Reiman, E. M. , Bradley, M. M. , Lang, P. J. , Ahern, G. L. , Davidson, R. J. , & Schwartz, G. E. (1997). Neuroanatomical correlates of pleasant and unpleasant emotion. Neuropsychologia, 35, 1437–1444. 10.1016/S0028-3932(97)00070-5 [DOI] [PubMed] [Google Scholar]
- Lazar, M. , Jensen, J. H. , Xuan, L. , & Helpern, J. A. (2008). Estimation of the orientation distribution function from diffusional kurtosis imaging. Magnetic Resonance in Medicine, 60, 774–781. 10.1002/mrm.21725 [DOI] [PMC free article] [PubMed] [Google Scholar]
- Lewis, D. H. , Mayberg, H. S. , Fischer, M. E. , Goldberg, J. , Ashton, S. , Graham, M. M. , & Buchwald, D. (2001). Monozygotic twins discordant for chronic fatigue syndrome: Regional cerebral blood flow SPECT. Radiology, 219, 766–773. 10.1148/radiology.219.3.r01jn18766 [DOI] [PubMed] [Google Scholar]
- Macey, P. M. , Woo, M. A. , Macey, K. E. , Keens, T. G. , Saeed, M. M. , Alger, J. R. , & Harper, R. M. (2005). Hypoxia reveals posterior thalamic, cerebellar, midbrain, and limbic deficits in congenital central hypoventilation syndrome. Journal of Applied Physiology, 98, 958–969. 10.1152/japplphysiol.00969.2004 [DOI] [PubMed] [Google Scholar]
- Maller, J. J. , Thomson, R. H. S. , Pannek, K. , Rose, S. E. , Bailey, N. , Lewis, P. M. , & Fitzgerald, P. B. (2014). The (Eigen)value of diffusion tensor imaging to investigate depression after traumatic brain injury. Human Brain Mapping, 35, 227–237. 10.1002/hbm.22171 [DOI] [PMC free article] [PubMed] [Google Scholar]
- Marcel, B. , Komaroff, A. L. , Fagioli, L. R. , Kornish, R. J. , & Albert, M. S. (1996). Cognitive deficits in patients with chronic fatigue syndrome. Biological Psychiatry, 40, 535–541. 10.1016/0006-3223(95)00422-X [DOI] [PubMed] [Google Scholar]
- Mayo, C. D. , Mazerolle, E. L. , Ritchie, L. , Fisk, J. D. , & Gawryluk, J. R. (2017). Longitudinal changes in microstructural white matter metrics in Alzheimer's disease. NeuroImage: Clinical, 13, 330–338. 10.1016/j.nicl.2016.12.012 [DOI] [PMC free article] [PubMed] [Google Scholar]
- Mori, S. , & Zhang, J. (2006). Principles of diffusion tensor imaging and its applications to basic neuroscience research. Neuron, 51, 527–539. 10.1016/j.neuron.2006.08.012 [DOI] [PubMed] [Google Scholar]
- Musiek, F. E. (1986). Neuroanatomy, neurophysiology, and central auditory assessment. Part III: Corpus callosum and efferent pathways. Ear and Hearing, 7, 349–358. 10.1097/00003446-198612000-00001 [DOI] [PubMed] [Google Scholar]
- Naidich, T. P. , Duvernoy, H. M. , Delman, B. N. , Sorensen, A. G. , Kollias, S. S. , & Haacke, E. M. (2009). Duvernoy's atlas of the human brain stem and cerebellum: High‐field MRI, surface anatomy, internal structure, vascularization and 3D sectional anatomy. Springer Science & Business Media. 10.1007/978-3-211-73971-6 [DOI] [Google Scholar]
- Nakatomi, Y. , Mizuno, K. , Ishii, A. , Wada, Y. , Tanaka, M. , Tazawa, S. , Onoe, K. , Fukuda, S. , Kawabe, J. , Takahashi, K. , Kataoka, Y. , Shiomi, S. , Yamaguti, K. , Inaba, M. , Kuratsune, H. , & Watanabe, Y. (2014). Neuroinflammation in patients with chronic fatigue syndrome/myalgic encephalomyelitis: An 11C‐(R)‐PK11195 PET study. Journal of Nuclear Medicine, 55, 945–950. 10.2967/jnumed.113.131045 [DOI] [PubMed] [Google Scholar]
- Natelson, B. H. , Cohen, J. M. , Brassloff, I. , & Lee, H.‐J. (1993). A controlled study of brain magnetic resonance imaging in patients with the chronic fatigue syndrome. Journal of the Neurological Sciences, 120, 213–217. 10.1016/0022-510X(93)90276-5 [DOI] [PubMed] [Google Scholar]
- Nucifora, P. G. P. , Verma, R. , Lee, S.‐K. , & Melhem, E. R. (2007). Diffusion‐tensor MR imaging and tractography: Exploring brain microstructure and connectivity. Radiology, 245, 367–384. 10.1148/radiol.2452060445 [DOI] [PubMed] [Google Scholar]
- Okada, T. , Tanaka, M. , Kuratsune, H. , Watanabe, Y. , & Sadato, N. (2004). Mechanisms underlying fatigue: A voxel‐based morphometric study of chronic fatigue syndrome. BMC Neurology, 4, 14. 10.1186/1471-2377-4-14 [DOI] [PMC free article] [PubMed] [Google Scholar]
- Parsons, L. M. , Egan, G. , Liotti, M. , Brannan, S. , Denton, D. , Shade, R. , Robillard, R. , Madden, L. , Abplanalp, B. , & Fox, P. T. (2001). Neuroimaging evidence implicating cerebellum in the experience of hypercapnia and hunger for air. PNAS, 98, 2041–2046. 10.1073/pnas.98.4.2041 [DOI] [PMC free article] [PubMed] [Google Scholar]
- Paton, J. F. R. , La Noce, A. , Sykes, R. M. , Sebastiani, L. , Bagnoli, P. , Ghelarducci, B. , & Bradley, D. J. (1991). Efferent connections of lobule IX of the posterior cerebellar cortex in the rabbit—Some functional considerations. Journal of the Autonomic Nervous System, 36, 209–223. 10.1016/0165-1838(91)90045-5 [DOI] [PubMed] [Google Scholar]
- Paul, L. , Rafferty, D. , Wood, L. , & Maclaren, W. (2008). Gait characteristics of subjects with chronic fatigue syndrome and controls at self‐selected and matched velocities. Journal of Neuroengineering and Rehabilitation, 5, 16. 10.1186/1743-0003-5-16 [DOI] [PMC free article] [PubMed] [Google Scholar]
- Pereira, A. C. , Mao, X. , Jiang, C. S. , Kang, G. , Milrad, S. , McEwen, B. S. , Krieger, A. C. , & Shungu, D. C. (2017). Dorsolateral prefrontal cortex GABA deficit in older adults with sleep‐disordered breathing. PNAS, 114, 10250–10255. 10.1073/pnas.1700177114 [DOI] [PMC free article] [PubMed] [Google Scholar]
- Puri, B. K. , Jakeman, P. M. , Agour, M. , Gunatilake, K. D. R. , Fernando, K. A. C. , Gurusinghe, A. I. , Treasaden, I. H. , Waldman, A. D. , & Gishen, P. (2012). Regional grey and white matter volumetric changes in myalgic encephalomyelitis (chronic fatigue syndrome): A voxel‐based morphometry 3 T MRI study. The British Journal of Radiology, 85, e270–e273. 10.1259/bjr/93889091 [DOI] [PMC free article] [PubMed] [Google Scholar]
- Rasouli, O. , Fors, E. A. , Borchgrevink, P. C. , Öhberg, F. , & Stensdotter, A.‐K. (2017). Gross and fine motor function in fibromyalgia and chronic fatigue syndrome. Journal of Pain Research, 10, 303–309. 10.2147/JPR.S127038 [DOI] [PMC free article] [PubMed] [Google Scholar]
- Rayhan, R. U. , Stevens, B. W. , Timbol, C. R. , Adewuyi, O. , Walitt, B. , VanMeter, J. W. , & Baraniuk, J. N. (2013). Increased brain white matter axial diffusivity associated with fatigue, pain and hyperalgesia in Gulf War illness. PLoS ONE, 8, e58493. 10.1371/journal.pone.0058493 [DOI] [PMC free article] [PubMed] [Google Scholar]
- Razek, A. A. K. A. , Taman, S. E. , El Regal, M. E. , Megahed, A. , Elzeny, S. , & El Tantawi, N. (2020). Diffusion tensor imaging of microstructural changes in the gray and white matter in patients with Crigler‐Najjar syndrome type I. Journal of Computer Assisted Tomography, 44, 393–398. 10.1097/RCT.0000000000001008 [DOI] [PubMed] [Google Scholar]
- Rector, D. M. , Richard, C. A. , & Harper, R. M. (2006). Cerebellar fastigial nuclei activity during blood pressure challenges. Journal of Applied Physiology, 101, 549–555. 10.1152/japplphysiol.00044.2006 [DOI] [PubMed] [Google Scholar]
- Rombouts, S. A. R. B. , Barkhof, F. , Veltman, D. J. , Machielsen, W. C. M. , Witter, M. P. , Bierlaagh, M. A. , Lazeron, R. H. C. , Valk, J. , & Scheltens, P. (2000). Functional MR imaging in Alzheimer's disease during memory encoding. American Journal of Neuroradiology, 21, 1869–1875. [PMC free article] [PubMed] [Google Scholar]
- Rowe, P. C. , Marden, C. L. , Flaherty, M. A. K. , Jasion, S. E. , Cranston, E. M. , Johns, A. S. , Fan, J. , Fontaine, K. R. , & Violand, R. L. (2014). Impaired range of motion of limbs and spine in chronic fatigue syndrome. The Journal of Pediatrics, 165, 360–366. 10.1016/j.jpeds.2014.04.051 [DOI] [PubMed] [Google Scholar]
- Rudge, P. , & Warrington, E. K. (1991). Selective impairment of memory and visual perception in splenial tumours. Brain, 114(Pt 1B), 349–360. 10.1093/brain/114.1.349 [DOI] [PubMed] [Google Scholar]
- Schilling, K. G. , Nath, V. , Blaber, J. , Harrigan, R. L. , Ding, Z. , Anderson, A. W. , & Landman, B. A. (2017). Effects of b‐value and number of gradient directions on diffusion MRI measures obtained with Q‐ ball imaging. Proceedings of SPIE—The International Society for Optical Engineering, 10133, 101330N. [DOI] [PMC free article] [PubMed] [Google Scholar]
- Schmahmann, J. D. , Smith, E. E. , Eichler, F. S. , & Filley, C. M. (2008). Cerebral white matter: Neuroanatomy, clinical neurology, and neurobehavioral correlates. Annals of the New York Academy of Sciences, 1142, 266–309. 10.1196/annals.1444.017 [DOI] [PMC free article] [PubMed] [Google Scholar]
- Sen, P. N. , & Basser, P. J. (2005). A model for diffusion in white matter in the brain. Biophysical Journal, 89, 2927–2938. 10.1529/biophysj.105.063016 [DOI] [PMC free article] [PubMed] [Google Scholar]
- Shan, Z. Y. , Finegan, K. , Bhuta, S. , Ireland, T. , Staines, D. R. , Marshall‐Gradisnik, S. M. , & Barnden, L. R. (2018a). Decreased connectivity and increased Blood oxygenation level dependent complexity in the default mode network in individuals with chronic fatigue syndrome. Brain Connectivity, 8, 33–39. 10.1089/brain.2017.0549 [DOI] [PubMed] [Google Scholar]
- Shan, Z. Y. , Finegan, K. , Bhuta, S. , Ireland, T. , Staines, D. R. , Marshall‐Gradisnik, S. M. , & Barnden, L. R. (2018b). Brain function characteristics of chronic fatigue syndrome: A task fMRI study. NeuroImage: Clinical, 19, 279–286. 10.1016/j.nicl.2018.04.025 [DOI] [PMC free article] [PubMed] [Google Scholar]
- Smith, S. M. , Jenkinson, M. , Woolrich, M. W. , Beckmann, C. F. , Behrens, T. E. J. , Johansen‐Berg, H. , Bannister, P. R. , De Luca, M. , Drobnjak, I. , Flitney, D. E. , Niazy, R. K. , Saunders, J. , Vickers, J. , Zhang, Y. , De Stefano, N. , Brady, J. M. , & Matthews, P. M. (2004). Advances in functional and structural MR image analysis and implementation as FSL. NeuroImage, 23(Suppl 1), S208–S219. 10.1016/j.neuroimage.2004.07.051 [DOI] [PubMed] [Google Scholar]
- Squire, L. R. , Stark, C. E. L. , & Clark, R. E. (2004). The medial temporal lobe. Annual Review of Neuroscience, 27, 279–306. 10.1146/annurev.neuro.27.070203.144130 [DOI] [PubMed] [Google Scholar]
- Thapaliya, K. , Marshall‐Gradisnik, S. , Staines, D. , & Barnden, L. (2020). Mapping of pathological change in chronic fatigue syndrome using the ratio of T1‐ and T2‐weighted MRI scans. NeuroImage: Clinical, 28, 102366. 10.1016/j.nicl.2020.102366 [DOI] [PMC free article] [PubMed] [Google Scholar]
- Ulivi, L. , Kanber, B. , Prados, F. , Davagnanam, I. , Merwick, A. , Chan, E. , Williams, F. , Hughes, D. , Murphy, E. , Lachmann, R. H. , Wheeler‐Kingshott, C. A. M. G. , Cipolotti, L. , & Werring, D. J. (2020). White matter integrity correlates with cognition and disease severity in Fabry disease. Brain, 143, 3331–3342. 10.1093/brain/awaa282 [DOI] [PubMed] [Google Scholar]
- Valenstein, E. , Bowers, D. , Verfaellie, M. , Heilman, K. M. , Day, A. , & Watson, R. T. (1987). Retrosplenial amnesia. Brain, 110(Pt 6), 1631–1646. 10.1093/brain/110.6.1631 [DOI] [PubMed] [Google Scholar]
- Vartanian, O. , Bouak, F. , Caldwell, J. L. , Cheung, B. , Cupchik, G. , Jobidon, M.‐E. , Lam, Q. , Nakashima, A. , Paul, M. , Peng, H. , Silvia, P. J. , & Smith, I. (2014). The effects of a single night of sleep deprivation on fluency and prefrontal cortex function during divergent thinking. Frontiers in Human Neuroscience, 8, 214. 10.3389/fnhum.2014.00214 [DOI] [PMC free article] [PubMed] [Google Scholar]
- Veraart, J. , Fieremans, E. , & Novikov, D. S. (2016). Diffusion MRI noise mapping using random matrix theory. Magnetic Resonance in Medicine, 76, 1582–1593. 10.1002/mrm.26059 [DOI] [PMC free article] [PubMed] [Google Scholar]
- Veraart, J. , Novikov, D. S. , Christiaens, D. , Ades‐Aron, B. , Sijbers, J. , & Fieremans, E. (2016). Denoising of diffusion MRI using random matrix theory. NeuroImage, 142, 394–406. 10.1016/j.neuroimage.2016.08.016 [DOI] [PMC free article] [PubMed] [Google Scholar]
- Vercoulen, J. H. , Bazelmans, E. , Swanink, C. M. , Galama, J. M. , Fennis, J. F. , van der Meer, J. W. , & Bleijenberg, G. (1998). Evaluating neuropsychological impairment in chronic fatigue syndrome. Journal of Clinical and Experimental Neuropsychology, 20, 144–156. 10.1076/jcen.20.2.144.1160 [DOI] [PubMed] [Google Scholar]
- Vismer, M. S. , Forcelli, P. A. , Skopin, M. D. , Gale, K. , & Koubeissi, M. Z. (2015). The piriform, perirhinal, and entorhinal cortex in seizure generation. Front Neural Circuits, 9, 27. 10.3389/fncir.2015.00027 [DOI] [PMC free article] [PubMed] [Google Scholar]
- Zeineh, M. M. , Kang, J. , Atlas, S. W. , Raman, M. M. , Reiss, A. L. , Norris, J. L. , Valencia, I. , & Montoya, J. G. (2014). Right arcuate fasciculus abnormality in chronic fatigue syndrome. Radiology, 274, 517–526. [DOI] [PubMed] [Google Scholar]
- Zheng, Z. , Shemmassian, S. , Wijekoon, C. , Kim, W. , Bookheimer, S. Y. , & Pouratian, N. (2014). DTI correlates of distinct cognitive impairments in Parkinson's disease. Human Brain Mapping, 35, 1325–1333. 10.1002/hbm.22256 [DOI] [PMC free article] [PubMed] [Google Scholar]
Associated Data
This section collects any data citations, data availability statements, or supplementary materials included in this article.
Supplementary Materials
Table S1 Significant clusters from λ2 and λ3 voxel‐wise interaction‐with‐group regressions with five clinical regressors. Clusters were formed with an uncorrected voxel p threshold of 0.001 for Procinfo and Resp and exceeded 100 voxels in extent. The sign of the regressor is the sign of the slope of the regression for the ME/CFSICC group. BA=Brodmann Area.
Data Availability Statement
The study data are available upon reasonable request and following approval from the study group.