

Abstract
Water electrolysis that results in green hydrogen is the key process towards a circular economy. The supply of sustainable electricity and availability of oxygen evolution reaction (OER) electrocatalysts are the main bottlenecks of the process for large‐scale production of green hydrogen. A broad range of OER electrocatalysts have been explored to decrease the overpotential and boost the kinetics of this sluggish half‐reaction. Co‐, Ni‐, and Fe‐based catalysts have been considered to be potential candidates to replace noble metals due to their tunable 3d electron configuration and spin state, versatility in terms of crystal and electronic structures, as well as abundance in nature. This Review provides some basic principles of water electrolysis, key aspects of OER, and significant criteria for the development of the catalysts. It provides also some insights on recent advances of Co‐, Ni‐, and Fe‐based oxides and a brief perspective on green hydrogen production and the challenges of water electrolysis.
Keywords: cobalt, iron, nickel, oxygen evolution reaction, water splitting
This Review describes the basic principles of water electrolysis, key aspects of the oxygen evolution reaction (OER), and significant criteria for the development of new catalysts. Recent advances in catalysts based on Co, Ni, and Fe oxides are described, and a brief perspective is given on green hydrogen production and the challenges of water electrolysis.
1. Introduction
Water electrolysis—by using sustainable electricity—is a promising process to split water into green H2 and O2 gases. The demand for H2 production is rapidly increasing and receiving more attention since it can be used as a feedstock and energy carrier for diverse applications, for example, in the chemical industry, transportation, and power sectors. Moreover, green H2 production and consumption do not cause air pollution and waste. Thus, it offers the solution to reduce the carbon footprint or even decarbonize some key industrial processes like the Haber–Bosch ammonia synthesis and steel production that account for a large amount of CO2 emission. [1] This makes green H2 production a key element for us to meet the targets set by the European Commission and the Paris Climate Agreement towards being carbon neutral by 2050. [2] Besides, water electrolyzers can be easily integrated into photovoltaic and (on‐) offshore wind farms for on‐site H2 production and usage. The price of renewable electricity is getting more comparable that produced by fossil fuel‐based power plants, which makes green H2 more affordable than “gray” H2 from the conventional steam‐reforming process. [3]
Water splitting is an endothermic reaction and requires an energy input of ΔG=237.1 kJ mol−1 under standard conditions (25 °C, 1 atm), as shown in Equation (1). The hydrogen evolution reaction (HER) and oxygen evolution reaction (OER) take place at the cathode and anode, respectively, and they are preferably separated by a membrane as illustrated in Scheme 1. Depending on the pH of the electrolyte, HER and OER proceed according to different reaction pathways. In an acidic electrolyte, water is oxidized to O2 gas by forming the protons at the anode. Protons are transferred to the cathode as charge carriers and are reduced to H2 to complete the electrochemical circuit [Eqs. (2) and (3)]. Under alkaline conditions, hydroxyl anions play the role of electrochemical charge carriers, which are formed by water reduction at the cathode and oxidized at the anode to produce H2 and O2, respectively [Eqs. (4) and 5].
| (1) |
Scheme 1.
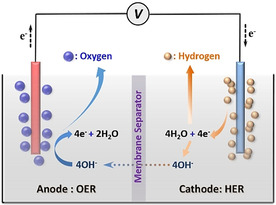
A typical water electrolysis cell under alkaline conditions.
In acidic electrolyte:
| (2) |
| (3) |
In alkaline electrolyte:
| (4) |
| (5) |
A thermodynamic potential of 1.23 V is required to split water into H2 and O2. However, typically a much higher applied voltage is necessary to surmount the energy barrier mainly related to kinetic and mass transportation. [4] This is mainly determined by the overpotentials to overcome the activation energy of the HER and OER. Additionally, some potential is required to overcome the resistances of electrolyte, contact, and membrane as well as the parasitic resistance of side reactions like electrode corrosion [5] and dioxygen reduction. [6] The contact resistance is further affected by the diffusion of reactants and gas products. So, the overall applied potential (E ap) for water electrolysis can be described as in Equation (6), where η HER and η OER are the overpotentials while η other represents the total voltage drops resulting from the system resistances.
| (6) |
Under the ideal conditions, a theoretical value of 3.55 kWh of electricity is needed to produce one liter of H2. This amount is increased to 4.26 kWh when the total voltage drop is taken into account. [7] The overpotential for both half‐reactions is determined by accessible ions near the electrode surfaces and the activation energy to overcome the kinetics limitations of the electrochemical reactions. To increase the concentration of accessible reactant ions, it is essential to speed up the ion diffusion in the electrolyte. For instance, vigorous stirring or increasing the operating temperature of electrolytes could accelerate the diffusion of ions.
The activation energy dictating the reaction kinetics can be significantly reduced by using electrocatalysts. Of the two half‐reactions, OER is triggered by multiple electron transfer steps and oxygen–oxygen bond formation, which is thermodynamically more challenging than the two‐electron transfer process in HER. [8] Therefore, the high energy input for OER has been a key factor in limiting the overall efficiency of electrochemical water splitting. Developing OER electrocatalysts with high activity and robust stability is crucial to reach the target of large‐scale green H2 production for sustainable future energy and industrial landscapes.
Over the past decades, Ir‐ and Ru‐based oxide electrocatalysts have been widely used in industrial proton‐exchange membrane water electrolyzers. [9] However, these noble‐metal‐based materials are not suitable for practical large‐scale H2 production due to their cost as well as limited supply. [10] Alternatively, non‐precious‐metal‐based catalysts have shown promising activity towards OER, and thus attracted tremendous research interest, especially the first‐row transition metals like Mn, Fe, Co, and Ni. In recent years, a wide range of active OER catalysts consisting of these metals have been reported, which are prepared in various forms, for example, oxides, [11] (oxy)hydroxides, [12] phosphides, [13] borides, [14] carbides, [15] nitrides, [16] arsenides, [17] sulfides, [18] selenides, [19] and tellurides. [20] Among them, the oxides hold the greatest potential for industrial application despite the fact that higher catalytic activity was achieved by other metal compounds, such as (oxy)hydroxides for the OER process. [21] The large‐scale preparation of transition metal oxides (TMOs) is more feasible than the synthesis of other counterparts and thus, TMOs are more appealing for practical utilization. Unfortunately, so far, there has not been a significant breakthrough in this field at the level of commercialization since 1987, when Corrigan accidentally formed an active Ni‐Fe oxide electrocatalyst when studying the effect of Fe impurities in NiO thin films. [22] For most reported TMO‐based OER catalysts, a significant overpotential (≈300 mV) is still required to reach a current density of 10 mA cm−2 in 1 M KOH electrolyte. [23] Hence, there is still a need for the design and development of more effective, durable, sustainable, and economical materials for OER.
In this Review, we present the basic principle of water electrolysis by focusing on OER, and key electrochemical terms for the evaluation of the electrocatalysts. We also discuss crucial aspects of OER catalysts, including their chemical and structural properties as well as defects and catalyst alteration under the operating conditions by focusing on Co‐, Ni‐, and Fe‐based oxides. At the end, we discuss challenges and further prospects in the development of water electrolysis for green H2 production and its impact on the future energy landscape.
2. Electrochemical Oxygen Evolution Reaction
The oxidation of water is a fundamental reaction in the photosynthesis system that produces molecular O2 and water‐derived electrons, which are used to convert CO2 to biomass, food, and fuel. It is very challenging to have insight into the reaction process due to the alteration of the surface structure of the electrocatalyst under operating conditions, and the availability of a small number of catalytically active centers as well as their short life‐time. [6] However, with the rapid advance of high‐resolution and operando techniques, great progress has been made in the last decades.[ 21c , 24 ] In this section, we discuss some of this progress and important aspects of OER, including the reaction kinetics and main parameters to evaluate the performance of the electrocatalysts.
2.1. Reaction Kinetics
The OER is a multiple‐step reaction involving the adsorption and desorption of several different surface intermediates, for example, oxo, peroxide, and superoxide species. The initial step of OER in alkaline electrolyte is the adsorption of a hydroxide radical at the active site of the electrocatalyst.[ 21b , 24b ] A simplified OER pathway on the metal sites was proposed by Song and the co‐workers, as depicted in Scheme 2. [25] The active metal site is represented as “M”, and the sequence of reaction steps is shown by the direction of the arrows. In the first step, the active metal site adsorbs a hydroxide ion (OH−) to form the initial M‐OH intermediate along with the release of one electron. Another hydroxide ion reacts with the M‐OH intermediate by coupling with a proton and removing an electron to form molecular H2O and an M‐O intermediate. Two different pathways are available to produce molecular O2 from the M‐O intermediate. The first one is through the direct combination of two M‐O species. The second one, which is seen as a more representative pathway, consists of two reaction steps. The first step involves the formation of an M‐OOH intermediate by the nucleophilic attack of OH− ion on the M‐O intermediate, where the third electron is fed into the circuit. Subsequently, a hydroxide ion attacks the M‐OOH intermediate and forms molecular O2, and releases the fourth electron. Although there are other proposed mechanisms,[ 21b , 24d , 26 ] the OER pathways are always associated with the bonding interactions of the metal centers and intermediates, which have a key impact on the reaction kinetics.
Scheme 2.
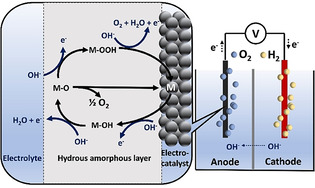
An alkaline water‐splitting cell; the magnification shows a generalized mechanism of OER in the alkaline medium over a metal electrocatalyst.
To achieve fast reaction kinetics, all intermediates in each elementary step of OER should be favored by the surface energy and bonding interactions. The standard free energy change (ΔG) of the OER is calculated to be 4.92 eV, and a thermodynamically ideal OER catalyst would require the same minimal free energy (ΔG s) of 1.23 eV (4.92 eV/4=1.23 eV) to drive the formation of each of the oxygen intermediates, which are *OH, *O, *OOH, and O2. [27] When any of the intermediates are strongly bonded to the active metal site, a higher ΔG s is required for the corresponding electron‐transfer step, resulting in an overpotential to drive the OER process. In practice, an overpotential is always present with either high or low values, depending on the type of catalyst. This is due to the different bond strengths between the surface of the metal catalyst and the oxygen intermediates. The fast diffusion of reactants and the quick release of molecular oxygen are essential to obtain high catalytic efficiency.
First‐principles periodic density functional theory (DFT) calculations are applied on broad classes of metal oxides to revisit the origin of the overpotential of OER, which revealed a solid correlation between the binding energies of *OOH and *OH intermediates. [27] Thus, a universal descriptor based on free energy and the binding energy of *O and *OH intermediates (ΔG *O−ΔG *OH) was introduced to reveal the origin of the overpotential. [28] An OER volcano plot was constructed based on this descriptor as shown in Figure 1. Overpotentials at 1 mA cm−2 from experimental results turn out to have a good match with the overpotentials from the theoretical calculations when ΔG *O−ΔG *OH is employed as the descriptor. As seen in the volcano plot, the catalysts with optimum binding strengths like IrO2, NiFeOx, and CoOx exhibit superior OER activities with lower overpotentials. Thus, design of an OER catalyst with neither too strong nor too weak bonding to oxygen intermediates (Sabatier principle) is key to reach faster reaction kinetics.
Figure 1.
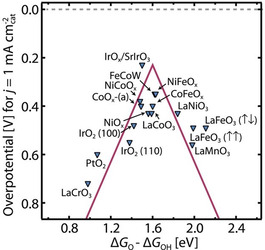
The OER volcano plot of overpotentials of diverse electrocatalysts at 1 mA cm−2 vs. energy differences (ΔG *O−ΔG *OH). Reproduced with permission from ref. [28] Copyright 2017, American Association for the Advancement of Science.
2.2. Key Parameters for the Evaluation of OER Activity
The OER performance of electrocatalysts is very sensitive to experimental conditions; however, most of the methods used are not standardized and their apparatus and experimental conditions largely fluctuate. This makes it challenging to compare the performances of different materials. In the following section, we elaborate on critical aspects of the experimental conditions, configuration of electrode kits, and other key features of OER measurements. Some of the key aspects are summarized in Scheme 3.
Scheme 3.
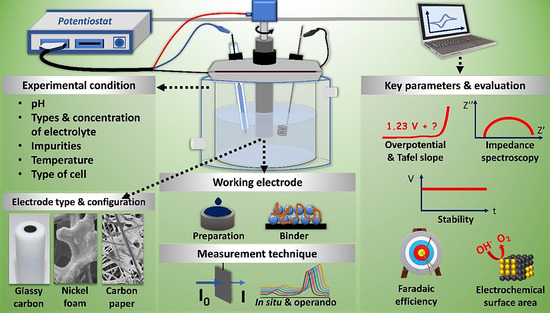
Summary of important key parameters to evaluate OER activity, including experimental conditions and evaluation methods.
Experimental conditions : The surroundings of an electrode including pressure, temperature, pH, and type and concentration of the electrolyte play an essential role in the OER activity of electrocatalysts. The electrolyte provides a pathway for ions to stream between the electrodes and maintains the charge balance. For transition metal oxides, the OER measurements in the laboratory are typically conducted under alkaline conditions (pH 12–14) with KOH solution as the electrolyte. Even a small amount of Fe impurities in the KOH electrolyte has been shown to change dramatically the OER performances of Co‐, Ni‐, and Fe‐based electrocatalysts. [29] Besides the type of electrolyte, its concentration is important, since higher concentration assists better charge transport. [30] In practical alkaline water electrolyzers, typically 5–7 M KOH or NaOH solution is used as electrolyte and the two cells are separated by Zirfon membrane (ZrO2‐coated polyphenyl sulfide mesh). The system runs at ambient pressure or the cell is pressurized up to 30 bar. [31]
Laboratory temperatures typically fluctuate, depending on the seasons and even time of day, and this can impact the electrolyte and the activity of the catalyst. Thus, it is recommended to use an external thermostat to maintain constant cell temperature. In general, electrochemical OER follows the Arrhenius’ law, where the reaction rate is proportional to the temperature. However, irregularities could be found in some transition‐metal‐based oxides due to the variation of the rate‐determining step within a certain temperature range. Pang et al. recently reported that for cobalt‐based catalysts at the optimum temperature of 65 °C, the rate‐determining steps were shifted to the combination of adsorption and the cleavage of the OH group. [32] This temperature is close to the operation temperature of the commercial alkaline water electrolyzer (60–80 °C).[ 31 , 33 ] It is also recommended to use a cell made of Teflon instead of glass for corrosive alkaline electrolytes, since the silica that may be leached from the glassware and affects the experimental conditions.
Electrode type and configuration : Different types of materials are used as electrodes and their background current and durability vary depending on the experimental conditions. The most often reported working electrodes are glassy carbon (GC), nickel foam (NF), carbon fiber paper (CFP), and conductive thin‐film‐coated glass. Due to the different surface properties and conductivity of these materials, a dramatic difference can be observed in the OER performance regardless of the catalysts. For instance, Ni foam has a very high background current in an alkaline electrolyte as the surface of NF is easily converted to nickel (oxy)‐hydroxide, which shows very good OER activity. [34] The conductivity as well as the activity of the catalyst can be also enhanced by deposition on a suitable substrate. For instance, Co‐, Mn‐, Ni‐, and Fe‐based catalysts function more effectively when they are deposited on Au substrates, while Ti substrates gives a synergistic effect when coupled with a Ir‐based catalyst. [35]
In a typical three‐electrode cell configuration, the counter electrode (usually Pt) provides a means of applying input potential to the working electrode while the reference electrode (like Hg/Hg2Cl2, Hg/AgO, Ag/AgCl) holds a constant potential and assists in measuring the potential of the working electrode. The reference electrode should be chosen carefully depending on the experimental conditions, for instance, Ag/AgCl electrode is not suitable for very high pH since the diffusion of OH− would cause the formation of Ag2O and block the frit. Metal‐based counter electrodes tend to dissolve in strong acid solutions. The reversible hydrogen electrode and Hg/HgO reference electrode (filled with KOH solution) are better options for highly alkaline condition.
Preparation of the working electrode preparation and the binding agent effect : OER results are also strongly affected by electrode preparation methods, the loading of catalyst, and the binder, which affects the electrode–catalyst–electrolyte interface. Typically, electrocatalyst materials are dispersed in a binder‐containing liquid to form a homogeneous ink, which is then deposited onto the clean surface of the working electrode via drop‐casting, spray coating, sputtering, or electrophoretic deposition. Depending on the type of the working electrode, a suitable deposition method should be used to fabricate a uniform thin film. The binder should be carefully chosen to avoid suppressing the OER activity of investigated materials. The binder should have good adhesive properties to the surface of the working electrode and good conductivity to facilitate the mass and charge transfer. [29c] Fulfilling both requirements, Nafion® 117 (a perfluorinated polymer with sulfonate groups) is the most commonly used binder. In lab‐scale applications, the working electrode is typically prepared with a binder. For large‐scale applications, such as in the alkaline water electrolyzer, the electrodes are typically prepared from Ni mesh/plates via vacuum plasma spray with Ni‐Al alloy or by electroplating in the case of Ni‐Zn. Either Al or Zn is then leached with KOH to form a Raney nickel catalyst.[ 33 , 36 ] Another common method to fabricate electrodes for the alkaline water electrolyzer is electrodeposition or Ni electroplating on stainless steel mesh.[ 31 , 37 ]
Catalyst loading is another important aspect: low loading of the electrocatalyst could lead to inhomogeneity and leave some of the electrode surface uncoated. In this case, the current normalization to geometric surface area will not be straightforward. On the other hand, high loading of the electrocatalyst could result in stacked material and create a rough electrode surface. It might hinder the mass transport as well as block some active sites, resulting in lower mass‐specific activity.
Measurement techniques : Individual methods are usually adapted to assess the catalytic properties accordingly. The comparison of measurements made by various methods could lead to contradictory results. The conditions and timing of the measurements are also critical since alterations in electrocatalyst (e.g. corrosion, contamination, and re‐construction) would lead to deactivation or activation. Since these aforementioned factors can change the OER results, variable catalytic performances on the same type of material are often reported by different research groups. [38] Appropriate evaluation parameters and indicators are required to quantitatively compare the catalytic performances, which is elaborated further below.
2.2.1. Overpotential and Tafel Slope
An overpotential is required to assist the adsorption and desorption of OER intermediates, and it is described as the activation potential. This value can be lowered by a good choice of catalyst with optimized binding energy. There are two more types of potentials, which can be called concentration and resistance overpotential. The concentration overpotential is caused by the diffusion limitation from the local drop of reactant concentration near the interfaces, and it can be minimized by rotating the working electrode or stirring the electrolyte. In an electrochemical cell, additional resistances from the electrolyte, wire, and connections are always present, and they cause voltage growth according to Ohm's law (V=I⋅R). Since these resistances are rather stable in a cell, the resistance overpotential can be offset simply by applying resistance compensation to the linear sweep voltammetry (LSV) curves. [39]
The overpotential (η) at a specific current density per geometric area is used as a primary indicator to evaluate the OER activity. [40] Typically, the overpotential required to achieve a geometric current density of 10 mA cm−2 (denoted as η 10) is used, which originates from the potential of solar cells to reach an efficiency of 10 %. [41] In the case of metal electrodes, such as NF electrodes, the “background” current is considerably larger; hence, the overpotential at much higher current densities (100–1000 mA cm−2) is used as the indicator. [42]
The second most commonly used evaluation indicator is the Tafel slope, which reveals the dependency of the compensated overpotential on the current density.[ 25 , 43 ] The Tafel slope is an important kinetic indicator and can be calculated from the Tafel equation [Eq. 7], where η is the overpotential for OER, b is the Tafel slope, and j is the measured current. [44]
| (7) |
For a multiple electron transfer reaction, the Tafel slope provides valuable information on the reaction mechanism since its value is dependent on the charge transfer coefficient and the number of transferred electrons. The Tafel slope also provides a direct correlation between the current changes and the applied voltage. A smaller value of the Tafel slope indicates a faster increase in the catalytic current when a higher voltage is applied. Similar to the overpotential, the interpretation of the Tafel slope suffers from the capacitive current. A large error is possible due to the different capacitive current measured at varied potential scan rates. Also, the Tafel slope can differ depending on the overpotential region. For instance, an unusually higher Tafel slope (340 mV dec−1) was reported for a diamond electrode at an overpotential of <1.2 V, in comparison to the value (121 mV dec−1) obtained in the high overpotential region (>1.2 V, as shown in Figure 2 a). [45] Such a high Tafel slope was considered as a result of the surface functional groups slowing the kinetics of OER. [46] At a higher overpotential region, the same electrode gave a Tafel slope of around 120 mV dec−1, which agrees with the theoretical value. [45]
Figure 2.
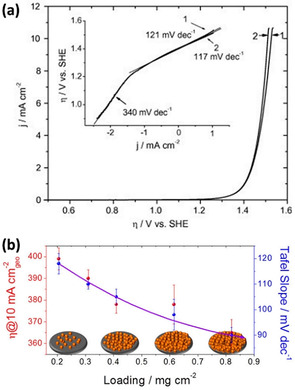
a) LSV curves (1) before and (2) after Ohmic drop correction on the boron‐doped diamond electrode; inset shows the corresponding Tafel plots. Reprinted with permission from ref. [45] Copyright 2018, Elsevier. b) Plots of NiO loading on the electrode against the value of η 10 and the Tafel slope, which were derived from the LSV result after Ohmic drop correction. Reprinted with permission from ref. [41] Copyright 2019, American Chemical Society.
Another important aspect that influences the Tafel slope determination is Ohmic (iR) drop that mainly originates from the electrical resistance of electrolyte solution as well as distance between the working electrode and the reference electrode in the three‐electrode system. This disturbance should be measured experimentally and compensated before the OER measurements are performed by using electrochemical impedance spectroscopy (EIS) or current‐interrupted methods. EIS is the most common method to determine Ohmic drop that can be easily detected by observing the intercept of the real part of the impedance at high frequencies in the Nyquist plot. The current‐interrupted method uses the basic principle of Ohm's law. Principally the current step is applied, then the resistance is calculated when the current is applied and interrupted. Nowadays, most potentiostats are equipped with the feature to compensate for Ohmic drop. However, Ohmic drop is generally compensated by 80–90 % since overcompensation may cause oscillation in the measurement. [47] In the practical alkaline water electrolyzer, the Ohmic drop effect is more severe than in the proton exchange membrane (PEM) water electrolyzer due to the cell geometry and usage of liquid electrolyte.
Although the use of these two indicators, η 10 and the Tafel slope, can offer a fair comparison of the catalytic performances of OER catalysts in a similar system,[ 40 , 43 ] they do not give a holistic picture of the intrinsic activity of an OER catalyst. As pointed out in a recent study, [41] the value of η 10 and the Tafel slope are very much dependent on the mass loading of the catalyst. With increasing NiO loading on the working electrode, a decreasing trend was shown for the values of these two evaluation parameters, illustrating an enhancement in the catalytic activity (Figure 2 b). However, as is well known, the intrinsic activities and properties of the materials are independent of the mass and loading amount of the catalyst. Therefore, the primary use of η 10 and the Tafel slope is not indicative of the intrinsic activity but rather reflects the ability of an electrocatalyst to catalyze OER from an engineering point of view. This could lead to false interpretations in evaluation of catalytic activity without knowing the loading dependence.
2.2.2. Electrochemical Impedance Spectroscopy (EIS)
Charge transfer at the interface of electrocatalyst and electrolyte is another important descriptor for the OER. EIS can elucidate such charge transfer behavior and the nature of the reaction at the interface. Electrochemical impedance is typically measured by applying an alternating current (AC) potential to an electrochemical cell and then measuring the current. EIS is a one‐point measurement by inducing small perturbation amplitude (E 0 within the 1–10 mV of magnitude) of the applied potential over the time E(t) in various frequencies (ω) as shown in Equation 8. [48] In a linear system (where the response is directly proportional to input), the measured current response, I(t), is then shifted in phase (ϕ) and has a different amplitude [Eq. 9]. The impedance is then stated as resistance in AC by analogous Ohm's law [Eq. 10].
| (8) |
| (9) |
| (10) |
The EIS data are typically interpreted by using Nyquist or Bode plots. In the Nyquist plot, as shown in Figure 3, the impedance is plotted in a complex plane against a real plane (Z Im vs. Z Re), giving a typical semicircle relation. The Bode plot describes the magnitude of impedance |Z| and the phase angle ϕ as a function of frequency. [49] The Nyquist plot is widely used to interpret EIS data of OER due to its direct correlation to solution resistance (R s) and charge transfer resistance (R ct). [50] The experimental impedance data should be always fitted to the equivalent circuit model to avoid bias in interpretation and gain relevant information of the aforementioned parameters. This equivalent circuit model can be built from several elements, such as resistor (R), capacitance (C), constant phase element (Q), impedance of diffusion or Warburg diffusion (Z w), and other elements. For OER catalyzed by a transition metal oxide, generally the intercept at high frequency at the real plane (axis) is related to the electrolyte solution resistance (R s), while the diameter of the semicircle can be directly translated into polarization or charge transfer resistance (R ct). Figure 3 shows Nyquist plots to evaluate the charge transfer resistance of Co3O4, NiO, and their mixed oxides before and after electrochemical alteration in the KOH electrolyte. After cyclic voltammetry (CV) measurements, nickel‐containing electrocatalysts were activated due to the uptake of Fe impurities from the electrolyte. This causes a decrease in the charge‐transfer resistance of nickel‐based catalysts—measured by the diameter of the semicircle in the Nyquist plot—and enhancement of the reaction kinetics. [29a]
Figure 3.
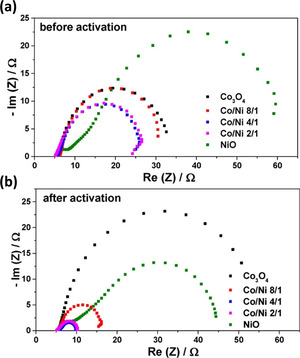
Nyquist plots were obtained from EIS measurements for Co3O4, NiO, and mixed spinel oxides before (a) and after (b) electrochemical activation. Reprinted with permission from ref. [29a] Copyright 2017, American Chemical Society.
2.2.3. Electrochemical Surface Area (ECSA)
To shed light on the intrinsic activity of the electrocatalyst, it is essential to estimate the amount of catalytically active sites. ECSA can be used to normalize the measured currents for the evaluation of intrinsic activities and the determination of the number of active centers. In principle, changing the catalyst loading does not impact the ECSA‐normalized specific activity. However, practically the charge transfer ability of electrode is largely affected by catalyst loading, which can also influence mass transportation. Thus, the OER activity can be underestimated for high loading and ECSA cannot be used as a universal indicator to evaluate OER performance.
Several methods are available to determine the ECSA, those widely reported are electrochemical double‐layer capacitance (EDLC), redox peak, impedance, hydrogen under‐potential deposition, and CO stripping. [40] The determination of EDLC is well defined through the employment of cyclic voltammograms by changing scan rate to determine the capacitive current associated with double‐layer changing. [51] This method is commonly employed to evaluate the ECSA of materials with a distinct redox couple. The determination of ECSA is favored via redox peaks, especially for 3d transition‐metal‐based catalysts. In the case of noble‐metal‐based catalysts, H2 under‐potential deposition and CO stripping are widely used. [52] Regardless of the method, a certain deviation should be expected for the calculation of ECSA.
2.2.4. Faradaic Efficiency
Faradaic efficiency is a quantitative indicator to determine the selectivity of the electrocatalysts. It reflects the ratio of the electrons provided by the oxygen intermediates on the active sites through multiple‐step reactions, to the total amount of electrons that go into the external circuit. The Faradaic current mainly originates from the electrochemical oxidation of water; however, significant current can be also obtained from side reactions. For instance, corrosion reactions occur on most of the OER catalysts, especially when they are combined with carbon‐based materials. [53] The thermodynamic equilibrium potential of carbon oxidation is 0.207 V vs. RHE under standard conditions, which is much lower than the OER potential. Thus, the oxidation of carbon is unavoidable in the potential region of OER. Recently, Möller et al. could detect the formation of CO2 from carbon oxidation via mass spectrometry, verifying that the measured current is not only coming from the water oxidation, as illustrated in Figure 4. [5]
Figure 4.
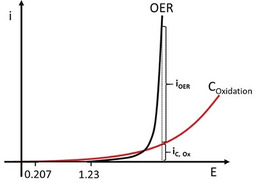
Carbon oxidation and relevant current evaluation (i C) along with the OER (i OER) of carbon‐supported nickel boride catalyst. Adapted with permission from ref. [5] Copyright 2019, Wiley‐VCH Verlag GmbH & Co.
The competing oxidation of the reactants can be triggered in the presence of anions as well. For instance, generation of Cl2 through Cl− oxidation (chlorine evolution reaction) is a major reaction in the electrolysis of brine. [54] Applying higher voltage dramatically speeds up these side reactions and thus lowers the Faradaic efficiency of the OER catalyst. Therefore, measuring Faradaic efficiency is critical for the evaluation of OER activity as it provides the catalytic current rather than the total measured current. There are several methods to calculate the Faradaic efficiency, which are mainly based on the quantification of the produced gases through diverse methods like sensors, rotating ring disc electrodes (RRDEs), [8] and differential electrochemical mass spectrometry (DEMS). [55] For Faradaic efficiency calculation with RRDE, the measurement is conducted with chronopotentiometry at 1 mA cm−2 geometric current density. The Faradaic efficiency is denoted as the relative value of measured ring current (i r) to the disc current as shown in Equation 11. [23] The disc current is then calculated by multiplying the constant disc current (i d) by the collection efficiency of RRDE (N).
| (11) |
2.2.5. Chronopotentiometry and Chronoamperometry Plots for Assessing Catalyst Stability and Durability
A desirable OER catalyst should exhibit not only high catalytic activity but also long‐term durability and stability. The catalytic stability can be assessed by performing chronopotentiometry or chronoamperometry experiments to monitor the potential change at a constant current or current variation at a fixed potential, respectively.[ 29b , 56 ] A widely reported stability test to monitor the overpotential is keeping the current density at 10 mA cm−2 over 12 hours. The variation of η 10 gives a hint about the stability of the catalyst as well as its activation or deactivation.
A large current density is chosen to inspect catalyst durability for industrial application.[ 42a , 57 ] Spöri et al. reported the stability performances of most active noble‐metal‐based electrocatalysts where the overpotential fluctuation at 1000 mA cm−2 was used as an indicator. [58] As shown in Figure 5, Ru‐based electrocatalysts undergo severe deactivation while Ir‐based catalysts are more stable and hold their high initial catalytic activities. Besides, CV measurements at a higher scan rate are considered to be an accelerated degradation test, whereby up to thousands of CV scans are conducted to check the catalyst durability and monitor the evolution of surface redox species. [29c]
Figure 5.
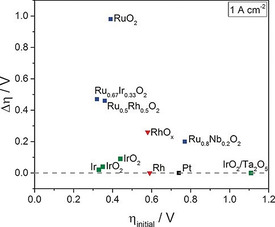
A summary of the catalytic stability of noble‐metal‐based electrocatalysts tested at 1 A cm−2 in proton‐exchange‐membrane water electrolyzer. The overpotential changes (Δη=η final−η initial) indicates activity delay, with the results compiled from the literature. [59] Reproduced with permission from ref. [58] Copyright 2017, Wiley‐VCH Verlag GmbH & Co.
3. Criteria for Electrocatalyst Development
The electrocatalyst should fulfill diverse criteria to be considered for industrial applications: 1) it should be efficient and deliver high current density at lower applied potentials; 2) it should be durable and not show loss of performance; 3) it must be economical to be able to compete with gray H2; 4) it must to be sustainable, ecological, and non‐toxic, 5) it must be based on earth‐abundant elements rather than noble metals that might be depleted within the next century, 6) it must be recyclable, 7) the raw materials used to prepare the catalyst should not have long‐term supply and geopolitical risks. Among others, these key factors should be considered for the design and development of OER catalysts.
There are two general figures of merit strategies to enhance the performance of the OER catalyst from a materials synthesis point of view. The first one is increasing the number of active centers by tuning the structural properties of the catalyst (such as morphology, geometry, dimension, shape, size, and textural parameters of the materials) and the loading on the working electrode. The second one is boosting the intrinsic activity of each active center by tuning intrinsic properties of the materials like the crystal, band, and electronic structures. [28] The combination of these strategies can lead to improved catalytic performances.
It should be kept in mind that for most of the reported electrochemical systems, the active catalytic centers are formed after alteration of the starting catalyst. Simply immersing catalyst material into alkaline electrolyte leads to a change at its surface and further electrochemical measurements can cause crystal and structural transformations as well as element dissolution.[ 21a , 24a ] A good understanding of the alteration of the surface of material helps to reveal the degradation mechanisms and elucidate the activation and deactivation processes in order to develop a more stable catalyst. Therefore, it is crucial to monitor the alteration of a catalyst via in situ, operando, and post characterizations.[ 21c , 24b , 60 ] For instance, a combination of the electrochemical flow cell with an oxygen sensor and an inductively coupled plasma optical emission spectrometry (ICP‐OES) system allows simultaneous analysis of electrocatalyst (de)‐activation, activity, and Faradaic efficiency of the catalyst. [29d] This can be also used to monitor electrochemical deposition of Fe impurities from KOH electrolyte, which has been verified to cause significant activation of Co‐ and Ni‐based catalysts.[ 29a , 29e ]
The electronics, surface structures, binding energy, and interactions between the electrocatalysts and the intermediates govern the overall efficiency of the catalyst. Accordingly, the precise adjustment of crystal and electronic structures of the materials can tune the binding energy and improve the OER performance of the electrocatalysts. [61] For instance, among a range of transition‐metal‐based electrocatalysts, the optimum overpotential could be achieved with the Ni‐doped β‐CoOOH (Figure 6 a), whereby the surface binding energy of intermediate species (ΔG O−ΔG OH and ΔG OH) is not too strong nor too weak. [62] If the binding is weak, reactants are not adsorbed and the reaction is not initiated; on the other hand, if the binding is strong, the reactive sites are blocked by either reactants or products. The adsorption behavior is mainly governed by the surface and electronic structures of the catalyst. [63] A correlation between the intrinsic activity and eg orbital filling of perovskite crystal structures was likewise reported. [64] The eg orbital filling impacts the binding energy and interactions between the oxygen intermediates and the catalyst surface.
Figure 6.
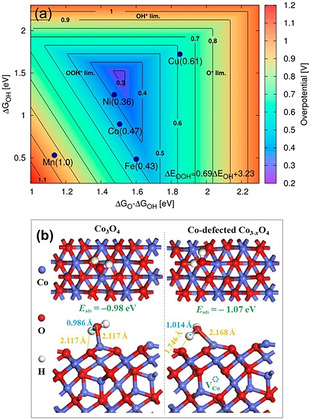
a) Theoretical overpotential plot of doped β‐CoOOH as a function of ΔG OH and ΔG O−ΔG OH. Adapted with permission from ref. [62] Copyright 2013, American Chemical Society. b) Water adsorption on cobalt (111) surface of defect‐free (left) and Co3−x O4 with Co defect sites (right); numbers in blue denote the O−H bond length of adsorbed H2O, numbers in yellow denote bond lengths between adsorbed O and H from water species over Co and O sites of Co3O4. Adapted with permission from ref. [65] Copyright 2018, American Chemical Society.
Among other parameters, defects can play an essential role in the OER performance of the catalysts. Various structural defects, such as zero‐dimensional point defects (vacancy and interstitial), one‐dimensional line defects (dislocation), and two‐dimensional planar defects (grain and phase boundaries), can exist within the structure of electrocatalysts. [66] Among these types of defects, zero‐dimensional point defects in terms of cation and anion vacancies are commonly found in transition metal oxides.[ 65 , 67 ] As seen in Figure 6 b, the Co‐defect sites could draw a hydrogen atom from adsorbed water molecule onto the oxygen site (shorten the H−O bond length from 2.117 Å to 1.746 Å) and decreased the water adsorption energy (−1.07 eV) compared to defect‐free cobalt oxide (−0.98 eV). This favors better water adsorption and H–OH bond cleavage during OER. 59] The oxygen vacancy could also promote OER activity of the oxide electrocatalyst by lowering the adsorption energy of water molecules. Besides, oxygen vacancies could provide more adsorption sites for OH. species and promote the formation of the Co‐OOH. intermediate.[ 67b , 68 ]
The OER performance of the catalysts can be improved by adjusting their structural and physicochemical properties through a suitable synthetic strategy. In general, an OER electrocatalyst should: 1) offer a large surface exposed to reactants, 2) provide reactive sites that can effectively adsorb reactants and have a balanced binding to intermediates, 3) display good electrical conductivity, allowing efficient electron transfer from the reactant to the circuit, 4) have a porous structure for better mass transport. Some of these assets will be elaborated in more in detail in Section 4.
4. Transition Metal Oxide Electrocatalysts
The electrocatalysts consisting of first‐row transition metal oxides show good OER activity even compared to RuO2 and IrO2 in alkaline electrolytes.[ 25 , 64 , 69 ] A range of transition‐metal‐based compounds have been developed for OER, including; 1) oxides (TMOs),[ 6 , 25 ] 2) (oxy)hydroxides, [70] and 3) MX compounds and alloys (M=transition metals, X=non‐metals or metalloids). [71] Some of the non‐oxide electrocatalysts like Co2B, Ni3FeN, and Co1−x Ni x P3 displayed stimulating OER activity, with reported overpotentials from 200 to 300 mV at 10 mA cm−2. [72] But, the preparation of MX compounds is costly and they are also not very stable. MX compounds and alloys can be considered as precatalysts to form active (oxy)hydroxides sites in alkaline electrolytes. [71]
Transition‐metal‐based (oxy)hydroxides have proven so far to be the most active OER electrocatalysts.[ 70a , 73 ] In particular, NiFe‐based (oxy)hydroxides are reported to show the lowest OER overpotential in alkaline electrolytes. [70a] For instance, Gong et al. reported an overpotential of ≈230 mV to reach 10 mA cm−2 over Ni‐Fe (oxy)hydroxides. [74] More complex (oxy)hydroxides have been also designed as very active OER catalysts. For instance, Fe and W co‐doped cobalt oxyhydroxides were reported to have near‐optimal OH adsorption energies. [75] A gelled FeCoW oxyhydroxide was reported to deliver a record‐low overpotential of 191 mV at 10 mA cm−2. Although these (oxy)hydroxides are very active OER catalysts, [76] they are commonly not stable under “real‐world” electrolysis conditions. Most of them are reported to maintain high activity for a short time at a small current density such as 10 mA cm−2. [42a] On the other hand, practical water electrolysis requires stable electrode catalysts that can work for a longer time with large delivered current densities (e.g., 1000 mA cm−2). [77]
TMOs have been used as electrode materials since the beginning of the last century [78] because they meet the requirements in terms of catalytic activity and stability, structural durability, elemental abundance, and low production cost for the practical operation of commercial water electrolysis.[ 6 , 79 ] Among TMOs, perovskites with the general formula of ABO3, where A is commonly a rare‐earth or alkaline‐earth metal, and B is a transition metal, have been widely studied as remarkable catalyst materials due to their highly tunable metal compositions, unique electronic structures, and robust stability in alkaline solutions. [80] One specific perovskite, Ba0.5Sr0.5Co0.8Fe0.2O3−δ (BSCF), has drawn special interest since Shao‐Horn et al. reported the volcano plot of OER activity against eg orbital filling. [64] In such a plot, BSCF perovskite is located at the summit with an optimal eg orbital filling that is strongly related to the binding energies of the surface oxygen. As for drawbacks, the oxides require very high temperatures to be crystallized in the perovskite structure, which translates to a high energy demand. [81] Besides, it is challenging to prepare high‐surface‐area perovskites by conventional synthetic protocols since particles sinter at high temperatures. [82]
Other than perovskites, several oxides and spinels based on first‐row transition metals such as Mn, Fe, Co, Ni, and Cu have been frequently studied as OER catalysts.[ 11 , 29a , 29c , 83 ] Of these, Fe‐, Co‐, and Ni‐based oxides have received more attention. Table 1 presents a summary of the catalytic performances of state‐of‐the‐art Fe‐, Co‐, and Ni‐based OER electrocatalysts. For most of the reported oxide catalysts, still, a significant overpotential is required to achieve a current density of 10 mA cm−2 in 1 M KOH electrolyte. Thus, there is a need for the design and development of more effective electrocatalysts. For this, it is essential to establish a solid structure–activity correlation from a holistic perspective and monitor the electrocatalyst under operating conditions to gain some insight into the catalyst alteration, reaction intermediates, and catalytically active centers as well as the reaction mechanism. Some specific examples and recent progress in Co, Ni, and Fe oxides as OER catalysts are discussed in following sections.
Table 1.
Performance of state‐of‐the‐art OER electrocatalysts, based on Co, Ni, Fe, and mixed oxides.
|
Catalyst |
Electrolyte |
Loading [mg cm−2] |
Substrate[a] |
Overpotential [mV] |
Tafel slope [mv dec−1] |
Ref. |
|---|---|---|---|---|---|---|
|
Commercial samples: |
|
|
|
|
|
|
|
Co3O4 (<50 nm) |
1 M NaOH |
0.8 |
GCE |
500 |
61 |
|
|
NiO (<50 nm) |
1 M NaOH |
0.8 |
GCE |
430 |
62 |
|
|
Fe2O3 (<5 μm) |
1 M NaOH |
0.8 |
GCE |
1230 |
– |
|
|
NiCoO2 (<150 nm) |
1 M NaOH |
0.8 |
GCE |
390 |
53 |
|
|
NiFe2O4 (30 nm) |
1 M NaOH |
0.8 |
GCE |
510 |
– |
|
|
CoFe2O4 |
1 M KOH |
0.15 |
GCE |
416 |
≈95 |
|
|
|
|
|
|
|
|
|
|
Co3O4, NiO, Fe2O3, and mixed oxide electrocatalysts: | ||||||
|
Co3O4 NPs (5.9 nm) |
1 M KOH |
1 |
NF |
328 |
– |
|
|
Co3O4 NPs (21.1 nm) |
1 M KOH |
1 |
NF |
363 |
– |
|
|
Spent tea leaves templated Co3O4 NPs |
1 M KOH |
0.025 |
GCE |
401 |
53 |
|
|
Co3O4 NCs@CoO (<50 nm) |
0.5 M KOH |
|
GCE |
430 |
89 |
|
|
OM Co3O4 |
1 M KOH |
0.12 |
GCE |
389 |
56 |
|
|
NiO NPs (16 nm)/CNT |
0.5 M KOH |
– |
GCE |
409 |
≈120 |
|
|
NiO NPs (16 nm) |
0.5 M KOH |
1.25 |
FTO |
501 |
– |
|
|
NiO NWs |
0.5 M KOH |
1.25 |
FTO |
363 |
– |
|
|
NiO NS arrays |
0.1 M KOH |
– |
CFP |
422 |
– |
|
|
N+ ion irradiated NiO NS arrays |
0.1 M KOH |
– |
CFP |
410 |
136 |
|
|
OM NiO |
1 M KOH |
0.12 |
GCE |
414 |
57 |
|
|
Thin‐film NiO |
0.1 M KOH |
– |
Gold |
≈480 |
≈55 |
|
|
Thin‐film Ni0.8Fe0.2O x |
0.1 M KOH |
– |
Gold |
≈300 |
≈40 |
|
|
Thin‐film Ni0.6Fe0.4O x |
0.1 M KOH |
– |
Gold |
≈280 |
≈37 |
|
|
Thin‐film Fe2O3 |
0.1 M KOH |
– |
Gold |
≈530 |
≈55 |
|
|
Fe2O3‐(012) NCs (90 nm) |
1 M NaOH |
0.15 |
NF |
317 |
59 |
|
|
Fe2O3 NPs (100–200 nm) |
1 M NaOH |
– |
FTO |
500 |
– |
|
|
Co‐Fe2O3 NPs (100–200 nm) |
1 M NaOH |
– |
FTO |
340 |
– |
|
|
Ni‐Fe2O3 NPs (100–200 nm) |
1 M NaOH |
– |
FTO |
370 |
– |
|
|
OM Ni x Co y O4 |
1 M KOH |
0.12 |
GCE |
382 |
54 |
|
|
Activated OM Ni x Co y O4 |
1 M KOH |
0.12 |
GCE |
336 |
36 |
|
|
Ni‐Fe NPs |
I M KOH |
2.5 |
NF |
210 |
53 |
|
|
NF‐AC‐NiO x ‐Fe |
1 M KOH |
0.014 |
NF |
245 |
34 |
|
|
NiFe‐OH |
1 M KOH |
1 |
NF |
219 |
56 |
|
|
Ni‐Fe‐OH/Ni3S2 |
1 M KOH |
– |
NF |
268 |
54 |
|
|
Ni(Fe)OOH‐FeS x |
1 M KOH |
– |
NF |
220 |
55 |
|
|
Ni(Fe)OOH |
1 M KOH |
– |
NF |
300 |
59 |
|
|
NiFe/Co9S8 |
1 M KOH |
– |
CC |
219 |
55 |
|
|
CoNiFeO |
1 M KOH |
1.9 |
NF |
230 |
40.7 |
|
|
|
|
|
|
|
|
|
|
LDH electrocatalysts: | ||||||
|
NiCo‐LDH |
1 M KOH |
0.07 |
GCE |
334 |
41 |
|
|
NiFe‐LDH |
1 M KOH |
0.07 |
GCE |
302 |
40 |
|
|
NiFe‐LDH |
1 M KOH |
– |
NF |
210 |
34 |
|
|
NiFeCP‐LDH |
1 M KOH |
– |
NF |
188 |
29 |
|
|
CoNiFe LDH |
1 M KOH |
– |
GCE |
278 |
54.2 |
|
[a] NP: nanoparticle, NS: nanosheet, OM: ordered mesoporous, NW: nanowire; Abbreviations for electrodes: GCE: glassy carbon electrode, NF: nickel foam, CFP: carbon fiber paper, CC: carbon cloth, FTO: fluorine‐doped tin oxide on glass.
4.1. Cobalt Oxide Based Electrocatalysts
Since the beginning of the last century, cobalt oxides have been in the focus as catalysts for OER. [84] The electrochemical behavior of cobalt oxide films was intensively studied in the 1980s. [85] In 2008, the Nocera group reported the stimulating catalytic performance and stability of cobalt phosphate (CoPi) in phosphate buffer. [13] Among the cobalt compounds, cobalt oxides have received the most attention due to their activity and durability in alkaline electrolytes.
Cobalt oxide has two common crystal structures, namely CoO and Co3O4. CoO possesses a rock salt structure and consists of two interpenetrating fcc sublattices of Co2+and O2−, while Co3O4 has a typical spinel structure in which tetrahedral and octahedral sites are occupied by Co2+ and Co3+ cations, respectively. These sites can be substituted with a variety of transition metal cations, which influence the electronic structure and catalytic performance. [86] Our research group has been working on the design of well‐defined mesoporous cobalt oxides via the nanocasting method [87] and we have used them as a toolbox to find a structure–activity correlation as well as to explore the role of the key properties for the development of more effective OER catalysts.[ 4 , 56 , 88 ] Our early studies verified the importance of dimension, geometry, symmetry, morphology, particle size, and surface area of Co3O4 on its OER performance.[ 30 , 88a ]
Although Co3O4 is resistant to alkaline solutions, its structural alteration and surface amorphization are commonly observed under electrochemical operating conditions. [89] Dau and Strasser observed a structurally reversible alteration of Co3O4 spinel nanoparticles by using in situ X‐ray techniques including grazing‐induced XRD and EXAFS. [90] XRD patterns collected at different potentials demonstrated that the catalyst film retained spinel structure under applied potentials. An in‐depth analysis based on the broadening of Co3O4 reflections illustrated changes in the mean structural coherence length of the crystallites. The initial irreversible growth of Co3O4 crystallites occurred under potentials up to 1.2 V, which is likely due to Ostwald ripening and/or coalescence of the particles.[ 90 , 91 ] Increasing the potential further to 1.62 V resulted in a reversible structural transformation with a lower degree of crystallinity. This structural transformation was attributed to the formation of a CoOx(OH) y shell on the Co3O4 crystallites. Furthermore, the local atomic structure of Co ions was revealed by Fourier‐transformed EXAFS over the same potential. By investigating the modification of the Co oxidation state as well as coordination numbers during OER, the reversible formation of amorphous CoOx(OH) y shell on crystalline Co3O4 core could be confirmed. The Co3O4 phase provides a stable crystalline structure in the resting state, while the reversible surface CoOx(OH) y phase affords active sites for OER.
The OER mechanism in CoOOH was recently further postulated experimentally by using operando XAS and Raman spectroscopy (Figure 7 a–c). [24b] An additional isotope‐labeling experiment was performed to probe lattice oxygen and active oxygen species exchange within the KOH electrolyte. First, the CoOOH was conditioned at 1.75 V in 0.1 M 18O‐KOH electrolyte. The dominating resting state was found to be a CoIV species originating from CoO2. Afterwards the electrolyte was exchanged with 16O‐KOH and a blueshift was observed for the A1g and Eg Raman bands (peaks at around 470 and 580 cm−1, respectively) as well as for the OO− peak (located around 1050 cm−1); this indicates the exchange of lattice oxygen and OO− with oxygen species from electrolyte (Figure 7 a). Another experiment with 0.1 M KOD electrolyte led to a 10 cm−1 redshift of the A1g peak in comparison with measurements in normal KOH. This confirms the possible exchange of the OH group with OD in the electrolyte or a hydrogen‐bonding interaction with Co‐O moieties (Figure 7 b). On the other hand, no change in OO− peak position was observed, pointing out that the equivalent mechanism does not occur at superoxide (OO−) moieties. The mechanism of OER by surface cobalt oxyhydroxide is foreseen to involve the combination of two lattice oxygen atoms to produce the Co‐superoxide intermediate and the release of dioxygen from the Co‐superoxide as the rate‐determining step (Figure 7 c). [24b] The formation of CoIV species as an intermediate on the surface of cobalt oxide has been also confirmed by an in situ electron paramagnetic resonance (EPR) study, whereby CoII EPR signal was converted into a CoIV signal at higher electrode potential. [92]
Figure 7.
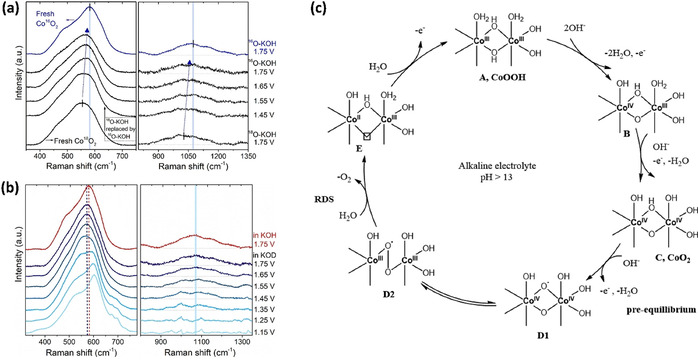
a) Electrochemical in situ surface‐enhanced Raman spectra (SERS) of isotope‐labeled Co18O2 in 0.1 M purified 16O‐KOH after conditioning in 18O‐KOH. b) In situ SERS of Co16OOH in 0.1 M Fe‐free isotope‐labeled purified KOD. c) Proposed OER mechanism on cobalt oxyhydroxide. Adapted with permission from ref. [24b] Copyright 2020, American Chemical Society.
Co3O4 spinel has the advantage that it can incorporate other di‐ and trivalent cations, thus the intrinsic properties can be easily adjusted. The integration of a second metal such as Mg, Ni, Fe, and Cu has been shown to improve the OER activity of Co3O4.[ 4 , 88b , 93 ] To investigate the effect of Fe doping and incorporation, we utilized ordered mesoporous silica templates (SBA‐15 and KIT‐6) to prepare well‐defined Co‐Fe and Co‐Ni oxides as the model electrocatalyst. A small amount of iron incorporation (Co:Fe atomic ratio of 32:1) was found to alter the pore structure of the sample with a more open pore structure (Figure 8 a) compared to the long‐range‐order nanowires of pristine Co3O4. Magnification on the A1g Raman band (Figure 8 b) corresponding to the symmetric Co3+–O stretch of the octahedral sites showed a clear shift, indicating a distortion in octahedral sites and alteration of the electronic structure upon Fe incorporation. [94]
Figure 8.
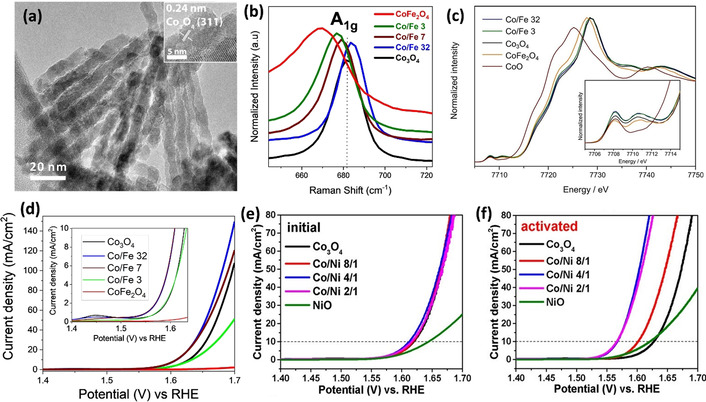
a) Morphology of mixed cobalt iron oxide (Co/Fe 32) templated on SBA‐15 silica. b) Co Kβ‐detected HERFD XAS spectra of sample series. c) A1g Raman band and d) LSV curve of SBA‐15 templated cobalt iron oxide series; inset: magnification at 10 mA cm−2. Adapted with permission from ref. [83a] Copyright 2020, American Chemical Society. e) Initial LSV curve of mesostructured cobalt nickel sample series and f) LSV curves after 150 CV scans. Adapted with permission from ref. [29a] Copyright 2017, American Chemical Society.
This finding was further supported by X‐ray absorption spectroscopy (XAS) which revealed the increasing ratio of Co in tetrahedral and octahedral sites as well as distortion in the crystalline lattice (Figure 8 c). The alteration of the electronic structure and the increase of Co in tetrahedral sites was found to enhance the formation of μ‐OOH moieties and improve the OER activity with a very small amount of incorporated iron [95] (Figure 8 d). Further increase of Fe content is unfavorable for the OER due to the formation of the cobalt ferrite spinel phase with low conductivity and poorer charge transfer ability. [12] All in all, the incorporation of Fe tunes the intrinsic properties of cobalt oxide by altering the crystal and electronic structures and overall OER performance depending on the loading amount.[ 83a , 88b ]
A similar concept can be used to investigate the effect of Ni incorporation into cobalt oxide spinel and to optimize the electrocatalyst composition. [29a] As shown in Figure 8 e,f, Ni‐containing cobalt oxide samples show different OER activities after an activation process due to the uptake of iron impurities from KOH electrolytes.
In an analogous line of research, Liu et al. prepared three cobalt oxides which incorporated Mg2+, Cr3+, and Ti4+ through the formation of MgCo2O4, CoCr2O4, and Co2TiO4 in order to study the role of different catalytic sites. The catalytically non‐active Mg2+, Cr3+, and Ti4+ ions occupy Td, Oh, and Td centers, respectively. [96] Therefore, only Co3+ at the octahedral sites (Co3+ Oh), Co2+ at the tetrahedral sites (Co2+ Td), and Co2+ at the octahedral sites (Co2+ Oh) were present as active sites for OER. The electrochemical measurements found out that substitution of Co2+ or Co3+ by an inactive element decreased the OER activity relative to pristine Co3O4. The following sequence for OER activity is obtained: Co3O4 > MgCo2O4 > Co2TiO4 > CoCr2O4, illustrating that the geometrical configuration Co3+ Oh is more optimal than Co2+ Td and Co2+ Oh. The calculated Gibbs free energy diagram showed a sequence of Co3O4 < MgCo2O4 < Co2TiO4 < CoCr2O4, matching well with the OER results. The combination of Co3+ Oh and Co2+ Td was found to promote the formation of *OOH, leading to superior OER activity due to the lowest energy barrier. Besides the surface energy, spin state and eg orbital play also essential roles for the OER activity.[ 95 , 97 ]
Apart from its crystalline phase counterparts, amorphous cobalt oxide has gained a lot of interest in recent years due to its easy preparation as well as ability to adsorb Fe impurities from the electrolyte. [21a] It has been shown that CoOOH can take up Fe impurities from KOH electrolyte and form highly conductive and OER‐active Co1−x Fe x (OOH). [12] The co‐existence of Fe3+ and CoO x creates a synergetic effect and decreases the overpotential at 10 mA cm−2 up to 69 mV. [98] XAS measurements confirmed the decrease in the coordination number of Fe and the formation of oxygen vacancies that boost the OER activity. Going along a similar direction, our group has developed a facile method to produce highly active amorphous cobalt‐based electrocatalyst starting from cobalt(II) nitrate that can be converted to Co‐oxyhydroxide during OER. [29c]
Although cobalt oxide is a decent OER catalyst it suffers from its low conductivity. Its conductivity can be improved by merging with more conductive materials like graphitic carbon, [99] gold, [100] and silver. [101] Recently, we have shown the dual functions of Ag species when they are coupled with mesoporous cobalt oxide. [101] Ag can be merged into the 3D mesostructure during the hard templating process in the form of metallic Ag and ultrasmall Ag2O nanoparticles. While metallic Ag increased the conductivity of the composite, silver oxide moieties led to increased Fe uptake from KOH electrolyte and resulted in a significant activation and a twofold increment of current density at 1.7 V.
The surface area, crystal structure, and electronic structure and consequently the OER performance of cobalt oxides can be also tuned via post‐treatment methods. Liu et al. [102] reported that heterophase Co3O4/CoO nanosheets prepared via Ar‐plasma etching on Co3O4 could decrease the overpotential up to 92 mV. DFT calculations revealed that the phase transformation of Co3O4 spinel into the CoO rocksalt phase is followed by lattice Co diffusion which causes oxygen vacancy. The lower p‐state orbital energy of adsorbed O species on the Co3f site of Co3O4/CoO was proved to decrease the adsorption energy of reactive oxygen species on the catalyst's active sites. Similarly, our group reported the effect of post‐treatment on mesostructured Co3O4 and CoO via pulsed laser fragmentation in liquid. [67a] The laser fragmentation results in the formation of a Co3O4/CoO biphase as well as the reduction of the nanoparticle size to less than 5 nm, which led to a threefold increase of BET surface area. Rietveld refinement of high‐resolution XRD pattern and surface chemical state investigation revealed the formation of Co vacancies in tetrahedral sites and the oxygen vacancies. These vacancies were found to be beneficial to boost OER activity by decreasing charge transfer resistance.
As an alternative practical post‐treatment method, we have recently established a facile selective acid leaching method to tune textural parameters of Co3O4. [56] Compared to the aforementioned post‐treatment methods, selective acid leaching does not require a complicated and expensive setup, and hence it is more favorable for large‐scale synthesis. The process was carried out by utilizing Mo, Li, Ca, or Mg as a sacrificial agent during the synthesis, which was leached out via the post‐selective acid leaching process. The BET surface area of the post‐treated Co3O4 could increase up to threefold, as a result, more active sites could be exposed and this favors fast OER reaction kinetic. In this way, the current density at 1.7 V vs. RHE of the OER catalyst could be increased from 70 mA cm−2 to 123 mA cm−2.
It should be kept in mind that regardless of the crystal structure and crystallinity of cobalt oxide, its dynamic behavior in the water environment and electrolyte must always be considered. A recent study by Hein et al. [24a] utilizing near‐ambient‐pressure X‐ray photoelectron spectroscopy (NAP‐XPS) showed that simple immersion in water could induce reversible phase transformation from tetrahedrally coordinated Co2+ shell and octahedrally coordinated Co2+ core to the octahedrally coordinated Co2+ and partially oxidized octahedrally coordinated Co3+. Thus, in most cases, the starting material possibly goes through an alteration in the electrolyte even without an applied external bias.
4.2. Nickel Oxide Based Electrocatalysts
Ni is more attractive than Co for real application since it is more abundant, cheaper, and less toxic, and has fewer geopolitical risks.[ 22 , 103 , 105 ] In terms of catalytic OER performance, Ni is as active as Co at a lower potential range based on the η 10 values listed in Table 1. However, pristine NiO has an inferior conductivity and this limits its performance in the high voltage range, where a large number of electrons are required to be transferred into an external circuit. To overcome the conductivity issue, nickel oxide is widely combined with other transition metals like Co and Fe. For instance, Ni‐Fe‐based oxides have been reported to among the most active for alkaline water electrolysis.[ 22 , 106 ] The catalytic performances of Ni‐Fe oxides strongly depend on the specific metal stoichiometry and preparation method. [106c]
NiO has the rock salt structure (as CoO) with octahedral Ni2+ and O2− sites and is very sensitive to phase transformation. During OER in alkaline electrolytes, NiO is easily transformed into the layered hydroxide/oxyhydroxide phase as shown in Figure 9 a. [103] A narrow anodic and broad cathodic peak observed in CV curves are ascribed to the NiO/NiOOH redox couple of NiO. Initially, stable activity was achieved within a few cycles, as depicted as curve “a” in Figure 9 a. When an external voltage was applied, the initial OER activity of NiO was significantly increased (curve “b” in Figure 9 a), which was preliminarily associated with surface amorphization and phase transformation of NiO to Ni(OH)2. [107]
Figure 9.
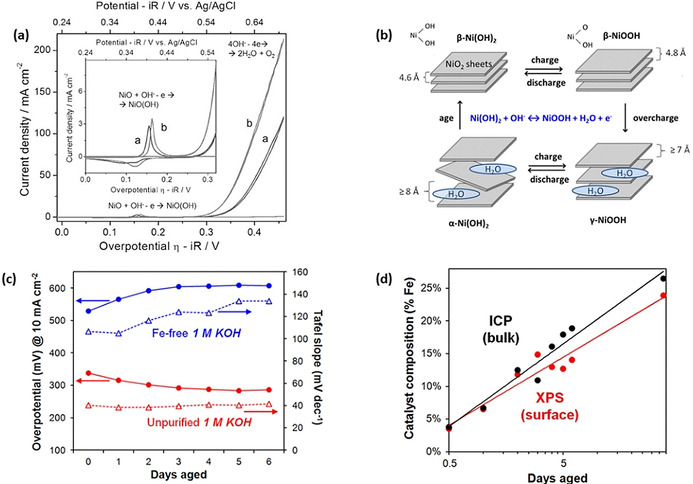
a) CV curves of NiO nanoparticles deposited on a gold‐coated electrode. The CV curves were collected in 0.5 M KOH before and after electrochemical aging and are labeled “a” and “b”. Reproduced with permission from ref. [103] Copyright 2014, Wiley‐VCH Verlag GmbH & Co. b) Illustration of the Bode scheme for the phase transformation on Ni(OH)2. c) Aging effect on the OER activity of Ni(OH)2 thin films in Fe‐free (blue) and unpurified (red) KOH electrolyte. d) Change of iron amount in Ni(OH)2 thin films after aging in unpurified KOH. Reproduced with permission from ref. [104] Copyright 2015, American Chemical Society.
The activation of nickel‐based oxide catalysts has been in the focus of the scientific community for a long while and different reasons have been given in reported studies: 1) due to the structural transformation of nickel oxide into a more active oxyhydroxide species during applying anodic potential;[ 106a , 108 ] 2) because trace amount of Fe impurities originating from commonly used KOH electrolyte can form highly active Ni‐Fe oxyhydroxide.[ 106b , 109 ] The phase transformation of Ni catalyst was studied by Bode et al. [110] by monitoring the electrocatalyst by several techniques including X‐ray and neutron diffraction (Figure 9 b). Briefly, immersing nickel oxide in alkaline electrolyte turns it into a hydrous α‐Ni(OH)2 phase. Upon aging in alkaline solution, the α‐Ni(OH)2 phase is further transformed into the anhydrous β‐Ni(OH)2 phase. Applying positive potential causes the oxidation of these hydroxide phases to form γ‐NiOOH and β‐NiOOH. Long‐term overcharging at high potential converts β‐NiOOH to γ‐NiOOH phase. The metal sites in a high oxidation state are proposed to be beneficial for OER, making either Ni3+ in β‐NiOOH or Ni3+ in γ‐NiOOH an active site, which is a subject of controversy. It has been also reported that nickel was first oxidized into γ‐NiOOH followed by a reversible electrochemical formation of Ni4+ peroxide (NiOO2), which was proposed to provide active sites for high OER activity. [111]
Metallic Ni foam is commonly used as the substrate of the working electrode as well as an active OER catalyst. [112] Dipping Ni foam into alkaline electrolyte forms an OER‐active nickel oxyhydroxide species. The phase transformation of metallic Ni electrode to γ‐NiOOH under bias could be confirmed by in situ Raman spectroscopy. [108] Potential cycling transformed γ‐NiOOH to β‐NiOOH and this newly formed β‐NiOOH was found to be three times more active than γ‐NiOOH. However, later on, it was reported that the experiments were conducted in unpurified KOH electrolytes, which contain Fe impurities from industrial production. [104] When the same experiments were conducted in purified Fe‐free electrolyte, significantly increased values of η 10 and the Tafel slope was obtained as shown in Figure 9 c. On the other hand, a Ni‐hydroxide catalyst was activated in commercial KOH with Fe impurities and gradually reached a stable activity after 4 days of applied potential (Figure 9 c). The layered structure of Ni‐hydroxide efficiently absorbed Fe impurities from unpurified KOH solution and up to 20 at. % Fe could be incorporated into the catalyst, which could be experimentally confirmed by XPS and ICP analyses (Figure 9 d). This indicates that the electrochemical aging‐induced activation of Ni‐based catalyst is not due to the phase transformation, but rather related to the uptake of Fe impurities from the electrolyte. This kind of Fe‐induced activation was also observed on mixed Ni‐Co oxide electrocatalysts. [29a]
The OER activity of Ni‐based oxides might be further enhanced by increasing the number of their active cites by coupling with other transition metals and/or supporting conductive support. For instance, the electrochemical surface area of NiO could be doubled via self‐assembly of Cu‐Ni bimetal oxide grown on Ni foam (NF). In addition, the synergetic effect between Cu and Ni improved activity and stability as compared to the single NiO/NF electrode. [113] Similarly, it has been shown that Mo could also promote the OER activity when combined with Ni‐based oxide catalyst. [42a] An in‐depth XPS study revealed that Mo5+ species in NiMoO4−x /MoO2 play an important role by delocalizing the oxygen vacancies and promote the adsorption of water molecules onto the low‐coordinated Mo5+ centers. Similarly, a W‐doped α‐Ni(OH)2 electrocatalyst was reported with high efficiency and an overpotential of 237 mV at 10 mA cm−2 and low Tafel slope of 33 mV dec−1 in 1 M KOH electrolyte. [114] The presence of the low‐spin d0 orbital of W6+ was stated to be the key factor to stabilize the O radical, resulting in an optimal OH− adsorption on the exposed W sites of the Ni(OH)2.
The activity of Ni oxide has been demonstrated to be further increased when it is supported on a substrate. For instance, Bell et al. observed that a sub‐monolayer of Ni oxide deposited on Au showed an order of magnitude higher turnover frequency compared to its nickel oxyhydroxide counterparts. [108] Their in situ Raman study revealed that charge transfer from the oxide to the highly electronegative Au leads to the formation of Ni/Au surface oxide, which was found to be responsible for OER activity enhancement. Likewise, anchoring nickel oxide into polymer‐based carbon nitride was reported to give a similar effect. [115] NiO and carbon nitride linked through Ni−N bonding was found to enhance the conductivity as well as possess a low Gibbs energy for the adsorptions of OER intermediates, resulting in a low overpotential of 261 mV at 10 mA cm−2. A similar synergy was also observed for the NiCeO x ‐Au system where an overpotential of 279 mV at a current density of 10 mA cm−2 was reported. [105a] The cerium dopant was proven to alter the local electronic structure, resulting in favorable binding energies of the OER intermediates.
Recently, Strasser et al. unraveled the Mars‐van‐Kravelen mechanism for OER over Ni(OH)2 and NiFe layered double hydroxide (LDH) electrocatalysts through continuous substitution of oxygen species of catalyst with the species from electrolyte. [117] This finding on lattice oxygen contribution is in agreement with the OER mechanism over CoOOH catalyst as proposed by Hu et al. [24b] The mechanism on the metal species, however, seems to be different since a large proportion of Ni metal centers in the NiFe LDH catalyst remain in the +2 oxidation state under the potential bias instead of being oxidized to +4 as in cobalt counterpart.
Even though the pure Ni‐based OER electrocatalyst often suffers from bad electrical conductivity, these problems could be resolved by controlling the structural transformation of the starting material into the active Ni oxyhydroxide intermediate or blending them with other hetero elements. [116] Due to their adsorption capability toward Fe species, the OER activity of Ni‐based oxides could be boosted by coupling with iron by forming dynamic active sites. All in all, NiFe‐based oxides are still considered to be promising candidates for use in large‐scale water electrolyzers.
4.3. Iron Oxide Based Electrocatalysts
Fe‐based catalysts are very attractive in thermal catalysis because of the abundance of Fe (second most earth‐abundant metal) and some fascinating chemical properties (e.g., various oxidation states, non‐toxicity, and its magnetic property). Among different forms of iron oxide, hematite (α‐Fe2O3) which crystallizes in a corundum structure with Fe3+ in octahedral sites, has been in the focus for photo‐electrochemical water splitting due to its good light absorption. However, its application as a pristine electrocatalyst is severely hindered due to its high resistance which results in very low OER activity (Table 1).
Wu et al. investigated the relationship between the exposed facets and catalytic activity of α‐Fe2O3 and concluded that the OER activity is mainly governed by the predominant facets. [118] As shown in Figure 10 a, among α‐Fe2O3 with diverse facets, the one with high‐index exposed facets of (012) shows decent activity. The catalytic stability was not much influenced by the exposed facets, illustrating the good durability of α‐Fe2O3 in the alkaline solution (Figure 10 b). As seen in Figure 10 c, a lower energy barrier of each step reaction was shown on the high‐index facet (012) based on the DFT calculations, which was found to be favorable for the adsorption and desorption of oxygenated intermediates. [118]
Figure 10.
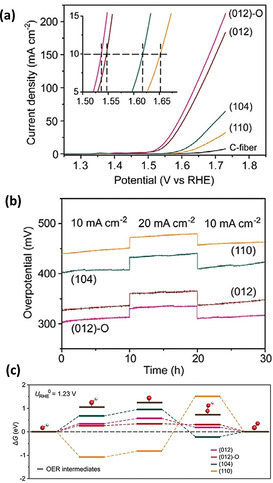
a) LSV curves and b) chronopotentiometry measurements for (012)‐O, (012), (104), and (110) facets exposed on α‐Fe2O3. c) Free energy diagram of OER intermediates. Adapted with permission from ref. [118] Copyright 2018, Wiley‐VCH Verlag GmbH & Co.
Instead of being used as a pristine oxide electrocatalyst, Fe is commonly combined with other transition metals, especially with Co and Ni.[ 29b , 119 ] Our recent study demonstrated the usage of hard templating to prepare Fe2O3 and NiO, and optimize the composition of Fe‐Ni mixed oxides for OER. [83a] A nice synergy between Fe and Ni has been observed, whereby the highest OER could be achieved with the Ni/Fe ratio of 32:1. EIS as well as electrochemical surface area analysis revealed that at this stoichiometric ratio, the lowest charge transfer resistance and the highest intrinsic activity were reached. The Ni32Fe oxide catalyst deposited on Ni foam reached a geometrical current density of over 600 mA cm−2 at 1.7 V vs. RHE with long‐term stability. This value is close to the required current density for a large‐scale water electrolyzer. Suryanto et al. [119] recently reported the role of the interface between Ni metal and γ‐Fe2O3. LSV measurements revealed that the Ni metal domain interconnected to γ‐Fe2O3 has superior OER activity (with overpotential as low as 210 mV at 10 mA cm−2) compared to that of bare Ni as well as several benchmark catalysts. An analogous finding was reported by Song et al. with nanoclusters of γ‐FeOOH covalently linked to a γ‐NiOOH support electrocatalyst. [120] Based on DFT calculations, Fe species were found to act as oxygen‐evolving sites while hydrogen was bonded at the neighboring O site of γ‐NiOOH. These examples indicate the impact of grain boundaries on the formation of new active centers for OER.
Among mixed electrocatalysts, Ni‐Fe layered double‐hydroxide (LDH) catalysts have been investigated intensively due to their high OER activities.[ 109b , 121 ] Trotochaud et al. conducted a systematic characterization of the Ni1−x Fe x LDH catalysts containing various amounts of Fe. [109b] Intentional addition of Fe during the synthesis as well as the Fe impurities present in the KOH electrolyte were found to increase OER activity dramatically. The addition of Fe increases the electrical conductivity of NiOOH by a factor of 30 and the reaction intermediates are found to bond with oxidized Fe sites much easier than with Ni sites in the form of oxo ligands. Additionally, the stability of the metal‐oxo complexes decreases with the addition of d electrons to π* orbitals. [122] Thus, Fe with a high oxidation state has been widely accepted as the determinative factor for the activity enhancement. A series of in situ techniques like XAS and Mössbauer were thus applied and discovered the presence of Fe4+ in Ni‐Fe LDH.[ 122 , 123 ] Application of anodic voltage induced the formation of Fe4+ with its signature spin‐flip excited singlet to triplet emission. [122]
This observation could be further supported by an in situ Mössbauer spectroscopy study. At the beginning in the absence of applied voltage, high‐spin Fe3+ species were detected with an isomer shift of δ≈0.34 mm s−1 and a quadrupole splitting of Δ≈0.46 mm s−1. [123] When a voltage of 1.76 V was applied, a shoulder appeared in the Mössbauer spectra, which is ascribed to the oxidation of Fe3+ to Fe4+. After OER and when the electrode was kept at the open circuit for a while, the shoulder disappeared, indicating that the oxidation of Fe3+ to Fe4+ is a reversible process for Ni‐Fe LDH. It is believed that the formation of Fe4+ is due to the stabilization effect of the LDH host lattice. The Fe4+ species, especially those located at the edges, corners, and defects, are assumed to be the catalytically active sites for OER.[ 70a , 122 , 123 ] Furthermore, Markovic's group found that Fe active species are dynamically stable as a result of dissolution and re‐deposition at the electrolyte/host interface. [21a] The strong interaction of Fe with the host is the key to control the average number of Fe active sites present at the solid/liquid interface for an efficient OER catalyst.
Supporting that hypothesis, Hu's group studied the OER mechanism on Ni‐Fe LDH and FeOOH‐NiOOH catalyst by using 18O isotopic labeling, operando Raman spectroscopy, and electrokinetic analysis (Figure 11 a,b). [124] Superficial γ‐FeOOH was detected only in the FeOOH‐NiOOH system by Raman spectroscopy; γ‐FeOOH is reported to be favorable to boost the OER activity of FeOOH‐NiOOH compared to Ni‐Fe LDH with Fe doped in lattice.[ 124 , 125 ] 18O isotopic labeling coupled with operando Raman assisted to formulate the reaction mechanism. In the initial stage of OER over FeOOH‐NiOOH, dimeric NiII species at the dioxo bridge were oxidized into dimeric NiIII. The OER mechanism in FeOOH‐NiOOH then proceeded in a bifunctional fashion, whereby OH− bond cleavage was followed by oxygen evolution and hydrogen adsorption to NiIII‐O species as the rate‐determining step. This is in agreement with the previous reaction mechanism predicted based on DFT calculations. [120]
Figure 11.
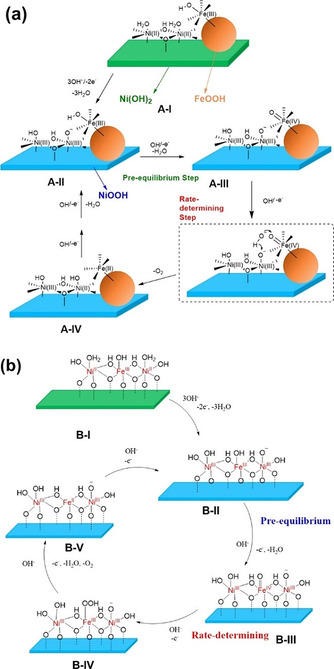
Proposed OER reaction mechanisms of a) FeOOH‐NiOOH; Fe ion is located on the surface of the γ‐FeOOH cluster and the rate‐determining step is OH− attack on Fe=O and H atom transfer to a NiIII‐O site. b) NiFe LDH, Fe is doped in the lattice of Ni LDH, with the rate‐determining step OH− attack on Fe=O. Reprinted with permission from ref. [124] Copyright 2021, Wiley‐VCH Verlag GmbH & Co.
On the other hand, OER on Ni‐Fe LDH follows a different reaction pathway (Figure 11 b). The OER on Ni‐FE LDH was initiated by oxidation of FeIII into FeIV accompanied by Fe=O bond formation in the pre‐equilibrium step. The whole reaction is followed by the conventional four‐electron transfer mechanism, where the reaction is governed by the formation of FeIII‐OOH intermediate from OH− attack on the Fe=O unit as the rate‐determining step.[ 25 , 126 ]
Finally, despite the low electrical conductivity of pristine Fe oxide, the properties of Fe‐based electrocatalysts could be tailored via doping or by combination with Ni, Co, or other metals. The formation of Ni‐Fe oxide interface or Fe species supported on nickel oxide remarkably enhances the OER activity by initiating the new active sites and unconventional reaction pathways. Nevertheless, the nature of Fe dissolution and corrosion as well as the impurity of the electrolyte should be taken into account in developing a robust Fe oxide‐based catalyst for water electrolysis.
5. Summary and Perspective
Sustainable energy production and usage are going to be the key features for achieving climate‐neutrality and suppressing global warming. Although solar and wind energy have huge potential as renewable energy sources, only around 5 % of the world's current electricity is produced from these sources. [127] This amount has to be significantly increased. We need to develop effective processes and catalytic concepts to convert solar and wind energy into sustainable chemicals, materials, and storable fuels. Carbon‐footprint‐free, green H2 can be produced by water electrolysis by using renewable electricity. This H2 can be stored and reconverted into energy for power and heat generation, and can be used in fuel cell vehicles for transportation and as a feedstock to produce valuable chemicals (Scheme 4).
Scheme 4.
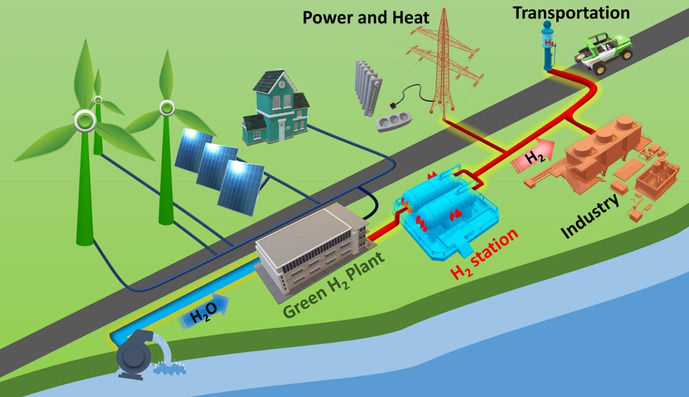
Future energy landscape including usage of sustainable electricity for water electrolysis for green hydrogen production, its storage, and utilization for power and heat generation, as fuel for transportation as well as feedstock for industrial application.
When we think about a carbon‐neutral energy roadmap, green H2 production is the bottleneck to reach the vision and target. With the current technologies, production by water electrolysis is still very energy‐intensive and expensive in comparison to steam reforming of natural gas. Commercial HER and OER catalysts are based on Pt, Ir, and Ru. The high cost and limited resources of these noble metals force us to look for alternatives. Thus, there is a need for the design and development of a new class of OER catalysts. The OER catalysts should fulfill different requirements like having high performance, being durable, and economical. On the other hand, we should have a holistic approach for catalyst design with consideration of recyclability, life cycle assignment, and sustainability. Sustainability, at each stage of production, is essential, since we will certainly face supply limitations of many elements soon if we keep consuming our resources at the current rate. Thus, it is vital to focus on the development of OER catalysts based on more abundant first‐row transition metals.
Co‐, Ni‐, and Fe‐based oxides are promising OER electrocatalysts. Stimulating catalytic behaviors are observed on these oxides and their activities depend on their crystal and electronic structures, and the oxidation state. Co3O4 itself is an active and stable OER catalyst, with Co3+ Oh proposed as the most desirable configuration. Its spinel structure can host a variety of transition metals to tune the electronic structure and boost its activity.
In comparison to Co, Ni is much cheaper and less toxic. The OER activity of NiO can be significantly enhanced by Fe. NiO is sensitive to an electrochemical aging process during electrolysis, leading to the formation of nickel oxy/hydroxides. These species are catalytically active and can be further activated by incorporating Fe impurities from KOH electrolyte. The uptake of Fe species is the reason for the high activity of Ni‐Fe catalysts, with Fe4+ species likely as the active sites.
Fe is very abundant and Fe‐based catalysts have been employed in many industrial processes including the Haber–Bosch ammonia synthesis and the Fischer–Tropsch process. However, as electrocatalysts iron oxides are typically not very active towards OER due to their poor electron transferability. Nevertheless, its combination with Co and Ni can improve the overall efficiency of the electrocatalyst significantly.
As a perspective for future work, several key aspects should be studied. Firstly, it is worth investigating the mass transfer effect on the nanoscale catalyst, especially for highly porous materials in which oxygen gas can be trapped and cover the catalytic sites. Secondly, not only metals like Ag but also surface‐modified carbon with improved stability can be a good choice to enhance the conductivity of oxide‐based catalysts as well as reduce the cost of the electrode material. Thirdly, advanced spectroscopic methods should be used to resolve the electronic structure of catalytic metal sites, as well as monitor the change in the local environment of the catalyst surface under operando conditions, which includes morphology alteration, phase transformation, and material dissolution.
Next, the utilization of machine learning and artificial intelligence might be a means to reduce computational costs as well as improve the handling of big data sets. This might shorten the time required to find and design optimum electrocatalyst for OER. [128] Lastly, it is worth mentioning that joint efforts on the design of catalyst and separator including diaphragm and membrane, the configuration of the electrolyzer, and process engineering are necessary to achieve efficient hydrogen production and establish a sustainable energy system.
Merging material synthesis and electrode preparation into one step will not only reduce the processing time but also decrease the cost of the electrode. For instance, electrochemical deposition and in situ catalyst formation on practical support materials like metal mesh and conductive carbon papers could make water electrolysis more operative and affordable. Indeed, these types of catalysts should have long‐term durability and they should be recyclable.
Raw material mining and the production of catalysts must be sustainable and without substantial environmental and geopolitical risks. For instance, cobalt‐based materials are very promising for OER; however, Co is not only toxic but has also geopolitical and supplies risks. Currently, more than half of the worldwide Co is produced in the Republic of the Congo under hazardous and unsafe working conditions. [129] Co has limited reserves and these are being rapidly depleted, since Co is getting more attention in the battery sector for energy storage. In the near future, there will be noteworthy supply limitations for large industrial‐scale application of cobalt oxide.
Within the current water electrolysis technology, the electrolyte or water should be ultrapure to avoid other side reactions (such as chlorine oxidation) as well as contaminations that deteriorate both electrodes and separator. This will be another challenge, taking into account that many countries in the world have limited clean water resources even for drinking and daily consumption. Thus, there is also a need for the development of more effective cells, reactors, and membranes that could be operated in non‐distilled water.
Another key important aspect, besides the catalyst's development, for the future is the availability of sustainable electricity for large‐scale water electrolysis plants (Scheme 4). Let us look at Germany's electricity production as an example. The Fraunhofer Institute for Solar Energy Systems (ISE) reported that Germany could produce 55.8 % of its electricity from renewable sources in the first half of 2020, thus reaching a new record high. In the first six months of 2020, solar and wind produced a total of 102.9 terawatt‐hours (TWh), which is only 10.6 TWh more than in the first half of 2019. [130] Germany's energy sector is predicted to have a demand for a sustainable electrolysis capacity of between 7 and 71 GW in 2030 and 275 GW in 2050. [131] Haber–Bosch ammonia synthesis alone would need a renewable electricity supply of up to 27.5 TWh per annum to be operated with 100 % green H2. [132] Now, the question is, where this energy would come from? It cannot be provided by sustainable sources with the current technology since Germany is not able to cover the production of sufficient carbon‐free electrical power. Investments are needed for more photovoltaic as well as for on and offshore wind farms. Nuclear energy could be an additional option to produce electricity for on‐site water electrolysis and green H2 production; however, Germany has decided to shut down all nuclear power facilities by the end of 2022 after the Fukushima Daiichi nuclear disaster.
Finally, there is also a need for investment in the infrastructure for H2 storage and distribution. Indeed, substantial technological developments and investments are necessary for the integration of on‐site green H2 production into existing industrial processes such as green steel production. In the end, there is a long way to go not only for large‐scale green H2 production but also for its storage, distribution, utilization, and integration into the existing infrastructures.
Conflict of interest
The authors declare no conflict of interest.
Biographical Information
Mingquan Yu received his M.Sc. degree in materials science from East China University of Science and Technology in 2016 and his Ph.D. degree in 2020 in the Department of Heterogeneous Catalysis of the Max‐Planck‐Institut für Kohlenforschung. He is currently a postdoctoral researcher in the same department. His research interests mainly focus on the design of transition‐metal‐based electrocatalysts for water splitting.

Biographical Information
Eko Budiyanto obtained his M.Sc. degree in Chemistry from Jagiellonian University in Kraków in 2018. He is currently working as a Ph.D. student in the Department of Heterogeneous Catalysis of the Max‐Planck‐Institut für Kohlenforschung. His research focuses on the design of mesostructured cobalt‐, iron‐, and nickel‐based electrocatalysts for water electrolysis.

Biographical Information
Harun Tüysüz gained his PhD degree in chemistry in the Department of Heterogeneous Catalysis at the Max‐Planck‐Institut für Kohlenforschung (MPI‐KOFO) in 2008 under the supervision of Prof. Ferdi Schüth and then conducted postdoctoral research with Prof. Peidong Yang at the University of California, Berkeley. In 2012 he was appointed as the head of the independent research group “Heterogeneous Catalysis and Sustainable Energy” at the MPI‐KOFO. His research group is interested in the design of nanoscale materials for sustainable energy‐related catalytic applications. He has received several awards including the Jochen‐Block‐Prize 2016, the DECHEMA Prize 2019, and the Forcheurs Jean‐Marie Lehn Prize 2020.

Acknowledgements
We thank the Max Planck Society for the basic support and the Deutsche Forschungsgemeinschaft (DFG, German Research Foundation) Projektnummer 388390466‐TRR 247 within the Collaborative Research Centre/Transregio 247 “Heterogeneous Oxidation Catalysis in the Liquid Phase” for the financial support. Open access funding enabled and organized by Projekt DEAL.
M. Yu, E. Budiyanto, H. Tüysüz, Angew. Chem. Int. Ed. 2022, 61, e202103824.
References
- 1. De Luna P., Hahn C., Higgins D., Jaffer S. A., Jaramillo T. F., Sargent E. H., Science 2019, 364, eaav3506. [DOI] [PubMed] [Google Scholar]
- 2.A Hydrogen Strategy for A Climate Neutral Europe 2020, https://ec.europa.eu/energy/sites/ener/files/hydrogen strategy.pdf.
- 3. van Renssen S., Nat. Clim. Change 2020, 10, 799–801. [Google Scholar]
- 4. Grewe T., Deng X., Weidenthaler C., Schüth F., Tüysüz H., Chem. Mater. 2013, 25, 4926–4935. [Google Scholar]
- 5. Möller S., Barwe S., Masa J., Wintrich D., Seisel S., Baltruschat H., Schuhmann W., Angew. Chem. Int. Ed. 2020, 59, 1585–1589; [DOI] [PMC free article] [PubMed] [Google Scholar]; Angew. Chem. 2020, 132, 1601–1605. [Google Scholar]
- 6. Hunter B. M., Gray H. B., Muller A. M., Chem. Rev. 2016, 116, 14120–14136. [DOI] [PubMed] [Google Scholar]
- 7. Badwal S. P., Giddey S. S., Munnings C., Bhatt A. I., Hollenkamp A. F., Front. Chem. 2014, 2, 79. [DOI] [PMC free article] [PubMed] [Google Scholar]
- 8. McCrory C. C. L., Jung S., Ferrer I. M., Chatman S. M., Peters J. C., Jaramillo T. F., J. Am. Chem. Soc. 2015, 137, 4347–4357. [DOI] [PubMed] [Google Scholar]
- 9.
- 9a. Li X., Zhao L., Yu J., Liu X., Zhang X., Liu H., Zhou W., Nano-Micro Lett. 2020, 12, 131; [DOI] [PMC free article] [PubMed] [Google Scholar]
- 9b. Debe M. K., J. Electrochem. Soc. 2013, 160, F522–F534. [Google Scholar]
- 10. Cherevko S., Geiger S., Kasian O., Mingers A., Mayrhofer K. J. J., J. Electroanal. Chem. 2016, 773, 69–78. [Google Scholar]
- 11. Yu M., Chan C. K., Tüysüz H., ChemSusChem 2018, 11, 605–611. [DOI] [PubMed] [Google Scholar]
- 12. Burke M. S., Kast M. G., Trotochaud L., Smith A. M., Boettcher S. W., J. Am. Chem. Soc. 2015, 137, 3638–3648. [DOI] [PubMed] [Google Scholar]
- 13. Kanan M. W., Nocera D. G., Science 2008, 321, 1072–1075. [DOI] [PubMed] [Google Scholar]
- 14. Masa J., Sinev I., Mistry H., Ventosa E., de la Mata M., Arbiol J., Muhler M., Roldan Cuenya B., Schuhmann W., Adv. Energy Mater. 2017, 7, 1700381. [Google Scholar]
- 15. Kim J.-H., Kawashima K., Wygant B. R., Mabayoje O., Liu Y., Wang J. H., Mullins C. B., ACS Appl. Energy Mater. 2018, 1, 5145–5150. [Google Scholar]
- 16. Liu C., Bai G., Tong X., Wang Y., Lv B., Yang N., Guo X.-Y., Electrochem. Commun. 2019, 98, 87–91. [Google Scholar]
- 17. Masa J., Piontek S., Wilde P., Antoni H., Eckhard T., Chen Y.-T., Muhler M., Apfel U.-P., Schuhmann W., Adv. Energy Mater. 2019, 9, 1900796. [Google Scholar]
- 18. Cai P., Huang J., Chen J., Wen Z., Angew. Chem. Int. Ed. 2017, 56, 4858–4861; [DOI] [PubMed] [Google Scholar]; Angew. Chem. 2017, 129, 4936–4939. [Google Scholar]
- 19. Fang Z., Peng L., Lv H., Zhu Y., Yan C., Wang S., Kalyani P., Wu X., Yu G., ACS Nano 2017, 11, 9550–9557. [DOI] [PubMed] [Google Scholar]
- 20. Wang X., Huang X., Gao W., Tang Y., Jiang P., Lan K., Yang R., Wang B., Li R., J. Mater. Chem. A 2018, 6, 3684–3691. [Google Scholar]
- 21.
- 21a. Chung D. Y., Lopes P. P., Farinazzo Bergamo Dias Martins P., He H., Kawaguchi T., Zapol P., You H., Tripkovic D., Strmcnik D., Zhu Y., Seifert S., Lee S., Stamenkovic V. R., Markovic N. M., Nat. Energy 2020, 5, 222–230; [Google Scholar]
- 21b. Dionigi F., Zeng Z., Sinev I., Merzdorf T., Deshpande S., Lopez M. B., Kunze S., Zegkinoglou I., Sarodnik H., Fan D., Bergmann A., Drnec J., Araujo J. F. d., Gliech M., Teschner D., Zhu J., Li W.-X., Greeley J., Cuenya B. R., Strasser P., Nat. Commun. 2020, 11, 2522; [DOI] [PMC free article] [PubMed] [Google Scholar]
- 21c. Bergmann A., Jones T. E., Martinez Moreno E., Teschner D., Chernev P., Gliech M., Reier T., Dau H., Strasser P., Nat. Catal. 2018, 1, 711–719. [Google Scholar]
- 22. Corrigan D. A., J. Electrochem. Soc. 1987, 134, 377–384. [Google Scholar]
- 23. McCrory C. C. L., Jung S., Peters J. C., Jaramillo T. F., J. Am. Chem. Soc. 2013, 135, 16977–16987. [DOI] [PubMed] [Google Scholar]
- 24.
- 24a. Hein D., Wartner G., Bergmann A., Bernal M., Cuenya B. R., Seidel R., ACS Nano 2020, 14, 15450–15457; [DOI] [PubMed] [Google Scholar]
- 24b. Moysiadou A., Lee S., Hsu C.-S., Chen H. M., Hu X., J. Am. Chem. Soc. 2020, 142, 11901–11914; [DOI] [PubMed] [Google Scholar]
- 24c. Drevon D., Görlin M., Chernev P., Xi L., Dau H., Lange K. M., Sci. Rep. 2019, 9, 1532; [DOI] [PMC free article] [PubMed] [Google Scholar]
- 24d. Smith R. D. L., Pasquini C., Loos S., Chernev P., Klingan K., Kubella P., Mohammadi M. R., Gonzalez-Flores D., Dau H., Nat. Commun. 2017, 8, 2022. [DOI] [PMC free article] [PubMed] [Google Scholar]
- 25. Song F., Bai L., Moysiadou A., Lee S., Hu C., Liardet L., Hu X., J. Am. Chem. Soc. 2018, 140, 7748–7759. [DOI] [PubMed] [Google Scholar]
- 26. Jiang K., Luo M., Peng M., Yu Y., Lu Y.-R., Chan T.-S., Liu P., de Groot F. M. F., Tan Y., Nat. Commun. 2020, 11, 2701. [DOI] [PMC free article] [PubMed] [Google Scholar]
- 27. Man I. C., Su H.-Y., Calle-Vallejo F., Hansen H. A., Martínez J. I., Inoglu N. G., Kitchin J., Jaramillo T. F., Nørskov J. K., Rossmeisl J., ChemCatChem 2011, 3, 1159–1165. [Google Scholar]
- 28. Seh Z. W., Kibsgaard J., Dickens C. F., Chorkendorff I., Nørskov J. K., Jaramillo T. F., Science 2017, 355, eaad4998. [DOI] [PubMed] [Google Scholar]
- 29.
- 29a. Deng X., Öztürk S., Weidenthaler C., Tüysüz H., ACS Appl. Mater. Interfaces 2017, 9, 21225–21233; [DOI] [PubMed] [Google Scholar]
- 29b. Yu M., Moon G.-h., Bill E., Tüysüz H., ACS Appl. Energy Mater. 2019, 2, 1199–1209; [Google Scholar]
- 29c. Moon G.-h., Yu M., Chan C. K., Tüysüz H., Angew. Chem. Int. Ed. 2019, 58, 3491–3495; [DOI] [PubMed] [Google Scholar]; Angew. Chem. 2019, 131, 3529–3533; [Google Scholar]
- 29d. Spanos I., Auer A. A., Neugebauer S., Deng X., Tüysüz H., Schlögl R., ACS Catal. 2017, 7, 3768–3778; [Google Scholar]
- 29e. Spanos I., Tesch M. F., Yu M., Tüysüz H., Zhang J., Feng X., Müllen K., Schlögl R., Mechler A. K., ACS Catal. 2019, 9, 8165–8170. [Google Scholar]
- 30. Tüysüz H., Hwang Y. J., Khan S. B., Asiri A. M., Yang P., Nano Res. 2013, 6, 47–54. [Google Scholar]
- 31. David M., Ocampo-Martínez C., Sánchez-Peña R., J. Energy Storage 2019, 23, 392–403. [Google Scholar]
- 32. Zhang G., Wang H., Yang J., Zhao Q., Yang L., Tang H., Liu C., Chen H., Lin Y., Pan F., Inorg. Chem. 2018, 57, 2766–2772. [DOI] [PubMed] [Google Scholar]
- 33.
- 33a. Schalenbach M., Kasian O., Mayrhofer K. J. J., Int. J. Hydrogen Energy 2018, 43, 11932–11938; [Google Scholar]
- 33b. Schalenbach M., Tjarks G., Carmo M., Lueke W., Mueller M., Stolten D., J. Electrochem. Soc. 2016, 163, F3197–F3208. [Google Scholar]
- 34. Wei Y., Shin C.-H., Tetteh E. B., Lee B.-J., Yu J.-S., ACS Appl. Energy Mater. 2020, 3, 822–830. [Google Scholar]
- 35.
- 35a. Enman L. J., Vise A. E., Burke Stevens M., Boettcher S. W., ChemPhysChem 2019, 20, 3089–3095; [DOI] [PubMed] [Google Scholar]
- 35b. Chakthranont P., Kibsgaard J., Gallo A., Park J., Mitani M., Sokaras D., Kroll T., Sinclair R., Mogensen M. B., Jaramillo T. F., ACS Catal. 2017, 7, 5399–5409; [Google Scholar]
- 35c. Seitz L. C., Hersbach T. J. P., Nordlund D., Jaramillo T. F., J. Phys. Chem. Lett. 2015, 6, 4178–4183; [DOI] [PubMed] [Google Scholar]
- 35d. Bernsmeier D., Bernicke M., Schmack R., Sachse R., Paul B., Bergmann A., Strasser P., Ortel E., Kraehnert R., ChemSusChem 2018, 11, 2367–2374; [DOI] [PubMed] [Google Scholar]
- 35e. Fester J., Makoveev A., Grumelli D., Gutzler R., Sun Z., Rodríguez-Fernández J., Kern K., Lauritsen J. V., Angew. Chem. Int. Ed. 2018, 57, 11893–11897; [DOI] [PubMed] [Google Scholar]; Angew. Chem. 2018, 130, 12069–12073. [Google Scholar]
- 36. Colli A. N., Girault H. H., Battistel A., Materials 2019, 12, 1336. [DOI] [PMC free article] [PubMed] [Google Scholar]
- 37. Jaramillo-Gutiérrez M. I., Sierra-González S. M., Ramírez-González C. A., Pedraza-Rosas J. E., Pedraza-Avella J. A., Int. J. Hydrogen Energy 2021, 46, 7667–7675. [Google Scholar]
- 38. Frydendal R., Paoli E. A., Knudsen B. P., Wickman B., Malacrida P., Stephens I. E. L., Chorkendorff I., ChemElectroChem 2014, 1, 2075–2081. [Google Scholar]
- 39. Muratova I. S., Mikhelson K. N., Ermolenko Y., Offenhäusser A., Mourzina Y., J. Solid State Electrochem. 2016, 20, 3359–3365. [Google Scholar]
- 40. Anantharaj S., Ede S. R., Karthick K., Sankar S. S., Sangeetha K., Karthik P. E., Kundu S., Energy Environ. Sci. 2018, 11, 744–771. [Google Scholar]
- 41. Anantharaj S., Kundu S., ACS Energy Lett. 2019, 4, 1260–1264. [Google Scholar]
- 42.
- 42a. Liu Y., Liang X., Gu L., Zhang Y., Li G.-D., Zou X., Chen J.-S., Nat. Commun. 2018, 9, 2609; [DOI] [PMC free article] [PubMed] [Google Scholar]
- 42b. Qian Q., Li Y., Liu Y., Yu L., Zhang G., Adv. Mater. 2019, 31, 1901139. [DOI] [PubMed] [Google Scholar]
- 43. Anantharaj S., Ede S. R., Sakthikumar K., Karthick K., Mishra S., Kundu S., ACS Catal. 2016, 6, 8069–8097. [Google Scholar]
- 44. Shinagawa T., Garcia-Esparza A. T., Takanabe K., Sci. Rep. 2015, 5, 13801. [DOI] [PMC free article] [PubMed] [Google Scholar]
- 45. Kapałka A., Fóti G., Comninellis C., Electrochem. Commun. 2008, 10, 607–610. [Google Scholar]
- 46. Duo I., Fujishima A., Comninellis C., Electrochem. Commun. 2003, 5, 695–700. [Google Scholar]
- 47. Dulce Maria M., Marcel R., J. Phys. Energy 2021, 3, 034013. [Google Scholar]
- 48. Bredar A. R. C., Chown A. L., Burton A. R., Farnum B. H., ACS Appl. Energy Mater. 2020, 3, 66–98. [Google Scholar]
- 49. Orazem M. E., Tribollet B., Electrochemical Impedance Spectroscopy, Wiley, Hoboken, 2008. [Google Scholar]
- 50. Lin Y., Tian Z., Zhang L., Ma J., Jiang Z., Deibert B. J., Ge R., Chen L., Nat. Commun. 2019, 10, 162. [DOI] [PMC free article] [PubMed] [Google Scholar]
- 51. Trasatti S., Petrii O. A., Pure Appl. Chem. 1991, 63, 711–734. [Google Scholar]
- 52. Sun S., Li H., Xu Z. J., Joule 2018, 2, 1024–1027. [Google Scholar]
- 53. Maass S., Finsterwalder F., Frank G., Hartmann R., Merten C., J. Power Sources 2008, 176, 444–451. [Google Scholar]
- 54. Vos J. G., Koper M. T. M., J. Electroanal. Chem. 2018, 819, 260–268. [Google Scholar]
- 55. Görlin M., Chernev P., Ferreira de Araújo J., Reier T., Dresp S., Paul B., Krähnert R., Dau H., Strasser P., J. Am. Chem. Soc. 2016, 138, 5603–5614. [DOI] [PubMed] [Google Scholar]
- 56. Yu M., Belthle K. S., Tüysüz C., Tüysüz H., J. Mater. Chem. A 2019, 7, 23130–23139. [Google Scholar]
- 57. Zhou H., Yu F., Zhu Q., Sun J., Qin F., Yu L., Bao J., Yu Y., Chen S., Ren Z., Energy Environ. Sci. 2018, 11, 2858–2864. [Google Scholar]
- 58. Spöri C., Kwan J. T. H., Bonakdarpour A., Wilkinson D. P., Strasser P., Angew. Chem. Int. Ed. 2017, 56, 5994–6021; [DOI] [PubMed] [Google Scholar]; Angew. Chem. 2017, 129, 6088–6117. [Google Scholar]
- 59.
- 59a. Puthiyapura V. K., Pasupathi S., Basu S., Wu X., Su H., Varagunapandiyan N., Pollet B., Scott K., Int. J. Hydrogen Energy 2013, 38, 8605–8616; [Google Scholar]
- 59b. Su H. N., Linkov V., Bladergroen B. J., Int. J. Hydrogen Energy 2013, 38, 9601–9608; [Google Scholar]
- 59c. Sung C.-C., Liu C.-Y., Int. J. Hydrogen Energy 2013, 38, 10063–10067. [Google Scholar]
- 60. Nong H. N., Falling L. J., Bergmann A., Klingenhof M., Tran H. P., Spöri C., Mom R., Timoshenko J., Zichittella G., Knop-Gericke A., Piccinin S., Pérez-Ramírez J., Cuenya B. R., Schlögl R., Strasser P., Teschner D., Jones T. E., Nature 2020, 587, 408–413. [DOI] [PubMed] [Google Scholar]
- 61. Suntivich J., Gasteiger H. A., Yabuuchi N., Nakanishi H., Goodenough J. B., Shao-Horn Y., Nat. Chem. 2011, 3, 546–550. [DOI] [PubMed] [Google Scholar]
- 62. Bajdich M., García-Mota M., Vojvodic A., Nørskov J. K., Bell A. T., J. Am. Chem. Soc. 2013, 135, 13521–13530. [DOI] [PubMed] [Google Scholar]
- 63. Du X., Huang J., Zhang J., Yan Y., Wu C., Hu Y., Yan C., Lei T., Chen W., Fan C., Xiong J., Angew. Chem. Int. Ed. 2019, 58, 4484–4502; [DOI] [PubMed] [Google Scholar]; Angew. Chem. 2019, 131, 4532–4551. [Google Scholar]
- 64. Suntivich J., May K. J., Gasteiger H. A., Goodenough J. B., Shao-Horn Y., Science 2011, 334, 1383–1385. [DOI] [PubMed] [Google Scholar]
- 65. Zhang R., Zhang Y.-C., Pan L., Shen G.-Q., Mahmood N., Ma Y.-H., Shi Y., Jia W., Wang L., Zhang X., Xu W., Zou J.-J., ACS Catal. 2018, 8, 3803–3811. [Google Scholar]
- 66. Gottstein G., in Physical Foundations of Materials Science (Ed.: Gottstein G.), Springer, Berlin, Heidelberg, 2004, pp. 63–106. [Google Scholar]
- 67.
- 67a. Yu M., Waag F., Chan C. K., Weidenthaler C., Barcikowski S., Tüysüz H., ChemSusChem 2020, 13, 520–528; [DOI] [PMC free article] [PubMed] [Google Scholar]
- 67b. Xiao Z., Huang Y.-C., Dong C.-L., Xie C., Liu Z., Du S., Chen W., Yan D., Tao L., Shu Z., Zhang G., Duan H., Wang Y., Zou Y., Chen R., Wang S., J. Am. Chem. Soc. 2020, 142, 12087–12095. [DOI] [PubMed] [Google Scholar]
- 68. Yue Q., Liu C., Wan Y., Wu X., Zhang X., Du P., J. Catal. 2018, 358, 1–7. [Google Scholar]
- 69. Luo J., Im J.-H., Mayer M. T., Schreier M., Nazeeruddin M. K., Park N.-G., Tilley S. D., Fan H. J., Grätzel M., Science 2014, 345, 1593. [DOI] [PubMed] [Google Scholar]
- 70.
- 70a. Dionigi F., Strasser P., Adv. Energy Mater. 2016, 6, 1600621; [Google Scholar]
- 70b. Zhang W., Zhou K., Small 2017, 13, 1700806. [DOI] [PubMed] [Google Scholar]
- 71. Masa J., Schuhmann W., ChemCatChem 2019, 11, 5842–5854. [Google Scholar]
- 72.
- 72a. Fu Q., Wu T., Fu G., Gao T., Han J., Yao T., Zhang Y., Zhong W., Wang X., Song B., ACS Energy Lett. 2018, 3, 1744–1752; [Google Scholar]
- 72b. Masa J., Weide P., Peeters D., Sinev I., Xia W., Sun Z., Somsen C., Muhler M., Schuhmann W., Adv. Energy Mater. 2016, 6, 1502313. [Google Scholar]
- 73. Xu D., Stevens M. B., Cosby M. R., Oener S. Z., Smith A. M., Enman L. J., Ayers K. E., Capuano C. B., Renner J. N., Danilovic N., Li Y., Wang H., Zhang Q., Boettcher S. W., ACS Catal. 2019, 9, 7–15. [Google Scholar]
- 74. Gong M., Li Y., Wang H., Liang Y., Wu J. Z., Zhou J., Wang J., Regier T., Wei F., Dai H., J. Am. Chem. Soc. 2013, 135, 8452–8455. [DOI] [PubMed] [Google Scholar]
- 75. Zhang B., Zheng X., Voznyy O., Comin R., Bajdich M., Garcia-Melchor M., Han L., Xu J., Liu M., Zheng L., Garcia de Arquer F. P., Dinh C. T., Fan F., Yuan M., Yassitepe E., Chen N., Regier T., Liu P., Li Y., De Luna P., Janmohamed A., Xin H. L., Yang H., Vojvodic A., Sargent E. H., Science 2016, 352, 333–337. [DOI] [PubMed] [Google Scholar]
- 76. Smith R. D. L., Prévot M. S., Fagan R. D., Zhang Z., Sedach P. A., Siu M. K. J., Trudel S., Berlinguette C. P., Science 2013, 340, 60. [DOI] [PubMed] [Google Scholar]
- 77. Zou X., Liu Y., Li G.-D., Wu Y., Liu D.-P., Li W., Li H.-W., Wang D., Zhang Y., Zou X., Adv. Mater. 2017, 29, 1700404. [Google Scholar]
- 78.P. Ferchland, J. Nussbaum, Google Patents, 1908.
- 79.
- 79a. Burke M. S., Enman L. J., Batchellor A. S., Zou S., Boettcher S. W., Chem. Mater. 2015, 27, 7549–7558; [Google Scholar]
- 79b. Suen N. T., Hung S. F., Quan Q., Zhang N., Xu Y. J., Chen H. M., Chem. Soc. Rev. 2017, 46, 337–365. [DOI] [PubMed] [Google Scholar]
- 80. Baek D. S., Jung G. Y., Seo B., Kim J. C., Lee H. W., Shin T. J., Jeong H. Y., Kwak S. K., Joo S. H., Adv. Funct. Mater. 2019, 29, 1901217. [Google Scholar]
- 81.
- 81a. Zhu J., Li H., Zhong L., Xiao P., Xu X., Yang X., Zhao Z., Li J., ACS Catal. 2014, 4, 2917–2940; [Google Scholar]
- 81b. Ortatatlı Ş., Ternieden J., Weidenthaler C., Eur. J. Inorg. Chem. 2018, 5238–5245. [Google Scholar]
- 82. Colomer M. T., Fumo D. A., Jurado J. R., Segadaẽs A. M., J. Mater. Chem. 1999, 9, 2505–2510. [Google Scholar]
- 83.
- 83a. Budiyanto E., Yu M., Chen M., DeBeer S., Rüdiger O., Tüysüz H., ACS Appl. Energy Mater. 2020, 3, 8583–8594; [Google Scholar]
- 83b. Deng X., Chan C. K., Tüysüz H., ACS Appl. Mater. Interfaces 2016, 8, 32488–32495; [DOI] [PubMed] [Google Scholar]
- 83c. Song F., Hu X., J. Am. Chem. Soc. 2014, 136, 16481–16484; [DOI] [PubMed] [Google Scholar]
- 83d. Yu M. Q., Li Y. H., Yang S., Liu P. F., Pan L. F., Zhang L., Yang H. G., J. Mater. Chem. A 2015, 3, 14101–14104. [Google Scholar]
- 84. Byers H. G., J. Am. Chem. Soc. 1908, 30, 1718–1742. [Google Scholar]
- 85. Burke L. D., Lyons M. E., Murphy O. J., J. Electroanal. Chem. 1982, 132, 247–261. [Google Scholar]
- 86. Liu Y., Ying Y., Fei L., Liu Y., Hu Q., Zhang G., Pang S. Y., Lu W., Mak C. L., Luo X., Zhou L., Wei M., Huang H., J. Am. Chem. Soc. 2019, 141, 8136–8145. [DOI] [PubMed] [Google Scholar]
- 87. Deng X., Chen K., Tüysüz H., Chem. Mater. 2017, 29, 40–52. [Google Scholar]
- 88.
- 88a. Deng X., Schmidt W. N., Tüysüz H., Chem. Mater. 2014, 26, 6127–6134; [Google Scholar]
- 88b. Grewe T., Deng X., Tüysüz H., Chem. Mater. 2014, 26, 3162–3168; [Google Scholar]
- 88c. Deng X., Bongard H.-J., Chan C. K., Tüysüz H., ChemSusChem 2016, 9, 409–415; [DOI] [PubMed] [Google Scholar]
- 88d. Behnken J., Yu M., Deng X., Tüysüz H., Harms C., Dyck A., Wittstock G., ChemElectroChem 2019, 6, 3460–3467. [Google Scholar]
- 89. Subbaraman R., Tripkovic D., Chang K.-C., Strmcnik D., Paulikas A. P., Hirunsit P., Chan M., Greeley J., Stamenkovic V., Markovic N. M., Nat. Mater. 2012, 11, 550–557. [DOI] [PubMed] [Google Scholar]
- 90. Bergmann A., Martinez-Moreno E., Teschner D., Chernev P., Gliech M., de Araujo J. F., Reier T., Dau H., Strasser P., Nat. Commun. 2015, 6, 8625. [DOI] [PMC free article] [PubMed] [Google Scholar]
- 91. Borup R., Meyers J., Pivovar B., Kim Y. S., Mukundan R., Garland N., Myers D., Wilson M., Garzon F., Wood D., Zelenay P., More K., Stroh K., Zawodzinski T., Boncella J., McGrath J. E., Inaba M., Miyatake K., Hori M., Ota K., Ogumi Z., Miyata S., Nishikata A., Siroma Z., Uchimoto Y., Yasuda K., Kimijima K., Iwashita N., Chem. Rev. 2007, 107, 3904–3951. [DOI] [PubMed] [Google Scholar]
- 92. Kutin Y., Cox N., Lubitz W., Schnegg A., Rüdiger O., Catalysts 2019, 9, 926. [Google Scholar]
- 93.
- 93a. Deng X., Tüysüz H., ACS Catal. 2014, 4, 3701–3714; [Google Scholar]
- 93b. Rosen J., Hutchings G. S., Jiao F., J. Am. Chem. Soc. 2013, 135, 4516–4521; [DOI] [PubMed] [Google Scholar]
- 93c. Gao D., Liu R., Biskupek J., Kaiser U., Song Y.-F., Streb C., Angew. Chem. Int. Ed. 2019, 58, 4644–4648; [DOI] [PubMed] [Google Scholar]; Angew. Chem. 2019, 131, 4692–4696. [Google Scholar]
- 94. Wang X.-T., Ouyang T., Wang L., Zhong J.-H., Ma T., Liu Z.-Q., Angew. Chem. Int. Ed. 2019, 58, 13291–13296; [DOI] [PubMed] [Google Scholar]; Angew. Chem. 2019, 131, 13425–13430. [Google Scholar]
- 95. Hsu S.-H., Hung S.-F., Wang H.-Y., Xiao F.-X., Zhang L., Yang H., Chen H. M., Lee J.-M., Liu B., Small Methods 2018, 2, 1800001. [Google Scholar]
- 96. Liu Z., Wang G., Zhu X., Wang Y., Zou Y., Zang S., Wang S., Angew. Chem. Int. Ed. 2020, 59, 4736–4742; [DOI] [PubMed] [Google Scholar]; Angew. Chem. 2020, 132, 4766–4772. [Google Scholar]
- 97.
- 97a. Yu M., Li G., Fu C., Liu E., Manna K., Budiyanto E., Yang Q., Felser C., Tüysüz H., Angew. Chem. Int. Ed. 2021, 60, 5800–5805; [DOI] [PMC free article] [PubMed] [Google Scholar]; Angew. Chem. 2021, 133, 5864–5869; [Google Scholar]
- 97b. Sun Y., Ren X., Sun S., Liu Z., Xi S., Xu Z. J., Angew. Chem. Int. Ed. 2021, 60, 14536–14544; [DOI] [PubMed] [Google Scholar]; Angew. Chem. 2021, 133, 14657–14665. [Google Scholar]
- 98. Gong L., Chng X. Y. E., Du Y., Xi S., Yeo B. S., ACS Catal. 2018, 8, 807–814. [Google Scholar]
- 99. Bähr A., Moon G.-h., Tüysüz H., ACS Appl. Energy Mater. 2019, 2, 6672–6680. [Google Scholar]
- 100. Yeo B. S., Bell A. T., J. Am. Chem. Soc. 2011, 133, 5587–5593. [DOI] [PubMed] [Google Scholar]
- 101. Yu M., Moon G.-h., Castillo R. G., DeBeer S., Weidenthaler C., Tüysüz H., Angew. Chem. Int. Ed. 2020, 59, 16544–16552; [DOI] [PMC free article] [PubMed] [Google Scholar]; Angew. Chem. 2020, 132, 16687–16695. [Google Scholar]
- 102. Liu Z., Xiao Z., Luo G., Chen R., Dong C.-L., Chen X., Cen J., Yang H., Wang Y., Su D., Li Y., Wang S., Small 2019, 15, 1904903. [DOI] [PubMed] [Google Scholar]
- 103. Fominykh K., Feckl J. M., Sicklinger J., Döblinger M., Böcklein S., Ziegler J., Peter L., Rathousky J., Scheidt E.-W., Bein T., Fattakhova-Rohlfing D., Adv. Funct. Mater. 2014, 24, 3123–3129. [Google Scholar]
- 104. Klaus S., Cai Y., Louie M. W., Trotochaud L., Bell A. T., J. Phys. Chem. C 2015, 119, 7243–7254. [Google Scholar]
- 105.
- 105a. Ng J. W. D., Garcia-Melchor M., Bajdich M., Chakthranont P., Kirk C., Vojvodic A., Jaramillo T. F., Nat. Energy 2016, 1, 16053; [Google Scholar]
- 105b. Gennero de Chialvo M. R., Chialvo A. C., Electrochim. Acta 1988, 33, 825–830. [Google Scholar]
- 106.
- 106a. Louie M. W., Bell A. T., J. Am. Chem. Soc. 2013, 135, 12329–12337; [DOI] [PubMed] [Google Scholar]
- 106b. Stevens M. B., Trang C. D. M., Enman L. J., Deng J., Boettcher S. W., J. Am. Chem. Soc. 2017, 139, 11361–11364; [DOI] [PubMed] [Google Scholar]
- 106c. Kleiman-Shwarsctein A., Hu Y.-S., Stucky G. D., McFarland E. W., Electrochem. Commun. 2009, 11, 1150–1153. [Google Scholar]
- 107. Medway S. L., Lucas C. A., Kowal A., Nichols R. J., Johnson D., J. Electroanal. Chem. 2006, 587, 172–181. [Google Scholar]
- 108. Yeo B. S., Bell A. T., J. Phys. Chem. C 2012, 116, 8394–8400. [Google Scholar]
- 109.
- 109a. Garcia A. C., Touzalin T., Nieuwland C., Perini N., Koper M. T. M., Angew. Chem. Int. Ed. 2019, 58, 12999–13003; [DOI] [PubMed] [Google Scholar]; Angew. Chem. 2019, 131, 13133–13137; [Google Scholar]
- 109b. Trotochaud L., Young S. L., Ranney J. K., Boettcher S. W., J. Am. Chem. Soc. 2014, 136, 6744–6453. [DOI] [PubMed] [Google Scholar]
- 110. Bode H., Dehmelt K., Witte J., Electrochim. Acta 1966, 11, 1079–1087. [Google Scholar]
- 111. Juodkazis K., Juodkazytė J., Vilkauskaitė R., Jasulaitienė V., J. Solid State Electrochem. 2008, 12, 1469–1479. [Google Scholar]
- 112. Sliozberg K., Aniskevich Y., Kayran U., Masa J., Schuhmann W., Z. Phys. Chem. 2020, 234, 995–1019. [Google Scholar]
- 113. Li C., Zhang B., Li Y., Hao S., Cao X., Yang G., Wu J., Huang Y., Appl. Catal. B 2019, 244, 56–62. [Google Scholar]
- 114. Yan J., Kong L., Ji Y., White J., Li Y., Zhang J., An P., Liu S., Lee S.-T., Ma T., Nat. Commun. 2019, 10, 2149. [DOI] [PMC free article] [PubMed] [Google Scholar]
- 115. Liao C., Yang B., Zhang N., Liu M., Chen G., Jiang X., Chen G., Yang J., Liu X., Chan T.-S., Lu Y.-J., Ma R., Zhou W., Adv. Funct. Mater. 2019, 29, 1904020. [Google Scholar]
- 116. Tian B., Shin H., Liu S., Fei M., Mu Z., Liu C., Pan Y., Sun Y., W. A. Goddard III , Ding M., Angew. Chem. Int. Ed. 2021, 10.1002/anie.202101906; [DOI] [PubMed] [Google Scholar]; Angew. Chem. 2021, 10.1002/ange.202101906. [DOI] [Google Scholar]
- 117. Ferreira de Araújo J., Dionigi F., Merzdorf T., Oh H.-S., Strasser P., Angew. Chem. Int. Ed. 2021, 60, 14981–14988; [DOI] [PMC free article] [PubMed] [Google Scholar]; Angew. Chem. 2021, 133, 15108–15115. [Google Scholar]
- 118. Wu H., Yang T., Du Y., Shen L., Ho G. W., Adv. Mater. 2018, 30, 1804341. [DOI] [PubMed] [Google Scholar]
- 119. Suryanto B. H. R., Wang Y., Hocking R. K., Adamson W., Zhao C., Nat. Commun. 2019, 10, 5599. [DOI] [PMC free article] [PubMed] [Google Scholar]
- 120. Song F., Busch M. M., Lassalle-Kaiser B., Hsu C.-S., Petkucheva E., Bensimon M., Chen H. M., Corminboeuf C., Hu X., ACS Cent. Sci. 2019, 5, 558–568. [DOI] [PMC free article] [PubMed] [Google Scholar]
- 121.
- 121a. He K., Tadesse Tsega T., Liu X., Zai J., Li X.-H., Liu X., Li W., Ali N., Qian X., Angew. Chem. Int. Ed. 2019, 58, 11903–11909; [DOI] [PubMed] [Google Scholar]; Angew. Chem. 2019, 131, 12029–12035; [Google Scholar]
- 121b. Friebel D., Louie M. W., Bajdich M., Sanwald K. E., Cai Y., Wise A. M., Cheng M.-J., Sokaras D., Weng T.-C., Alonso-Mori R., Davis R. C., Bargar J. R., Nørskov J. K., Nilsson A., Bell A. T., J. Am. Chem. Soc. 2015, 137, 1305–1313. [DOI] [PubMed] [Google Scholar]
- 122. Hunter B. M., Winkler J. R., Gray H. B., Molecules 2018, 23, 903. [DOI] [PMC free article] [PubMed] [Google Scholar]
- 123. Chen J. Y., Dang L., Liang H., Bi W., Gerken J. B., Jin S., Alp E. E., Stahl S. S., J. Am. Chem. Soc. 2015, 137, 15090–15093. [DOI] [PubMed] [Google Scholar]
- 124. Bai L., Lee S., Hu X., Angew. Chem. Int. Ed. 2021, 60, 3095–3103; [DOI] [PubMed] [Google Scholar]; Angew. Chem. 2021, 133, 3132–3140. [Google Scholar]
- 125. Lee S., Bai L., Hu X., Angew. Chem. Int. Ed. 2020, 59, 8072–8077; [DOI] [PubMed] [Google Scholar]; Angew. Chem. 2020, 132, 8149–8154. [Google Scholar]
- 126. Lee S., Banjac K., Lingenfelder M., Hu X., Angew. Chem. Int. Ed. 2019, 58, 10295–10299; [DOI] [PMC free article] [PubMed] [Google Scholar]; Angew. Chem. 2019, 131, 10401–10405. [Google Scholar]
- 127.Distribution of Electricity Generation Worldwide in 2018 by Energy Source 2018, https://www.statista.com/statistics/269811/world-electricity-production-by-energy-source/.
- 128.
- 128a. Palkovits R., Palkovits S., ACS Catal. 2019, 9, 8383–8387; [Google Scholar]
- 128b. Craig M. J., Coulter G., Dolan E., Soriano-López J., Mates-Torres E., Schmitt W., García-Melchor M., Nat. Commun. 2019, 10, 4993. [DOI] [PMC free article] [PubMed] [Google Scholar]
- 129. van den Brink S., Kleijn R., Sprecher B., Tukker A., Resour. Conserv. Recycl. 2020, 156, 104743. [Google Scholar]
- 130.German Net Electricity Generation in First Half of 2020: Renewables Reach Record Share of 55.8 Percent 2020, https://www.ise.fraunhofer.de/en/press-media/press-releases/2020/net-energy-production-first-half-of-2020.html.
- 131.M. R. C. Hebling, T. Fleiter, U. Groos, D. Härle, A. Held, M. Jahn, N. Müller, T. Pfeifer, P. Plötz, O. Ranzmeyer, A. Schaadt, F. Sensfuß, T. Smolinka, M. Wietschel, Eine Wasserstoff-Roadmap für Deutschland 2019, https://www.ise.fraunhofer.de/content/dam/ise/de/documents/publications/studies/2019–10 Fraunhofer Wasserstoff-Roadmap fuer Deutschland.pdf.
- 132. Geres R., Kohn A., Lenz S., Ausfelder F., Bazzanella A. M., Möller A., Auf dem Weg zu Einer Treibhausgasneutralen Chemischen Industrie in Deutschland : Eine Studie von DECHEMA und FutureCamp für den VCI, DECHEMA Gesellschaft für Chemische Technik und Biotechnologie e.V., Frankfurt am Main, 2019. [Google Scholar]
- 133. Jung S., McCrory C. C. L., Ferrer I. M., Peters J. C., Jaramillo T. F., J. Mater. Chem. A 2016, 4, 3068–3076. [Google Scholar]
- 134. Waag F., Gökce B., Kalapu C., Bendt G., Salamon S., Landers J., Hagemann U., Heidelmann M., Schulz S., Wende H., Hartmann N., Behrens M., Barcikowski S., Sci. Rep. 2017, 7, 13161. [DOI] [PMC free article] [PubMed] [Google Scholar]
- 135. Esswein A. J., McMurdo M. J., Ross P. N., Bell A. T., Tilley T. D., J. Phys. Chem. C 2009, 113, 15068–15072. [Google Scholar]
- 136. Tung C.-W., Hsu Y.-Y., Shen Y.-P., Zheng Y., Chan T.-S., Sheu H.-S., Cheng Y.-C., Chen H. M., Nat. Commun. 2015, 6, 8106. [DOI] [PMC free article] [PubMed] [Google Scholar]
- 137. Chekin F., Tahermansouri H., Besharat M. R., J. Solid State Electrochem. 2014, 18, 747–753. [Google Scholar]
- 138. Manivasakan P., Ramasamy P., Kim J., RSC Adv. 2015, 5, 33269–33274. [Google Scholar]
- 139. Cheng N., Liu Q., Tian J., Sun X., He Y., Zhai S., Asiri A. M., Int. J. Hydrogen Energy 2015, 40, 9866–9871. [Google Scholar]
- 140. Xia B., Wang T., Jiang X., Li J., Zhang T., Xi P., Gao D., Xue D., J. Mater. Chem. A 2019, 7, 4729–4733. [Google Scholar]
- 141. Yin Y., Zhang X., Sun C., Prog. Nat. Sci. 2018, 28, 430–436. [Google Scholar]
- 142. He W., Ren G., Li Y., Jia D., Li S., Cheng J., Liu C., Hao Q., Zhang J., Liu H., Catal. Sci. Technol. 2020, 10, 1708–1713. [Google Scholar]
- 143. Yang H., Gong L., Wang H., Dong C., Wang J., Qi K., Liu H., Guo X., Xia B. Y., Nat. Commun. 2020, 11, 5075. [DOI] [PMC free article] [PubMed] [Google Scholar]
- 144. Zhan C., Liu Z., Zhou Y., Guo M., Zhang X., Tu J., Ding L., Cao Y., Nanoscale 2019, 11, 3378–3385. [DOI] [PubMed] [Google Scholar]
- 145. Han L., Guo L., Dong C., Zhang C., Gao H., Niu J., Peng Z., Zhang Z., Nano Res. 2019, 12, 2281–2287. [Google Scholar]
- 146. Song F., Hu X., Nat. Commun. 2014, 5, 4477. [DOI] [PubMed] [Google Scholar]
- 147. Li W., Li F., Yang H., Wu X., Zhang P., Shan Y., Sun L., Nat. Commun. 2019, 10, 5074. [DOI] [PMC free article] [PubMed] [Google Scholar]
- 148. Si S., Hu H.-S., Liu R.-J., Xu Z.-X., Wang C.-B., Feng Y.-Y., Int. J. Hydrogen Energy 2020, 45, 9368–9379. [Google Scholar]