

Abstract
Wildlife health assessments help identify populations at risk of starvation, disease, and decline from anthropogenic impacts on natural habitats. We conducted an overview of available health assessment studies in noncaptive vertebrates and devised a framework to strategically integrate health assessments in population monitoring. Using a systematic approach, we performed a thorough assessment of studies examining multiple health parameters of noncaptive vertebrate species from 1982 to 2020 (n = 261 studies). We quantified trends in study design and diagnostic methods across taxa with generalized linear models, bibliometric analyses, and visual representations of study location versus biodiversity hotspots. Only 35% of studies involved international or cross‐border collaboration. Countries with both high and threatened biodiversity were greatly underrepresented. Species that were not listed as threatened on the International Union for Conservation of Nature Red List represented 49% of assessed species, a trend likely associated with the regional focus of most studies. We strongly suggest following wildlife health assessment protocols when planning a study and using statistically adequate sample sizes for studies establishing reference ranges. Across all taxa blood analysis (89%), body composition assessments (81%), physical examination (72%), and fecal analyses (24% of studies) were the most common methods. A conceptual framework to improve design and standardize wildlife health assessments includes guidelines on the experimental design, data acquisition and analysis, and species conservation planning and management implications. Integrating a physiological and ecological understanding of species resilience toward threatening processes will enable informed decision making regarding the conservation of threatened species.
Keywords: biodiversity hotspots, conceptual framework, diagnostic techniques, red lists, sample size, systematic review, vertebrates, listas rojas, marco conceptual, hotspots de biodiversidad, revisión sistemática, tamaño muestral, técnicas diagnósticas, vertebrados, 系统综述, 脊椎动物, 生物多样性热点, 诊断技术, 样本量, 概念框架, 红色名录
Short abstract
Article impact statement: Standardized, validated, and multidisciplinary wildlife health assessments significantly benefit species conservation management.
Abstract
Importancia de los exámenes diagnósticos para la conservación de fauna silvestre
Resumen
Los exámenes diagnósticos de fauna silvestre ayudan a identificar poblaciones en riesgo por desnutrición, enfermedades infecciosas y disminución poblacional, causadas por impactos antropogénicos. Revisamos los estudios disponibles que llevaron a cabo exámenes diagnósticos en fauna silvestre y diseñamos un marco de trabajo para integrar dichos exámenes en monitoreos poblacionales. Empleando un enfoque sistemático, evaluamos aquellos estudios que examinaban múltiples indicadores de salud en vertebrados no cautivos entre 1982 y 2020 (n = 261 estudios). Cuantificamos las tendencias estadísticas, clasificadas por taxones, del diseño del estudio y de los métodos diagnósticos usando modelos lineales generalizados, análisis bibliométricos y representaciones visuales del lugar de estudio versus los hotspots (puntos calientes) de biodiversidad. Sólo el 35% de los estudios incluían colaboraciones internacionales o transfronterizas, y los países ricos en biodiversidad y especies amenazadas estaban gravemente subrepresentados. Las especies no clasificadas como amenazadas en la Lista Roja de la Unión Internacional para la Conservación de la Naturaleza representaban el 49% de las especies examinadas; una tendencia posiblemente asociada al enfoque regional de la mayoría de los estudios. Recomendamos encarecidamente seguir protocolos diagnósticos y manuales de técnicas del estudio de la fauna silvestre, además de usar tamaños muestrales estadísticamente adecuados al establecer rangos de referencia. Los métodos diagnósticos más comunes para todos los taxones fueronanálisis sanguíneos (89%), evaluaciones de composición corporal (81%), exámenes físicos (72%) y análisis fecales (24% de los estudios). Presentamos un marco conceptual para mejorar y estandarizar los exámenes diagnósticos en estudios de fauna silvestre; dicho marco incluye guías para el diseño experimental, para la obtención y el análisis de datos, y para elaborar planes de acción para especies amenazadas. La combinación de conocimientos fisiológicos y ecológicos, relacionados con la resiliencia biológica de especies amenazadas, facilitará una toma de decisiones eficiente para el manejo y para la conservación de la biodiversidad.
【摘要】
野生动物健康评估有助于分辨面临诸如饥饿、疾病和因人类活动影响自然栖息地而减少等威胁的种群。我们对现有的非圈养脊椎动物健康评估研究进行了概述, 并设计了一个框架, 将健康评估战略性地整合到种群监测之中。我们采取这个系统性方法, 对1982‐2020年间针对非圈养脊椎动物多种健康参数的研究进行了全面评估 (共261项研究) 。我们利用广义线性模型、文献计量分析, 以及研究地点与生物多样性热点地区的可视化表征, 对研究设计和诊断方法的动态趋势进行了量化分析。结果表明, 只有35%的研究涉及国际或跨境合作。生物多样性高且受威胁物种多的国家在这方面的代表性大大不足。得到健康评估的物种中有49%都未被列入《国际自然保护联盟红色名录》的濒危物种之中, 这一趋势可能与大多数研究的区域性有关。我们强烈建议在设计研究时遵循野生动物健康评估的步骤, 并在建立参考范围时使用统计上足够的样本量。在所有类群中, 血液分析 (89%) 、身体成分评估 (81%) 、体格检查 (72%) 和粪便分析 (24%) 是最常见的方法。我们还提出了改善野生动物健康评估设计及标准化的概念框架, 包括关于实验设计、数据收集和分析, 以及物种保护规划和管理影响的指南。整合理解物种在应对威胁时恢复力的生理和生态因素, 将有助于在受威胁物种保护中做出更明智的决策。【翻译:胡怡思;审校:聂永刚】
Introduction
The increasing role of emerging diseases in wildlife population declines and biodiversity loss is well recognized (Scheele et al., 2019). In addition, ecosystems are experiencing numerous anthropogenic stressors, including invasive species, climate change, pollution, and resource overexploitation, all of which negatively affect wildlife health and increase disease (Barnosky et al., 2011; Ceballos et al., 2015; Tompkins et al., 2015). There is compelling evidence that stressors that negatively affect the health of wildlife populations also interfere with the ecological roles of wildlife, hampering ecosystem functioning and conservation more broadly (Deem et al., 2001). Given the increasing recognition of the importance of wildlife health to conservation, there is a need to take stock of lessons learned. A critical analysis of the main characteristics of studies focusing on wildlife health could, therefore, provide invaluable insight, such as guidelines for field‐based conservationists to improve conservation and management outcomes.
Wildlife health assessments can provide essential baseline information for managing conservation threats, especially for endangered species. Health assessments are critical for defining the normal or physiological health status of a population as well as detecting ill health. Infectious and noninfectious diseases, nutritional deficiencies, and exposure to toxins can all manifest themselves as deviations from baseline physiological states. Departures from the baseline physiology of a population can also indicate the impact of environmental changes on wildlife health and thus signal the need for strategically focusing monitoring and intervention plans (IUCN – SSC Species Conservation Planning Sub‐Committee, 2017). For example, gathering information on health parameters of sentinel species is essential to identify and measure the impacts of toxic substances in marine ecosystems (Aguirre & Tabor, 2004; Bossart, 2011). Identification of environmental threats to wildlife health may also prove significant to human public health. The potential to translate findings and adopt a transdisciplinary “one health” approach adds value and impact to wildlife health studies (Deem, 2015; Norris, 2001; Zinsstag et al., 2011).
A variety of quantitative and qualitative health assessment methods exist with different sensitivities and specificities (Stokes et al., 2010). Health assessment methods include collecting physiological, morphological, nutritional, and behavioral data; screening for diseases; identifying ecto‐ and endoparasites; determining the presence of toxins in animal tissues or blood; and investigating genetic variability of populations. Given the breadth of methods available, method selection and study design may benefit from interdisciplinary collaborations with biologists, ecologists, health professionals (e.g., epidemiologists, veterinarians, and biomedical researchers), social scientists, and policy makers to ensure study objectives are met (Goodman et al., 2013; Preece et al., 2017).
We systematically analyzed the scientific literature on wildlife health and report on the use of health assessment methods in noncaptive vertebrate wildlife. Based on our findings, we considered the potential implications of study design and diagnostic methods used for conservation and devised a framework to systematically address current gaps in wildlife health assessment studies. Because we aimed to identify trends in wildlife health literature with the potential to affect conservation outcomes, we focused on wildlife health studies in which a combination of complementary methods were used to provide a comprehensive overview on the health status of an individual and its population.
To determine whether selected studies were targeted to conservation, we explored trends in study location versus areas rich in biodiversity hotspots; conservation status of the species studied; country of study and first author's affiliation, as well as the country's human development index (HDI); establishment of cross‐border collaborations; taxa studied; sample size and study duration of all studies examined, with emphasis on studies determining reference ranges; health assessment methods used; and methods used across taxa. We sought to provide a critical approach to the challenging field of wildlife health assessments and in doing so suggest future directions to improve the effectiveness of ongoing conservation.
METHODS
Literature search and data extraction
A systematic review was conducted following PRISMA recommendations from Foster (2012). Research papers describing health assessments performed on living noncaptive wildlife were sought. Online databases searched included Web of Science (1970–2020) and Scopus (1965–2020). The search strategy, including keywords “wild *,” “health,” “assess *,” “free(‐)living,” “free(‐)ranging,” and “non(‐)captive,” yielded a total of 4708 publications after removing duplicates. The search terms were intentionally designed to be as inclusive as possible within the study scope. However, studies that did not match our keyword search and that may have provided more information would not have been included. Only peer‐reviewed original publications reporting the use of a combination of methods for evaluating wildlife health in the field were examined. Keywords were in English; however, the search also yielded articles written in other languages (i.e., Spanish, German, and Portuguese), which were also included in the analysis. Gray literature was outside the scope of this review and was therefore excluded. The search strategy is available in Appendix S1.
All vertebrate taxa were considered, thus, in this review, the term wildlife refers to vertebrate wildlife species. Studies solely examining captive animals or focusing on postmortem evaluations were removed because these were typically not general health assessments for conservation purposes. However, postmortem examination in combination with other methods is a very powerful tool. This left a total of 261 studies for full‐text assessment. From these, we extracted study characteristics, including species (scientific and common names), International Union for Conservation of Nature (IUCN) Red List status in 2020, country of study, country of primary author's affiliation, the country's HDI value, taxon studied (mammalian, avian, reptilian, amphibian, and pisces), sample size (if captive and wild animals were included in the study, we accounted for only the wild animals), study duration, evidence of cross‐border collaboration, and rationale (categorized as general health assessment study, establishment of reference ranges, disease investigation, and ecology‐based population monitoring program). We assessed the representation of publications based on the size (i.e., millions of square kilometers) of the country of study (Kozak et al., 2016) and visually examined the spatial distribution of study sites in comparison with biodiversity hotspots (Mittermeier et al., 2011). We also examined whether the lead researcher had established cross‐border or international collaborations with coauthors based abroad (i.e., whether there was evidence of multinational coauthor groups). A keyword plus and phrase analysis revealed research priorities over time. Keyword plus terms included author keywords and words or phrases that frequently appear in the titles of an article's references. Studies were also assessed based on the HDI (United Nations Development Programme, 2019). The HDI is defined as “a summary measure of average achievement in key dimensions of human development: a long and healthy life, being knowledgeable and having a decent standard of living” (United Nations Development Programme, 2019). An HDI value above 0.800 is considered very high, 0.700–0.799 high, 0.550–0.699 medium, and below 0.550 low (United Nations Development Programme, 2019). Health assessment methods used across studies were also extracted (Appendices S3 & S4). Details on the literature selection process, including the population‐intervention‐comparator‐outcome‐study design (PICOS) and the PRISMA flow diagram, are in Appendix S1.
Statistical analyses
Study characteristics were analyzed with descriptive and inferential statistics. The number of studies published per year was compared across taxa with linear models (LM). The data were highly skewed and thus log‐transformed before several linear and second‐order polynomial models were fitted. In a model selection process, based on the lowest Akaike and Bayesian information criteria (AIC and BIC, respectively), the most parsimonious LM explained the data best (lm(log[study frequency] ∼ year + taxon). Model assumptions (e.g., normality and variance homoscedasticity) were visually confirmed with diagnostic plots. Tukey's post hoc tests were used for pairwise comparisons with R's emmeans package (α = 0.05) (Lenth, 2016). The health assessment methods were analyzed across taxa with generalized linear models (GLM) (binomial distributions). Model selection and diagnostic and post hoc tests were conducted as described above. Additionally, Pearson's chi‐squared test statistics were used for pairwise comparisons when all or none of the studies of a specific taxa (i.e., fishes) used a certain method (i.e., body composition assessments and fecal analyses). Bibliometric information of the 261 selected studies was gathered from the Web of Science and Scopus core collection databases and used for several analyses in R's bibliometrix package (Aria & Cuccurullo, 2017). Specifically, a network analysis of country collaborations was conducted using the country of the primary author's affiliation. The 20 most‐used keywords plus terms (i.e., words or phrases that were used in the cited references) were used to identify trends in research priorities over time. A loess smoother was used to visualize the data in Figure 3b, and a GLM was fitted to the data in Figure 3d. Summary statistics and median occurrences of keywords are in Appendix S3. All statistical analyses and figures were made in R (version 3.6.1) (R Core Team, 2019).
Figure 3.

(a) Co‐occurrences (color, temporal appearance of keywords; red, most recent) and (b) temporal trends in the keywords used as search terms and other terms that frequently appear in the titles of an article's references and available since 1991 used in the literature on health assessments in noncaptive wildlife; (c) research collaboration networks between countries (country based on first‐author affiliation; the larger the node and heavier the line, the greater the connectivity); and (d) taxonomic groups investigated across time (n = 261 studies). In (b) and (d), data are scaled to 1990–2020, which removed 1 data point in panel (d). In (a) and (b), only the top 20 and top 10 results are presented, respectively. Interactive versions of the network visualizations can be downloaded from https://doi.org/10.25903/5f31f85aa8011.
RESULTS
The search strategy yielded 263 manuscripts describing health assessments in living noncaptive vertebrates. These manuscripts represented 261 distinct studies because 2 authors published 2 separate papers sourced from the same study (Blottner et al., 2001; Goritz et al., 2001; Labrada‐Martagon et al., 2010a ; Labrada‐Martagon et al., 2010b ). We, therefore, refer to 261 studies throughout the review.
Study characteristics of wildlife health assessment studies
Included studies were conducted in 56 different countries (Figure 1). Three studies had 2 study sites (Gallo et al., 2019; Girling et al., 2015; Grasman et al., 2000). Studies conducted in Costa Rica were most represented (78 studies/M km2), followed by studies conducted in Ecuador (36 studies/M km2), Denmark (24 studies/M km2), Slovakia (21 studies/M km2), and the United Kingdom (21 studies/M km2).
Figure 1.

Global distribution of studies of wildlife health assessments relative to area (blue, country of study; red, biodiversity hotspots) (n = 261 studies). Biodiversity hotspots are from Center for Applied Biodiversity Science at Conservation International (2011) and Mittermeier et al. (2011). An interactive version of the map is available from https://doi.org/10.25903/5f31f85aa8011.
Some studies were conducted in regions with biodiversity hotspots, including the Mediterranean Basin, Brazil, Madagascar, Mexico, India, the United States, and Australia. Underrepresented biodiversity hotspots were in Southeast Asia, the Caribbean, Middle East, Central Asia, and Africa (Figure 1). Other biodiversity conservation indices, such as the high‐biodiversity wilderness areas, were greatly underrepresented in our results. These included more intact areas, such as the Amazon Rainforest, New Guinea, the North American Desert, Congo Forests, and Miombo‐Mopane Woodlands and Savannas in southeastern Africa. Few studies were conducted on species residing in the Amazon rainforest and the North American desert.
Vertebrate wildlife species listed as nonthreatened (least concern or near threatened) on the IUCN Red List were examined in 49% (128 of 261) of the studies we assessed, whereas 45% (118) of studies examined species listed as threatened (vulnerable, endangered, or critically endangered) on the IUCN Red List (Figure 2). Of studied reptile species, 78% were listed as threatened (59 of 77). In contrast, 79% of bird species (38 of 48) and 56% of mammal species (68 of 121) examined were listed as nonthreatened. Less than 6% of all studies investigated fishes and amphibians (15 of 261).
Figure 2.

Taxonomic groups examined in studies of wildlife health assessments categorized by class and the International Union for Conservation of Nature Red List category (9) (n = 261 studies) (pink box, categories for threatened species). Nonthreatened species were examined in 49% of the studies (128 of 261).
Forty‐four percent of studies were led by researchers based in the United States (116 of 261 studies). Researchers based in European countries led 45 of the studies examined (17%), and researchers based in Australia led 26 (10%) of studies. The remaining studies were conducted by researchers distributed throughout all continents except Antarctica (28% [74]).
We found that 35% of the included studies (92 of 261) were conducted using cross‐border collaborations. For these 92 studies, 41% (38) of the study sites were in the same country as the first author's affiliation and 60% (55) were located abroad. Authors from the United States conducted the most studies (44% [116 studies out of 56 countries]) and collaborated with half the countries represented in our data set (54% [30]), followed by Australia (21% of represented countries [12]) and Germany (21% of represented countries [12]) (Figure 3c). Research priorities were specifically related to blood analysis (i.e., blood, hematology, values, chemistry, biochemistry, plasma, blood chemistry, serum, and parameters); general health‐related topics (e.g., health, reference intervals, infection, and stress); and sea turtle species (i.e., Chelonia mydas and Caretta caretta), which were the most represented species group in our review (Figure 3a, b & Appendix S3). From these, health was identified as an emerging keyword (i.e., since 2018), together with keywords, such as hematology and reference intervals, which were identified as trend topics in 2017. Other keywords, such as conservation, population, blood, and body condition, were popular from 2012 to 2016 (Figure 3a, b & Appendix S3).
We found that 80% (209 of 261) of included studies were conducted by researchers based in countries with very high HDIs, 16% (41) in countries with high HDIs, 3% (9) in countries with medium HDIs, and <1% (2) in countries with low HDIs. Two studies were conducted by researchers based in Taiwan (Fong et al., 2010; Li et al., 2015), a country that did not have an HDI category assigned.
Fifty‐five percent of studies (144 of 261) were performed within 1–2 years, and 42% (109) were conducted over 3 years. The number of studies conducted and the length of the study were inversely related (Figure 4). In terms of sample size, 10% (27) of the studies examined fewer than 20 animals, 54% (141) of the studies examined 20–99 animals, and 31% (82) of the studies examined over 100 animals. We did not find a significant correlation between study duration and sample size (r = 0.04, t 295 = 0.64, p > 0.05). Eleven studies did not provide clear information on the sample size and 8 did not comment on the study duration.
Figure 4.
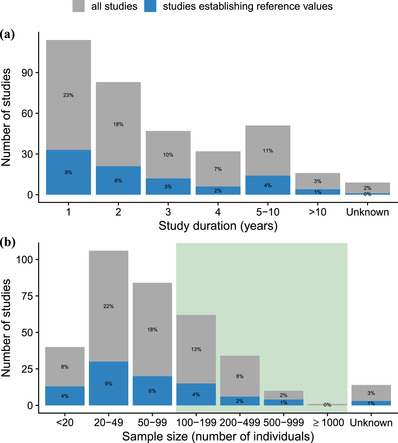
Frequency distribution of all wildlife health assessment studies examined and of the studies establishing reference ranges categorized by (a) study duration and (b) sample size (number of individuals) in each study (green box, studies that meet the recommended sample sizes for reference range studies; percentages, contribution to the overall number of studies [n=261 studies]).
Thirty percent (77 of 261) of all studies reported establishing reference ranges. Seventy‐four percent (55 of 77) did not meet the recommended sample size for medical studies (see Discussion for details), and 60% (46 of 77) were conducted within 1–2 years.
Health assessment methods used in wildlife health assessment studies
All included studies used at least 2 health assessment methods. Blood analysis (89% [232 of 261]) and body composition assessment (81% [211]) were the most frequently used, closely followed by physical examination (72% [188]) (Figure 5). Within those broad 3 categories, morphometric examination (i.e., allometric scaling) and hematological and biochemical analyses were the most commonly used subcategories. Classification into multiple categories was possible. Fecal analysis was the fourth most commonly reported general method (25% [64]) and was mainly used to detect enteric parasites but also for endocrinological analyses (e.g., cortisol levels in feces). Almost one‐eighth of the studies (13% [33]) examined environmental parameters. For example, water quality or dietary availability was assessed as a proxy measure for population health. Results of the statistical analysis of health assessment methods across taxa and an overview of all health assessment methods used are in Appendix S3. Additional results and information regarding the journal preference, trends in taxonomic class, and the rationales for conducting health assessment studies are also detailed in Appendix S3.
Figure 5.

Frequency of health assessment methods used in wildlife studies by taxonomic group: (a) blood analysis, (b) blood analysis subcategories, (c) body composition assessment, (d) body composition assessment subcategories, (e) physical examination, and (f) fecal analysis (n = 261 studies).
DISCUSSION
Based on our results, we see the need for a stronger focus on threatened species. The study deficiencies in sample size selection, particularly in studies establishing reference ranges, also need to be addressed. Our conceptual framework and our overview of health assessment methods are aimed at promoting improved data quality in strategically targeted and methodologically consistent studies of wildlife health assessment.
Biodiversity hotspots and threatened status of species
Our results highlight a spatial mismatch between study focus and biodiversity hotspots (Figure 1). This finding aligns with previous work that reports an underrepresentation of countries with both high and threatened biodiversity (Christie et al., 2021; Wilson et al., 2016). Furthermore, half the vertebrate species included in our review (49%, 128 of 261) were listed as nonthreatened on the IUCN Red List (Figure 2). Multiple factors need to be integrated and prioritized when determining study species choice and location. Funding, permits, and logistics can be complex issues to integrate with biodiversity hotspots and the threatened status of species. We found differences in the proportion of threatened and nonthreatened species examined in some taxa. Studies of reptiles were biased toward threatened species, particularly chelonians. Avian studies had a more equal representation across IUCN Red list categories. Not all vertebrate species are easily monitored in terms of environmental context and ease of capture, which is also the case for avian and fish species, and this may be why these taxa are less represented in our review.
In addition, 80% of included studies were conducted by researchers in countries with very high HDIs (209 of 261). This trend is consistent with funds for global conservation efforts being predominantly sourced from wealthier countries, often resulting in funds being disproportionately assigned to these local regions (James et al., 1999; Waldron et al., 2017). Conversely, most biodiversity hotspots are in or near countries with lower HDIs, which are often less able to fund conservation (Williams, 2011). The higher abundance of nonthreatened vertebrates as well as the reduced complexity involved in obtaining permits may also be factors motivating determination of study species. In addition, when establishing a new technique or methodology, nonthreatened species could be preferable study subjects in terms of cost availability, risk assessment, and animal ethics. Species perceived by people to be charismatic, for example, which are not always threatened, might receive more public support and therefore create more funding opportunities (Bossart, 2011; Fukushima et al., 2020; Morse‐Jones et al., 2014; Skibins et al., 2013). In our study, for instance, sea turtles were the most frequently examined reptiles. An added complexity for some species can be the discrepancy between global (e.g., IUCN) and national assessments of threat status (Brito et al., 2010; Morais et al., 2012), which might also contribute to the mismatch between biodiversity hotspots and study locations. Most countries with very high HDIs have a legislative framework to identify threatened species, such as the Environment Protection and Biodiversity Act (EPBC Act) in Australia. For example, the flatback turtle (Natator depressus) is listed on the IUCN Red List as data deficient, but as vulnerable under the EPBC Act. The vulnerable status appears to promote research studies on this species in Australia, more so than the data‐deficient status in the low HDI countries.
Cross‐border collaborations in wildlife health assessment studies
One‐third of the studies we examined (36%, 93 of 261) were conducted using cross‐border or international collaborations. Overall, the HDI level of the country of the first author's affiliation also seemed related to the number of collaborations being established, with the United States, Australia, and Germany scoring highest (Figure 3c; larger nodes and links represent higher values and stronger connectivity). International collaborations are particularly important when studying species that frequently cross jurisdictional boundaries, such as marine megafauna (Hamann et al., 2010; McClellan et al., 2014). Establishing international collaborations plays a major role in assessing wildlife populations worldwide and can be beneficial for establishing long‐term and high‐quality wildlife monitoring programs (Kark et al., 2015). Cross‐border collaborations provide access to local knowledge and possibly access to protected areas. In addition, collaborations may lead to sharing resources and equipment that might have not been available otherwise. For example, the enhanced collaboration between U.S. authors, authors with the strongest international collaboration, and Mexican authors (88% of Mexican‐led studies collaborated with U.S. authors) may be related to the Canada–Mexico–USA Trilateral Committee for Wildlife and Ecosystem Conservation and Management Agreement, established in 1996 (Váldez et al., 2006). This agreement was created to coordinate wildlife conservation and management plans among these 3 countries. Cross‐border collaborations may, therefore, not only improve the countries' relationships on ecological issues, but also on political and financial aspects.
Importance of sample size in studies establishing reference ranges
Representative sampling of a target population is vital, particularly when establishing baseline values or reference ranges. Health indicators, such as specific blood parameters, need to be defined for the species and population of interest, which implies selecting a random sample and avoiding seasonal and geographical biases that could lead to misinterpretations of health parameters. We found that 74% of the studies defining reference ranges did not reach the recommended sample size established for medical research (Figure 4) (Geffré et al., 2009; Wellek et al., 2014). Reference ranges comprise 95% of a healthy reference population (Friedrichs et al., 2012) and should therefore be defined following strict recommendations.
In medical research, sample sizes of n = 110–200, depending on assumptions on data distributions and chosen alpha levels, have been recommended for studies establishing reference ranges (Geffré et al., 2009; Wellek et al., 2014). That n be ≥120 individuals is also often suggested to determine the 90% confidence intervals of the 2.5th and 97.5th percentiles of a population when frequentist, nonparametric statistics are used (Friedrichs et al., 2012; Jennen‐Steinmetz & Wellek, 2005). The smallest possible sample size needed to determine the uncertainty of the estimate of these percentiles is 120 individuals.
Surprisingly, 71% of the studies that aimed to establish reference ranges (55 of 77 studies) examined fewer than 100 individuals and 60% were conducted within 1–2 years (46 of 77) (Figure 4). In most cases, sample size may not be at the discretion of the investigators and may be mandated by permits issued by local authorities. This may be particularly salient when looking at threatened species. Bayesian and variance component models have been suggested for calculation of reference ranges for sample sizes of fewer than 120 individuals (Hansen et al., 2007; Katki et al., 2005). Bayesian and variance component models, however, should be used only when the desired sample size cannot be reached by any other means, and both their use and the low sample size should be highlighted in the publications arising from these studies.
Establishing reliable reference ranges is important for future studies targeting the same species because the interpretation of new findings and the detection of anomalies across populations and life stages rely on the statistical robustness of the existing information (Broughton et al., 2017). The selection of the population, whether to partition by sex, age, or other factors, as well as preanalytical and analytical quality, can also strongly influence the precision and accuracy of the determined reference ranges. To avoid selection bias based on location or subpopulation traits, it is therefore advisable for researchers planning new studies and using certain diagnostic tools to critically examine previous studies that validate or establish reference ranges.
Trend topics and health assessment methods used in wildlife health assessment studies
Blood analysis was the most common health assessment method, followed by body composition assessment, physical examination, and fecal analysis (Figure 5). The importance of wildlife health in the literature is highlighted by the increase in publication output and the identified trend topics (Figure 3a and 3b). A central topic in wildlife health is the examination of blood parameters and reference ranges, as well as broader topics related to conservation, stress, or body condition. From 2010 to 2018, topics of interest have been shifting toward health (Figure 3a and 3b). Sea turtles received substantial interest, which may be related to a well‐established global network of sea turtle conservationists and health professionals (Mazaris et al., 2018).
How to choose a specific health assessment method
The choice of which method to use and which specific health parameter to measure (e.g., presence of contaminants in the blood) for each species may either identify acute or chronic conditions. In the case of long‐term monitoring programs, priority may be given to methods that identify chronic conditions affecting the target population. Most methods, except from body composition assessment methods, which include allometric scaling, are suitable for examining both acute and chronic conditions in all taxa; therefore, method selection needs to be based on the specific parameters to be assessed. For example, altered plasma glucose levels have been related to acute stress response and to chronic stress response, as indicated by increased glucose and glucocorticoid levels (Dantzer et al., 2014; Kleist et al., 2018). However, measuring unvalidated, single parameters may collate misleading information. Following the previous example, the actual stress response can only be quantified when measuring several indices of stress by, for example, combining glucocorticoid measurements with body condition assessment, heart rate, and measures of immune function and ecological exposures to stress (MacDougall‐Shackleton et al., 2019; Sheriff et al., 2011). We recommend, in addition to the most commonly used health assessment methods (i.e., physical examination, blood hematology and biochemistry, fecal analysis, and body composition assessment methods) (Figure 5), use of disease screenings to identify exposure to infectious and zoonotic agents and conducting endocrinological surveys to monitor stress levels (e.g., important in areas with high levels of human disturbance). Details on the most commonly used health assessment methods are in Appendices S3 and S4.
Framework for standardizing high‐quality wildlife health assessments
Strategically targeted, collaborative, and high‐quality research outcomes ensure studies can properly inform conservation, given the increasing number and intensity of threats to wildlife health. Wildlife health assessments provide the empirical and physiological data to examine the impact of stressors on individuals and populations. In addition, examining the physiology of animals to be translocated may improve their chances for survival, which is usually very low (Cooper et al., 2018). As a result, health assessment studies are essential for informing conservation planning, for vulnerability assessments, and for meeting global targets on biodiversity conservation (such as Aichi Target 12 and Sustainable Development Goals Target 15.5).
The framework we propose (Figure 6) is aimed at promoting improved data quality within strategically targeted and methodologically consistent wildlife health assessment studies to better facilitate conservation planning and meeting these global goals. A systematic review of wildlife health assessment literature from 1982 to 2020 sheds light on the historical trends of the field over 38 years and highlights the increasing number of studies, the focus toward specific diagnostic tools, the countries and collaborations involved in conducting health assessment studies, and the overall low sample sizes when establishing reference ranges. This broader perspective on historical and current trends may assist in developing “climate smart goals” (Stein et al., 2014) with potential conservation outcomes, such as shifting study focus levels among distinct population groups, intraspecific taxa, species, genera, and taxa; shifting geographical focus by strategically targeting biodiversity hotspots, leading edges of historical ranges, or climate refugia; altering study methods to ensure techniques appropriately assess acute and chronic impacts with adequate sample size and study duration; and determining the temporal validity of reference ranges for species in particular locations in the face of rapid climate change and environmental stressors.
Figure 6.

A conceptual framework for high‐quality wildlife health assessments. “Species conservation planning and management implications” was sourced from Betley et al. (2018), Durham et al. (2014), and IUCN – SSC Species Conservation Planning Sub‐Committee (2017).
We integrated our findings with existing framework guidelines for species conservation from the IUCN – SSC Species Conservation Planning Sub‐Committee (2017) to create a new holistic framework for high‐quality and high‐impact wildlife health assessment studies within conservation and management outcomes. We included the following aspects in the framework: background information sections, which include risk status and biodiversity assessment of the target species to ensure it warrants investment, evaluation of social and economic metrics of the countries involved to ensure resources are adequate and collaboration is promoted, and examination of previously published data on the health status of the target population, which may include established reference ranges to ensure the additional information to be collected is useful; a study design section, which considers sampling location, target population, sample size, and sampling duration, estimation of the required resources, establishment of multidisciplinary collaborations, and selection of the appropriate health assessment methods; and a data acquisition and analysis section defined based on background information and study design. The section which refers to the species’ conservation planning and management implications was adapted from Betley et al. (2018), Durham et al. (2014), and IUCN – SSC Species Conservation Planning Sub‐Committee (2017). Research questions and study designs need to be carefully weighed before commencing field work because they define the choice of methods, data analysis, results, and interpretation, which can then be used to inform stakeholder groups and conservationists (Figure 6). The study design and the selection of health assessment methods (detailed in “Health Assessment Methods Used in Wildlife Health Assessment Studies” and in Appendix S3) should be considered carefully because they are crucial to identify populations at risk and to initiate timely mitigation strategies.
Our review highlights current trends in wildlife health assessment studies. We found that most countries with very high HDIs conducted their studies on a regional level, which caused a mismatch between biodiversity hotspots and study locations. To increase the protection of these hotspots and the species inhabiting them, future work needs to focus on establishing more strategic international collaborations. Mammals and reptiles were the most commonly investigated taxa. Surprisingly, half of the species examined were listed as nonthreatened by the IUCN, which reflects the observed mismatch between biodiversity hotspots and study locations. We identified a critical need for following a standardized approach for use of health assessment methods in noncaptive vertebrate wildlife that applies statistically adequate sample sizes for establishing reference ranges and incorporates multiple life stages and populations. Our conceptual framework provides future researchers a standardized approach to integrate high‐quality health assessments in population monitoring. Standardized, validated, and multidisciplinary health assessment methods will significantly benefit wildlife management because the generation and communication of accurate findings can initiate timely and effective conservation action. Our findings will aid conservation planning in addressing the manifold challenges that populations of wildlife experience now and in the future.
Supporting information
Appendix S1. Search strategy
Appendix S2. Parameters recorded in the Microsoft Excel (version 16.31) spreadsheet to analyse the identified variables using the software R (version 3.6.1, R Core Team, 2019).
Appendix S3. Additional results
Appendix S4. Additional Information
Table S1. Summary statistics of the network analyses in Figure 3(a) and (c).
Table S2. Health assessment methods used (n=261 studies). Categories and subcategories (if required) are reported as number of studies and percentage (in brackets).
Figure S1. PRISMA flowchart showing selection procedure of papers.
Figure S2. Timeline of trend topics based on Keyword plus terms used in the analyzed literature (log‐transformed).
Additional information is available online in the Supporting Information section at the end of the online article. The authors are solely responsible for the content and functionality of these materials. Queries (other than absence of the material) should be directed to the corresponding author. Data set, references included, and interactive versions of Figures 1, 3a and c are available from https://doi.org/10.25903/5f31f85aa8011.
ACKNOWLEDGMENTS
We thank S. Rannard for her assistance with designing the search strategy. We also thank the editors and 2 anonymous reviewers for helpful comments on this manuscript. Funding for S.K. was provided by James Cook University and Sea World Research and Rescue Foundation (SWR/6/2019). B.I. was supported by a postdoctoral fellowship from the German Research Foundation (DFG, IL 220/3‐1). The funders had no role in study design, data collection and analysis, decision to publish, or preparation of the manuscript.
Article impact statement: Standardized, validated, and multidisciplinary wildlife health assessments significantly benefit species conservation management.
Literature Cited
- Aguirre, AA., & Tabor, G. M . (2004). Introduction: Marine vertebrates as sentinels of marine ecosystem health. EcoHealth, 1: 236–238. [Google Scholar]
- Aria, M. , & Cuccurullo, C . (2017). bibliometrix: An R‐tool for comprehensive science mapping analysis. Journal of Informetrics, 11, 959–975. [Google Scholar]
- Barnosky, A. D. , Matzke, N. , Tomiya, S. , Wogan, G. O. U. , Swartz, B. , Quental, T. B. , Marshall, C. , McGuire, J. L. , Lindsey, E. L. , Maguire, K. C. , Mersey, B. , & Ferrer, E. A. (2011). Has the Earth's sixth mass extinction already arrived? Nature, 471, 51–57. [DOI] [PubMed] [Google Scholar]
- Betley, E. , Sigouin, A. , Sterling, E. , Arengo, F. , Gazit, N. , & Porzecanski, A. L . (2018). Best practices for stakeholder engagement in biodiversity programming. Resource guide. Washington, DC: USAID Bureau for Economic Growth, Education, and the Environment. [Google Scholar]
- Blottner, S. , Lange, A. , Goritz, F. , Fassbender, M. , Broich, A. , Quest, M. , Gilles, M. , Lengwinat, T. , & Hildebrandt, T. B . (2001). Investigation of reproductive fitness in living male European brown hares from different habitats. Zeitschrift fur Jagdwissenschaft, 47, 84–91. [Google Scholar]
- Bossart, G. D . (2011). Marine mammals as sentinel species for oceans and human health. Veterinary Pathology, 48, 676–690. [DOI] [PubMed] [Google Scholar]
- Brito, D. , Ambal, R. G. , Brooks, T. , De Silva, N. , Foster, M. , Hao, W. , Hilton‐Taylor, C. , Paglia, A. , Rodríguez, J. P. , & Rodríguez, J. V. (2010). How similar are national red lists and the IUCN Red List? Biological Conservation, 143, 1154–1158. [Google Scholar]
- Broughton, H. M. , Govender, D. , Shikwambana, P. , Chappell, P. , & Jolles, A . (2017). Bridging gaps between zoo and wildlife medicine: Establishing reference intervals for free‐ranging african lions (Panthera leo). Journal of Zoo and Wildlife Medicine, 48, 298–311. [DOI] [PubMed] [Google Scholar]
- Ceballos, G. , Ehrlich, P. R. , Barnosky, A. D. , García, A. , Pringle, R. M. , & Palmer, T. M . (2015). Accelerated modern human–induced species losses: Entering the sixth mass extinction. Science Advances, 1, e1400253. [DOI] [PMC free article] [PubMed] [Google Scholar]
- Center for Applied Biodiversity Science at Conservation International . (2011). Biodiversity hotspots revisited. Conservation International.
- Christie, A. P. , Amano, T. , Martin, P. A. , Petrovan, S. O. , Shackelford, G. E ., Simmons, B. I. , Smith, R. K ., Williams, D. R. , Wordley, C. F. R. , & Sutherland, W. J. (2021). The challenge of biased evidence in conservation. Conservation Biology, 35, 249–262. [DOI] [PubMed] [Google Scholar]
- Cooper, C. E. , Withers, P. C. , Munns, S. L. , Geiser, F. , & Buttemer, W. A. (2018). Geographical variation in the standard physiology of brushtail possums (Trichosurus): Implications for conservation translocations. Conservation Physiology, 6(1), coy042. [DOI] [PMC free article] [PubMed] [Google Scholar]
- Dantzer, B. , Fletcher, Q. E. , Boonstra, R. , & Sheriff, M. J. (2014). Measures of physiological stress: A transparent or opaque window into the status, management and conservation of species? Conservation Physiology, 2, cou023–cou023. [DOI] [PMC free article] [PubMed] [Google Scholar]
- Deem, S. L . (2015). Conservation medicine to one health: The role of zoologic veterinarians. In Fowler's zoo and wild animal medicine (Vol. 8, pp. 698–703). Elsevier. [Google Scholar]
- Deem, S. L. , Karesh, W. B. , & Weisman, W . (2001). Putting theory into practice: Wildlife health in conservation. Conservation Biology, 15, 1224–1233. [Google Scholar]
- Durham, E. , Baker, H. , Smith, M. , Moore, E. , & Morgan, V . (2014). The BiodivERsA stakeholder engagement handbook. Paris: BiodivERsA. [Google Scholar]
- Fong, C.‐L. , Chen, H.‐C. , & Cheng, I.‐J . (2010). Blood profiles from wild populations of green sea turtles in Taiwan. Journal of Veterinary Medicine and Animal Health, 2, 008–010. [Google Scholar]
- Foster, R. L . (2012). Reporting guidelines: Consort, Prisma, and Squire. Journal for Specialists in Pediatric Nursing, 17, 1–2. [DOI] [PubMed] [Google Scholar]
- Friedrichs, K. R. , Harr, K. E. , Freeman, K. P. , Szladovits, B. , Walton, R. M. , Barnhart, K. F. , & Blanco‐Chavez, J . (2012). ASVCP reference interval guidelines: Determination of de novo reference intervals in veterinary species and other related topics. Veterinary Clinical Pathology, 41, 441–453. [DOI] [PubMed] [Google Scholar]
- Fukushima, C. S. , Mammola, S. , & Cardoso, P . (2020). Global wildlife trade permeates the Tree of Life. Biological Conservation, 247, 108503. [DOI] [PMC free article] [PubMed] [Google Scholar]
- Gallo, L. , Vanstreels, R. E. T. , Cook, R. A. , Karesh, W. B. , & Uhart, M . (2019). Hematology, plasma biochemistry, and trace element reference values for free‐ranging adult Magellanic penguins (Spheniscus magellanicus). Polar Biology, 42, 733–742. [Google Scholar]
- Geffré, A. , Friedrichs, K. , Harr, K. , Concordet, D. , Trumel, C. , & Braun, J.‐P . (2009). Reference values: A review. Veterinary Clinical Pathology, 38, 288–298. [DOI] [PubMed] [Google Scholar]
- Girling, S. J. , Campbell‐Palmer, R. , Pizzi, R. , Fraser, M. A. , Cracknell, J. , Arnemo, J. , & Rosell, F . (2015). Haematology and serum biochemistry parameters and variations in the eurasian beaver (Castor fiber). PLoS One, 10.1371/journal.pone.0128775. [DOI] [PMC free article] [PubMed] [Google Scholar]
- Goodman, G. , Hedley, J. , & Meredith, A . (2013). Field techniques in zoo and wildlife conservation work. Journal of Exotic Pet Medicine, 22, 58–64. [Google Scholar]
- Goritz, F. , et al. (2001). Investigations of reproductive fitness in living female European brown hares from different habitats. Zeitschrift für Jagdwissenschaft, 47, 92–99. [Google Scholar]
- Grasman, K. A. , Armstrong, M. , Hammersley, D. L. , PF S., & Fox, G. A . (2000). Geographic variation in blood plasma protein concentrations of young herring gulls (Larus argentatus) and Caspian terns (Sterna caspia) from the Great Lakes and Lake Winnipeg. Comparative Biochemistry and Physiology ‐ C Pharmacology Toxicology and Endocrinology, 125: 365–375. [DOI] [PubMed] [Google Scholar]
- Hamann, M. , Godfrey, M. H. , Seminoff, J. A. , Arthur, K. , Barata, P. C. R. , Bjorndal, K. A. , Bolten, A. B. , Broderick, A. C. , Campbell, L. M. , Carreras, C. , Casale, P. , Chaloupka, M. , Chan, S. K. F. , Coyne, M. S. , Crowder, L. B. , Diez, C. E. , Dutton, P. H. , Epperly, S. P. , FitzSimmons, N. N. …, Godley, B. J . (2010). Global research priorities for sea turtles: Informing management and conservation in the 21st century. Endangered Species Research, 11, 245–269. [Google Scholar]
- Hansen, Å. M. , Garde, A. H. , & Eller, N. H . (2007). Estimation of individual reference intervals in small sample sizes. International Journal of Hygiene and Environmental Health, 210, 471–478. [DOI] [PubMed] [Google Scholar]
- IUCN (International Union for Conservation of Nature) – SSC (Species Conservation Planning Sub‐Committee) . (2017). Guidelines for species conservation planning. Version 1.0. Gland, Switzerland: IUCN. [Google Scholar]
- James, A. N. , Gaston, K. G. , & Balmford, A. (1999). Balancing the Earth's accounts. Nature, 401, 323–324. [DOI] [PubMed] [Google Scholar]
- Jennen‐Steinmetz, C. , & Wellek, S . (2005). A new approach to sample size calculation for reference interval studies. Statistics in Medicine, 24, 3199–3212. [DOI] [PubMed] [Google Scholar]
- Kark, S. , Tulloch, A. , Gordon, A. , Mazor, T. , Bunnefeld, N. , & Levin, N . (2015). Cross‐boundary collaboration: Key to the conservation puzzle. Current Opinion in Environmental Sustainability, 12, 12–24. [Google Scholar]
- Katki, H. A. , Engels, E. A. , & Rosenberg, P. S . (2005). Assessing uncertainty in reference intervals via tolerance intervals: Application to a mixed model describing HIV infection. Statistics in Medicine, 24, 3185–3198. [DOI] [PubMed] [Google Scholar]
- Kleist, N. J. , Guralnick, R. P. , Cruz, A. , Lowry, C. A. , & Francis, C. D . (2018). Chronic anthropogenic noise disrupts glucocorticoid signaling and has multiple effects on fitness in an avian community. Proceedings of the National Academy of Sciences, 115, E648. [DOI] [PMC free article] [PubMed] [Google Scholar]
- Kozak, J. , Kaim, D. , & Szwagrzyk, M . (2016). Is conservation research not happening where it is most needed? Comments to Wilson et al. PLoS Biology, 10.1371/journal. pbio. 1002413. [DOI] [PMC free article] [PubMed] [Google Scholar]
- Labrada‐Martagon, V. , Mendez‐Rodriguez, L. C. , Gardner, S. C. , Cruz‐Escalona, V. H. , & Zenteno‐Savin, T . (2010a). Health indices of the green turtle (Chelonia mydas) along the Pacific Coast of Baja California Sur, Mexico. II. Body condition index. Chelonian Conservation and Biology, 9, 173–183. [Google Scholar]
- Labrada‐Martagon, V. , Mendez‐Rodriguez, L. C. , Gardner, S. C. , Lopez‐Castro, M. , & Zenteno‐Savin, T . (2010b). Health indices of the green turtle (Chelonia mydas) along the Pacific Coast of Baja California Sur, Mexico. I. Blood biochemistry values. Chelonian Conservation and Biology, 9, 162–172. [Google Scholar]
- Lenth, R. V . (2016). Least‐squares means: The R package lsmeans. Journal of Statistical Software, 10.18637/jss.v069.i01. [Google Scholar]
- Li, T.‐H. , Chang, C.‐C. , Cheng, I.‐J. , & Lin, S.‐C . (2015). Development of a summarized health index (SHI) for use in predicting survival in sea turtles. PLoS One, 10, e0120796. [DOI] [PMC free article] [PubMed] [Google Scholar]
- MacDougall‐Shackleton, S. A. , Bonier, F. , Romero, L. M. , & Moore, I. T . (2019). Glucocorticoids and “stress” are not synonymous. Integrative Organismal Biology, 1(1), obz017 [DOI] [PMC free article] [PubMed] [Google Scholar]
- Mazaris, A. D. , Gkazinou, C. , Almpanidou, V. , & Balazs, G . (2018). The sociology of sea turtle research: Evidence on a global expansion of co‐authorship networks. Biodiversity and Conservation, 27, 1503–1516. [Google Scholar]
- McClellan, C. M. , Brereton, T. , Dell'Amico, F. , Johns, D. G. , Cucknell, A.‐C. , Patrick, S. C. , Penrose, R. , Ridoux, V. , Solandt, J.‐L. , Stephan, E. , Votier, S. C. , Williams, R. , & Godley, B. J. (2014). Understanding the distribution of marine megafauna in the English Channel region: Identifying key habitats for conservation within the busiest seaway on earth. PLoS One, 9, e89720. [DOI] [PMC free article] [PubMed] [Google Scholar]
- Mittermeier, R. A. , Turner, W. R. , Larsen, F. W. , Brooks, T. M. , & Gascon, C . (2011). Global biodiversity conservation: The critical role of hotspots. In: Zachos, F. E. & Habel, J. C. , Biodiversity hotspots (pp. 3–22). Springer. [Google Scholar]
- Morais, A. R. , Braga, R. T. , Bastos, R. P. , & Brito, D . (2012). A comparative analysis of global, national, and state red lists for threatened amphibians in Brazil. Biodiversity & Conservation, 21, 2633–2640. [Google Scholar]
- Morse‐Jones, S. , Bateman, I. J. , Kontoleon, A. , Ferrini, S. , Burgess, N. D. , & Turner, R. K . (2014). Stated preferences for tropical wildlife conservation amongst distant beneficiaries: Charisma, endemism, scope and substitution effects in valuing ecosystem services. Edward Elgar Publishing. [Google Scholar]
- Norris, S . (2001). A new voice in conservation: Conservation medicine seeks to bring ecologists, veterinarians, and doctors together around a simple unifying concept: Health. Bioscience, 51, 7–12. [Google Scholar]
- Preece, N. D. , Abell, S. E. , Grogan, L. , Wayne, A. , Skerratt, L. F. , van Oosterzee, P. , Shima, A. L. , Daszak, P. , Field, H. , Reiss, A. , Berger, L. , Rymer, T. L. , Fisher, D. O. , Lawes, M. J. , Laurance, S. G. , McCallum, H. , Esson, C. , & Epstein, J. H. (2017). A guide for ecologists: Detecting the role of disease in faunal declines and managing population recovery. Biological Conservation, 214, 136–146. [Google Scholar]
- R Core Team . (2019). R: A language and environment for statistical computing. Vienna: R Foundation for Statistical Computing. [Google Scholar]
- Scheele, B. C. , Legge, S. , Blanchard, W. , Garnett, S. , Geyle, H. , Gillespie, G. , Harrison, P. , Lindenmayer, D. , Lintermans, M. and Robinson, N. (2019). Continental‐scale assessment reveals inadequate monitoring for threatened vertebrates in a megadiverse country. Biological Conservation, 235, 273–278. [Google Scholar]
- Sheriff, M. J. , Dantzer, B. , Delehanty, B. , Palme, R. , & Boonstra, R . (2011). Measuring stress in wildlife: Techniques for quantifying glucocorticoids. Oecologia, 166, 869–887. [DOI] [PubMed] [Google Scholar]
- Skibins, J. C. , Powell, R. B. , & Hallo, J. C . (2013). Charisma and conservation: Charismatic megafauna's influence on safari and zoo tourists’ pro‐conservation behaviors. Biodiversity & Conservation, 22, 959–982. [Google Scholar]
- Stein, B. A. , Glick, P. , Edelson, N. , & Staudt, A. (2014). Climate‐smart conservation: Putting adaptation principles into practice. Washington, DC: National Wildlife Federation. [Google Scholar]
- Stokes, E. J. , Johnson, A. , & Rao, M. (2010). Monitoring wildlife populations for management. Vientiane: Wildlife Conservation Society and the National University of Laos. [Google Scholar]
- Tompkins, D. M. , Carver, S. , Jones, M. E. , Krkošek, M. , & Skerratt, L. F . (2015). Emerging infectious diseases of wildlife: A critical perspective. Trends in Parasitology, 31, 149–159. [DOI] [PubMed] [Google Scholar]
- United Nations Development Programme . (2019). 'Human development index (HDI)'. New York: United Nations. [Google Scholar]
- Váldez, R. , Guzmán‐Aranda, J. C. , Abarca, F. J. , Tarango‐Arámbula, L. A. , & Sánchez, F. C . (2006). Wildlife conservation and management in Mexico. Wildlife Society Bulletin, 34, 270–282. [Google Scholar]
- Waldron, A. , Miller, D. C. , Redding, D. , Mooers, A. , Kuhn, T. S. , Nibbelink, N. , Roberts, J. T. , Tobias, J. A. , & Gittleman, J. L . (2017). Reductions in global biodiversity loss predicted from conservation spending. Nature, 551: 364–367. [DOI] [PubMed] [Google Scholar]
- Wellek, S. , Lackner, K. J. , Jennen‐Steinmetz, C. , Reinhard, I. , Hoffmann, I. , & Blettner, M . (2014). Determination of reference limits: Statistical concepts and tools for sample size calculation. Clinical Chemistry and Laboratory Medicine (CCLM), 52, 1685–1694. [DOI] [PubMed] [Google Scholar]
- Williams, J. N . (2011). Human population and the hotspots revisited: A 2010 assessment. In: Biodiversity hotspots (pp. 61–81). Springer. [Google Scholar]
- Wilson, K. A. , Auerbach, N. A. , Sam, K. , Magini, A. G. , Moss, A. S. L. , Langhans, S. D. , Budiharta, S. , Terzano, D. , & Meijaard, E . (2016). Conservation research is not happening where it is most needed. PLoS Biology, 14, e1002413. [DOI] [PMC free article] [PubMed] [Google Scholar]
- Zinsstag, J. , Schelling, E. , Waltner‐Toews, D. , & Tanner, M . (2011). From “one medicine” to “one health” and systemic approaches to health and well‐being. Preventive Veterinary Medicine, 101, 148–156. [DOI] [PMC free article] [PubMed] [Google Scholar]
Associated Data
This section collects any data citations, data availability statements, or supplementary materials included in this article.
Supplementary Materials
Appendix S1. Search strategy
Appendix S2. Parameters recorded in the Microsoft Excel (version 16.31) spreadsheet to analyse the identified variables using the software R (version 3.6.1, R Core Team, 2019).
Appendix S3. Additional results
Appendix S4. Additional Information
Table S1. Summary statistics of the network analyses in Figure 3(a) and (c).
Table S2. Health assessment methods used (n=261 studies). Categories and subcategories (if required) are reported as number of studies and percentage (in brackets).
Figure S1. PRISMA flowchart showing selection procedure of papers.
Figure S2. Timeline of trend topics based on Keyword plus terms used in the analyzed literature (log‐transformed).
Additional information is available online in the Supporting Information section at the end of the online article. The authors are solely responsible for the content and functionality of these materials. Queries (other than absence of the material) should be directed to the corresponding author. Data set, references included, and interactive versions of Figures 1, 3a and c are available from https://doi.org/10.25903/5f31f85aa8011.