

Abstract
Objective
The hippocampus is connected to 2 distinct cortical brain networks, the posterior–medial and the anterior–temporal networks, involving different medial temporal lobe (MTL) subregions. The aim of this study was to assess the functional alterations of these 2 networks, their changes over time, and links to cognition in Alzheimer's disease.
Methods
We assessed MTL connectivity in 53 amyloid‐β–positive patients with mild cognitive impairment and AD dementia and 68 healthy elderly controls, using resting‐state functional magnetic resonance imaging, cross‐sectionally and longitudinally. First, we compared the functional connectivity of the posterior–medial and anterior–temporal networks within the control group to highlight their specificities. Second, we compared the connectivity of these networks between groups, and between baseline and 18‐month follow‐up in patients. Third, we assessed the association in the connectivity changes between the 2 networks, and with cognitive performance.
Results
We found decreased connectivity in patients specifically between the hippocampus and the posterior–medial network, together with increased connectivity between several MTL subregions and the anterior–temporal network. Moreover, changes in the posterior–medial and anterior–temporal networks were interrelated such that decreased MTL–posterior–medial connectivity was associated with increased MTL–anterior–temporal connectivity. Finally, both MTL–posterior–medial decrease and MTL–anterior–temporal increase predicted cognitive decline.
Interpretation
Our findings demonstrate that longitudinal connectivity changes in the posterior–medial and anterior–temporal hippocampal networks are linked together and that they both contribute to cognitive decline in Alzheimer's disease. These results shed light on the critical role of the posterior–medial and anterior–temporal networks in Alzheimer's disease pathophysiology and clinical symptoms. ANN NEUROL 2021;90:391–406
The hippocampus is a complex structure connected to 2 cortical networks, the anterior–temporal (AT) and posterior–medial (PM) networks. 1 , 2 , 3 , 4 , 5 On the one hand, the anterior–lateral portion of the entorhinal cortex and the perirhinal cortex are mainly connected to the AT cortical network, which includes the anterior ventrolateral temporal cortex, lateral orbitofrontal cortex, and amygdala. 2 , 3 , 4 , 5 , 6 , 7 , 8 On the other hand, the posterior‐medial portion of the entorhinal cortex and the parahippocampal cortex are mainly connected to the PM cortical network, which includes regions of the default mode network (DMN), as well as the thalamus and the occipital cortex. 2 , 3 , 4 , 5 , 6 , 7 The AT and the PM networks both converge with the hippocampus with an anteroposterior gradient, the AT network being more connected to the anterior part of the hippocampus, whereas the PM network is more connected to the posterior part.
The AT and PM networks are of particular interest regarding Alzheimer's disease (AD) pathophysiology. First, the interaction between the AT and PM networks is critical to episodic memory formation, which is impaired in AD. 4 , 9 Second, recent studies have demonstrated that the AT and PM networks are selectively vulnerable to AD pathology in cognitively normal elderly subjects, with tau targeting the AT network, whereas amyloid‐β pathology preferentially affects the PM network. 10 , 11
Previous studies widely reported decreased functional connectivity between the hippocampus and regions of the DMN included in the PM network, such as the posterior cingulate cortex, in patients with AD 12 , 13 , 14 , 15 or mild cognitive impairment (MCI). 16 , 17 Conversely, studies investigating the connectivity between the medial temporal lobe (MTL) and the AT network are limited and not consistent, as both increased 18 and decreased 16 , 19 connectivity have been reported. Intra‐MTL connectivity increases have also been reported in MCI and AD patients. 16 , 17 , 20 , 21 , 22 Altogether, little is known about AD–related changes in MTL‐PM and MTL‐AT functional connectivity and their relationships with cognitive decline. More importantly, no longitudinal study on MTL connectivity in AD has been conducted to date, although it is particularly relevant, given that connectivity changes might reflect dynamic processes over the course of the disease.
In the present study, we sought to investigate the changes in the functional connectivity of the AT and PM networks in amyloid‐β–positive MCI and AD patients, with individually segmented MTL subregions as seeds, using both a cross‐sectional and a longitudinal approach.
First, we assessed the changes in the connectivity of MTL subregions with the AT and PM networks in patients on the Alzheimer continuum compared to healthy elderly controls, cross‐sectionally and, over an 18‐month follow‐up period, longitudinally. Second, we investigated whether MTL‐AT and MTL‐PM connectivity changes over time were related. Finally, we investigated the relationships between these connectivity changes and cognitive performance in patients, cross‐sectionally and longitudinally.
Patients and Methods
Participants
One hundred twenty‐one participants from the Imagerie Multimodale de la Maladie d'Alzheimer à un stade Précoce (IMAP) cohort in Caen, France, were recruited in the present study, including 53 cognitively impaired patients on the Alzheimer continuum (ie, with a positive florbetapir–positron emission tomography [PET] scan using previously published methods), with amnesic MCI (n = 27) or AD dementia (n = 26), 23 and 68 cognitively unimpaired healthy elderly controls, all amyloid‐β‐negative. All participants were required to have exploitable structural and resting‐state functional magnetic resonance imaging (fMRI) scans. For the longitudinal analyses, 30 patients (14 patients with amnesic MCI and 16 patients with AD dementia) who had available and exploitable repeated scans at follow‐up (18 months later as a mean) were included.
All participants were right‐handed, native French‐speakers, had at least 7 years of education, and had no history of alcoholism, drug abuse, head trauma, or psychiatric disorder. Patients met the National Institute on Aging/Alzheimer's Association (NIA‐AA) 2011 criteria for amnesic MCI due to AD 24 or probable AD dementia with amnestic presentation 25 and were all on the Alzheimer continuum according to the new NIA‐AA criteria. 26 They were recruited from local memory clinics. Healthy elderly controls were recruited from the community and performed within the normal range on all neuropsychological tests from a cognitive battery assessing multiple domains of cognition.
The IMAP Study was approved by a French regional ethics committee and is registered with http://clinicaltrials.gov (number NCT01638949). Participants gave written informed consent to the study prior to the investigation.
Neuropsychological Assessment
Global cognitive efficiency was assessed using the Mini‐Mental State Evaluation (MMSE). Mean z score of standard neuropsychological tests were also computed for 3 different domains: episodic memory, executive functions, and semantic memory. For this purpose, performances from different tasks of each cognitive domain were z‐transformed based on the scores of the healthy elderly control group. Details on neuropsychological measures and composite scores are provided in Table 1.
TABLE 1.
Demographic Characteristics
| Characteristic | Cross‐Sectional Data | p | Longitudinal Data, Patients, n = 30 | ||
|---|---|---|---|---|---|
| Healthy Elderly Controls, n = 68 | Patients, n = 53 | ||||
| Baseline | Follow‐up | ||||
| Age, yr | 68.2 ± 7.8 | 70.8 ± 8.8 | 0.07 | 71.5 ± 8.5 | 73.2 ± 8.5 |
| Gender, F/M | 39/29 | 22/31 | 0.08 | 9/21 | — |
| Education, yr | 12.2 ± 3.7 | 11.4 ± 3.6 | 0.28 | 12.6 ± 3.6 | — |
| MMSE | 28.9 ± 1.2 | 23.1 ± 5.2 | < 0.001 | 23.8 ± 4.3 | 21.6 ± 5.6 |
| Episodic memory z score | 0.0 ± 0.9 | −13.8 ± 9.1 | −13.2 ± 8.0 | −15.8 ± 8.3 | |
| Executive function z score | 0.0 ± 0.8 | ‐0.9 ± 0.9 | −0.7 ± 1.0 | −1.1 ± 0.9 | |
| Semantic memory z score | 0.0 ± 1.0 | −1.4 ± 0.9 | −0.7 ± 1.0 | −1.6 ± 0.9 | |
Episodic memory z score = Free and Cued Selective Reminding Test total recall and total delayed recall; Executive function z score = 2‐minute verbal letter fluency and backward digit span; Semantic memory z score = 2‐minute verbal category fluency.
F = female; M = male; MMSE = Mini‐Mental State Examination.
Neuroimaging Data Acquisition
All participants were scanned on the same MRI and PET cameras, a Philips (Best, the Netherlands) Achieva 3.0T scanner and a Discovery RX VCT 64 PET‐CT device (GE Healthcare, Chicago, IL), respectively. A high‐resolution T1‐weighted anatomical volume was acquired using a 3‐dimensional (3D) fast‐field echo sequence (sagittal, repetition time = 20 milliseconds, echo time = 4.6 milliseconds, flip angle = 10°, 180 slices with no gap, slice thickness = 1mm, field of view = 256 × 256mm2, in‐plane resolution = 1 × 1mm2). Resting‐state functional volumes were obtained using an interleaved 2D T2*SENSitivity Encoding (SENSE) echo planar imaging (EPI) sequence designed to reduce geometric distortions using parallel imaging, short echo time, and small voxels (axial, SENSE = 2, repetition time = 2,382 milliseconds, echo time = 30 milliseconds, flip angle = 80°, 42 slices with no gap, slice thickness = 2.8mm, field of view = 224 × 224mm2, in plane resolution = 2.8 × 2.8mm2, 280 volumes, acquisition time = 11.5 minutes).
Neuroimaging Data Preprocessing
Resting‐State fMRI Preprocessing
Individual resting‐state fMRI datasets were first checked for artifacts using the TSDiffAna routines. Briefly, a variance volume was created for each subject to check that most signal variability was restricted to the cortex. Datasets showing evidence for significant movements (>3mm translation or 1.5 rotation) associated with image artifacts and/or an abnormal variance distribution were excluded from subsequent analyses. Data were then processed using previously published methods, with slice timing correction, realignment to the first volume, and spatial normalization within the native space to correct for the distortion effects. 27 EPI volumes were then coregistered on the corresponding anatomical MRI images, normalized to the Montreal Neurological Institute (MNI) space applying the normalization parameters of the anatomical MRI, and smoothed with a 4mm full‐width at half‐maximum (FWHM) Gaussian kernel. Resulting images were then temporally bandpass filtered (0.01 < frequencies < 0.08Hz) and masked to include only gray matter voxels, taking into account signal loss in EPI volumes. The gray matter mask was obtained by combining the group mean T1 gray matter mask and a mask based on the mean non–EPI‐T2* volumes in the MNI space, including only voxels with values greater than 0.25 in both mean volumes, similar to previously published methods. 28
Regions of Interest Definition: Segmentation of Medial Temporal Lobe Subregions
An automatic segmentation of MTL subregions was performed for each participant with Automatic Segmentation of Hippocampal Subfields (ASHS‐T1) software, using individual T1‐weighted images. We segmented the anterior and posterior hippocampus, the perirhinal cortex, and the parahippocampal cortex, and we combined the left and right segments to have a single bilateral seed per region. Thus, 4 MTL seeds (anterior and posterior hippocampus, perirhinal and parahippocampal cortex) were generated for each subject.
Neuroimaging Data Analysis
First‐Level Resting‐State fMRI Data Analysis
Resting‐state fMRI images were processed using SPM12 and the MarsBaR toolbox (v0.44) in the following steps. First, for each of the 4 MTL subregions, positive correlations were assessed between the mean time course in the seed and the time course of each gray matter voxel, resulting in 4 whole‐brain connectivity maps for each subject. To account for signal dropout, voxels of each seed were thresholded with an implicit mask of 0.8 corresponding to the global cortical signal for each subject at the first‐level analysis. All voxels survived this threshold for each participant and each MTL seed. To remove potential sources of spurious variance, the time courses from white matter, cerebrospinal fluid, the whole brain, their derivatives, and the 6 movement parameters generated from realignment of head motion were introduced as covariates. A Fisher z transformation and a 6mm FWHM smoothing were finally applied to the individual connectivity maps.
Second, to compute the brain connectivity pattern at a group level, for each MTL subregion seed, connectivity maps were entered into a 1‐sample t test routine with age, years of education, and total gray matter volume as covariates. The statistical parametric mapping (SPM)‐T maps derived from each seed were thresholded at p (uncorrected) < 0.005 with a cluster extent size (k) > 200 voxels and binarized to be used as inclusive masks in second‐level analyses. Here, we set a lenient threshold (uncorrected for multiple tests), as our goal was only to use the resulting binary masks to limit the follow‐up (group comparison) analyses to the voxels that were truly connected (even if poorly) to each region of interest (ROI), so that follow‐up analyses (comparisons of connectivity strength) could be restricted to these regions.
Characterizing the AT and PM Networks in the Control Group
To characterize the AT and PM networks in the control group, we performed a paired t test between the individual connectivity maps of the perirhinal and parahippocampal cortex seeds, as these MTL subregions specifically belong to one or the other network, similar to previously published methods. 3 , 5 Two of the 4 ROIs from each subject (the perirhinal and the parahippocampal seeds) were thus used to generate the AT and PM networks. We defined (1) the AT network as the regions more strongly connected to the perirhinal seed than to the parahippocampal seed, and (2) the PM network as the regions more strongly connected to the parahippocampal seed than to the perirhinal seed. Our goal was to confirm that the AT network (ie, perirhinal > parahippocampal seed) preferentially involves the anterior part of the hippocampus, whereas the PM network (ie, parahippocampal > perirhinal seed) preferentially involves the posterior part of the hippocampus. The 2 resulting SPM‐T maps were binarized and superimposed to illustrate their overlap. Note that they were only used for the sake of illustration (for qualitative overlap with results from other analyses).
To investigate the projection of the AT and PM networks on the hippocampus, we superimposed the binarized SPM‐T maps corresponding to the AT and PM networks onto the surface of a hippocampal 3D view, using publicly available BrainVISA software (v4.6; www.brainvisa.info), similar to previously published methods. 29
Alterations in MTL Connectivity: Cross‐Sectional and Longitudinal Analyses
To assess patients' connectivity alterations in MTL subregions, we performed 2‐sample t tests between individual connectivity maps of patients versus healthy elderly controls for each MTL subregion (ie, anterior hippocampus, posterior hippocampus, perirhinal and parahippocampal cortices). Age, years of education, and total gray matter volume were used as covariates, and the mask of the 1‐sample connectivity map of the corresponding seed was used as search space.
We then assessed functional connectivity changes for each MTL subregion between baseline and follow‐up in the patient group. We performed paired t tests between baseline and follow‐up connectivity maps of patients. Baseline and follow‐up ages and total gray matter were entered as covariates and the mask of the 1‐sample connectivity map of the corresponding seed was used as search space. For the sake of the comparison, longitudinal changes in MTL functional connectivity were also assessed within the healthy elderly controls.
Results of the cross‐sectional and longitudinal analyses were superimposed onto the AT and PM networks defined above in the control group so as to determine how much they overlapped with these 2 networks. In addition, the same results were also overlaped on masks reflecting amyloid‐β and tau deposition topography in AD to investigate the spatial overlap of our connectivity results and the 2 main AD pathological landmarks. The mask reflecting amyloid‐β deposition was obtained by averaging the partial‐volume effect (PVE)‐corrected normalized and scaled florbetapir‐PET images of all our patients. Because tau‐PET data were not available in our sample, we used publicly available data from the study by La Joie et al 30 to compute the mask of tau‐deposition in amyloid‐β–positive patients with MCI and AD dementia. For both masks, we set the threshold so that only the regions with the highest accumulation of amyloid‐β and tau were highlighted.
For all voxelwise comparisons, a p (uncorrected) < 0.005 with a cluster extent determined by an iterative procedure for estimating cluster‐level false‐positive rates (Monte Carlo simulation) with 10,000 iterations was used to achieve a corrected statistical significance of p < 0.05 (AFNI 3dClustSim program, v18.0.11). 31 , 32 We performed additional correction for multiple tests across analyses with a threshold of p < 0.00625 (ie, for several tests being run, for 4 ROIs and 2 contrasts resulting in 8 analyses). Furthermore, we ran the same analyses using nonparametric permutation testing, thresholded using threshold‐free cluster enhancement (TFCE) and familywise error (FWE) correction for multiple comparisons at p < 0.05, with the randomise algorithm of FMRIB Software Library. 33
Statistical Analyses
Partial Correlation Analyses
As a next step, partial correlation analyses were conducted to investigate whether individual differences in connectivity were associated with cognitive performance, cross‐sectionally. The mean connectivity values of each subject extracted from clusters showing altered connectivity in patients was correlated with cognitive scores, across all participants and within each group. Pearson partial correlations were used, controlling for age and education and corrected for multiple comparisons using false discovery rate (FDR) correction to correct for n = 36 analyses (3 clusters × 4 cognitive scores × 3 groups), with a threshold of p < 0.05.
Linear Mixed‐Effects Models
Then, linear mixed‐effects models were used to investigate the relationship between MTL‐PM and MTL‐AT connectivity changes over time in patients. This was done only for the seeds showing connectivity changes within both the AT and the PM networks over time. We looked at the effects of MTL‐PM connectivity on MTL‐AT connectivity and the reverse relationship (effects of MTL‐AT on MTL‐PM connectivity). To this aim, the mean MTL‐PM and MTL‐AT connectivity values extracted from clusters showing connectivity changes in patients at follow‐up were entered as dependent variables. Connectivity and baseline and follow‐up ages were included as fixed effects, and a random intercept was included for each subject. The results were corrected for multiple comparisons using FDR correction for the n = 4 analyses (2 seeds × 2 relationships) with a threshold of p < 0.05.
Finally, we assessed the relationship between MTL‐PM and MTL‐AT connectivity changes and cognitive performance longitudinally in patients. Cognitive scores were entered as dependent variables. Connectivity values and baseline and follow‐up ages were included as fixed effects, and a random intercept was included for each subject. The results were corrected for multiple comparisons using FDR correction to correct for the n = 20 analyses (5 clusters × 4 cognitive scores) with a threshold of p < 0.05.
All linear mixed models were estimated in R v3.6.2 (www.r-project.org) using the nlme package and the restricted maximum likelihood approach.
Results
Patients had a mean age of 70.8 ± 8.8 years and comprised 22 (42%) women. Healthy elderly controls had a mean age of 68.2 ± 7.8 years and included 39 (57%) women. Patients did not differ from controls in age, gender, or education level (see Table 1).
AT and PM Networks in Healthy Elderly Controls
The perirhinal network included the whole medial temporal lobe, temporal pole, fusiform gyrus, inferior, middle, and superior temporal gyri, and orbitofrontal, posterior cingulate, and retrosplenial cortices, bilaterally. The parahippocampal network included the whole medial temporal lobe, temporal pole, fusiform gyrus, inferior, middle, and superior temporal gyri, anterior and posterior cingulate cortices, precuneus, retrosplenial cortex, posterior thalamus, and inferior parietal, medial orbitofrontal, superior and middle frontal, and occipital cortices, bilaterally. The perirhinal and parahippocampal networks overlapped in the medial temporal lobe, temporal pole, inferior, middle, and superior temporal gyri, fusiform gyrus, posterior lateral and inferior temporal cortex, and medial orbitofrontal and retrosplenial cortices (Fig 1A–C).
FIGURE 1.
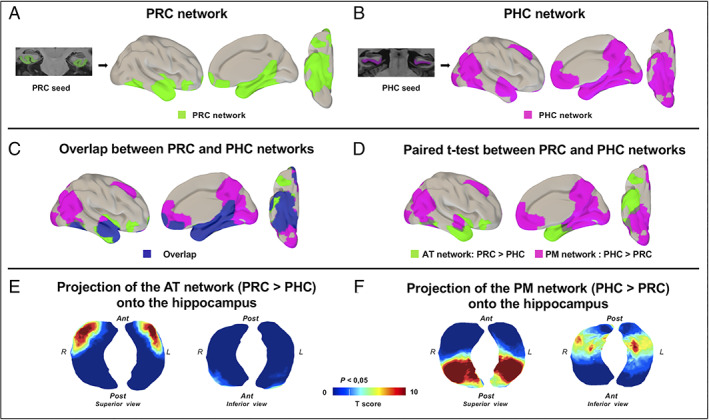
Anterior–temporal (AT) and posterior–medial (PM) networks in controls. (A, B) perirhinal cortex (PRC; A) and parahippocampal cortex (PHC; B) networks in the healthy elderly control group, applying 1‐sample t tests. (C) The overlap between PRC and PHC networks is displayed in dark blue. (D) The comparison between PRC and PHC networks with paired t tests was used to define the specific AT and PM networks. (E, F) The AT network (E) corresponding to the PRC > PHC paired t test and the PM network (F) corresponding to the PHC > PRC paired t test were projected onto the hippocampus surface views. The AT network projected onto the anterior part of the hippocampus, whereas the PM network projected onto the posterior part of the hippocampus. For all results, maps were thresholded at p < 0.05 cluster‐level corrected using a Monte Carlo simulation. Ant = anterior; L = left side; Post = posterior; R = right side. [Color figure can be viewed at www.annalsofneurology.org]
The direct comparison between the perirhinal and parahippocampal networks allowed us to specifically highlight the AT and PM networks (see Fig 1D). The regions showing significantly higher connectivity with the perirhinal cortex than with the parahippocampal cortex included the anterior hippocampus, entorhinal cortex, amygdala, temporal pole, anterior inferior, middle and superior temporal gyri, anterior fusiform gyrus, posterior lateral and inferior temporal cortex, lateral orbitofrontal cortex, and a small segment of the inferior insular cortex. They were labeled as the AT network. In contrast, the regions showing significantly higher connectivity with the parahippocampal cortex than with the perirhinal cortex included the posterior hippocampus, precuneus, cuneus, retrosplenial and posterior cingulate cortices, posterior fusiform gyrus, middle and superior temporal gyri, lateral and medial occipital, lateral parietal, ventromedial prefrontal, superior frontal, and anterior cingulate cortices, and posterior thalamus. These regions were labeled as the PM network. The projections of those networks onto the hippocampal 3D surface view showed that the AT network is projected on the anterior part of the hippocampus, whereas the PM network is projected on the posterior part of the hippocampus (see Fig 1E,F). This illustrates the anteroposterior gradient of the AT and PM connections to the hippocampus.
Cross‐Sectional Alterations in MTL Connectivity in Patients
The comparison of the anterior hippocampal functional connectivity between patients and controls revealed significant decreases in patients in the right angular gyrus, belonging to the PM network (t = 3.82, p < 0.05 cluster‐level corrected).
Increased functional connectivity was found in patients compared to controls between the anterior hippocampus and perirhinal cortex seeds and left anterior medial temporal regions (entorhinal and perirhinal cortices; t = 3.65 and t = 3.97, p < 0.05 cluster‐level corrected; Fig 2 and Table 2). The result of the perirhinal seed was the only one to survive after correction at the cluster level for the number of seeds. In addition, only the result of increased perirhinal connectivity in patients was recovered at a threshold of p < 0.05, using TFCE, FWE corrected.
FIGURE 2.
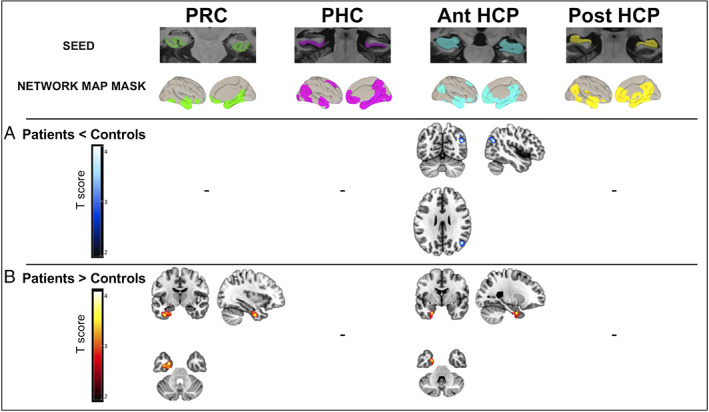
Cross‐sectional alterations in medial temporal lobe (MTL) subregion functional connectivity in patients on the Alzheimer continuum compared to healthy elderly controls. Between‐group difference maps illustrate clusters of significantly (A) reduced (in blue to white scale) or (B) increased (in red to yellow scale) connectivity in patients compared to controls for perirhinal cortex (PRC), parahippocampal cortex (PHC), and anterior (Ant) and posterior (Post) hippocampus (HCP); (combinaison of right and left segments for each MTL subregion). For each MTL subregion, the functional connectivity analysis was restricted to voxels within the corresponding MTL subregion network mask map identified within each group. Two‐sample t tests were used, and results were thresholded at p < 0.05 cluster‐level corrected using a Monte Carlo simulation. T score maps were superimposed onto the Montreal Neurological Institute brain template. [Color figure can be viewed at www.annalsofneurology.org]
TABLE 2.
Cross‐Sectional and Longitudinal Alterations in Medial Temporal Lobe Subregion Functional Connectivity
| Contrast | Seed | Brain Region | MNI Coordinates | T Value | Cluster Size | ||
|---|---|---|---|---|---|---|---|
| Patients < controls | Ant HCP | Angular gyrus R | 45 | −66 | 26 | 3.71 | 455 |
| Patients > controls | Ant HCP | ERC L | −26 | −2 | −34 | 3.65 | 386 |
| PRC L | |||||||
| PRC | ERC L | −27 | −2 | −30 | 3.97 | 1014 | |
| PRC L | |||||||
| Follow‐up < baseline | Ant HCP | Posterior cingulate cortex L | 0 | −56 | 27 | 4.09 | 657 |
| Posterior cingulate cortex R | |||||||
| Precuneus R and L | |||||||
| Angular gyrus L | −39 | −78 | 38 | 3.85 | 558 | ||
| Post HCP | Inferior parietal lobule L | −34 | −78 | 34 | 4.29 | 308 | |
| Posterior cingulate cortex R | 3 | −36 | 33 | 3.95 | 406 | ||
| Posterior cingulate cortex L | |||||||
| Angular gyrus R | 39 | −58 | 34 | 3.92 | 231 | ||
| Follow‐up > baseline | Ant HCP | Temporal middle R | 50 | 3 | −20 | 4.11 | 370 |
| Temporal superior R | |||||||
| Temporal pole R | |||||||
| Post HCP | Temporal pole R | 50 | 6 | −22 | 3.93 | 182 | |
| Temporal superior R | |||||||
| Temporopolar middle R | |||||||
| PRC | Temporal middle R | 54 | −8 | −20 | 4.46 | 830 | |
| Temporal inferior R | |||||||
| Temporal pole R | |||||||
Two‐sample t tests (patients compared with controls) and paired t tests (patients at follow‐up compared with patients at baseline), cluster‐level corrected using Monte Carlo simulation, p < 0.05.
Ant = anterior; ERC = entorhinal cortex; HCP = hippocampus; L = left; MNI = Montreal Neurological Institute; Post = posterior; PRC = perirhinal cortex; R = right. For each cluster, the region listed in bold corresponds to the location of the peak, i.e., the most significant voxel of the cluster.
Furthermore, regions showing increased MTL‐AT connectivity in patients spatially overlapped with regions of highest tau deposition only, whereas regions showing decreased MTL‐PM connectivity overlapped with regions of both highest tau and highest amyloid‐β deposition (Fig 3A).
FIGURE 3.
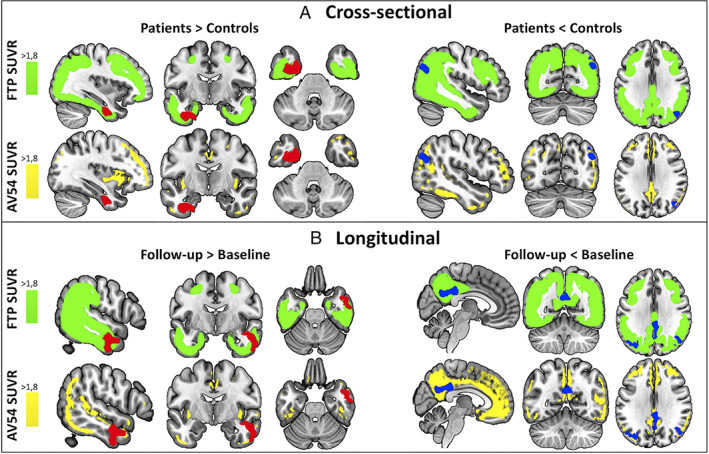
Spatial overlap between the results of the cross‐sectional (A) and longitudinal (B) connectivity analyses and binarized masks of the deposition of tau (flortaucipir [FTP]) and amyloid (florbetapir [AV45]) pathology in Alzheimer's disease. Maps show regions of highest standard uptake value ratio (SUVR) values of flortaucipir in amyloid‐β–positive patients with mild cognitive impairment and AD dementia from an external study (in green) and regions of highest SUVR of florbetapir in the patients on the Alzheimer continuum of the current study (in yellow; t > 1.8 for both maps). Results of increased connectivity in patients (in red, on the left) overlap with regions of highest tau deposition. Results of decreased connectivity in patients (in blue, on the right) overlap with both regions of highest tau deposition and regions of highest amyloid deposition. [Color figure can be viewed at www.annalsofneurology.org]
These results were not related to the temporal signal‐to‐noise ratio, as it was not different between groups and was not correlated with connectivity in regions where increases or decreases were found in patients compared to controls.
Longitudinal Changes in MTL Functional Connectivity in Patients
Significant functional connectivity decreases over time from baseline to follow‐up were found in patients between the anterior and posterior hippocampal seeds and regions belonging to the PM network (precuneus, posterior cingulate cortex, bilateral angular gyrus, and left inferior parietal lobule; t = 4.09 and t = 4.29, p < 0.05 cluster‐level corrected).
Significant functional connectivity increases over time from baseline to follow‐up were found in patients between (1) the anterior and posterior hippocampal seeds and the right superior and middle temporal gyri, and temporal pole, belonging to the AT network (t = 4.11 and t = 4.69, p < 0.05 cluster‐level corrected); and (2) the perirhinal cortex seed and the right inferior and middle temporal gyri, and temporal pole, belonging to the AT network (t = 4.46, p < 0.05 cluster‐level corrected; Fig 4 and Table 2). All results survived after correction at the cluster level for the number of seeds. In addition, all but 1 (4 of 5) of the results were recovered at a threshold of p < 0.05, using TFCE, FWE corrected.
FIGURE 4.
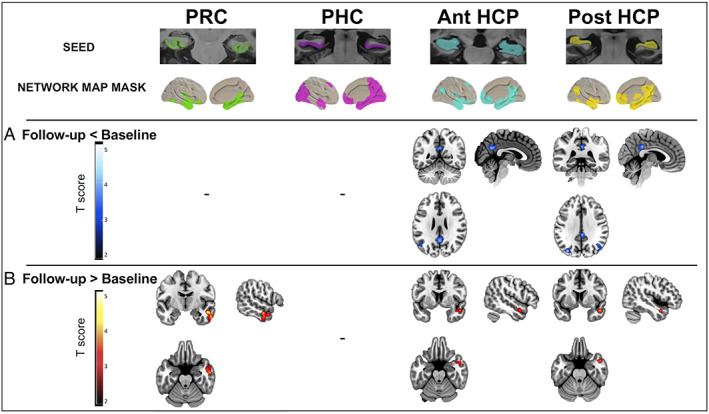
Longitudinal changes in medial temporal lobe (MTL) subregion functional connectivity over time in patients on the Alzheimer continuum from baseline to 18‐month follow‐up. Group difference maps illustrate clusters of significantly (A) reduced (in blue to white scale) or (B) increased (in red to yellow scale) connectivity from baseline to follow‐up in patients for perirhinal cortex (PRC), parahippocampal cortex (PHC), and anterior (Ant) and posterior (Post) hippocampus (HCP); (combinaison of right and left segments for each MTL subregion). For each MTL subregion, the functional connectivity analysis was restricted to voxels within the corresponding subregion network map mask identified within the patient group at baseline. Paired t tests were used, and all results were thresholded at p < 0.05 cluster‐level corrected using a Monte Carlo simulation. T score maps were superimposed onto the Montreal Neurological Institute brain template. [Color figure can be viewed at www.annalsofneurology.org]
Furthermore, regions showing increased MTL‐AT connectivity in patients spatially overlapped with regions of highest tau deposition only, whereas regions showing decreased MTL‐PM connectivity overlapped with regions of both highest tau and highest amyloid‐β deposition (Fig 3B).
The pattern found in controls was opposite from that found in patients, with significant functional connectivity decreases between the posterior hippocampus seeds and the left middle and superior temporal gyrus and temporal pole, belonging to the AT network (t = 3.97 and t = 3.42, p < 0.05 cluster‐level corrected) and significant functional connectivity increases between (1) the anterior hippocampus seed and the medial prefrontal cortex, belonging to the PM network (t = 4.28, p < 0.05 cluster‐level corrected); and (2) the posterior hippocampal seed and the posterior cingulate cortex, belonging to the PM network (t = 4.57, p < 0.05 cluster‐level corrected).
The results of the cross‐sectional and longitudinal analyses are summarized in Figure 5.
FIGURE 5.
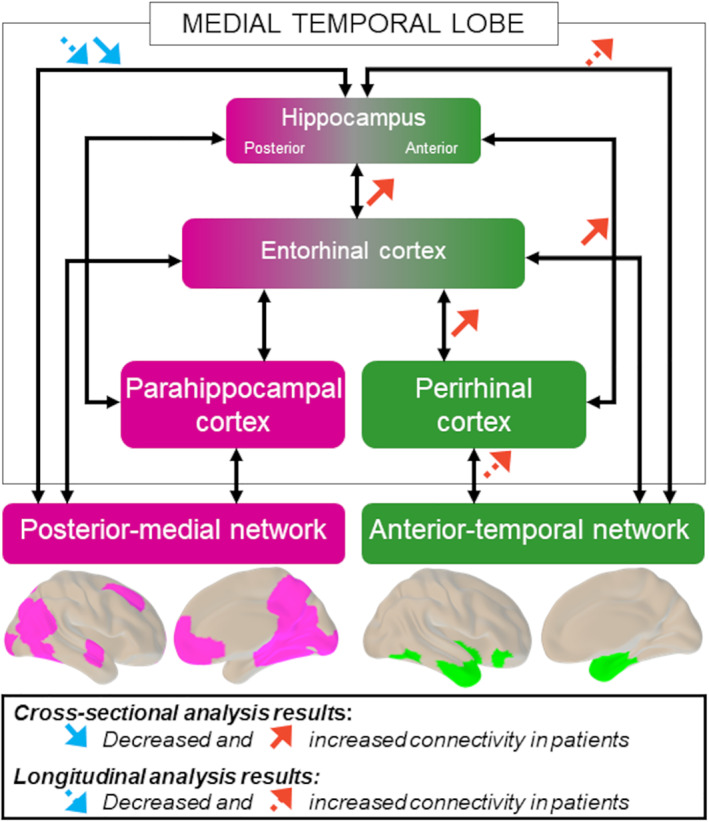
Summary of results of the cross‐sectional and longitudinal analyses. Cross‐sectional alterations in medial temporal lobe subregion connectivity in the patient group compared to controls are represented with solid arrows. Longitudinal changes over time in patients from baseline to follow‐up are represented with dashed arrows. Decreased connectivity (blue arrows) predominantly affects the posterior–medial network, whereas increased connectivity (red arrows) predominantly affects the anterior–temporal network. [Color figure can be viewed at www.annalsofneurology.org]
Association between MTL‐PM and MTL‐AT Network Connectivity Changes over Time
Linear mixed models showed that decreased hippocampus–PM connectivity was associated with increased hippocampus–AT connectivity, for both the anterior and the posterior hippocampal seeds (anterior hippocampus: β = −0.52, p = 0.012; posterior hippocampus: β = −0.59, p = 0.012; Fig 6). The relationship in the opposite direction was also significant, with increased hippocampus–AT connectivity being associated with decreased hippocampus–PM connectivity, for both the anterior and posterior hippocampus seeds (anterior hippocampus: β = −0.23, p = 0.016; posterior hippocampus: β = −0.18, p = 0.036).
FIGURE 6.
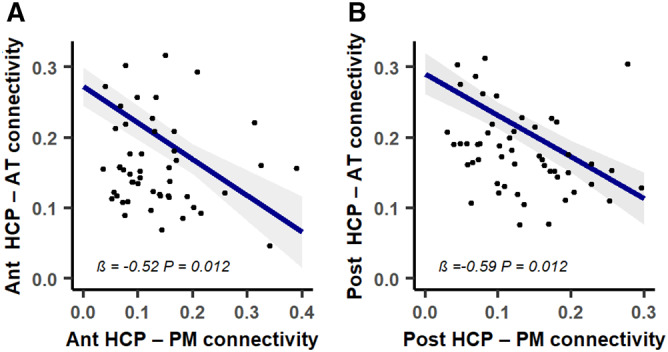
Associations between medial temporal lobe (MTL)–posterior–medial (PM) connectivity decreases and MTL–anterior–temporal (AT) connectivity increases over time in patients. Decreased anterior (Ant; A) and posterior (Post; B) hippocampus (HCP)‐PM network connectivity predicted increased anterior and posterior HCP‐AT network connectivity over time, respectively. Blue lines represent fitted regressions from the linear mixed‐effect models. The shaded area around the fit line shows 95% confidence intervals. All p values were adjusted with false discovery rate correction. [Color figure can be viewed at www.annalsofneurology.org]
Association between MTL‐AT/PM Connectivity Changes and Cognition
Assessing the correlations between MTL connectivity alteration and cognitive performance cross‐sectionally revealed no significant relationships after FDR correction.
Assessing the links between MTL connectivity changes and cognitive performance over time in patients revealed that both decreased MTL‐PM connectivity and increased MTL‐AT connectivity were associated with cognitive decline over time (Fig 7): (1) decreased connectivity between MTL subregions and the PM network was associated with decreased performance in global cognition (anterior hippocampus: p = 0.038), episodic memory (anterior hippocampus: p = 0.037; posterior hippocampus: p = 0.038), and semantic memory (anterior hippocampus: p = 0.026; posterior hippocampus: p = 0.050); and (2) increased connectivity between MTL subregions and the AT network was associated with decreased performance in global cognition (posterior hippocampus: p = 0.012; perirhinal cortex: p = 0.012), semantic memory (posterior hippocampus: p = 0.037), and executive functions (anterior hippocampus: p = 0.038; posterior hippocampus: p = 0.038).To test for possible opposite effect in the early (MCI) versus late (AD dementia) stages of the disease, we assessed the interactive effects of the subgroup (MCI or AD) on the relationships between connectivity and cognition over time. No interactive effect of the subgroup was found in the significant relationships described above. Testing these relationships separately within each subgroup showed that the effects of connectivity on cognition were significant in the AD dementia subgroup only. In addition, connectivity changes in the control group were not significantly associated with cognitive changes.
FIGURE 7.
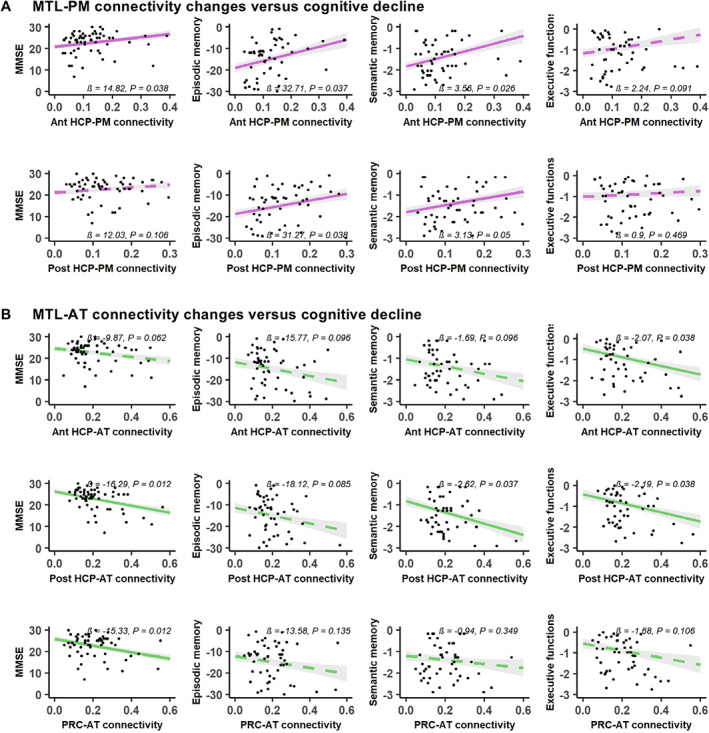
Relationship between and medial temporal lobe (MTL)–posterior–medial (PM) or MTL–anterior–temporal (AT) network connectivity changes over time and cognitive decline in patients. Both decreased MTL‐PM connectivity (A), in pink, and increased MTL‐AT connectivity (B), in green, are associated with lower cognitive scores over time. Predicted Mini‐Mental State Evaluation (MMSE) scores, episodic memory, semantic memory, and executive composite z scores are plotted over changes in connectivity. Colored lines represent fitted regressions from the linear mixed‐effect models. The shaded area around the fit line shows 95% confidence intervals. All p values were adjusted with false discovery rate correction. Significant results are represented with solid lines and nonsignificant results with dashed lines. Ant = anterior; HCP = hippocampus; Post = posterior; PRC = perirhinal cortex. [Color figure can be viewed at www.annalsofneurology.org]
Discussion
In this study, we found decreased connectivity between the hippocampus and regions of the PM network, together with increased connectivity in the left anterior MTL and between MTL subregions and regions of the AT network, in AD patients. In addition, we highlighted an association between decreased MLT‐PM and increased MTL‐AT network connectivity over time. Importantly, we showed that both decreased MTL‐PM and increased MTL‐AT network connectivity over time were associated with cognitive decline. Moreover, we showed that these MTL‐cortical connectivity changes over time were specific to AD, as amyloid‐β‐negative healthy controls showed an opposite pattern of changes over time.
Functional Isolation of the Hippocampus from the PM Network Contributes to Memory Decline
Both our cross‐sectional and longitudinal analyses revealed decreased functional connectivity in patients on the Alzheimer continuum between the hippocampus and regions of the PM network belonging to the posterior DMN, which is consistent with previous studies. 12 , 13 , 14 , 15 , 16 , 17 Here, we showed that these modifications are observed in a selected sample of amyloid‐β–positive patients with a greater likelihood of AD etiology. Moreover, we found that the decreases specifically concerned the hippocampus, but not the other MTL subregions, suggesting that disconnection processes specifically operate through the hippocampus. Finally, we showed for the first time that these changes are measurable over time in patients on the Alzheimer continuum, illustrating the sensitivity of this technique to track the progression of the disease. Importantly, healthy elderly controls showed a reverse AT/PM connectivity pattern over time, with decreased MTL‐AT and increased MTL‐PM connectivity. This finding indicates that the MTL connectivity changes observed in AD are distinct from those occurring in physiological aging.
In the cross‐sectional analysis, decreased connectivity was only observed between the anterior part of the hippocampus and regions of the PM network, whereas it concerned both the anterior and posterior hippocampus in the longitudinal analysis. The disconnection between the anterior hippocampus and regions of the PM network might appear to be counterintuitive, as the anterior hippocampus is classically described as specifically involved in the AT network. However, it is important to keep in mind that both networks converge on the whole (anterior and posterior) hippocampus, although PM regions are more strongly connected to the posterior than to the anterior part. Interestingly a similar finding has recently been shown in amyloid‐β–positive MCI patients. 16 In the longitudinal analysis, both the anterior and posterior hippocampus were disconnected from PM regions in patients. 16 This suggests that regions of the PM network first become disconnected from the hippocampus through the anterior hippocampus; then, as the disease progresses, the disconnection process propagates to the whole hippocampus, isolating the hippocampus from the PM network.
We found that the hippocampal disconnection targeted the posterior regions of the DMN, known to be particularly vulnerable in AD. Thus, the posterior DMN shows early functional disconnection 34 , 35 , 36 and amyloid‐β deposition, 37 , 38 possibly reflecting a higher vulnerability of brain hubs. 28 , 35 , 39
Our findings reveal a link between longitudinal disconnection between the hippocampus and the PM network and episodic memory decline over time in patients. This is consistent with several previous reports showing that hippocampus–PM network functional connectivity is critical for successful episodic memory formation. 4 , 27 , 40 , 41 , 42 This link was not found in the patient group in our cross‐sectional analysis, likely illustrating the higher sensitivity of longitudinal analyses, which considerably reduce interindividual variability, and/or this relationship being stronger as the disease progresses. Interestingly, decreased hippocampus–PM connectivity was also associated with decreased semantic memory (see also below), but not executive functions, suggesting a specific role for the hippocampus–PM network in memory formation. Hence, our results offer further evidence that the functional isolation of the hippocampus from the PM network contributes to episodic and semantic memory decline in AD.
Increased MTL‐AT Network Connectivity over Time Contributes to Cognitive Decline
In addition to decreased functional connectivity, we also found increased connectivity in patients on the Alzheimer continuum within anterior MTL subregions cross‐sectionally (anterior hippocampus, perirhinal and entorhinal cortex), which is consistent with previous studies. 16 , 17 , 21 , 22 , 43 In addition, we showed for the first time that increased connectivity also extends to regions of the AT network over time.
Discrepant findings have been reported regarding MTL‐AT connectivity, including both increases 18 and decreases, 16 , 19 which likely reflects differences in the studied patient sample (eg, severity, and presence of amyloid deposition) or in the methodology (eg, previous studies did not use individual seeds and/or did not assess AT vs PM medial temporal lobe networks separately).
It is still debated whether increased functional connectivity reflects aberrant neuronal activity or compensatory processes. In the present study, increased connectivity was associated with decreased cognitive performance, supporting the hypothesis of aberrant and deleterious neuronal activity. Whereas some studies similarly found a negative association between increased connectivity and cognition, 20 , 21 , 44 the reverse relationship was reported in other studies. 18 , 43 It is possible that both mechanisms (compensation and aberrant neuronal activity) are involved in different stages—for example, that MTL hyperconnectivity is a compensatory mechanism in the earliest stages of the disease and then becomes inefficient or deleterious later on. 45 Examples of such dynamics could be found in the literature, for example, in a previous study showing a compensatory increase in frontal acetyltransferase activity in MCI patients, whereas it was reduced in patients with AD dementia. 46 Our exploratory analyses did not demonstrate distinct relationships between connectivity and cognition in MCI versus early dementia stages, but we might not have the statistical power to detect such differential effects. Further studies specifically designed to assess the early (SCD/early MCI) versus late (late MCI/dementia) stages of the disease are needed. In addition, connectivity changes were not associated with changes in cognition in the healthy elderly control group. This suggests that the links between MTL connectivity changes and cognitive decline observed in the patient group are specific to AD, whereas distinct connectivity processes might be involved in ageing‐related cognitive decline. However, it is possible that we lack variability in the cognitive scores to detect such relationships, given that a 5‐year longitudinal study demonstrated a relationship between increased posterior MTL connectivity and steeper decline in episodic memory in healthy older adults. 47
Increased MTL‐AT connectivity was found to be associated with decreased performance in global cognition, semantic memory, and executive functions. The relationship between semantic memory and MTL‐AT connectivity is consistent with convergent evidence from healthy subjects and patients with semantic dementia suggesting that semantic processing is underpinned by the AT network. 48 , 49 , 50 , 51 However, it is noteworthy that semantic memory was also found to be associated with connectivity in the MTL‐PM network. This could be because although semantic processing is mainly supported by the AT network, it could also rely on other regions including PM and frontal regions. 52 Alternatively, this could result from the dedifferentiation of the AT and PM networks, with reduced segregation and decreased specialization related to AD associated with Aβ and tau deposition, or to ageing. 10 , 53 , 54 , 55
Alternatively, increased connectivity could be related to other mechanisms, such as neuroinflammation processes, which might modulate functional connectivity, 56 or tau accumulation (see below). 11 , 57
MTL‐PM Decreased Connectivity and MTL‐AT Increased Connectivity Are Interrelated
Our findings suggest a relationship between increased hippocampus–AT connectivity and decreased hippocampus–PM network connectivity. This association suggests that decreased MTL‐PM and increased MTL‐AT connectivity do not occur independently but that they are underpinned by a common mechanism that affects both AT and PM networks simultaneously. The evaluation of the link between MTL‐PM decreased and MTL‐AT increased connectivity mirrors the network failure quotient made available in the Alzheimer's Disease Neuroimaging Initiative, which reflects a ratio of increased and decreased connectivity capturing network failure in response to amyloid and tau pathologies. 35 , 58 , 59 This is also in line with a recent model proposing that the disconnection between the MTL and the PM network causes intra‐MTL hyperconnectivity. 60 This model is supported by studies showing associations between hippocampocortical disconnection and increased local hippocampus connectivity in healthy older adults and AD patients. 20 , 44 Going further, we suggest that increased intra‐MTL connectivity, possibly resulting from the functional disconnection of the hippocampus from the PM network, extends to increased MTL‐AT network connectivity as the disease progresses. The relative preservation of the AT network in AD could explain why hyperconnectivity targets the AT but not the PM network. 38 The interaction between the AT and PM hippocampal networks thus appears to be a key mechanism in the pathophysiology and the clinical symptoms of AD, and to be measurable over time. This highlights the sensitivity, as well as the clinical relevance, of this measure. Although the MTL functional connectivity changes might not be useful to monitor AD pathology itself (ie, the amount of amyloid and tau deposition), it might be useful to assess to what extent AD pathology alters brain network integrity, at both preclinical and clinical stages of the disease. As such, MTL connectivity changes could be useful in clinical trials to track the progression of the disease, notably to stress the effect of a treatment, to help with the differential diagnosis, and/or to inform about the disease prognosis. However, to use such an MTL connectivity biomarker at an individual level, harmonization across techniques and countries, as well as validation in terms of sensibility, specificity, and classification accuracy (through receiver operating characteristic curves) across the whole AD spectrum would be required. Future works are needed to determine the usefulness of AT/PM hippocampal network connectivity for early and differential diagnosis, for prognosis, and to track the progression of the disease in clinical trials. Our study also points to the AT and PM networks as potentially relevant targets for future noninvasive neuromodulation therapies in AD.
MTL‐PM Decreased Connectivity and MTL‐AT Increased Connectivity Differentially Overlap with Regions of Highest Tau and Amyloid‐β Deposition
The overlap of our connectivity results with amyloid and tau masks showed that MTL‐PM connectivity decrease overlapped with amyloid and tau pathologies, whereas MTL‐AT connectivity increase was only found in regions of highest tau load.
That clusters with decreased MTL‐PM connectivity colocalized with both regions of highest tau and highest amyloid‐β deposition reinforces the possibly deleterious role of amyloid‐β pathology in MTL‐PM disconnection 60 and further suggests that tau might also be involved in this disconnection. On the other hand, we found clusters with increased intra‐MTL and MTL‐AT connectivity to colocalize with regions of highest tau only, which is consistent with previous reports showing that tau preferentially affects the AT compared to the PM network. 10 , 61 , 62 This suggests that increased connectivity is particularly associated with the presence of local tau deposition and/or could not occur in regions of highest amyloid deposition. This could be related either to an aberrant hyperexcitability associated with tau‐induced disruption of inhibitory synapses, 63 or to a compensatory mechanism in response to neural loss associated with tau pathology. Taken together, this suggests that MTL‐PM decreased versus MTL‐AT increased connectivity could reflect that amyloid‐β and tau burden differentially affects the PM and AT networks. 10 , 61 , 62
Limitations
This study has several limitations. First, the sample size of the patient group at follow‐up was relatively small. In addition, our group of patients merged individuals at different clinical stages of the Alzheimer continuum (MCI and dementia). Future longitudinal studies separating the different stages, subjective cognitive decline, MCI, and dementia, with larger sample sizes are needed to capture the full temporal dynamic of increased and decreased MTL connectivity in AD and the relationship with cognitive performance. Second, as we were looking for subtle differences across groups and longitudinally, we used a cluster‐level corrected threshold with Monte Carlo simulation, which is less rigorous than the nonparametric FWE‐corrected approach. Five of 8 of our results, however, survived nonparametric permutation testing, thresholded using TFCE and corrected for FWE at p < 0.05, demonstrating their robustness. The results that did not survive this threshold would need replication in independent cohorts. Third, the absence of tau‐PET assessment is also a limitation in this study. It would have been useful both to further characterize the population according to the amyloid, tau, and neurodegeneration (ATN) framework, 26 and to assess the relationship between MTL‐AT/PM connectivity changes and tau pathology, as highlighted in recent studies. 10 , 62 To tackle the absence of tau‐PET assessment, we used publicly available data from the study of La Joie et al 30 and overlapped our connectivity results with a mask reflecting the pattern of tau deposition in patients with AD. Fourth, assessment of executive functions was limited as the scores used to define the composite executive score did not allow encompassing all aspects of this cognitive function (ie, planification, abstract reasoning, task shifting, conflict monitoring and/or inhibition). Future studies using more complete and specific measures of cognitive functions are needed to further investigate the relationship between MTL‐AT/PM connectivity and cognition in MCI and AD patients.
Conclusions
In summary, this is the first study to provide a full picture of the MTL subregion functional connectivity with both cross‐sectional and longitudinal analyses in amyloid‐β–positive patients on the Alzheimer continuum. We show, consistently with previous studies, that decreases specifically affect the functional connectivity between the hippocampus and the PM network, whereas increases mainly occur within the MTL and in the AT network. Moreover, we show for the first time changes in the MTL connectivity over time within both the AT and the PM networks (with increased MTL‐AT and decreased MTL‐PM connectivity) in AD. Another novel finding of this paper is that MTL‐PM connectivity decreases and MTL‐AT connectivity increases are two interrelated mechanisms. Importantly, we found that both MTL‐PM and MTL‐AT changes are associated with AD‐related cognitive decline. Further longitudinal studies, also including neuroinflammation and tau brain measures, are needed to better understand the dynamic and underlying mechanisms of these decreased and increased connectivity processes, as well as their links with cognitive deficits throughout the clinical spectrum of AD, from subjective cognitive decline to dementia.
Author Contributions
S.D., Drs F.E., D.V., V.d.l.S., and G.C. contributed to the conception and design of the study; S.D., Dr R.d.F., B.L., Dr G.P., and Dr N.D. contributed to the acquisition and analysis of data; S.D., Dr R.d.F., B.L., Drs M.V., V.d.l.S., and G.C. contributed to drafting the text or preparing the figures.
Potential Conflict of Interest
Nothing to report.
Acknowledgments
This work was supported by the Programme Hospitalier de Recherche Clinique (PHRCN 2011‐A01493‐38 and PHRCN 2012 12‐006‐0347), Agence Nationale de la Recherche (ANR LONGVIE 2007), Fondation Plan Alzheimer (Alzheimer Plan 2008–2012), Association France Alzheimer et maladies apparentées AAP 2013, Région Basse Normandie, Institut National de la Santé et de la Recherche Médicale, and European Union's Horizon 2020 Research and Innovation Program (667696).
We thank the patients and healthy volunteers of the IMAP study; C. André, E. Arenaza‐Urquijo, A. Bejanin, A. Chocat, A. Cognet, J. Dayan, M. Delarue, B. Desgranges, S. Egret, F. Felisatti, M. Fouquet, M. Gaubert, J. Gonneaud, E. Kuhn, R. La Joie, M. Leblond, A. Manrique, K. Mevel, F. Mézenge, I. Moulinet, J. Mutlu, V. Ourry, L. Paly, A. Pélerin, A. Perrotin, A. Quillard, G. Rauchs, C. Schupp, C. Tomadesso, E. Touron, F. Viader, N. Villain, C. Ware, and Cyceron staff members for their help with data acquisition; and R. la Joie and G. D. Rabinovici for making available tau‐PET data from their study as well as the public repository NeuroVault.
Data Availability
Data supporting the findings of this study are available from the corresponding author on request.
References
- 1. Lavenex P, Amaral DG. Hippocampal‐neocortical interaction: a hierarchy of associativity. Hippocampus 2000;10:420–430. [DOI] [PubMed] [Google Scholar]
- 2. Kahn I, Andrews‐Hanna JR, Vincent JL, et al. Distinct cortical anatomy linked to subregions of the medial temporal lobe revealed by intrinsic functional connectivity. J Neurophysiol 2008;100:129–139. [DOI] [PMC free article] [PubMed] [Google Scholar]
- 3. Libby LA, Ekstrom AD, Ragland JD, Ranganath C. Differential connectivity of perirhinal and parahippocampal cortices within human hippocampal subregions revealed by high‐resolution functional imaging. J Neurosci 2012;32:6550–6560. [DOI] [PMC free article] [PubMed] [Google Scholar]
- 4. Ranganath C, Ritchey M. Two cortical systems for memory‐guided behaviour. Nat Rev Neurosci 2012;13:713–726. [DOI] [PubMed] [Google Scholar]
- 5. Zhuo J, Fan L, Liu Y, et al. Connectivity profiles reveal a transition subarea in the parahippocampal region that integrates the anterior temporal–posterior medial systems. J Neurosci 2016;36:2782–2795. [DOI] [PMC free article] [PubMed] [Google Scholar]
- 6. Navarro Schröder T, Haak Koen V, Zaragoza Jimenez Nestor I, Beckmann Christian F, Doeller Christian F. Functional topography of the human entorhinal cortex. eLife. 2015;4. 10.7554/elife.06738. [DOI] [PMC free article] [PubMed] [Google Scholar]
- 7. Maass A, Berron D, Libby LA, et al. Functional subregions of the human entorhinal cortex. Elife 2015;4:e06426. [DOI] [PMC free article] [PubMed] [Google Scholar]
- 8. Schultz H, Sommer T, Peters J. Direct evidence for domain‐sensitive functional subregions in human entorhinal cortex. J Neurosci 2012;32:4716–4723. [DOI] [PMC free article] [PubMed] [Google Scholar]
- 9. Cooper RA, Ritchey M. Cortico‐hippocampal network connections support the multidimensional quality of episodic memory. Elife 2019;8:e45591. [DOI] [PMC free article] [PubMed] [Google Scholar]
- 10. Maass A, Berron D, Harrison TM, et al. Alzheimer's pathology targets distinct memory networks in the ageing brain. Brain 2019;142:2492–2509. [DOI] [PMC free article] [PubMed] [Google Scholar]
- 11. Adams JN, Maass A, Harrison TM, et al. Cortical tau deposition follows patterns of entorhinal functional connectivity in aging. Elife 2019;8:e49132. [DOI] [PMC free article] [PubMed] [Google Scholar]
- 12. Wang L, Zang Y, He Y, et al. Changes in hippocampal connectivity in the early stages of Alzheimer's disease: evidence from resting state fMRI. Neuroimage 2006;31:496–504. [DOI] [PubMed] [Google Scholar]
- 13. Greicius MD, Srivastava G, Reiss AL, Menon V. Default‐mode network activity distinguishes Alzheimer's disease from healthy aging: evidence from functional MRI. Proc Natl Acad Sci U S A 2004;101:4637–4642. [DOI] [PMC free article] [PubMed] [Google Scholar]
- 14. Zhou Y, Dougherty JH, Hubner KF, et al. Abnormal connectivity in the posterior cingulate and hippocampus in early Alzheimer's disease and mild cognitive impairment. Alzheimers Dement 2008;4:265–270. [DOI] [PubMed] [Google Scholar]
- 15. Allen G, Barnard H, McColl R, et al. Reduced hippocampal functional connectivity in Alzheimer disease. Arch Neurol 2007;64:1482–1487. [DOI] [PubMed] [Google Scholar]
- 16. Berron D, van Westen D, Ossenkoppele R, et al. Medial temporal lobe connectivity and its associations with cognition in early Alzheimer's disease. Brain 2020;143:1233–1248. [DOI] [PMC free article] [PubMed] [Google Scholar]
- 17. Das SR, Pluta J, Mancuso L, et al. Increased functional connectivity within medial temporal lobe in mild cognitive impairment. Hippocampus 2013;23:1–6. [DOI] [PMC free article] [PubMed] [Google Scholar]
- 18. Gour N, Ranjeva J‐P, Ceccaldi M, et al. Basal functional connectivity within the anterior temporal network is associated with performance on declarative memory tasks. Neuroimage 2011;58:687–697. [DOI] [PubMed] [Google Scholar]
- 19. Das SR, Pluta J, Mancuso L, et al. Anterior and posterior MTL networks in aging and MCI. Neurobiol Aging 2015;36:S141–S150.e1. [DOI] [PMC free article] [PubMed] [Google Scholar]
- 20. Pasquini L, Scherr M, Tahmasian M, et al. Link between hippocampus' raised local and eased global intrinsic connectivity in AD. Alzheimers Dement 2015;11:475–484. [DOI] [PubMed] [Google Scholar]
- 21. Chen J, Duan X, Shu H, et al. Differential contributions of subregions of medial temporal lobe to memory system in amnestic mild cognitive impairment: insights from fMRI study. Sci Rep 2016;6:26148. [DOI] [PMC free article] [PubMed] [Google Scholar]
- 22. Pasquini L, Scherr M, Tahmasian M, et al. Increased intrinsic activity of medial‐temporal lobe subregions is associated with decreased cortical thickness of medial‐parietal areas in patients with Alzheimer's disease dementia. J Alzheimers Dis 2016;51:313–326. [DOI] [PubMed] [Google Scholar]
- 23. Joie RL, Perrotin A, Barré L. Region‐specific hierarchy between atrophy, hypometabolism, and β‐amyloid (Aβ) load in Alzheimer's disease dementia. J Neurosci 2012;32:16265–16273. [DOI] [PMC free article] [PubMed] [Google Scholar]
- 24. Albert MS, DeKosky ST, Dickson D, et al. The diagnosis of mild cognitive impairment due to Alzheimer's disease: recommendations from the National Institute on Aging‐Alzheimer's Association workgroups on diagnostic guidelines for Alzheimer's disease. Alzheimers Dement 2011;7:270–279. [DOI] [PMC free article] [PubMed] [Google Scholar]
- 25. McKhann GM, Knopman DS, Chertkow H, et al. The diagnosis of dementia due to Alzheimer's disease: recommendations from the National Institute on Aging‐Alzheimer's Association workgroups on diagnostic guidelines for Alzheimer's disease. Alzheimers Dement 2011;7:263–269. [DOI] [PMC free article] [PubMed] [Google Scholar]
- 26. Jack CR, Bennett DA, Blennow K, et al. NIA‐AA research framework: toward a biological definition of Alzheimer's disease. Alzheimers Dement 2018;14:535–562. [DOI] [PMC free article] [PubMed] [Google Scholar]
- 27. La Joie R, Landeau B, Perrotin A, et al. Intrinsic connectivity identifies the hippocampus as a main crossroad between Alzheimer's and semantic dementia‐targeted networks. Neuron 2014;81:1417–1428. [DOI] [PubMed] [Google Scholar]
- 28. Mutlu J, Landeau B, Gaubert M, et al. Distinct influence of specific versus global connectivity on the different Alzheimer's disease biomarkers. Brain 2017;140:3317–3328. [DOI] [PubMed] [Google Scholar]
- 29. Chételat G, Fouquet M, Kalpouzos G, et al. Three‐dimensional surface mapping of hippocampal atrophy progression from MCI to AD and over normal aging as assessed using voxel‐based morphometry. Neuropsychologia 2008;46:1721–1731. [DOI] [PubMed] [Google Scholar]
- 30. La Joie R, Visani AV, Lesman‐Segev OH, et al. Association of APOE4 and clinical variability in Alzheimer disease with the pattern of tau‐ and amyloid‐PET. Neurology 2021;96:e650–e661. [DOI] [PMC free article] [PubMed] [Google Scholar]
- 31. Cox RW, Chen G, Glen DR, et al. FMRI clustering in AFNI: false‐positive rates redux. Brain Connect 2017;7:152–171. [DOI] [PMC free article] [PubMed] [Google Scholar]
- 32. Cox RW. AFNI: software for analysis and visualization of functional magnetic resonance neuroimages. Comput Biomed Res 1996;29:162–173. [DOI] [PubMed] [Google Scholar]
- 33. Winkler Anderson M, Ridgway Gerard R, Webster Matthew A, Smith Stephen M, Nichols Thomas E. Permutation inference for the general linear model. NeuroImage. 2014;92:381–397. 10.1016/j.neuroimage.2014.01.060. [DOI] [PMC free article] [PubMed] [Google Scholar]
- 34. Damoiseaux JS, Prater KE, Miller BL, Greicius MD. Functional connectivity tracks clinical deterioration in Alzheimer's disease. Neurobiol Aging 2012;33:828.e19–e30. [DOI] [PMC free article] [PubMed] [Google Scholar]
- 35. Jones DT, Graff‐Radford J, Lowe VJ, et al. Tau, amyloid, and cascading network failure across the Alzheimer's disease spectrum. Cortex 2017;97:143–159. [DOI] [PMC free article] [PubMed] [Google Scholar]
- 36. Dillen KNH, Jacobs HIL, Kukolja J, et al. Functional disintegration of the default mode network in prodromal Alzheimer's disease. J Alzheimers Dis 2017;59:169–187. [DOI] [PubMed] [Google Scholar]
- 37. Myers N, Pasquini L, Göttler J, et al. Within‐patient correspondence of amyloid‐β and intrinsic network connectivity in Alzheimer's disease. Brain. 2014;137:2052–2064. 10.1093/brain/awu103. [DOI] [PMC free article] [PubMed] [Google Scholar]
- 38. Buckner RL, Andrews‐Hanna JR, Schacter DL. The brain's default network: anatomy, function, and relevance to disease. Ann N Y Acad Sci 2008;1124:1–38. [DOI] [PubMed] [Google Scholar]
- 39. Crossley NA, Mechelli A, Scott J, et al. The hubs of the human connectome are generally implicated in the anatomy of brain disorders. Brain 2014;137:2382–2395. [DOI] [PMC free article] [PubMed] [Google Scholar]
- 40. Ranganath C, Heller A, Cohen MX, et al. Functional connectivity with the hippocampus during successful memory formation. Hippocampus 2005;15:997–1005. [DOI] [PubMed] [Google Scholar]
- 41. Wang L, Laviolette P, O'Keefe K, et al. Intrinsic connectivity between the hippocampus and posteromedial cortex predicts memory performance in cognitively intact older individuals. Neuroimage 2010;51:910–917. [DOI] [PMC free article] [PubMed] [Google Scholar]
- 42. Warren KN, Hermiller MS, Nilakantan AS, Voss JL. Stimulating the hippocampal posterior‐medial network enhances task‐dependent connectivity and memory. Elife 2019;8:e49458. [DOI] [PMC free article] [PubMed] [Google Scholar]
- 43. Sheng C, Xia M, Yu H, et al. Abnormal global functional network connectivity and its relationship to medial temporal atrophy in patients with amnestic mild cognitive impairment. PLoS One 2017;12:e0179823. [DOI] [PMC free article] [PubMed] [Google Scholar]
- 44. Harrison TM, Maass A, Adams JN, et al. Tau deposition is associated with functional isolation of the hippocampus in aging. Nat Commun 2019;10:4900. [DOI] [PMC free article] [PubMed] [Google Scholar]
- 45. Hillary FG, Grafman JH. Injured brains and adaptive networks: the benefits and costs of hyperconnectivity. Trends Cogn Sci 2017;21:385–401. [DOI] [PMC free article] [PubMed] [Google Scholar]
- 46. DeKosky ST, Ikonomovic MD, Styren SD, et al. Upregulation of choline acetyltransferase activity in hippocampus and frontal cortex of elderly subjects with mild cognitive impairment. Ann Neurol 2002;51:145–155. [DOI] [PubMed] [Google Scholar]
- 47. Salami A, Wåhlin A, Kaboodvand N, et al. Longitudinal evidence for dissociation of anterior and posterior MTL resting‐state connectivity in aging: links to perfusion and memory. Cereb Cortex 2016;26:3953–3963. [DOI] [PMC free article] [PubMed] [Google Scholar]
- 48. Patterson K, Nestor PJ, Rogers TT. Where do you know what you know? The representation of semantic knowledge in the human brain. Nat Rev Neurosci 2007;8:976–987. [DOI] [PubMed] [Google Scholar]
- 49. Visser M, Jefferies E, Lambon Ralph MA. Semantic processing in the anterior temporal lobes: a meta‐analysis of the functional neuroimaging literature. J Cogn Neurosci 2010;22:1083–1094. [DOI] [PubMed] [Google Scholar]
- 50. Chan D, Fox NC, Scahill RI, et al. Patterns of temporal lobe atrophy in semantic dementia and Alzheimer's disease. Ann Neurol 2001;49:433–442. [PubMed] [Google Scholar]
- 51. Binney RJ, Embleton KV, Jefferies E, et al. The ventral and inferolateral aspects of the anterior temporal lobe are crucial in semantic memory: evidence from a novel direct comparison of distortion‐corrected fMRI, rTMS, and semantic dementia. Cereb Cortex 2010;20:2728–2738. [DOI] [PubMed] [Google Scholar]
- 52. Jung JY, Rice GE, Lambon Ralph MA. The neural bases of resilient semantic system: evidence of variable neuro‐displacement in cognitive systems. Brain Struct Funct 2021;226:1585–1599. [DOI] [PMC free article] [PubMed] [Google Scholar]
- 53. Cai L, Wei X, Liu J, et al. Functional integration and segregation in multiplex brain networks for Alzheimer's disease. Front Neurosci 2020;14:51. [DOI] [PMC free article] [PubMed] [Google Scholar]
- 54. Cassady KE, Adams JN, Chen X, Maass A, Harrison TM, Landau S, Baker S, Jagust W. Alzheimer's Pathology Is Associated with Dedifferentiation of Intrinsic Functional Memory Networks in Aging. Cerebral Cortex. 2021; 10.1093/cercor/bhab122. [DOI] [PMC free article] [PubMed] [Google Scholar]
- 55. Berron D, Neumann K, Maass A, et al. Age‐related functional changes in domain‐specific medial temporal lobe pathways. Neurobiol Aging 2018;65:86–97. [DOI] [PubMed] [Google Scholar]
- 56. Passamonti L, Tsvetanov KA, Jones PS, et al. Neuroinflammation and functional connectivity in Alzheimer's disease: interactive influences on cognitive performance. J Neurosci 2019;39:7218–7226. [DOI] [PMC free article] [PubMed] [Google Scholar]
- 57. Franzmeier N, Neitzel J, Rubinski A, et al. Functional brain architecture is associated with the rate of tau accumulation in Alzheimer's disease. Nat Commun 2020;11:347. [DOI] [PMC free article] [PubMed] [Google Scholar]
- 58. Jones DT, Knopman DS, Gunter JL, et al. Cascading network failure across the Alzheimer's disease spectrum. Brain 2016;139:547–562. [DOI] [PMC free article] [PubMed] [Google Scholar]
- 59. Wiepert DA, Lowe VJ, Knopman DS, et al. A robust biomarker of large‐scale network failure in Alzheimer's disease. Alzheimers Dement 2017;6:152–161. [DOI] [PMC free article] [PubMed] [Google Scholar]
- 60. Pasquini L, Rahmani F, Maleki‐Balajoo S, et al. Medial temporal lobe disconnection and hyperexcitability across Alzheimer's disease stages. J Alzheimers Dis Rep 2019;3:103–112. [DOI] [PMC free article] [PubMed] [Google Scholar]
- 61. Pereira JB, Ossenkoppele R, Palmqvist S, et al. Amyloid and tau accumulate across distinct spatial networks and are differentially associated with brain connectivity. Elife 2019;8:e50830. [DOI] [PMC free article] [PubMed] [Google Scholar]
- 62. Chen X, Cassady KE, Adams JN, et al. Regional tau effects on prospective cognitive change in cognitively normal older adults. J Neurosci 2021;41:366–375. [DOI] [PMC free article] [PubMed] [Google Scholar]
- 63. Shimojo M, Takuwa H, Takado Y, et al. Selective disruption of inhibitory synapses leading to neuronal hyperexcitability at an early stage of tau pathogenesis in a mouse model. J Neurosci 2020;40:3491–3501. [DOI] [PMC free article] [PubMed] [Google Scholar]
Associated Data
This section collects any data citations, data availability statements, or supplementary materials included in this article.
Data Availability Statement
Data supporting the findings of this study are available from the corresponding author on request.