
FIGURE 4.
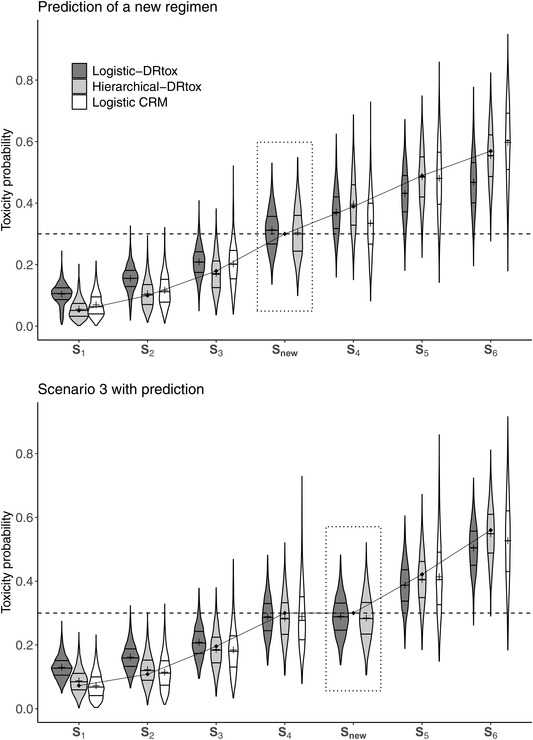
Violin plots of the estimated toxicity probabilities in an additional scenario in which the dose regimen panel missed the true MTD‐regimen and in Scenario 3 on 1000 trials implemented with the CRM including 30 patients. The predicted toxicity probability of a new regimen is framed in dotted line. Horizontal lines on the density estimates represent the median and first and third quantiles of the distributions and the plus sign represents the mean. The dashed line represents the toxicity target and the solid line represents the true toxicity probabilities