

Summary
Heat stress is a major environmental threat affecting crop growth and productivity. However, the molecular mechanisms associated with plant responses to heat stress are poorly understood.
Here, we identified a heat stress‐sensitive mutant, hts1, in rice. HTS1 encodes a thylakoid membrane‐localized β‐ketoacyl carrier protein reductase (KAR) involved in de novo fatty acid biosynthesis. Phylogenetic and bioinformatic analysis showed that HTS1 probably originated from streptophyte algae and is evolutionarily conserved in land plants.
Thermostable HTS1 is predominantly expressed in green tissues and strongly induced by heat stress, but is less responsive to salinity, cold and drought treatments. An amino acid substitution at A254T in HTS1 causes a significant decrease in KAR enzymatic activity and, consequently, impairs fatty acid synthesis and lipid metabolism in the hts1 mutant, especially under heat stress. Compared to the wild‐type, the hts1 mutant exhibited heat‐induced higher H2O2 accumulation, a larger Ca2+ influx to mesophyll cells, and more damage to membranes and chloroplasts. Also, disrupted heat stress signaling in the hts1 mutant depresses the transcriptional activation of HsfA2s and the downstream target genes.
We suggest that HTS1 is critical for underpinning membrane stability, chloroplast integrity and stress signaling for heat tolerance in rice.
Keywords: heat, hydrogen peroxide, lipids, membrane, Oryza sativa, signaling
Introduction
Climate change is increasing the frequency of extreme heat events that affect crop growth and productivity (Lobell et al., 2011; Challinor et al., 2014). It has been estimated that average yield losses for major cereal crops caused by each degree Celsius increase in global mean temperatures could be up to 7.4% for maize, 6.0% for wheat, 3.2% for rice and 3.1% for soybean (Zhao et al., 2017). Extreme high temperature can induce heat stress in plants, which negatively affects metabolism, growth and development and may even lead to plant death (Wahid et al., 2007; Mittler et al., 2012). Therefore, it is essential to explore heat stress response (HSR) mechanisms and gain a better understanding of the molecular and genetic basis of plant HSRs, knowledge of which can facilitate the breeding of new crop varieties with increased tolerance to heat so as to sustain yield and quality under future climate conditions (Janni et al., 2020).
The major heat stress‐induced injuries in plants are a loss of membrane integrity and protein degradation, leading to an accumulation of reactive oxygen species (ROS) and programmed cell death (PCD) (Wahid et al., 2007; Bita & Gerats, 2013). The dominant pathways of plant HSRs have been well characterized with the identification of many heat stress‐responsive genes and their regulators in Arabidopsis thaliana and other plant species (Ohama et al., 2017; Li et al., 2018). Heat stress can rapidly activate transcriptional induction of heat shock transcription factors (HSFs) that upregulate the expression of heat‐responsive genes, including many heat shock proteins (HSPs) and genes encoding ROS‐scavenging enzymes (Ohama et al., 2017; Liu et al., 2021). This heat‐induced transcriptional response depends on multiple signal transduction pathways, such as Ca2+, ROS, nitric oxide (NO) and phospholipid signaling, which are all triggered by different heat sensors (Mittler et al., 2012; Zhu, 2016).
Lipids are major component of membranes that are critical for plant growth and development as well as responding to environmental challenges (Lim et al., 2017). Increasing evidence shows that plant responses to temperature changes are associated with the alteration of membrane lipid composition (Zhu et al., 2007; Higashi et al., 2015; Q. Li et al., 2015; Higashi & Saito, 2019; Liu et al., 2019). Several genes involved in lipid synthesis and remodeling play critical roles in plant heat tolerance. For example, Arabidopsis phospholipid:diacylglycerol acyltransferase1 (PDAT1), a diacylglycerol acyltransferase (DAG) that catalyzes the DAG‐to‐triacylglycerol (TAG) conversion, is involved in TAG production in plants under heat stress (Mueller et al., 2017). Heat Inducible Lipase1 (HIL1) encodes a chloroplastic monogalactosyldiacylglycerol (MGDG) lipase that participates in plant response to heat stress via lipid remodeling (Higashi et al., 2018). In addition, plant fatty acid desaturase (FAD) enzymes are involved in heat stress responses due to their role in adjusting the desaturation status of membrane lipids, which is a critical determinant of membrane fluidity (Martiniere et al., 2011; Niu & Xiang, 2018; Ding et al., 2019). Moreover, several membrane lipids, such as phosphatidylinositol‐4,5‐bisphosphate (PIP2) and d‐myo‐inositol‐1,4,5‐trisphosphate (IP3), can directly serve as signaling molecules under heat stress (Mishkind et al., 2009; Zheng et al., 2012; Balogh et al., 2013).
Fatty acids are the basic components of membrane lipids. In plants, de novo fatty acids biosynthesis occurs in chloroplasts through the concerted actions of acetyl‐CoA carboxylase (ACCase) and fatty acid synthase (FAS). Biosynthesis is initiated by ACCase that carboxylates acetyl‐CoA to form malonyl‐CoA, which subsequently serves as the substrate for the elongation step through a series of condensation, dehydration and reduction reactions by FAS that result in the addition of carbons to form saturated fatty acids with 16 or 18 carbons (Ohlrogge & Jaworski, 1997). Then these 16 : 0 and 18 : 0 fatty acids can be desaturated and/or elongated to generate different fatty acids for multiple biological processes (Ohlrogge & Browse, 1995). Plants contain type II FAS consisting of β‐ketoacyl synthetase (KAS), 3‐ketoacyl‐acyl carrier protein (ACP) reductase (KAR), 3‐hydroxyacyl‐ACP dehydrase (HAD) and enoyl‐ACP reductase (ENR) (Ohlrogge & Jaworski, 1997). In Arabidopsis, a point mutation in ENR (MOD1) impaired fatty acid biosynthesis, causing pleiotropic effects on plant growth and development and premature cell death (Mou et al., 2000). An Arabidopsis mutant with a deficiency in β‐ketoacyl‐ACP synthase I (KSAI) exhibited stunted growth, reduced fertility and impaired chloroplast division (Wu & Xue, 2010). In rice, the OskasI mutant exhibits a short root phenotype and a large alteration in the composition and contents of fatty acids (Ding et al., 2015). OsZl16 encodes an HAD in rice, and was found to be essential for chloroplast development via the regulation of fatty acid synthesis (Liu et al., 2018). Additionally, the gene OsPLS4 is predicted to encode a KAR and is involved in the regulation of leaf senescence (Zhou et al., 2020). However, the role of FAS, especially KAR, in heat stress tolerance in rice is still unknown.
Rice is sensitive to high temperatures especially during its reproductive stage (Peng et al., 2004), and some genes involved in heat tolerance have been identified and characterized in this species. For example, Heat Tolerance At Seedling Stage (OsHTAS, a RING Finger ubiquitin E3 ligase) (Wei et al., 2013; Liu et al., 2016), Thermotolerant Growth Required1 (OsTOGR1, a nucleolar DEAD‐box RNA helicase) (Wang et al., 2016), an NAC transcription factor, OsNTL3 (Liu et al., 2020), and an RNA 5‐methylcytosine m5C methyltransferase, OsNSUN2 (Tang et al., 2020), all contribute to rice thermotolerance. Thermo‐tolerance 1 (OsTT1), encoding an α2 subunit of the 26S proteasome, is reported as a dominant locus controlling heat tolerance in African rice (Oryza glaberrima Steud.) (X‐M. Li et al., 2015). In addition, transgenic rice overexpressing a receptor‐like kinase gene, ERECTA (ER), showed improved heat tolerance (Shen et al., 2015). Here, we report that high temperature sensitive 1 (HTS1) encodes a functional KAR protein involved in de novo fatty acid biosynthesis that is essential for heat resistance in rice. Our results suggest that HTS1 is important for thermotolerance through the maintenance of membrane integrity and mediating heat‐signaling pathways in rice.
Materials and Methods
Plant materials and growth conditions
The hts1 mutant was identified from a heat stress screen using an ethyl methanesulfonate (EMS)‐mutagenized rice population in the Japonica cultivar ‘Wuyunjing 7’. Rice plants were grown in a growth room under a 14 h : 10 h, light : dark cycle at 30°C : 24°C with 65% relative humidity (RH), or in an experimental field at the China National Rice Research Institute, Hangzhou (30°26′N, 120°19′E) under natural conditions.
Rice seeds were germinated and grown in IRRI nutrient solution (pH 5.8) in growth chambers at 28°C and 65% RH under a 14 h : 10 h, light : dark photoperiod. The nutrient solution was changed every 3 d. For heat tolerance testing of plants at the seedling stage, 2‐wk‐old seedlings grown at 28°C were transferred into a growth chamber at 45°C for 3 d, followed by 1 wk of recovery growth at 28°C, after which the survival of seedlings was evaluated; control plants remained at 28°C throughout the experiment. For heat tolerance testing of detached leaves, the first fully expanded leaves of 2‐wk‐old rice seedlings were detached and incubated at 45°C for 3 h in Petri dishes containing three‐layer filter paper wetted with 20 ml of deionized water, followed by 3 d of recovery at 28°C under continuous light (Yu et al., 2012). For the glutathione (GSH) and EGTA treatments, 20 ml of deionized water was replaced with solutions containing 400 μM GSH or 100 μM EGTA.
To evaluate the response of wild‐type and hts1 to different stresses, the 2‐wk‐old wild‐type and hts1 seedlings grown in solution culture were treated with cold stress (exposing plants to 4°C), salt stress (10 g l−1 NaCl) or drought stress (20% polyethylene glycol‐6000 (PEG)). For analysis of gene expression levels under different stresses, leaves from both stress‐treated and control wild‐type plants were sampled for a designated time.
Map‐based cloning and complementation
Map‐based cloning of HTS1 was performed with F2 populations generated from a cross between the hts1 mutant and an Indica variety, 93‐11. A total of 1370 individual F2 seedlings exhibiting the hts1 phenotype were screened for genetic mapping. HTS1 was initially mapped to the long arm of Chromosome 4 between two simple sequence repeat (SSR) markers yp300 and yp398 using 20 individuals. For fine mapping, new sequence tagged site (STS) and SSR markers were generated based on genome polymorphisms between Nipponbare (subsp. Japonica) and 93‐11 (Yu et al., 2008). Candidate genes were predicted using the Rice Genome Annotation Project databases (http://rice.plantbiology.msu.edu/). Genomic DNA fragments of candidate genes were amplified from wild‐type and mutant plants, which were then sequenced and compared to identify the hts1 mutation.
For complementation of the hts1 mutant, a 7683 bp genomic DNA fragment containing the entire HTS1 coding sequence, a 1583 bp upstream region and an 879 bp downstream sequence were amplified using Q5 DNA polymerase (NEB) from the wild‐type genomic DNA and cloned into the binary vector, pCAMBIA1301. The binary construct was then introduced into Agrobacterium tumefaciens strain GV3101 and transformed into hts1 mutant callus as described by Hiei et al. (1994). The primers used in this study are listed in Supporting Information Table S1.
Bioinformatic analysis
The orthologs of HTS1 in green plants were identified using the 1KP database (One Thousand Plant Transcriptomes, 2019) and the NCBI database by Blastp analysis (http://blast.ncbi.nlm.nih.gov/Blast.cgi). Phylogenetic analysis was performed using FastTree (http://www.microbesonline.org/fasttree/) through a maximum‐likelihood method as described by Zhao et al. (2019). Alignment of protein sequences selected from the representative species were aligned using Jalview software with Mafft (https://mafft.cbrc.jp/alignment/software/) and Logo analysis (http://www.weblogo.berkeley.edu/logo.cgi) according to Feng et al. (2020). Protein domain analysis was performed by CCD‐Search based on the NCBI conserved domain database (https://www.ncbi.nlm.nih.gov/cdd). The putative chloroplast transit peptide of HTS1 was predicted using ChloroP (http://www.cbs.dtu.dk/services/ChloroP/) (Emanuelsson et al., 1999).
Quantitative real‐time PCR
Total RNA from different tissues was extracted using the RNeasy Plant Mini Kit (Qiagen), and first‐strand cDNA synthesis was performed using ReverTra Ace qPCR RT Master Mix with gDNA remover (Toyobo, Osaka, Japan). qRT‐PCR analysis was performed with TB Green Premix Ex Taq (Takara, Kusatsu, Japan) with a CFX96 Real‐Time PCR Detection System (Bio‐Rad). The transcript data were normalized using the rice actin gene LOC_Os03g50885 as an internal control.
Histochemical GUS staining
To construct pHTS1::GUS, a 1583 bp genomic DNA fragment immediately before the start codon of HTS1 was amplified by PCR using the primer pair pGUS‐F and pGUS‐R (Table S1) and cloned into the pCAMBIA1301 vector using the KpnI and NcoI restriction sites. The resulting construct was then introduced into wild‐type plants by Agrobacterium tumefaciens‐mediated transformation. T2 transgenic positive plants were used for analysis of GUS activity by the method described by Xiong et al. (2010).
Subcellular localization of HTS1 and its close homologs in rice
For subcellular localization of HTS1 and its close homologs in rice, the coding region of HTS1 and its close homologs without the stop codon was amplified from the wild‐type cDNA library by PCR using specific primers (Table S1). Then, the genes were cloned into a modified pCAMBIA1300 vector containing a cauliflower mosaic virus (CaMV) 35S::GFP cassette (He et al., 2018). The fusion constructs and the empty vector were transferred into rice protoplasts according to Chen et al. (2018) and green fluorescent protein (GFP) fluorescence was observed using confocal laser‐scanning microscopy (CLSM) (LSM710; Zeiss) after overnight incubation in the dark.
Chloroplast subfraction isolation and western blot analysis
Intact chloroplasts and thylakoid, stroma and envelop subfractions were isolated as described in our previous study (Chen et al., 2018). Western blotting was performed according to standard techniques using specific antibodies. Immunodetection of proteins on a polyvinylidene fluoride (PVDF) membrane was performed using an enhanced chemiluminescence kit (Invitrogen), and analyzed by a ChemiDoc Touch imaging system (Bio‐Rad).
Heat stability of HTS1 protein
The heat stability of the HTS1 protein was assessed as previously described (Rao et al., 2004). Aliquots (300 μl) of purified protein (50 μg l−1) were incubated at 25°C (control) or 45°C (heat treatment) for 15, 30 and 45 min. After incubation, samples were centrifuged at 15 000 g for 15 min and equal volumes of supernatants were loaded for western blot analysis. The heat‐instable protein rubisco activase is used as a negative control (Ristic et al., 2007).
Cell physiology
Chlorophyll contents in leaves from 2‐wk‐old wild‐type and hts1 mutant plants were measured as previously described (Chen et al., 2018). Cell death was observed using trypan blue staining as previously described (Wu et al., 2015). H2O2 accumulation was determined by staining with 3,3′‐diaminobenzidine (DAB) (Chen et al., 2010), or quantified using an Amplex Red hydrogen peroxide/peroxidase assay kit (Invitrogen) following the manufacturer’s instructions. The antioxidant enzyme activities and malondialdehyde (MDA) contents were determined according to Chen et al. (2010).
Ion leakage was measured as previously described (Shen et al., 2015). Briefly, three leaves of 2‐wk‐old rice seedlings harvested after 0, 12, 24 and 48 h of heat stress were trimmed into small pieces and placed in glass tubes containing 10 ml deionized water and incubated overnight at 25°C with shaking (c. 100 rpm). Initial ion leakage (I 0) was determined with a conductivity meter (Mettler Toledo, OH, USA). Total ion leakage (I t) was measured after 15 min of boiling. Relative ion leakage was expressed as a percentage (I 0/I t).
Transmission electron microscopy and confocal microscopy
Transmission electron microscopy (TEM) and observations of leaf autofluorescence were performed according to our previous study (Chen et al., 2018). Leaf samples from 2‐wk‐old rice seedlings with or without heat treatment were collected for TEM (JEM‐1230 EX; JEOL, Japan), or for leaf fluorescence imaging by a low‐light cooled CCD imaging apparatus (CA2048B; Roper Scientific, Trenton, NJ, USA). Cellular ROS production was determined by confocal imaging using the fluorescent dye 2′,7′‐dichlorodihydrofluorescein diacetate (H2DCFDA; Invitrogen) as described previously (Cai et al., 2021). Mesophyll cells collected from the first expanded leaves of 2‐wk‐old rice plants were used for CLSM (Leica, Wetzlar, Germany).
Enzyme activity
To obtain purified HTS1‐GST protein, the coding sequence of HTS1 was amplified from wild‐type or hts1 mutant plants using the primers HTS1‐GST‐F and HTS1‐GST‐R (Table S1) and cloned into the vector pET30a. The two resulting constructs and the empty vector were then introduced into Escherichia coli strain BL21. Protein induction and purification was performed according to Chen et al. (2018). KAR activity was determined based on monitoring the changes in NADPH absorption at 340 nm as described previously (Veyron‐Churlet et al., 2010).
Fatty acid analysis
Leaf samples from 2‐wk‐old rice plants with or without heat treatment were collected for analysis of lipids and fatty acids. Lipid profiling was performed at Qingdao Kechuang Quality Analysis Ltd (Shandong, China). Total lipids were extracted with methanol : dichloromethane (2 : 1, v/v) and the extracts were analyzed using a UHPLC Ultimate 3000 system coupled with a Q‐Exactive HF Mass Spectrometer (Thermo Fisher Scientific, San Jose, CA, USA). Fatty acid methyl esters were prepared according to Wu & Xue (2010). Methyl heptadecanoate (AccuStandard Inc., USA) stock solution was added to obtain a final concentration of 25 ppm as an internal reference. GC‐MS was performed using an Agilent 5975 inert GC/MS system (Agilent, CA, USA).
Ion flux measurements
Net Ca2+ fluxes of cells were measured using ion‐selective vibrating microelectrodes (MIFEs) as described by Chen et al. (2005). Ca2+ flux measurements were conducted with mesophyll cells from leaves of 2‐wk‐old rice plants placed in the measuring buffer for 10 min as the control, and after a further 20 min at 45°C as the heat treatment.
Statistical analysis
Statistical analyses were performed with the Data Processing System (DPS) statistical software package (Tang & Zhang, 2013) using ANOVA followed by Student’s t‐test and Duncan’s multiple range test to evaluate significant effects of the treatments at a significance level of P < 0.05.
Results
The hts1 mutant is hypersensitive to heat stress
After screening an EMS‐mutagenized library of rice, we isolated a number of mutant plants with altered sensitivity to heat stress. The mutant, high temperature sensitive 1 (hts1), exhibits a severe heat sensitive phenotype at the seedling stage. The mutant plants showed earlier leaf curling and wilting than the wild‐type when subjected to a 45°C heat treatment. Approximately 90% of wild‐type plants survived 72 h of heat treatment, whereas the survival rate of the mutant plants was only 18.1% (Fig. 1a,b); the mutants were also less green than the controls (Fig. 1c). Under normal growth conditions, the mutant plants also showed some mild morphological defects, including slightly reduced Chl contents, plant heights, tiller numbers, seed setting rates and grain sizes (Figs S1, S2). To further explore whether HTS1 is specifically involved in heat tolerance, we examined the effects of HTS1 on different abiotic stresses. No obvious difference between wild‐type and hts1 mutant seedlings was observed due to salt, cold or drought treatments (Fig. S3a).
Fig. 1.

hts1 is a heat‐sensitive mutant. (a) Phenotypes of 2‐wk‐old rice seedlings before and after heat treatments. Two‐week‐old wild‐type (WT) and hts1 mutant seedlings grown at 28°C were transferred to 45°C for 3 d and then photographed after recovering at 28°C for 2 d. Bars, 20 mm. (b) Survival rates of WT and hts1 mutant seedlings after recovery from heat treatment. Data are means ± SD (n = 3). **, P < 0.01. (c) Heat‐sensitive phenotype in detached leaves of the hts1 mutant in comparison with the WT. (d, e) Visualization of programmed cell death (PCD) (d) and H2O2 accumulation (e) using DAB and trypan blue staining of leaves from 2‐wk‐old seedlings grown at 28°C and treated with heat (45°C) for 0 and 48 h.
We then investigated whether HTS1 affects heat stress‐induced ROS production and cell damage. Staining with trypan blue was more intense in detached leaves from hts1 plants compared to the wild‐type after the plants had been exposed to a heat treatment, indicating the presence of more heat‐induced cell death in the mutant (Fig. 1d). Malondialdehyde contents, resulting from lipid peroxidation of polyunsaturated fatty acids, and H2O2 contents were significantly increased in hts1 leaves after exposure to the heat treatment (Figs 1e, S4a,b). However, the heat‐induced H2O2 accumulation and the sensitivity of the mutant were substantially reduced by exogenous application of 400 µM reduced GSH (an H2O2 scavenger) (Fig. S5). We also found that the heat treatment significantly increased the activities of the antioxidant enzymes, APX and CAT, in wild‐type leaves, but not in those from the hts1 mutant (Fig. S4c). Together, these results clearly demonstrated that HTS1 contributes to heat stress resistance and oxidative stress response in rice.
HTS1 encodes a β‐ketoacyl carrier protein reductase conserved in land plants
To identify the HTS1 locus, an F2 population was generated from a cross between hts1 and the Indica variety, 93‐11. Segregation analysis revealed that the mutant phenotype is controlled by a single recessive gene. Using 1370 F2 recessive plants and PCR‐based molecular markers, we mapped the HTS1 locus to an 80.2 kb interval between two STS markers, yp430 and yp698, on the long arm of Chromosome 4 (Fig. 2a). This region includes eleven annotated candidate open reading frames (ORFs) (http://rice.plantbiology.msu.edu/). We then amplified and sequenced these genes from wild‐type and hts1; only a single nucleotide substitution (G‐to‐A) in Exon 9 of LOC_Os04g30760 was identified that converted alanine (Ala) to threonine (Thr) (Fig. 2a). To confirm that the mutation in LOC_Os04g30760 is responsible for the hts1 phenotype, a genetic complementation test was performed by introducing a 7.6 kb genomic fragment of the candidate gene containing its entire coding region, together with 1583 bp upstream and 879 bp downstream sequences into the hts1 plants. The presence of HTS1 in transgenic lines was verified by PCR followed by restriction enzyme digestion of an MfeI restriction site, which was abolished by the single nucleotide substitution in hts1 (Fig. 2b). The resulting transgenic‐positive (designated as hts1‐Com) lines were restored to the wild‐type phenotype under heat stress conditions (Fig. 2c–e). Growth at the seedling and reproductive stages was also restored in the hts1‐Com lines (Fig. S6). These results showed that the heat hypersensitivity of the hts1 mutant is caused by the mutation in the LOC_Os04g30760 gene.
Fig. 2.
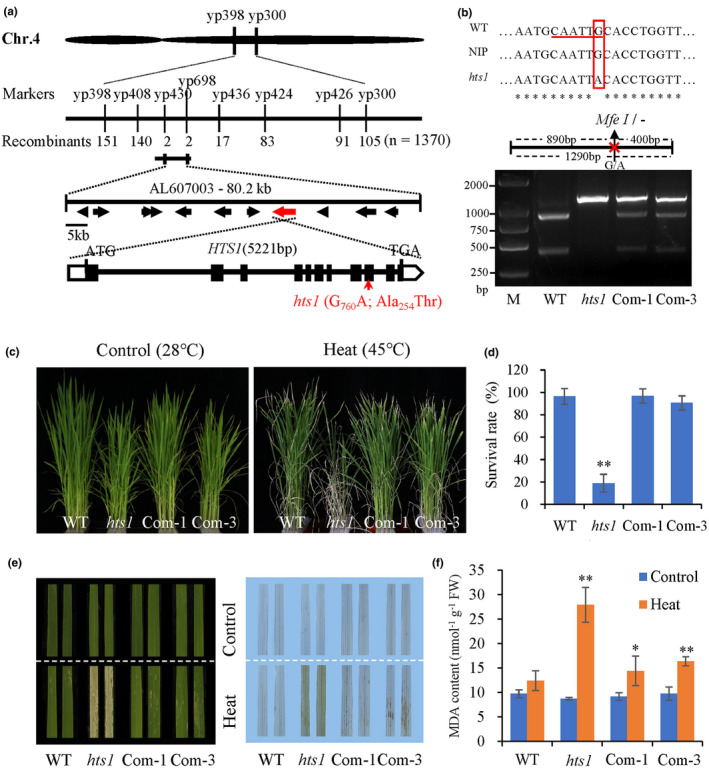
Cloning of the HTS1 gene and verification of HTS1 function. (a) Map‐based cloning of the HTS1 gene and a schematic representation of the HTS1 gene structure (bottom). The HTS1 locus was mapped primarily to the long arm of rice (Oryza sativa) chromosome 4 (Chr. 4) between markers yp398 and yp300. It was subsequently narrowed to an 80.2 kb region between yp430 and yp698 within the bacterial artificial chromosome clone AL607003 using 1370 homozygous mutant plants. The predicted ORFs in this region are highlighted with arrows. The HTS1 gene structure, including exons (black boxes), introns (black lines), the UTR (open boxes), ATG start and TGA stop codons, and a single base substitution (G to A) in hts1 are indicated. (b) The presence of normal transcripts of HTS1 in transgenic line hts1‐Com (hts1 with complemented expression of HTS1) was confirmed by PCR followed by restriction enzyme digestion. A 1290‐bp DNA fragment around the mutation is amplified with the specific primers (yp2243‐F and R) and then digested with the restriction enzyme MfeI. An MfeI restriction site (underlined) was abolished by the G‐to‐A substitution (red box) in the mutant sequence. (c) Iamges of 2‐wk‐old plants of the wild‐type, hts1 and hts1‐Com lines (Com‐1 and Com‐2) grown at 28°C and after 72 h of treatment at 45°C and 2 d recovery at 28°C. (d) Survival rates of the wild‐type, hts1 and the hts1‐Com lines after exposure to heat treatment (45°C, 72 h). (e) Images of the heat‐challenged detached leaves (left panel) from four different genotypes described in (c). DAB staining of these detached leaves is shown in the right panel. (f) MDA contents of the wild‐type, hts1 and hts1‐Com plants before and after exposure to heat treatment (45°C, 48 h). Data are means ± SD (n = 3). *, P < 0.05; **, P < 0.01.
The full‐length ORF of HTS1 (957 bp) encodes a 318 amino acid (aa) protein with a calculated molecular mass of 32.6 kDa. HTS1 contains a putative chloroplast transit peptide at the N‐terminus and a conserved domain of the KAR superfamily at amino acid positions 78–317 (Fig. 3a). Recently, this protein was found to be chloroplast‐located (annotated as PLS4) and to play a role in leaf senescence in rice (Zhou et al., 2020). Here we refer to PLS4 as ‘HTS1’. The rice genome contains two homologs of HTS1, and phylogenetic analysis revealed that HTS1 is closely related to GRMZM2G099696 in maize and Sb6g010860 in sorghum (Fig. S7). Moreover, analysis using the 1KP database showed that 76% of the 1322 plant and algal species have predicted protein orthologs of HTS1 (Figs 3b, S8; Table S2). Amino acid alignment and Logo analysis of the protein domains revealed conserved sequence similarity of HTS1s among representative green plant species. However, there were significant sequence differences in the sequences of the HTS1s in rhodophyte and chlorophyte algae as compared with those in streptophyte algae and land plants (Fig. 3c), indicating that HTS1 has evolved from streptophyte algae and is evolutionarily conserved in land plants.
Fig. 3.

Phylogenetic trees and conserved domain of HTS1 proteins in plants and algae. (a) Conserved domain of HTS1 was predicted in the NCBI database (https://www.ncbi.nlm.nih.gov/cdd). (b) Phylogenetic trees of HTS1 proteins in representative species of major lineage of plants and algae. The maximum‐likelihood method was used to construct the trees. Clades are indicated by different colors. (c) Conserved domain alignment of HTS1s. KR, ketoreductase. Os, Oryza sativa; Pe, Picea engelmanii; Ac, Azolla caroliniana; Sm, Selaginella moellendorffii; Pp, Physcomitrella patens; Mp, Marchantia polymorpha; Kf, Klebsormidium flaccidum; Vc, Volvox carteri; Cm, Cyanidioschyzon merolae.
HTS1 is localized to the thylakoid membrane and induced by heat treatment
To determine the subcellular localization of HTS1, a 35S:HTS1‐GFP construct was introduced into rice mesophyll protoplasts. Confocal laser‐scanning microscopy revealed that the GFP signal of the HTS1‐GFP fusion protein colocalizes with Chl fluorescence (red) in the protoplasts (Fig. 4a). To further determine the subplastidic localization of HTS1, we raised anti‐HTS1‐specific polyclonal antibodies using recombinant full‐length HTS1 protein as the antigen. HTS1 antibodies specifically recognized both endogenous HTS1 as a 32.6 kDa band in the total protein extracts from the wild‐type and hts1 mutant and recombinant GST‐HTS1 fusion protein as a clear 58.6 kDa protein band (Fig. S9). Immunoblot analysis of total protein extracts from different fractions of the wild‐type chloroplasts verified that the subplastidic localization of HTS1 is similar to that of D1 protein (Fig. 4b), a known thylakoid membrane protein encoded by the psbA gene in chloroplast genomes (Zhang et al., 1999).
Fig. 4.

HTS1 is a thylakoid membrane‐localized protein and is in response to heat stress in rice (Oryza sativa). (a) Confocal imaging showing chloroplast targeting of HTS1. 35S::GFP (upper panel) and 35S::HTS1‐GFP (lower panel) transiently expressed in rice protoplast cells. Left to right, GFP fluorescence, chloroplast autofluorescence, merged images and bright field images. Bars, 5 μm. (b) Suborganelle localization of the HTS1 protein in the chloroplast. Intact chloroplasts were isolated from WT leaves then separated into thylakoid membrane, envelope and stroma fractions. Polyclonal antibodies against D1 (thylakoid marker), RbcL (stroma marker) and Tic110 (envelope marker) were used as markers. (c, d) The mRNA (c) and protein (d) levels of HTS1 in wild‐type leaves after 45°C heat treatment. The protein levels of HTS1 were measured by western blotting. Equal protein loading was confirmed with antiserum against actin.
Quantitative RT‐PCR (qRT‐PCR) showed that HTS1 is mainly expressed in green tissues, with highest expression levels in leaves and leaf sheaths, followed by panicles (Fig. S10a). This expression pattern was confirmed by strong GUS staining in leaves, leaf sheaths and young glumes (Fig. S10b). Moreover, we also examined the expression of HTS1 under abiotic stresses. qRT‐PCR showed that heat treatment significantly increases the transcript level of HTS1, reaching peak expression (12.5‐fold) after 3 h at 45°C (Fig. 4c). However, transcript levels of HTS1 were less induced by cold and drought (PEG treatment) stress (up to 2.5‐fold at 0.5 h) and by salt stress (up to 5‐fold at 8 h) (Fig. S3b). Western blot analysis further revealed that heat treatment gradually increases HTS1 protein levels with a peak at 6 h after the start of the treatment, indicating that HTS1 is a heat‐inducible protein (Fig. 4d).
HTS1 has KAR activity and exhibits high thermal stability
KAR is a key enzyme in the type II fatty acid elongation cycle that reduces 3‐ketoacyl‐ACP to 3‐hydroxyl (Brown et al., 2009). Prediction of protein structure showed that the mutation of the Thr254 amino acid residue in the conserved domain of KAR may cause conformational alteration of the HTS1 protein (Fig. 5a). Therefore, we expressed the N‐terminal fusion of HTS1 and mutant (hereafter referred to A254T) with glutathione S‐transferase (GST) using an E. coli expression system (Fig. 5b) and KAR activity was examined. High catalytic activity was detected in GST‐HTS1 after introducing acetoacetyl‐CoA and NADH, whereas the activity of GST‐HTS1[A254T] was significantly reduced by 85.7% (Fig. 5c).
Fig. 5.

The predicted protein structures and enzymatic activity of 3‐oxoacyl‐acyl‐carrier‐protein reductase (HTS1) and HTS1A254T. (a) Three‐dimensional models of HTS1 and HTS1A254T predicted by Swiss‐Model. (b) The purification of GST‐tagged HTS1 and mutant proteins from Escherichia coli. (c) Enzyme activity assay of HTS1 in vitro. (d) Western blot of purified HTS1 protein incubated at 25°C (control) and 45°C for the indicated times. Purified Rubisco activase (RCA) protein was used as the control (Ristic et al., 2007). (e) Enzyme activity of purified HTS1 protein incubated at 25°C (control) and 45°C. Data represent means ± SD (n = 3). **, P < 0.01.
We further examined the stability of HTS1 under heat stress by assessing its ability to remain soluble and maintain enzyme activity after treatment at 45°C. Western blot analysis showed that both the recombinant and the endogenous HTS1 protein are stable in the soluble fraction after the heat treatments. By contrast, the control rubisco activase, a heat‐unstable protein (Ristic et al., 2007), showed a sharp decline in the soluble fraction after 30 min of heat treatment (Figs 5d, S11) indicating that HTS1 is relatively stable at 45°C. Moreover, the purified HTS1 protein retained 84.5% enzyme activity after heat treatment as compared to the control, corroborating the results of the western blot experiments (Fig. 5e).
The hts1 mutant was defective in fatty acid biosynthesis
We then examined whether fatty acid biosynthesis and lipid metabolism are impaired in the hts1 mutant due to reduced KAR activity. Lipidomic analysis showed that hts1 has significantly lower glycerolipids (diglyceride (DG) and MGDG) than the wild‐type plants. By contrast, the levels of glycerophospholipids, such as phosphatidic acid (PA), phosphatidylcholine (PC), phosphatidylglycerol (PG), phosphatidylethanolamine (PE) and phosphatidylinositol (PI), showed slight increases in the mutant (Fig. 6a; Table S3). Interestingly, the compositions of these glycerolipids showed that there was a highly significant decrease in the 34 : 3 and 36 : 5 components of the DGs. The decreased levels of MGDG were mainly explained by a small reduction in 36 : 6 and 38 : 8 species (Fig. 6b; Table S4). Further analysis of the fatty acids showed that the contents of the two most abundant fatty acids, C16 : 0 (palmitic acid) and C18 : 3 (linolenic acid), were significantly reduced in the hts1 mutant compared to the wild‐type. By contrast, the levels of fatty acids in HTS1‐complemented plants were similar to those observed in wild‐type plants (Table 1). Heat treatment significantly reduced the fatty acid content in leaves, but the wild‐type still had 46.9% more fatty acids than hts1 after 24 h. In particular, the heat‐induced total fatty acid reduction was mainly due to the decrease of C16 : 0, C18 : 0 and C18:3 species (Table 1).
Fig. 6.

Lipidomic analysis of leaves of wild‐type and hts1 mutant rice (Oryza sativa). (a) Lipid compositions in leaves from 2‐wk‐old wild‐type and hts1 seedlings. Lipid classes are presented as the percentage of the total amount of all detected lipid classes. (b) Relative abundance of different molecular species of glycerolipids (DG and MGDG) in the wild‐type and hts1 mutant. Data represent means ± SD (n = 3). **, P < 0.01; *, P < 0.05. Cer, ceramides; DG, diglyceride; GlcCer, glucosylceramide; MGDG, monogalactosyldiacylglycerol; PA, phosphatidic acid; PC, phosphatidylcholine; PE, phosphatidylethanolamine; PG, phosphatidylglycerol; PI, phosphatidylinositol; PS, phosphatidylserine; SM, sphingomyelin; SQDG, sulfoquinovosyldiacylglycerol; TG, triglyceride.
Table 1.
Changes in fatty acid compositions of wild‐type (WT), hts1 and hts1‐Com (Com‐1) plants grown at 28°C or followed by 24 h of heat treatment at 45°C.
| Fatty acid | 28°C | 45°C | ||||
|---|---|---|---|---|---|---|
| WT | hts1 | Com‐1 | WT | hts1 | Com‐1 | |
| C16 : 0 | 18.2 ± 0.27 | 13.4 ± 0.36* | 17.6 ± 0.51 | 11.8 ± 0.37 | 6.78 ± 0.82* | 12.57 ± 0.24 |
| C16 : 1 | 1.36 ± 0.04 | 1.20 ± 0.10 | 1.53 ± 0.19 | 1.21 ± 0.04 | 0.94 ± 0.04* | 1.09 ± 0.03 |
| C18 : 0 | 7.54 ± 0.07 | 5.29 ± 0.94* | 6.39 ± 0.82 | 4.42 ± 0.45 | 2.38 ± 0.83* | 4.48 ± 0.45 |
| C18 : 2 | 5.14 ± 0.44 | 4.91 ± 0.41 | 5.30 ± 0.32 | 3.51 ± 0.39 | 3.42 ± 0.15 | 3.79 ± 0.47 |
| C18 : 3 | 27.1 ± 1.44 | 21.5 ± 1.33* | 27.9 ± 0.78 | 24.2 ± 1.04 | 18.5 ± 1.09* | 23.58 ± 1.13 |
| Total | 58.6 ± 1.13 | 46.3 ± 0.92 | 57.11 ± 0.93 | 45.1 ± 2.30 | 30.7 ± 0.66 | 43.2 ± 2.24 |
Data are means ± SD (μg mg−1 DW; n = 3).
Significant differences at P < 0.05 compared to the WT.
HTS1 deficiency accelerates loss of membrane integrity under heat stress
Considering the important role of fatty acids in cellular membrane formation, we investigated the effect of HTS1 mutation on plant heat response at the cellular level. We found that the hts1 mutant displays significantly more ion leakage (1.8‐fold) than the wild‐type and hts1‐Com plants after heat treatment (Fig. 7a). However, ion leakage from the hts1 mutant was comparable with the wild‐type under normal growth conditions, suggesting that the membrane fluidity is affected in the mutant due to heat stress. Transmission electron microscopy (TEM) showed more severe heat‐induced damage to the plasma membranes of the hts1 mutant than those of the wild‐type (Fig. 7b). Confocal microscopy (Fig. 7c) and TEM (Fig. 7e) also revealed a higher occurrence of heat‐induced chloroplast deformation in the hts1 mutant in contrast to the wild‐type and hst1‐Com1 leaves. After 2 h of heat treatment, more collapsed chloroplasts occurred in mesophyll cells of the mutant (60.5%) compared to the wild‐type (13.3%) and hts1‐Com1 (12.6%) (Fig. 7d).
Fig. 7.

Disturbance of HTS1 expression accelerates plasma membrane disruption and chloroplast degradation under heat treatment. (a) Change of cellular ion leakage of the fully expanded leaves from WT, hts1 and hts1‐Com1 plants challenged with heat treatment (45°C) for the indicated time. Data are means ± SD (n = 3). **, P < 0.01. (b) TEM subcellular observation of the plasma membrane of the 2‐wk‐old WT, hts1 and hts1‐Com1 plants treated at 45°C for 0, 24 and 48 h. Red arrows indicate the plasma membrane blebbing in the hts1 mutant. PM, plasma membrane; CW, cell wall; V, vacuole. Bar, 0.2 μm. (c) Confocal images of mesophyll cells of the 2‐wk‐old WT, hts1 and hts1‐Com1 plants treated at 45°C for 0 and 2 h. White arrows indicate disrupted chloroplasts. Bars, 10 μm (×3.0) and 5 μm (×8.0). (d) Quantification of the occurrence of chloroplast disruption (swelling and collapsing) in mesophyll cells after 2 h of heat treatment. Data are means ± SD (n = 5 with 30–50 cells). **, P < 0.01. (e) TEM observation of chloroplast collapse of the 2‐wk‐old WT, hts1 and hts1‐Com1 plants treated at 45°C for 0 and 48 h. Bars, 1 μm.
HTS1 is required for heat‐induced Ca2+ signaling and expression activation of HsfA2 and its target genes
The plasma membrane is critical for plant heat sensing, cellular responses and Ca2+ signaling transduction (Niu & Xiang, 2018). Therefore, we monitored the heat stress‐induced Ca2+ influx in mesophyll cells using MIFEs. The heat‐induced, transient, net Ca2+ influx was much larger in mesophyll cells of the hts1 mutant that, on average, was 4.1‐fold higher than in wild‐type cells during the first 10 min under heat treatment (Fig. 8a). Treatment with the Ca2+ chelator, EGTA, largely prevented heat‐induced H2O2 accumulation and leaf bleaching in detached leaves of the mutant (Fig. 8b,c). Confocal microscopy showed a gradual increase in fluorescence due to H2O2 in the mesophyll cells of the wild‐type and hts1 mutant during the first 60 min of heat treatment. However, after 60 min, H2O2 production in hts1 mesophyll cells was up to 7‐fold higher than in those of the control (Fig. 8d,e).
Fig. 8.

Intracellular Ca2+ influxes and H2O2 production are increased in the hts1 mutant after heat treatment. (a) Transient net Ca2+ influxes measured from mesophyll cells of leaves of WT and the hts1 mutant in response to heat treatment. Data are means ± SD (n = 5–8). (b) Heat‐challenged phenotypes of WT and the hts1 mutant as examined with detached leaves with or without 100 μM EGTA supplement. (c) DAB staining of the heat‐challenged detached leaves of WT and hts1 as described in (b). (d) Representative images of H2DCFDA fluorescence from mesophyll cells from leaves of WT and the hts1 mutant measured in the control (28°C) and after 30 and 60 min of heat treatment (45°C). Bars, 15 μm. (e) Corrected total cell fluorescence of H2DCFDA for heat‐induced H2O2 production. Data are means ± SD (n = 5 with 30–50 cells). **, P < 0.01.
As increasing intracellular Ca2+ and H2O2 levels indicate an induction of downstream, heat‐related, signaling pathways, we then examined the expression of HSF and HSP genes in response to heat treatment. Time course qPCR experiments showed that heat treatment leads to a sharp rise in the transcript levels of HsfA2b, Hsf2Ac and HsfA2d in wild‐type plants, reaching peaks after 30 min of treatment. However, the expression of Hsf2Ac and HsfA2d decreased to 32.4% and 39.1% of the wild‐type transcript levels, respectively (Fig. 9a). Compared with those of wild‐type plants, the heat‐induced expression of some HsfA2 target genes (e.g. APX2, GolS1, HSP70 and HSP101) were also markedly inhibited in the hts1 mutant after 30 min of treatment (Fig. 9b,c). Moreover, the known heat tolerance‐related genes in rice, OsNTL3, OsHATs, OsTOGR1 and OsTT1, showed different trends in the wild‐type and the mutant. OsHATs and OsTOGR1 were significantly upregulated by heat treatment in the hts1 mutant and differed significantly between the wild‐type and hts1 mutant after 3 h (Fig. S12). Together, these results indicate that HTS1 deficiency may cause rapid Ca2+ and ROS signaling that affects the transcriptional activation of HsfA2s and its target genes in response to heat stress in rice.
Fig. 9.

Mutation of HTS1 inhibits transcriptional activation of HsfA2 and its target genes in response to heat stress. qRT‐PCR analysis of mRNA levels of HsfA2 (a), its representative target genes, including APX2, GolS1 (b) and HSP genes (c) in leaves from 2‐wk‐old WT and mutant seedlings challenged with heat treatment (45°C) for the indicated times. The actin gene (LOC_Os03g50885) was used as the internal standard. Data represent means ± SD (n = 3).
Discussion
HTS1 encodes a functional KAR required for fatty acid synthesis and heat tolerance
Fatty acid‐based lipid synthesis and remolding are frequently linked to plant temperature stress responses, indicating the importance of targeting this metabolic pathway for the development of heat tolerance (Moellering et al., 2010; Wang et al., 2010; Higashi et al., 2015; Q. Li et al., 2015; Li et al., 2016; Barrero‐Sicilia et al., 2017; Higashi et al., 2018; Niu & Xiang, 2018). It was reported that high temperature causes a decline of KAS abundance and impairing fatty acid accumulation in fabG (Ts) and envM mutants that results in a heat‐induced, lethal phenotype in bacteria such as E. coli (Bergler et al., 1994; Lai & Cronan, 2004). It was also found that the Arabidopsis mod1 mutant with an ENR activity deficiency affecting the fatty acid synthase complex that catalyzes de novo synthesis of fatty acids has increased sensitivity to high temperature (Mou et al., 2000). In the present study, we identified and cloned HTS1, which encodes a functional KAR protein in rice. Rice plants lacking HTS1 had reduced fatty acid accumulation and exhibited a heat‐sensitive phenotype when treated at 45°C. HTS1 contains a chloroplast transit sequence and its targeting to thylakoids was confirmed experimentally (Fig. 4), validating de novo fatty acid synthesis in chloroplasts (Troncoso‐Ponce et al., 2016). We showed that the hts1 mutant accumulates higher contents of H2O2 and MDA and has greater levels of cell death at high temperature compared with the wild‐type (Figs 1, S4). These physiological traits were associated with significantly lower fatty acid contents (Table 1), suggesting an important role of HTS1 in fatty acid biosynthesis and heat stress adaptation of rice plants.
Sequence analysis revealed that the hts1 mutant carries a single base transition (G to A) that changes an Ala to a Thr in the coding sequence of HTS1 (Fig. 2). This amino acid substitution causes a large decrease in KAR activity, leading to a 19.6% reduction in the total fatty acid content of hts1 plants relative to the wild‐type (Fig. 5; Table 1). This moderate reduction of fatty acids in hts1 is consistent with data for the Arabidopsis ENR or KAS1 knockout mutants, which also maintained sufficient fatty acids for survival due to low residual enzyme activities (Mou et al., 2000; Wu & Xue, 2010), indicating that plant fatty acid biosynthesis is robust and can be maintained even in the face of genetic lesions in the primary synthesis steps (Li, Q et al., 2015). However, unlike the Arabidopsis mod1 and ksa1 mutants, which showed more severe morphological changes, the hts1 mutant only showed slight growth inhibition under normal growth conditions (Figs S1, S2). This may be due to genetic redundancy, because there are two putative KAR homologs in the rice genome (Fig. S7). We found that the HTS1 homolog (LOC_Os02g30060) is also located in chloroplasts and its expression is significantly higher in the hts1 mutant (Fig. S13), suggesting a potential redundant role with HTS1.
The fatty acid metabolism pathway and the core enzymes for fatty acid biosynthesis are conserved throughout evolution due to their essential metabolic roles in living organisms (Campbell & Cronan, 2001; Kohli et al., 2016). KAR (HTS1) is one of the type II FAS enzymes that were transferred from the plastid to the nuclear genome during their evolutionary history (Kohli et al., 2016). Bioinformatic analysis showed that HTS1 homologs ubiquitously exist in land plant and algal species, ranging from the streptophyte algae to angiosperm plants. The conserved KR domain of Klebsormidium flaccidum (a charophyte alga) is more similar to those in other land plant species including Oryza sativa compared to those in Volvox carteri (a chlorophyte alga) and Cyanidioschyzon merolae (a rhodophyte alga) (Fig. 3c). Thus, we suggest that HTS1 proteins are highly conserved in land plants (Figs 3b, S7, S8; Table S2). There may be an early evolutionary origin of these nuclear‐encoded proteins and the protein precursors that are targeted into plastids using an N‐terminal chloroplast transit peptide (Bruce, 2000), which is an interesting topic for further study. Given the important roles of fatty acids and their derivatives in response to major abiotic stresses including cold, heat, drought and salt (Liu et al., 2019; He & Ding, 2020), and the role of HTS1 in the response of rice to heat, we propose that the origin of HTS1s in streptophyte algae may be important in the successful evolutionary transition from aquatic to terrestrial living of green plants (Zhao et al., 2019; Feng et al., 2020).
HTS1 confers heat tolerance via modulating membrane lipid stability
Plant cells surviving under extreme temperatures need to first maintain lipid membrane stability and fluidity by regulating lipid saturation (Niu & Xiang, 2018). It has been reported that heat stress significantly affects membrane lipid composition and thus increases saturation of membrane lipids, enhancing ROS production and membrane lipid peroxidation, resulting in membrane disruption and cell damage (Wahid et al., 2007; Balogh et al., 2013). Recent studies on the lipidome in Arabidopsis revealed that heat stress specifically decreases the levels of 16 : 3‐ and/or 18 : 3‐containing chloroplastic glycerolipids (e.g. MGDG) and increases the production PC, acyl‐MGDG, TAG, and digalactosyldiacylglycerol in leaves (Higashi et al., 2015; Higashi & Saito, 2019). Research using the green alga Dunaliella bardawil also suggests that the accumulation of polyunsaturated membrane lipids converted from DG are important in the reduction of heat damage to cell membranes (Liang et al., 2020). Interestingly, the hts1 mutant had significantly reduced contents of C16 and C18 fatty acids, resulting in low accumulation of glycerolipids, such as MGDG and DG, the major structural constituents of cellular membranes rich in polyunsaturated acids (Fig. 6). Therefore, it is not surprising that the lower fatty acid contents in hts1 mutant plants significantly weakened their membranes, especially during heat stress, aggravating the oxidation of membrane lipids in mutant cells and leading to severe cell membrane disruption and plastid degradation (Figs 1d–f, 7). In addition, previous studies showed that heat‐induced lipid remodeling depends on the rate of de novo fatty acid synthesis and the rate of turnover of membrane lipids (Bao et al., 2000; Falcone et al., 2004). Here, the upregulation of HTS1 transcripts and protein under high temperature (Fig. 4c,d) and a high level of thermal stability of HTS1 (Figs 5d,e, S11) suggest that HTS1‐mediated fatty acid biosynthesis is required for lipid metabolism under heat stress. Together, these results highlight that the resistance of plants to heat stress depends on abundant fatty acid synthesis for maintaining membrane stability.
Potential role of ROS, Ca2+ and HSF in HTS1‐mediated heat stress response in rice
Heat stress causes ROS accumulation in organelles, which is an indispensable factor for evoking the HSR in plants, but an excessive heat‐induced elevation of ROS production leads to oxidative stress and cell death (Suzuki et al., 2012). Chloroplastic and mitochondrial metabolism and plasma membrane NADPH oxidases are the most prominent sources of H2O2 production under heat stress (Suzuki et al., 2012; Sun & Guo, 2016; Choudhury et al., 2017). During heat treatment, the fatty acid‐deficient hts1 mutant significantly accelerated H2O2 accumulation (Figs 1e, 8d,e) and cell death compared with the wild‐type (Fig. 1d). It was revealed that a deficiency in fatty acid biosynthesis in the Arabidopsis mod1 mutant causes cell death by modulating ROS generation through impairment of the mitochondrial electron transport chain (Mou et al., 2000; Wu et al., 2015; Zhao et al., 2018, 2020). Therefore, we suggest that H2O2 overproduction is a possible explanation for the heat‐sensitive phenotype of the hts1 mutant. Moreover, ROS‐scavenging enzymes such as APX and CAT are heat stress‐inducible (Ohama et al., 2017). We also found that heat treatment significantly upregulated APX and CAT enzyme activities in wild‐type plants, but downregulated them in the hts1 mutant (Fig. S4) and an H2O2 scavenger, GSH, partially rescued the heat‐sensitive phenotype in the hts1 mutant (Fig. S5). Thus, the excessive H2O2 accumulation in the hts1 mutant may be a combined effect of the increased heat‐induced H2O2 generation and the decreased H2O2 scavenging capacity.
The plasma membrane acts as the first responder to abiotic stresses, including heat stress (Barkla & Pantoja, 2011). High temperature affects the fluidity and stability of plasma membranes activating membrane‐associated heat sensors, including calcium channels, resulting in a rapid Ca2+ influx that, in turn, triggers a signal transduction cascade (Finka et al., 2012; Mittler et al., 2012; Zhao et al., 2021). It was shown that a change of membrane lipid composition largely affects heat sensing and modulates Ca2+‐dependent heat shock responses in plants (Saidi et al., 2010). Here, we detected a larger rapid, transient increase in Ca2+ influx in mesophyll cells of the hts1 mutant during the first 10 min of heat treatment than that of the wild‐type (Fig. 8a), and using a Ca2+ chelator, EGTA, can reduce the heat‐induced H2O2 production and cell death in leaves of the hts1 mutant (Fig. 8b). This suggested that Ca2+ may be involved in the HTS1‐mediated plant HSR, but the link between Ca2+ signaling and the function of HTS1 requires further investigation.
Moreover, heat stress induces rapid accumulation of H2O2 and a rise of cytosolic Ca2+, which are involved in HSF activation (Volkov et al., 2006; Ohama et al., 2017). Interestingly, we found that the expression of HsfA2c and HsfA2d are significantly upregulated in wild‐type plants (Fig. 9a), indicating that the Ca2+‐mediated HsfA2 signaling pathway may be a significant mechanism associated with heat resistance in rice. HsfA2 is considered as a direct target of HsfA1 and is essential for the activation of HSR in plants (Charng et al., 2007). The activation of HsfA2 can further modulate the expression of many downstream target genes, including HSPs and other HS‐induced genes (Figs 9b,c) that increase tolerance to heat stress (Ohama et al., 2017). Here, a high Ca2+ influx in mesophyll cells under heat stress was associated with a marked suppression of the heat‐induced upregulation of HsfA2 and its target genes in the hts1 mutant (Figs 8a, 9). These findings support an important role for HsfA2 in HTS1‐mediated HSR.
Conclusions
We conclude that HTS1 deficiency directly impairs fatty acid biosynthesis and lipid metabolism in the hts1 mutant. The reduced fatty acid content (mainly C16 : 0 and C18 : 3) disrupts the integrity and stability of cell membrane systems under heat stress, causing abnormal heat‐induced Ca2+ and ROS signal transduction cascades. The mutation in HTS1 also causes a repression of the transcriptional activity of HSF and HSP networks, leading to an impaired HSR regulation and uncontrolled heat damage. Therefore, we propose that HTS1 is a key factor for de novo fatty acids synthesis and is essential for heat tolerance in rice through effects on membrane stability, heat stress‐related transcriptional activity, and potentially Ca2+ and ROS signaling (Fig. 10). Insights into the relationship of fatty acid synthesis and stress signaling under heat stress will be beneficial for a better understanding towards breeding plants for future climate conditions.
Fig. 10.

A proposed working model of HTS1 in modulating heat tolerance in rice (Oryza sativa). A deficiency of HTS1 directly impairs the biosynthesis of fatty acids in the hts1 mutant. The reduced fatty acid content (mainly C16 : 0 and C18 : 3) disrupts the integrity and stability of cell membrane systems under heat stress, which may cause abnormal heat‐induced reactive oxygen species (ROS) and Ca2+ signaling. The mutation in HTS1 also causes a repression of the transcriptional activity of heat stress transcription factor (HSF) and heat stress protein (HSP) networks, leading to an impaired heat stress response (HSR) regulation and uncontrolled heat damage. Red arrows represent increased/decreased expression or content. Dashed arrow indicates multiple steps. Blunt‐ended arrow indicates inhibition.
Author contributions
YY, Z‐HC, LW and QQ conceived and supervised the project; FC, GD, FW, YS, JZ, YZ, BR, YW, XF, CZ and MTY conducted the experiments; FC, DZ, Z‐HC and YY designed the experiments and analyzed the data; FC, PH, Z‐HC and YY wrote the manuscript. All authors read and approved the final manuscript. FC and GD contributed equally to this work.
Supporting information
Fig. S1 The hts1 mutant exhibits a pale green phenotype.
Fig. S2 Phenotypic characterization of wild‐type and hts1 mutant rice (Oryza sativa).
Fig. S3 HTS1 is not a general factor response for environmental stress tolerance.
Fig. S4 HTS1 is involved in the heat‐induced oxidative stress response.
Fig. S5 Application of exogenous glutathione partially reverses the heat‐sensitive phenotype of the hts1 mutant.
Fig. S6 Growth recovery of hts1‐Com plants at the seedling and reproductive stages under field conditions.
Fig. S7 Phylogenetic trees and sequence alignment of HTS1 and its homologous proteins in plants.
Fig. S8 Phylogenetic analysis of HTS1 in different plant and algal species selected from the 1KP database.
Fig. S9 Anti‐HTS1 antibody detection by western blotting.
Fig. S10 Expression patterns of HTS1 in rice (Oryza sativa).
Fig. S11 Western blot of HTS1 protein incubated at 25°C (control) or 45°C for the indicated time.
Fig. S12 Expression and subcellular localization of two rice KAR homologs.
Fig. S13 Expression levels of rice heat‐resistance‐associated genes in hts1 and WT plants under heat treatment.
Table S1 List of primers used in this study.
Table S2 Statistics of evolution of HTS1s in the 1KP dataset.
Table S3 The proportions of identified lipid classes in leaves of 2‐wk‐old rice wild‐type and hts1 mutant seedlings.
Table S4 All detected lipid species in leaves of 2‐wk‐old rice wild‐type and hts1 mutant seedlings.
Please note: Wiley Blackwell are not responsible for the content or functionality of any Supporting Information supplied by the authors. Any queries (other than missing material) should be directed to the New Phytologist Central Office.
Acknowledgements
We thank Prof. Lixin Zhang (Henan University) and Prof. Lianwei Peng (Shanghai Normal University) for kindly providing the chloroplastic antibodies and Western Sydney University for use of the Confocal Bio‐imaging Facility. This work was funded by the National Key Research and Development Program of China (2016YFD0101801), the National Natural Science Foundation of China (31801752), the Natural Science Foundation of Zhejiang Province (Y18C130009; LY20C130004), and the Science and Technology Project of Hangzhou (20180432B04). ZHC is supported by the Australian Research Council (DE14011143) and Horticulture Innovation Australia (VG17003, LP18000).
Contributor Information
Limin Wu, Email: lmwu2006@aliyun.com.
Zhong‐Hua Chen, Email: z.chen@westernsydney.edu.au.
Yanchun Yu, Email: ycyu@hznu.edu.cn.
References
- Balogh G, Peter M, Glatz A, Gombos I, Torok Z, Horvath I, Harwood JL, Vigh L. 2013. Key role of lipids in heat stress management. FEBS Letters 587: 1970–1980. [DOI] [PubMed] [Google Scholar]
- Bao X, Focke M, Pollard M, Ohlrogge J. 2000. Understanding in vivo carbon precursor supply for fatty acid synthesis in leaf tissue. The Plant Journal 22: 39–50. [DOI] [PubMed] [Google Scholar]
- Barkla BJ, Pantoja O. 2011. Plasma membrane and abiotic stress. Berlin, Germany: Springer. [Google Scholar]
- Barrero‐Sicilia C, Silvestre S, Haslam RP, Michaelson LV. 2017. Lipid remodelling: unravelling the response to cold stress in Arabidopsis and its extremophile relative Eutrema salsugineum . Plant Science 263: 194–200. [DOI] [PMC free article] [PubMed] [Google Scholar]
- Bergler H, Wallner P, Ebeling A, Leitinger B, Fuchsbichler S, Aschauer H, Kollenz G, Hogenauer G, Turnowsky F. 1994. Protein EnvM is the NADH‐dependent enoyl‐ACP reductase (FabI) of Escherichia coli . Journal of Biological Chemistry 269: 5493–5496. [PubMed] [Google Scholar]
- Bita CE, Gerats T. 2013. Plant tolerance to high temperature in a changing environment: scientific fundamentals and production of heat stress‐tolerant crops. Frontiers in Plant Science 4: 273. [DOI] [PMC free article] [PubMed] [Google Scholar]
- Brown AP, Slabas AR, Rafferty JB. 2009. Fatty acid biosynthesis in plants — Metabolic pathways, structure and organization. Dordrecht, the Netherlands: Springer. [Google Scholar]
- Bruce BD. 2000. Chloroplast transit peptides: structure, function and evolution. Trends in Cell Biology 10: 440–447. [DOI] [PubMed] [Google Scholar]
- Cai S, Huang Y, Chen F, Zhang X, Sessa E, Zhao C, Marchant DB, Xue D, Chen G, Dai F et al. 2021. Evolution of rapid blue‐light response linked to explosive diversification of ferns in angiosperm forests. New Phytologist 230: 1201–1213. [DOI] [PMC free article] [PubMed] [Google Scholar]
- Campbell JW, Cronan JE Jr. 2001. Bacterial fatty acid biosynthesis: targets for antibacterial drug discovery. Annual Review of Microbiology 55: 305–332. [DOI] [PubMed] [Google Scholar]
- Challinor AJ, Watson J, Lobell DB, Howden SM, Smith DR, Chhetri N. 2014. A meta‐analysis of crop yield under climate change and adaptation. Nature Climate Change 4: 287–291. [Google Scholar]
- Charng YY, Liu HC, Liu NY, Chi WT, Wang CN, Chang SH, Wang TT. 2007. A heat‐inducible transcription factor, HsfA2, is required for extension of acquired thermotolerance in Arabidopsis. Plant Physiology 143: 251–262. [DOI] [PMC free article] [PubMed] [Google Scholar]
- Chen F, Dong G, Ma X, Wang F, Zhang Y, Xiong E, Wu J, Wang H, Qian Q, Wu L et al. 2018. UMP kinase activity is involved in proper chloroplast development in rice. Photosynthesis Research 137: 53–67. [DOI] [PMC free article] [PubMed] [Google Scholar]
- Chen F, Wang F, Wu F, Mao W, Zhang G, Zhou M. 2010. Modulation of exogenous glutathione in antioxidant defense system against Cd stress in the two barley genotypes differing in Cd tolerance. Plant Physiology and Biochemistry 48: 663–672. [DOI] [PubMed] [Google Scholar]
- Chen Z, Newman M, Zhou M, Mendham N, Zhang G, Shabala S. 2005. Screening plants for salt tolerance by measuring K+ flux: a case study for barley. Plant, Cell & Environment 28: 1230–1246. [Google Scholar]
- Choudhury FK, Rivero RM, Blumwald E, Mittler R. 2017. Reactive oxygen species, abiotic stress and stress combination. The Plant Journal 90: 856–867. [DOI] [PubMed] [Google Scholar]
- Ding WN, Lin L, Zhang BT, Xiang XB, Wu J, Pan ZC, Zhu SH. 2015. OsKASI, a beta‐ketoacyl‐[acyl carrier protein] synthase I, is involved in root development in rice (Oryza sativa L.). Planta 242: 203–213. [DOI] [PubMed] [Google Scholar]
- Ding Y, Shi Y, Yang S. 2019. Advances and challenges in uncovering cold tolerance regulatory mechanisms in plants. New Phytologist 222: 1690–1704. [DOI] [PubMed] [Google Scholar]
- Emanuelsson O, Nielsen H, von Heijne G. 1999. ChloroP, a neural network‐based method for predicting chloroplast transit peptides and their cleavage sites. Protein Science 8: 978–984. [DOI] [PMC free article] [PubMed] [Google Scholar]
- Falcone DL, Ogas JP, Somerville CR. 2004. Regulation of membrane fatty acid composition by temperature in mutants of Arabidopsis with alterations in membrane lipid composition. BMC Plant Biology 4: 17. [DOI] [PMC free article] [PubMed] [Google Scholar]
- Feng X, Liu W, Cao F, Wang Y, Zhang G, Chen ZH, Wu F. 2020. Overexpression of HvAKT1 improves drought tolerance in barley by regulating root ion homeostasis and ROS and NO signaling. Journal of Experimental Botany 71: 6587–6600. [DOI] [PubMed] [Google Scholar]
- Finka A, Cuendet AF, Maathuis FJ, Saidi Y, Goloubinoff P. 2012. Plasma membrane cyclic nucleotide gated calcium channels control land plant thermal sensing and acquired thermotolerance. Plant Cell 24: 3333–3348. [DOI] [PMC free article] [PubMed] [Google Scholar]
- He L, Zhang S, Qiu ZN, Zhao J, Nie WD, Lin HY, Zhu ZG, Zeng DL, Qian Q, Zhu L. 2018. FRUCTOKINASE‐LIKE PROTEIN 1 interacts with TRXz to regulate chloroplast development in rice. Journal of Integrative Plant Biology 60: 94–111. [DOI] [PubMed] [Google Scholar]
- He M, Ding NZ. 2020. Plant unsaturated fatty acids: multiple roles in stress response. Frontiers in Plant Science 11: 562785. [DOI] [PMC free article] [PubMed] [Google Scholar]
- Hiei Y, Ohta S, Komari T, Kumashiro T. 1994. Efficient transformation of rice (Oryza sativa L.) mediated by Agrobacterium and sequence analysis of the boundaries of the T‐DNA. The Plant Journal 6: 271–282. [DOI] [PubMed] [Google Scholar]
- Higashi Y, Okazaki Y, Myouga F, Shinozaki K, Saito K. 2015. Landscape of the lipidome and transcriptome under heat stress in Arabidopsis thaliana . Scientific Reports 5: 10533. [DOI] [PMC free article] [PubMed] [Google Scholar]
- Higashi Y, Okazaki Y, Takano K, Myouga F, Shinozaki K, Knoch E, Fukushima A, Saito K. 2018. HEAT INDUCIBLE LIPASE1 remodels chloroplastic monogalactosyldiacylglycerol by liberating alpha‐linolenic acid in arabidopsis leaves under heat stress. Plant Cell 30: 1887–1905. [DOI] [PMC free article] [PubMed] [Google Scholar]
- Higashi Y, Saito K. 2019. Lipidomic studies of membrane glycerolipids in plant leaves under heat stress. Progress in Lipid Research 75: 100990. [DOI] [PubMed] [Google Scholar]
- Janni M, Gulli M, Maestri E, Marmiroli M, Valliyodan B, Nguyen HT, Marmiroli N. 2020. Molecular and genetic bases of heat stress responses in crop plants and breeding for increased resilience and productivity. Journal of Experimental Botany 71: 3780–3802. [DOI] [PMC free article] [PubMed] [Google Scholar]
- Kohli GS, John U, Van Dolah FM, Murray SA. 2016. Evolutionary distinctiveness of fatty acid and polyketide synthesis in eukaryotes. The ISME Journal 10: 1877–1890. [DOI] [PMC free article] [PubMed] [Google Scholar]
- Lai CY, Cronan JE. 2004. Isolation and characterization of beta‐ketoacyl‐acyl carrier protein reductase (fabG) mutants of Escherichia coli and Salmonella enterica serovar Typhimurium. Journal of Bacteriology 186: 1869–1878. [DOI] [PMC free article] [PubMed] [Google Scholar]
- Li BJ, Gao K, Ren HM, Tang WQ. 2018. Molecular mechanisms governing plant responses to high temperatures. Journal of Integrative Plant Biology 60: 757–779. [DOI] [PubMed] [Google Scholar]
- Li Q, Shen WY, Zheng Q, Fowler DB, Zou JT. 2016. Adjustments of lipid pathways in plant adaptation to temperature stress. Plant Signaling & Behavior 11: e1058461. [DOI] [PMC free article] [PubMed] [Google Scholar]
- Li Q, Zheng Q, Shen W, Cram D, Fowler DB, Wei Y, Zou J. 2015. Understanding the biochemical basis of temperature‐induced lipid pathway adjustments in plants. Plant Cell 27: 86–103. [DOI] [PMC free article] [PubMed] [Google Scholar]
- Li X‐M, Chao D‐Y, Wu Y, Huang X, Chen Ke, Cui L‐G, Su L, Ye W‐W, Chen H, Chen H‐C et al. 2015. Natural alleles of a proteasome α2 subunit gene contribute to thermotolerance and adaptation of African rice. Nature Genetics 47: 827–833. [DOI] [PubMed] [Google Scholar]
- Liang MH, Jiang JG, Wang L, Zhu JH. 2020. Transcriptomic insights into the heat stress response of Dunaliella bardawil . Enzyme and Microbial Technology 132: 109436. [DOI] [PubMed] [Google Scholar]
- Lim GH, Singhal R, Kachroo A, Kachroo P. 2017. Fatty acid‐ and lipid‐mediated signaling in plant defense. Annual Review of Phytopathology 55: 505–536. [DOI] [PubMed] [Google Scholar]
- Liu J, Zhang C, Wei C, Liu X, Wang M, Yu F, Xie Q, Tu J. 2016. The RING finger ubiquitin E3 ligase OsHTAS enhances heat tolerance by promoting H2O2‐induced stomatal closure in rice. Plant Physiology 170: 429–443. [DOI] [PMC free article] [PubMed] [Google Scholar]
- Liu M, Zhu J, Dong Z. 2021. Immediate transcriptional responses of Arabidopsis leaves to heat shock. Journal of Integrative Plant Biology 63: 468–483. [DOI] [PubMed] [Google Scholar]
- Liu XH, Lyu YS, Yang W, Yang ZT, Lu SJ, Liu JX. 2020. A membrane‐associated NAC transcription factor OsNTL3 is involved in thermotolerance in rice. Plant Biotechnology Journal 18: 1317–1329. [DOI] [PMC free article] [PubMed] [Google Scholar]
- Liu XX, Ma DK, Zhang ZY, Wang SW, Du S, Deng XP, Yin LN. 2019. Plant lipid remodeling in response to abiotic stresses. Environmental and Experimental Botany 165: 174–184. [Google Scholar]
- Liu ZW, Wang ZY, Gu H, You J, Hu MM, Zhang YJ, Zhu Z, Wang YH, Liu SJ, Chen LM et al. 2018. Identification and phenotypic characterization of ZEBRA LEAF16 encoding a beta‐hydroxyacyl‐ACP dehydratase in rice. Frontiers in Plant Science 9: 782. [DOI] [PMC free article] [PubMed] [Google Scholar]
- Lobell DB, Schlenker W, Costa‐Roberts J. 2011. Climate trends and global crop production since 1980. Science 333: 616–620. [DOI] [PubMed] [Google Scholar]
- Martiniere A, Shvedunova M, Thomson AJ, Evans NH, Penfield S, Runions J, McWatters HG. 2011. Homeostasis of plasma membrane viscosity in fluctuating temperatures. New Phytologist 192: 328–337. [DOI] [PubMed] [Google Scholar]
- Mishkind M, Vermeer JE, Darwish E, Munnik T. 2009. Heat stress activates phospholipase D and triggers PIP accumulation at the plasma membrane and nucleus. The Plant Journal 60: 10–21. [DOI] [PubMed] [Google Scholar]
- Mittler R, Finka A, Goloubinoff P. 2012. How do plants feel the heat? Trends in Biochemical Sciences 37: 118–125. [DOI] [PubMed] [Google Scholar]
- Moellering ER, Muthan B, Benning C. 2010. Freezing tolerance in plants requires lipid remodeling at the outer chloroplast membrane. Science 330: 226–228. [DOI] [PubMed] [Google Scholar]
- Mou Z, He Y, Dai Y, Liu X, Li J. 2000. Deficiency in fatty acid synthase leads to premature cell death and dramatic alterations in plant morphology. Plant Cell 12: 405–418. [DOI] [PMC free article] [PubMed] [Google Scholar]
- Mueller SP, Unger M, Guender L, Fekete A, Mueller MJ. 2017. Phospholipid:diacylglycerol acyltransferase‐mediated triacylglyerol synthesis augments basal thermotolerance. Plant Physiology 175: 486–497. [DOI] [PMC free article] [PubMed] [Google Scholar]
- Niu Y, Xiang Y. 2018. An overview of biomembrane functions in plant responses to high‐temperature stress. Frontiers in Plant Science 9: 915. [DOI] [PMC free article] [PubMed] [Google Scholar]
- Ohama N, Sato H, Shinozaki K, Yamaguchi‐Shinozaki K. 2017. Transcriptional regulatory network of plant heat stress response. Trends in Plant Science 22: 53–65. [DOI] [PubMed] [Google Scholar]
- Ohlrogge J, Browse J. 1995. Lipid biosynthesis. Plant Cell 7: 957–970. [DOI] [PMC free article] [PubMed] [Google Scholar]
- Ohlrogge JB, Jaworski JG. 1997. Regulation of fatty acid synthesis. Annual Review of Plant Physiology and Plant Molecular Biology 48: 109–136. [DOI] [PubMed] [Google Scholar]
- Peng S, Huang J, Sheehy JE, Laza RC, Visperas RM, Zhong X, Centeno GS, Khush GS, Cassman KG. 2004. Rice yields decline with higher night temperature from global warming. Proceedings of the National Academy of Sciences, USA 101: 9971–9975. [DOI] [PMC free article] [PubMed] [Google Scholar]
- Rao D, Momcilovic I, Kobayashi S, Callegari E, Ristic Z. 2004. Chaperone activity of recombinant maize chloroplast protein synthesis elongation factor, EF‐Tu. European Journal of Biochemistry 271: 3684–3692. [DOI] [PubMed] [Google Scholar]
- Ristic Z, Momcilovic I, Fu J, Callegari E, DeRidder BP. 2007. Chloroplast protein synthesis elongation factor, EF‐Tu, reduces thermal aggregation of rubisco activase. Journal of Plant Physiology 164: 1564–1571. [DOI] [PubMed] [Google Scholar]
- Saidi Y, Peter M, Finka A, Cicekli C, Vigh L, Goloubinoff P. 2010. Membrane lipid composition affects plant heat sensing and modulates Ca2+‐dependent heat shock response. Plant Signaling & Behavior 5: 1530–1533. [DOI] [PMC free article] [PubMed] [Google Scholar]
- Shen H, Zhong X, Zhao F, Wang Y, Yan B, Li Q, Chen G, Mao B, Wang J, Li Y et al. 2015. Overexpression of receptor‐like kinase ERECTA improves thermotolerance in rice and tomato. Nature Biotechnology 33: 996–1003. [DOI] [PubMed] [Google Scholar]
- Sun AZ, Guo FQ. 2016. Chloroplast retrograde regulation of heat stress responses in plants. Frontiers in Plant Science 7: 398. [DOI] [PMC free article] [PubMed] [Google Scholar]
- Suzuki N, Koussevitzky S, Mittler R, Miller G. 2012. ROS and redox signalling in the response of plants to abiotic stress. Plant, Cell & Environment 35: 259–270. [DOI] [PubMed] [Google Scholar]
- Tang QY, Zhang CX. 2013. Data Processing System (DPS) software with experimental design, statistical analysis and data mining developed for use in entomological research. Insect Science 20: 254–260. [DOI] [PubMed] [Google Scholar]
- Tang Y, Gao C‐C, Gao Y, Yang Y, Shi B, Yu J‐L, Lyu C, Sun B‐F, Wang H‐L, Xu Y et al. 2020. OsNSUN2‐mediated 5‐methylcytosine mRNA modification enhances rice adaptation to high temperature. Developmental Cell 53: 272–286 e277. [DOI] [PubMed] [Google Scholar]
- One Thousand Plant Transcriptomes I . 2019. One thousand plant transcriptomes and the phylogenomics of green plants. Nature 574: 679–685. [DOI] [PMC free article] [PubMed] [Google Scholar]
- Troncoso‐Ponce MA, Nikovics K, Marchive C, Lepiniec L, Baud S. 2016. New insights on the organization and regulation of the fatty acid biosynthetic network in the model higher plant Arabidopsis thaliana . Biochimie 120: 3–8. [DOI] [PubMed] [Google Scholar]
- Veyron‐Churlet R, Zanella‐Cleon I, Cohen‐Gonsaud M, Molle V, Kremer L. 2010. Phosphorylation of the Mycobacterium tuberculosis beta‐ketoacyl‐acyl carrier protein reductase MabA regulates mycolic acid biosynthesis. Journal of Biological Chemistry 285: 12714–12725. [DOI] [PMC free article] [PubMed] [Google Scholar]
- Volkov RA, Panchuk II, Mullineaux PM, Schoffl F. 2006. Heat stress‐induced H2O2 is required for effective expression of heat shock genes in Arabidopsis. Plant Molecular Biology 61: 733–746. [DOI] [PubMed] [Google Scholar]
- Wahid A, Gelani S, Ashraf M, Foolad MR. 2007. Heat tolerance in plants: an overview. Environmental and Experimental Botany 61: 199–223. [Google Scholar]
- Wang D, Qin B, Li X, Tang D, Zhang Y, Cheng Z, Xue Y. 2016. Nucleolar DEAD‐box RNA helicase TOGR1 regulates thermotolerant growth as a pre‐rRNA chaperone in rice. PLoS Genetics 12: e1005844. [DOI] [PMC free article] [PubMed] [Google Scholar]
- Wang HS, Yu C, Tang XF, Wang LY, Dong XC, Meng QW. 2010. Antisense‐mediated depletion of tomato endoplasmic reticulum omega‐3 fatty acid desaturase enhances thermal tolerance. Journal of Integrative Plant Biology 52: 568–577. [DOI] [PubMed] [Google Scholar]
- Wei H, Liu J, Wang Y, Huang N, Zhang X, Wang L, Zhang J, Tu J, Zhong X. 2013. A dominant major locus in chromosome 9 of rice (Oryza sativa L.) confers tolerance to 48 °C high temperature at seedling stage. Journal of Heredity 104: 287–294. [DOI] [PubMed] [Google Scholar]
- Wu GZ, Xue HW. 2010. Arabidopsis beta‐ketoacyl‐[acyl carrier protein] synthase I is crucial for fatty acid synthesis and plays a role in chloroplast division and embryo development. Plant Cell 22: 3726–3744. [DOI] [PMC free article] [PubMed] [Google Scholar]
- Wu J, Sun Y, Zhao Y, Zhang J, Luo L, Li M, Wang J, Yu H, Liu G, Yang L et al. 2015. Deficient plastidic fatty acid synthesis triggers cell death by modulating mitochondrial reactive oxygen species. Cell Research 25: 621–633. [DOI] [PMC free article] [PubMed] [Google Scholar]
- Xiong G, Li R, Qian Q, Song X, Liu X, Yu Y, Zeng D, Wan J, Li J, Zhou Y. 2010. The rice dynamin‐related protein DRP2B mediates membrane trafficking, and thereby plays a critical role in secondary cell wall cellulose biosynthesis. The Plant Journal 64: 56–70. [DOI] [PubMed] [Google Scholar]
- Yu HD, Yang XF, Chen ST, Wang YT, Li JK, Shen Q, Liu XL, Guo FQ. 2012. Downregulation of chloroplast RPS1 negatively modulates nuclear heat‐responsive expression of HsfA2 and its target genes in Arabidopsis. PLoS Genetics 8: e1002669. [DOI] [PMC free article] [PubMed] [Google Scholar]
- Yu Y, Tang T, Qian Q, Wang Y, Yan M, Zeng D, Han B, Wu CI, Shi S, Li J. 2008. Independent losses of function in a polyphenol oxidase in rice: differentiation in grain discoloration between subspecies and the role of positive selection under domestication. Plant Cell 20: 2946–2959. [DOI] [PMC free article] [PubMed] [Google Scholar]
- Zhang L, Paakkarinen V, van Wijk KJ, Aro EM. 1999. Co‐translational assembly of the D1 protein into photosystem II. Journal of Biological Chemistry 274: 16062–16067. [DOI] [PubMed] [Google Scholar]
- Zhao C, Liu B, Piao S, Wang X, Lobell DB, Huang Y, Huang M, Yao Y, Bassu S, Ciais P et al. 2017. Temperature increase reduces global yields of major crops in four independent estimates. Proceedings of the National Academy of Sciences, USA 114: 9326–9331. [DOI] [PMC free article] [PubMed] [Google Scholar]
- Zhao C, Wang Y, Chan KX, Marchant DB, Franks PJ, Randall D, Tee EE, Chen G, Ramesh S, Phua SY et al. 2019. Evolution of chloroplast retrograde signaling facilitates green plant adaptation to land. Proceedings of the National Academy of Sciences, USA 116: 5015–5020. [DOI] [PMC free article] [PubMed] [Google Scholar]
- Zhao Y, Du H, Wang Y, Wang H, Yang S, Li C, Chen N, Yang H, Zhang Y, Zhu Y et al. 2021. The calcium‐dependent protein kinase ZmCDPK7 functions in heat‐stress tolerance in maize. Journal of Integrative Plant Biology 63. [DOI] [PubMed] [Google Scholar]
- Zhao Y, Luo L, Xu J, Xin P, Guo H, Wu J, Bai L, Wang G, Chu J, Zuo J et al. 2018. Malate transported from chloroplast to mitochondrion triggers production of ROS and PCD in Arabidopsis thaliana . Cell Research 28: 448–461. [DOI] [PMC free article] [PubMed] [Google Scholar]
- Zhao Y, Yu H, Zhou JM, Smith SM, Li J. 2020. Malate circulation: linking chloroplast metabolism to mitochondrial ROS. Trends in Plant Science 25: 446–454. [DOI] [PubMed] [Google Scholar]
- Zheng SZ, Liu YL, Li B, Shang ZL, Zhou RG, Sun DY. 2012. Phosphoinositide‐specific phospholipase C9 is involved in the thermotolerance of Arabidopsis. The Plant Journal 69: 689–700. [DOI] [PubMed] [Google Scholar]
- Zhou D, Li T, Yang Y, Qu Z, Ouyang L, Jiang Z, Lin X, Zhu C, Peng L, Fu J et al. 2020. OsPLS4 is involved in cuticular wax biosynthesis and affects leaf senescence in rice. Frontiers in Plant Science 11: 782. [DOI] [PMC free article] [PubMed] [Google Scholar]
- Zhu JK. 2016. Abiotic stress signaling and responses in plants. Cell 167: 313–324. [DOI] [PMC free article] [PubMed] [Google Scholar]
- Zhu SQ, Yu CM, Liu XY, Ji BH, Jiao DM. 2007. Changes in unsaturated levels of fatty acids in thylakoid PSII membrane lipids during chilling‐induced resistance in rice. Journal of Integrative Plant Biology 49: 463–471. [Google Scholar]
Associated Data
This section collects any data citations, data availability statements, or supplementary materials included in this article.
Supplementary Materials
Fig. S1 The hts1 mutant exhibits a pale green phenotype.
Fig. S2 Phenotypic characterization of wild‐type and hts1 mutant rice (Oryza sativa).
Fig. S3 HTS1 is not a general factor response for environmental stress tolerance.
Fig. S4 HTS1 is involved in the heat‐induced oxidative stress response.
Fig. S5 Application of exogenous glutathione partially reverses the heat‐sensitive phenotype of the hts1 mutant.
Fig. S6 Growth recovery of hts1‐Com plants at the seedling and reproductive stages under field conditions.
Fig. S7 Phylogenetic trees and sequence alignment of HTS1 and its homologous proteins in plants.
Fig. S8 Phylogenetic analysis of HTS1 in different plant and algal species selected from the 1KP database.
Fig. S9 Anti‐HTS1 antibody detection by western blotting.
Fig. S10 Expression patterns of HTS1 in rice (Oryza sativa).
Fig. S11 Western blot of HTS1 protein incubated at 25°C (control) or 45°C for the indicated time.
Fig. S12 Expression and subcellular localization of two rice KAR homologs.
Fig. S13 Expression levels of rice heat‐resistance‐associated genes in hts1 and WT plants under heat treatment.
Table S1 List of primers used in this study.
Table S2 Statistics of evolution of HTS1s in the 1KP dataset.
Table S3 The proportions of identified lipid classes in leaves of 2‐wk‐old rice wild‐type and hts1 mutant seedlings.
Table S4 All detected lipid species in leaves of 2‐wk‐old rice wild‐type and hts1 mutant seedlings.
Please note: Wiley Blackwell are not responsible for the content or functionality of any Supporting Information supplied by the authors. Any queries (other than missing material) should be directed to the New Phytologist Central Office.