Abstract
Clinical cancer genomic testing based on next‐generation sequencing can help select genotype‐matched therapy and provide diagnostic and prognostic information. Pathological tissue from malignant tumors obtained during routine practice are frequently used for genomic testing. This article is aimed to standardize the proper handling of pathological specimens in practice for genomic medicine based on the findings established in “Guidelines on the handling of pathological tissue samples for genomic medicine (in Japanese)” published by The Japanese Society of Pathology (JSP) in 2018. The two‐part practical guidelines are based on empirical data analyses; Part 1 describes the standard preanalytic operating procedures for tissue collection, processing, and storage of formalin‐fixed paraffin‐embedded (FFPE) samples, while Part 2 describes the assessment and selection of FFPE samples appropriate for genomic testing, typically conducted by a pathologist. The guidelines recommend that FFPE sample blocks be used within 3 years from preparation, and the tumor content should be ≥30% (minimum 20%). The empirical data were obtained from clinical studies performed by the JSP in collaboration with leading Japanese cancer genome research projects. The Japanese Ministry of Health, Labour, and Welfare (MHLW) recommended to comply with the JSP practical guidelines in implementing cancer genomic testing under the national health insurance system in over 200 MHLW‐designated core and cooperative cancer genome medicine hospitals in Japan.
Keywords: cancer genomic medicine, gene panel testing, next‐generation sequencing, sample processing
Abbreviations
- CDx
companion diagnostics
- CGM
cancer genome medicine
- CLIA
Clinical Laboratory Improvement Amendment
- Cq
quantification cycle
- C t
threshold cycle
- FFPE
formalin‐fixed paraffin‐embedded
- H&E
hematoxylin and eosin
- IHC
immunohistochemistry
- ISH
in situ hybridization
- IVD
in vitro diagnostics
- NBF
neutral buffered formalin
- NGS
next‐generation sequencing
- QC
quality control
INTRODUCTION
In Japan, cancer genomic testing (also termed cancer gene panel testing or genomic profile testing) using solid tumor tissue samples has increased rapidly since the national health insurance system coverage started in 2019. 1 , 2 In routine pathological practice, most tissue samples obtained by biopsy or surgery are processed as formalin‐fixed paraffin‐embedded (FFPE) materials. The FFPE process enables long‐term storage of tissues and cells at room temperature, facilitating multiple molecular tests for diagnostic, prognostic, and predictive markers in addition to morphological diagnosis. Moreover, the development of various breakthrough technologies, such as multiplex or comprehensive genomic analyses, have accelerated the use of FFPE samples in clinical practice and research settings. As with fresh samples used in research, FFPE samples must be prepared to minimize the degeneration of biomolecules such as nucleic acids and proteins; however, this has long been considered difficult in most hospitals due to the heavy workload of routine practice. Meanwhile, given the introduction of advanced technologies such as next‐generation sequencing (NGS) in clinical settings, the quality of FFPE samples processed by pathological laboratories should be kept high for use in cancer genomic testing.
Several variable preanalytic factors affect the FFPE sample quality. 3 Therefore, it is essential for the clinicians who collect and submit specimens, pathology technologists who prepare them, and their supervisors to be aware of these factors in their medical institutions (Table 1). As a result, several guidelines established for the diagnostics utilized for predicting drug efficacy (companion diagnostics [CDx]) in cancer patients provide recommendations for the fixation process. Over 2000 FFPE samples from gastrointestinal cancer patients were analyzed in the nationwide cancer genome screening project, SCRUM‐Japan/GI‐SCREEN, which revealed inter‐laboratory differences in sample quality (Figure 1). 4 In another clinical research project, TOP‐GEAR, FFPE samples from over 200 patients with various types of cancers were analyzed, and the results of genomic testing based on FFPE samples were clinically validated in hospitals that comply with Clinical Laboratory Improvement Amendment (CLIA) requirements. 5
Table 1.
Main variable factors affecting the preanalytical phase of FFPE sample processing
| Processes | Persons in charge of the process | Preanalytical variable factors |
|---|---|---|
| Pre‐fixation process | Clinicians (persons who collect specimens) |
|
| Fixation process |
Pathologists Pathology technologists |
|
| Post‐fixation process |
Pathologists Pathology technologists |
|
| (Post‐FFPE process) | Pathology technologists |
|
Abbreviation: FFPE, formalin‐fixed paraffin‐embedded.
Figure 1.
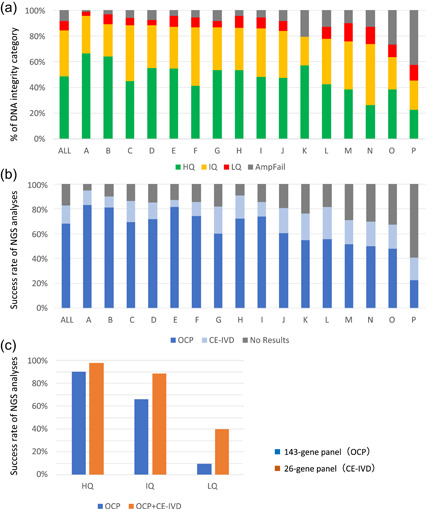
Inter‐institutional differences in the results of genomic testing using formalin‐fixed paraffin‐embedded (FFPE) samples prepared in routine practice. In total, 2573 gastrointestinal cancer FFPE samples (biopsy and surgical specimens) prepared during routine practice were submitted by 19 institutions participating in the SCRUM‐Japan/GI‐SCREEN nationwide, large‐scale genome screening research project. Among them, data were analyzed for 16 institutions that submitted ≥40 samples for genomic testing. The FFPE samples were sent to a Thermo Fisher Scientific Clinical Laboratory Improvement Amendments‐certified laboratory, where they were subjected to quality control (QC) assay and next‐generation sequencing according to the laboratory's standard operating procedures. Manual microdissection was performed when required, and the ΔC t values were determined after DNA and RNA extraction. Targeted sequencing (Oncomine Cancer Research Panel; OCP, 143 genes and Oncomine Solid Tumour DNA/Fusion Transcript Kit; CE‐IVD, 26 genes) using the Ion PGM™ System (Thermo Fisher Scientific) was performed on the samples that passed the QC. (a) The samples were classified into three categories based on the ΔC t values (high [HQ], intermediate [IQ], and low quality [LQ]); those for which ΔC t values could not be obtained owing to very LQ were classified as PCR‐failures (AmpFail). Overall (indicated as “All”), 48.7%, 35.4%, and 15.9% of the samples from the 19 institutes were classified as high, intermediate, and LQ/PCR‐failure samples for DNA integrity, respectively. There were marked differences in quality among the samples from the 16 institutions that submitted ≥40 samples. (b) Samples (HQ, IQ, and LQ) for which ΔC t values were obtained were analyzed using a comprehensive gene panel (143‐gene panel) and a small panel (26‐gene panel). The success rates of these analyses highly correlated with the result from the QC assay shown in (a). The institutions with high proportions of LQ samples and PCR‐failures also exhibited high failure rates for both panels, and marked differences in quality were observed among the samples from these 16 institutions. Overall (“All” in b), the success rate was 68.1% for the comprehensive gene panel and 14.7% for the small panel, while the failure rate for both panels was 17.2%. (c) The sequencing success rates for the three quality categories are shown, with the HQ samples exhibiting success rates of 90.2% for the 143‐gene panel and 97.4% for the 26‐gene panel
In 2017, the Ministry of Health, Labour, and Welfare (MHLW) initiated a consortium to promote genomic cancer medicine that outlined the framework for the national cancer genomic medicine platform in Japan and presented the blueprint for genomic medicine using NGS (Table 2). Medical institutions and hospitals have been requested to meet the FFPE sample quality standards for NGS testing when performing cancer genome profiling tests approved for Japan's national insurance system. 2 Stricter sample quality controls are required for genomic testing in analyzing multiple genes than the current requirements for singleplex gene testing.
Table 2.
Use of NGS in the national platform of CGM in Japan
| Type of genomic testing | Institution | Type of medical care |
|---|---|---|
| Multiplex CDx system (approved as IVD) | Common hospitals or commercial laboratories | Regulatory approval and insurance coverage |
| Gene Panel testing of clinically relevant genes including genes for which the level of therapeutic evidence is not high (approved as IVD) | CGM hospitals and medical institutions | Regulatory approval and insurance coverage (after advanced medical care is performed, if needed) |
| Whole‐genome sequencing, and immuno‐oncology testing (non‐IVD) | Performed at medical institutions that meet certain requirements | Combined treatment using advanced medical care that is not covered by insurance |
Abbreviations: CGM, cancer genome medicine; IVD, in vitro diagnostics; NGS, next‐generation sequencing.
Hence, the Japanese Society of Pathology (JSP) released Japanese‐language guidelines on the handling of pathological tissue samples for genomic medicine in March 2018, following the release of the tentative edition in September 2017. This article (practical guidelines) is based on the content of the Japanese‐language guidelines and intends to cover the FFPE sample handling requirements used in cancer genomic testing systems approved as in vitro diagnostics (IVD) and medical devices by the MHLW and covered by the national health insurance system. Therefore, the guidelines deal with requirements for highly comprehensive genomic analyses such as whole‐exome and whole‐transcriptome sequencing secondarily. Due to technological innovation, advances in knowledge, and improvements in the genomic medicine system, the scope of these practical guidelines is expected to change continuously.
EFFECTIVE HANDLING OF FFPE TISSUE SAMPLES
The practical guidelines described here aim at enabling the introduction of cancer genomic medicine in the future. Parts 1 and 2 outline the proper handling of FFPE samples for cancer genomic testing in the entire preanalytical phase and the initial process of the analytical phase, which are both performed in the pathology laboratories of medical institutions. Effective FFPE sample processing is necessary for accurate diagnosis; simultaneously, it is essential to follow the recommended molecular testing methods such as immunohistochemistry, particularly for CDx. Therefore, extreme shortening of the fixation process is difficult, as this can lead to insufficient fixation of protein molecules, although some degeneration and modification of nucleic acids and proteins is unavoidable even with adequate fixation. As the FFPE sample preparation requires extensive processing and is significantly more time‐consuming than other samples such as blood, even a slight modification of operating procedures can significantly burden pathology laboratories in medical institutions that have limited technical resources and infrastructure. Therefore, it is recommended that the practical guidelines are followed to the greatest extent possible.
The recommendations in the practical guidelines for genomic medicine are based on extensive empirical data, information from the scientific literature, and the previously released JSP guidelines for genome research. 6 The recommendation categories are classified into three groups as described in the explanatory notes below. However, recommendations for general clinical practice according to evidence‐based medicine are not presented.
| (C) Items recommended as the best practice in a routine clinical setting (C indicates “Clinical recommendation”).(R) Items recommended when FFPE samples are used for the comprehensive genomic analysis (including whole‐exome and whole‐transcriptome sequencing) in the interventional study or as genomic testing not covered by the national health insurance system in Japan (R means “Research recommendation”).(N) Items that should be avoided (N indicates “Not recommended”) |
Part 1: Recommendations for the preanalytical phase
-
(a)
Pre‐fixation process
Handling of tissue immediately after resection or collection 1.1. Surgical specimens should be stored at 4°C until formalin fixation and preferably fixed within 1 h, or not later than 3 h after resection (C). 6 , 7 1.2. Small endoscopically resected specimens (e.g., digestive tract specimens obtained from endoscopic mucosal resection) should be placed in formalin fixative immediately after sample collection (C). 1.3. Tissue specimens obtained by biopsy should be immediately placed in formalin fixative (C). 1.4. Specimens for preparing cell blocks should be immersed in formalin fixative as soon as possible after the necessary pretreatment (C). 1.5. Keeping surgical specimens at room temperature for 30 min or longer after resection should be avoided as much as possible (N). Note for 1.1: It has been reported that the time from tissue resection to fixation affects the results, if it exceeds 2 h for the in situ hybridization (ISH) (HER2) and 1 h for the immunohistochemistry (IHC; hormone receptors). 8 The ASCO/CAP guidelines for breast cancer recommend tissue fixation within 1 h. 7
Note for 1.1: As the penetration rate of formalin fixative is approximately 1 mm/h, it is recommended that appropriate cuts should be made in the specimen before fixation, particularly for surgical specimens, so that they are thin enough to enable complete tissue fixation by the time of gross cutting. 9
Note for 1.1–1.3: If the specimens are intended for clinical research, it is necessary to immerse them in fixing solution immediately after resection or collection. 6
Note for 1.1 and 1.5: Due to the complex pre‐fixation process, surgical specimens tend to be of lower quality and yield less nucleic acid than biopsy specimens (Figure 2). 10
Note for 1.4: Among cytological specimens, some fluid specimens obtained from the body cavity are processed as cell blocks. Commonly used preparing method of cell block include cell collection method via centrifugation and cell solidification method via gelation, in each of which there are several different procedures, and none of which is currently standardized. Although the applicability of these processing methods to genomic medicine is unknown, they have been used in many institutions in Japan, and can be used in molecular testing for CDx. 11
-
(b)
Fixation process
Composition of formalin fixative 1.6. For buffering formalin fixative, a neutral buffered solution should preferably be used; avoid acidic or unbuffered solutions (C). 1.7. A 10% solution (3.7% formaldehyde) should preferably be used as a formalin fixative (C). Optimal fixation time 1.8. Following the recommendations in several CDx guidelines (Table 3), tissue specimens (surgically or endoscopically resected specimens and biopsy specimens) should be fixed for 6−48 h (C) (Figures 3 and 4 and 6 ). 1.9. Sample quality deteriorates due to inadequate fixation; therefore, insufficient fixation and over fixation should be avoided (N). Optimal volume of fixative for formalin fixation 1.10.Ten times the sample volume per tissue should be used for formalin fixation (C). 1.11.Formalin fixation can be performed at room temperature (C). Note for 1.6 and 1.7: In several CDx assays using IHC, a 10% neutral buffered formalin solution is recommended 7 , 12 , 13 , 14 , 15 , 16 , 17 , 18 , 19 (Table 3). Detection of protein expression by IHC is affected by the composition and concentration of the formalin fixative. 20 Moreover, results of a comparative analysis of DNA data quality using ΔC t and DNA integrity number (DIN) values supported the use of a 10% neutral buffered solution. 6
Note for 1.8: The known effects of formalin fixation on the quality of nucleic acids include chemical modifications of nucleic acid bases in addition to nucleic acid fragmentation. Notably, the deamination of cytosine that changes cytosine into uracil produces thymine (a C > T substitution) during the PCR amplification process. 21 , 22 Extent of deamination significantly increases with increasing fixation time over 72 h; therefore, samples should preferably not be fixed for more than 48 h (C) (Figures 3, 4, 5, 6).
Note for 1.8: The fixation of minute tissue specimens obtained by biopsy using techniques such as endobronchial ultrasonography (EBUS) or cytological specimens for cell block preparation can be completed in a shorter duration (e.g., 6−24 h). 16
Note for 1.8: It is difficult to prepare an NGS library (particularly when using comprehensive gene panels) from FFPE samples that were fixed for prolonged duration, particularly when using samples that were fixed for 7 days or longer (N) (Figures 3 and 4 and 6 ).
Note for 1.8: If there are remaining specimens that can be used for future genomic testing after performing routine pathological diagnosis, or when a re‐biopsy is planned immediately for cancer genomic testing, the use of superior, non‐formalin fixatives can be considered for preserving nucleic acids (R). 6
-
(c)
Post‐fixation processes
Figure 2.
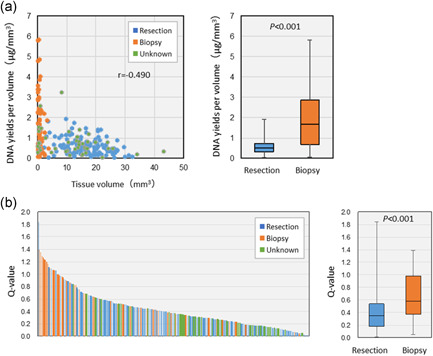
Yield and quality of DNA obtained from formalin‐fixed paraffin‐embedded (FFPE) samples prepared in routine practice. The yield and quality of DNA obtained from FFPE tissue samples of 233 patients with solid tumors analyzed in the first term of the TOP‐GEAR project were examined. DNA was extracted from five 10‐µm sections using the QIAamp DNA FFPE Tissue Kit (Qiagen). (a) The cross‐sectional tissue area was measured and multiplied by 50 µm to calculate the tissue volume. The surgical and biopsy specimens were assessed and compared (including samples not because they were from other institutions). The DNA yield per volume varied widely among the samples, with the biopsy specimens exhibiting a higher yield than the surgical specimens. (b) After DNA quality assessment using Q‐values (quantity of DNA measured using qPCR/quantity of double‐stranded DNA measured using the fluorescence method), the quality was compared between the surgical and biopsy specimens. The Q‐values varied widely among the samples, with the biopsy specimens exhibited better quality than the surgical specimens
Table 3.
Recommendations for the fixation process in the CDx‐guidance 7 , 12 , 13 , 14 , 15 , 16 , 17 , 18 , 19
| Type of cancer | Biomarkers | Target molecule | Method | Formalin fixatives | Fixation time |
|---|---|---|---|---|---|
| Breast cancer | HER2 | Protein | IHC | 10% NBF |
6–72 h <6 h should be avoided |
| HER2 | DNA | ISH | |||
| ER/PgR | Protein | IHC | |||
| Non‐small cell lung cancer | EGFR | DNA | Real‐time PCR | 10% NBF | 6–48 h |
| ALK | Protein | IHC | |||
| ALK | DNA | FISH | |||
| ROS1 | RNA | RT real‐time PCR | 10% NBF |
For surgical specimens, 18–36 h For biopsy specimens, 4–24 h |
|
| PD‐L1 | Protein | IHC | 10% NBF | 6–48 h | |
| Gastric cancer | HER2 | Protein | IHC | 10% NBF | 6–48 h |
| HER2 | DNA | ISH | |||
| Colorectal cancer |
RAS (KRAS/NRAS) |
DNA | PCR‐rSSO | 10% NBF | 6–48 h |
| Malignant melanoma | BRAF | DNA | Real‐time PCR | – | – |
Note: –, not described.
Abbreviations: CDx, companion diagnostics; IHC, immunohistochemistry; ISH, in situ hybridization; 10% NBF, 10% neutral buffered formalin.
Figure 3.
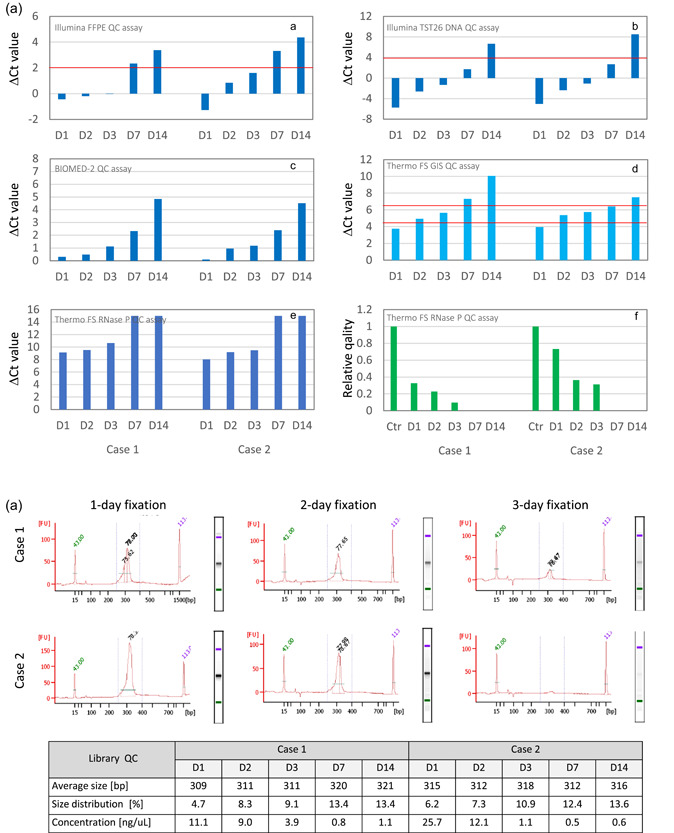
Effects of prolonged formalin fixation on DNA and next‐generation sequencing (NGS) library quality. The effects of formalin fixation time (1, 2, 3, 7, and 14 days) were examined at one institution using colorectal cancer specimens. DNA quality was determined by performing a real‐time PCR assay following DNA extraction using commercial formalin‐fixed paraffin‐embedded (FFPE) tissue DNA extraction kits (Qiagen). The libraries for amplicon sequencing (TruSeq Amplicon Cancer Panel; Illumina) were prepared using the MiSeq system (Illumina) and samples that passed the quality control (QC) assay. (a) The sample quality was determined by measuring the ΔC t values using the FFPE QC assay (Illumina) recommended for this gene panel. Samples fixed for 7 or 14 days did not pass the QC assay [A]. The other assay results were similar [B–F] (red line indicates cut‐off value). In the GI‐SCREEN study described above, the samples were classified into the three quality categories based on the results of assays performed using primer sets for specific housekeeping genes that differed in amplicon size [D]. As the FFPE blocks used in this analysis were prepared 3 years earlier, the ΔC t value of 2‐day‐fixed samples was classified as “intermediate.” For assays using primer sets for the RNase P gene that yield a different amplicon size, using an indicator utilizing calibration curves [F] instead of the usual ΔC t values [E] is recommended. (b) The libraries were prepared using 150 ng DNA, and library QC checks were performed on the Bioanalyzer 2100 (Agilent). Samples with 7‐ and 14‐day fixation that did not pass the ΔC t value‐based QC assay failed to produce library peaks. All samples with 1, 2, or 3‐day fixation produced library peaks and yielded sequencing results, although the peaks in the Case 2 sample with a 3‐day fixation were minute
Figure 4.
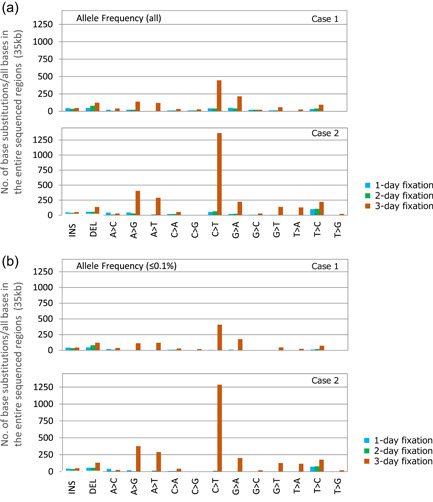
Effects of prolonged formalin fixation on base substitution. Amplicon sequencing using the TruSeq Amplicon Cancer Panel (Illumina) was performed using colorectal cancer specimens from two cases. The samples were fixed for 1, 2, or 3 days. Refer to Figure 3 for the sample preparation details. When the DNA quality was determined using ΔC t values, samples fixed for 7 or 14 days did not meet the quality standard for use with this panel, and the libraries could not be prepared. Therefore, only samples fixed for 1, 2, or 3 days were used in this analysis. An analysis of the sequencing data revealed no large deviations in the total number or read depth among these three samples. (a) An analysis of the numbers of each type of base change in the sequenced regions of this gene panel (35 kb) revealed that the number of base changes, including the C > T, A > G, and A > T substitutions, increased significantly on Day 3 of formalin fixation. (b) In the additional analyses focusing on an allele frequency of ≤0.1%, the number of base changes in (b) was similar to the total number of changes in (a), suggesting that the change was likely to be an artifact generated by fixation
Figure 5.
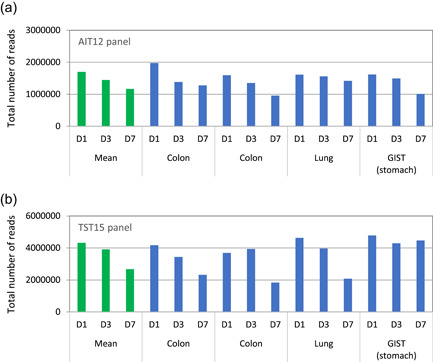
Effects of prolonged formalin fixation on total read number. Amplicon sequencing using two types of small gene panels, the GeneRead Actionable Insight Tumor Panel (12 genes) [AIT12] (Qiagen) and the TruSight Tumor 15 Kit (15 genes) [TST15] (Illumina) was performed on four tumor samples (two colon, one lung, and one gastrointestinal stromal tumor) that had undergone 1‐, 3‐, or 7‐day fixation. For the TST15 panel, the DNA quality was determined using a real‐time PCR assay (quality control [QC] results are shown in Figure 3a, Panel B). For amplicon sequencing using the AIT12 and TST15 panels, libraries were prepared using 40 and 20 ng dsDNA, respectively. After performing a library QC, the samples were analyzed using the GeneReader (Qiagen) and MiSeq systems (Illumina). All the samples were successfully analyzed with both small gene panels. Therefore, it can be inferred that the small gene panels are useful for the analysis of formalin‐fixed paraffin‐embedded (FFPE) samples containing low‐quality nucleic acids. However, the total number of reads decreased as formalin fixation time increased [A, B]; this effect varied depending on the gene panel used for analysis
Figure 6.
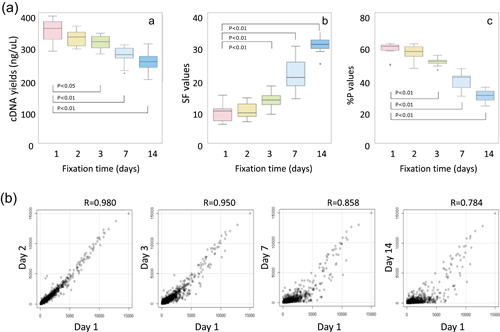
Effects of prolonged formalin fixation on microarray testing. The effects of fixation time (1, 2, 3, 7, and 14 days) on microarray analysis (GeneChip Human Genome U133 + 2.0 arrays; Affymetrix) performed for breast cancer‐recurrence risk prediction testing were examined using breast cancer samples from 11 cases. The cDNA was synthesized using 100 ng RNA extracted from each sample. After the yield was determined, the microarray testing was performed, and the fluorescence intensity was measured. (a) Examining the cDNA yield after the reverse transcription reaction and two quality control (QC) parameters for microarray testing (SF and % p values) revealed a significant change after 3‐day fixation (*p < 0.05; **p < 0.01) [A–C]. The SF value reflects the mean fluorescence intensity corresponding to the expression level obtained from all probes. It is expressed as a coefficient and used to normalize the mean fluorescence intensity to a specific level. A high value indicates the array is dark due to inappropriate measurement resulting from sample quality or procedural complications. The % p values indicate the proportion of expressed probes compared to all probes. A value below a certain proportion indicates that the measurement is likely to be inappropriate, and that the microarray data are less reliable. (b) Using 1‐day fixation as the control, a correlation analysis was performed to examine the effects of formalin fixation time on the overall expression level of the microarray probes. The results indicated that the correlation coefficients decreased with increased fixation time. In particular, the correlation coefficients for gene probes with a low expression level decreased significantly
| Decalcification |
| 1.12. When using specimens containing hard tissues, an EDTA decalcification should be performed (C); acid decalcification should be avoided (N). 6 |
| Paraffin‐embedding |
| 1.13. Conventional tissue processors (closed automated instruments) can be used while referring to general procedures (C). However, the influence of the reagents, processing protocol, and processor maintenance (e.g., the frequency of replacement) remains unknown. There are insufficient data on rapid‐type processors (continuous rapid automated instruments). |
| Storage of FFPE blocks |
| 1.14. FFPE blocks can be stored at room temperature (C). However, the blocks should be stored in a cool, dark place (C) and not exposed to high humidity (N) (C). FFPE blocks for genomic testing may be stored under refrigeration (4°C) (R). 23 |
| Storage of unstained FFPE slides |
| 1.15. For the storage of unstained FFPE slides, preventive measures such as low‐temperature storage or coating with a thin‐layer paraffin should be undertaken to avoid deterioration of nucleic acid quality. However, in principle, long‐term storage of unstained FFPE slides for genomic testing should be avoided (N), and unstained FFPE slides should preferably be freshly prepared from the FFPE block, if possible (C). |
Note for 1.15: The use of a thin‐layer paraffin coating should be carefully considered because it may affect the process of manual microdissection or nucleic acid extraction.
Part 2: Recommendations for the analytical phase
-
(a)
Selection and thin sectioning of FFPE blocks and marking of H&E‐stained samples
Selection of FFPE blocks 2.1. In principle, tissue samples for genomic testing are selected by a pathologist from FFPE blocks with sufficient tumor volume, based on observation of the H&E‐stained slides, and the pathological diagnosis report. 24 The use of blocks containing blood, necrotic tissue, or numerous non‐tumor cells, such as inflammatory cells, should be avoided as much as possible (C, R). 2.2. If there are multiple FFPE samples from the same patient that were prepared at different time points, the most recently prepared samples should be selected first (C, R) (Figures 7, 8, 9, 10, 11). Thin sectioning of FFPE blocks and preparation of unstained samples 2.3. Thin sectioning of FFPE blocks should be performed with extreme caution to avoid cross‐contamination. As a precaution, the microtome blade should be changed for each sample. Additionally, care (such as wearing gloves) should be taken to prevent nucleic acid degradation (C). Reconfirmation with H&E‐stained slides and marking 2.4. For genomic testing, H&E‐stained and unstained slides are freshly prepared from the FFPE block selected by the pathologist. Next, in principle, the pathologist should mark the test area for nucleic acid extraction on the H&E‐stained slides and assess the tissue volume (total number of nucleated cells), the tumor volume (total number of tumor cells), and tumor content (percentage of tumor cells with respect to total nucleated cells) (C). 25 Note for 2.2: The quality of nucleic acids within the FFPE block deteriorates over time (Figures 7, 8, 9, 10, 11). Although the impact of the storage period varies depending on the type of genomic testing used, it is preferable to use FFPE blocks prepared within three years (C, R) (Figure 7 and 26 ).
Note for 2.2: The GI‐SCREEN study results demonstrated that the quality of an FFPE sample (ΔC t value) and the NGS analysis success rate decreased as the storage period increased. Therefore, as much as possible, the use of recently prepared FFPE blocks is recommended (C) (Figure 7).
Note for 2.4: In general, genomic testing requires ~10–500 ng DNA. However, the quantity required varies depending on the gene panel size. Pathologists, who assess the tumor volume and tumor content (C, R), should note that the tumor content should be assessed based on the number of nucleated cells, not on the proportion of the area occupied by tumor cells.
Note for 2.4: The DNA yield obtained from one nucleated cell is ~6 ng. Thus, approximately 2000 cells (~60–100 mm2 tumor cell‐rich areas on an unstained slide) should be used to extract 10 ng DNA. 27
Note for 2.4: The tumor content should be ≥30% (minimum 20%) to detect mutations such as single nucleotide variants and small insertion and deletions, and ≥50% if the analysis includes the detection of copy number alterations. Furthermore, non‐tumor cells should be eliminated as much as possible when analyzing gene expression levels. If the tumor content is not sufficiently high, it is necessary to remove the non‐tumor areas manually (e.g., by microdissection) (C, R). In targeted sequencing, it is recommended that sequence coverage of the targeted regions be at least 250–500, and the detection threshold of the variant allele frequency be 5%–10%. 26 , 27 , 28
Note for 2.4: The tumor content should preferably be recorded in the pathological diagnosis report when observing the H&E‐stained slides. If non‐tumor tissue is removed by manual microdissection, it should be recorded in the genomic testing report along with tumor content (C).
-
(b)
Nucleic acid extraction from FFPE samples
| Nucleic acid extraction |
| 2.5. When extracting nucleic acids for genomic testing, commercially available standardized kits suitable for use in clinical settings are preferred (C). If a kit is recommended for a specific genomic test, it should be used for the extraction (C, R). |
| Measurement of the purity and yield of nucleic acids |
| 2.6. The purity and yield of the extracted nucleic acids should be determined with a spectrophotometer using the A260/A280 ratio, and using the fluorescence method or similar quantitation methods (C, R). |
| Assessment of nucleic acid quality |
| 2.7. If the nucleic acids extracted from the FFPE samples have been stored for a long period, or if deterioration of nucleic acid quality is suspected due to over fixation, it is recommended that the quality of the nucleic acids should be assessed (C, R). |
Figure 7.
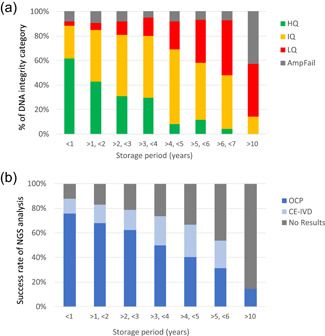
Effects of formalin‐fixed paraffin‐embedded (FFPE) block storage duration on DNA quality (SCRUM‐Japan/GI‐SCREEN project). We examined 2573 FFPE samples of gastrointestinal cancer (biopsy and surgical samples) prepared during routine practice submitted by 19 institutions participating in the GI‐SCREEN project. Refer to Figure 1 for the sample preparation details. (a) The proportion of high‐quality samples decreased over time, while low‐quality samples increased. (b) The success rate of the analyses highly correlated with the quality control (QC) assay results shown in (a)
Figure 8.

Effects of formalin‐fixed paraffin‐embedded (FFPE) block storage duration on DNA quality (TOP‐GEAR project). The effects of the FFPE block storage duration were examined using samples from 131 patients subjected to the NCC Oncopanel in the first half of the first term of the TOP‐GEAR project. The storage durations were compared to the Q‐values of DNA and the yields of the primary PCR products in NGS library preparation. In the comparison of primary PCR product yields, the sample data from NGS libraries prepared using SureSelect XT Reagents (Agilent) were used. The Q‐values of DNA extracted from FFPE samples and the yields of the primary PCR products correlated to some extent with the FFPE block storage duration. The low quality of DNA may have been partially due to the long‐term storage of the FFPE blocks
Figure 9.
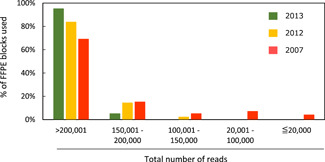
Effects of formalin‐fixed paraffin‐embedded (FFPE) block storage duration on RNA quality. The effects of storage duration on quality of RNA extracted from FFPE blocks were examined using FFPE tissue samples from 169 patients with non‐small cell lung cancer. One hundred FFPE block samples were prepared in 2007, and 49 and 20 were prepared in 2012 and 2013, respectively. Using the semiconductor‐based Ion PGM System, amplicon sequencing analyses were performed in 2014 using the Ion AmpliSeq™ RNA Fusion Lung Cancer Research Panel (Thermo Fisher Scientific). In this fusion gene panel, the median total number of reads was 288 838 (range: 157 085−431 332) for the blocks prepared in 2013; 257 516 (range: 149 998−435 890) for blocks prepared in 2012; and 282 887 (range: 4987−562 580) for blocks prepared in 2007. Among the 169 samples, four samples were judged difficult to assess because the total number of reads from blocks prepared in 2007 was ≤20 000. The blocks prepared in 2007 showed fewer reads than those prepared in 2012 or 2013, indicating the effects of sample deterioration over time
Figure 10.
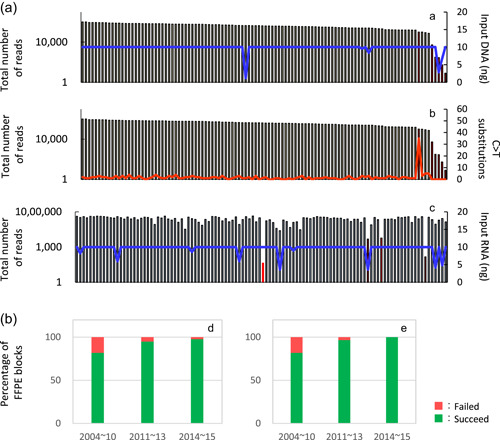
Effects of formalin‐fixed paraffin‐embedded (FFPE) block storage duration on DNA and RNA quality. DNA and RNA were extracted from FFPE tissue samples from 110 patients with non‐small cell lung cancer and quantitated using PicoGreen dsDNA and PicoGreen RNA quantitation reagents (Thermo Fisher Scientific). Up to 10 ng DNA or RNA was used for gene mutation and fusion gene analyses. Using the Ion PGM System, amplicon sequences were analyzed on DNA samples obtained in 2014−2015 using the Ion AmpliSeq™ Colon and Lung Cancer Panel and RNA with the Ion AmpliSeq™ RNA Fusion Lung Cancer Research Panel (Thermo Fisher Scientific). (a) In the DNA gene‐mutation panel analysis, the median total number of reads was 412 715. Among the 110 samples, five samples were judged difficult to analyze because their total number of reads was ≤50 000, and one sample was judged difficult to analyze as it showed 35C > T substitutions, which is considered high. However, the total number of reads was sufficient [A, B]. In the RNA fusion gene panel analysis, the median total number of reads was 256 836. Among the 110 samples, four samples were judged difficult to analyze because their total reads were 20 000 or fewer [C]. (b) The success rate of the DNA mutation analysis was 81.8% (n = 11) for FFPE samples prepared ≥4 years before the analysis (2004–2010), 94.8% (n = 58) for those prepared ≤3 years (2011–2013), and 97.6% (n = 41) for those prepared the same year as the analysis (2014–2015) [D]. The success rate of the RNA fusion gene analysis was 81.8% (n = 11) for FFPE samples prepared ≥4 years before the analysis (2004–2010), 96.6% (n = 58) for those prepared ≤3 years (2011–2013), and 100% (n = 41) for those prepared the same year as the analysis (2014–2015) [E]
Figure 11.
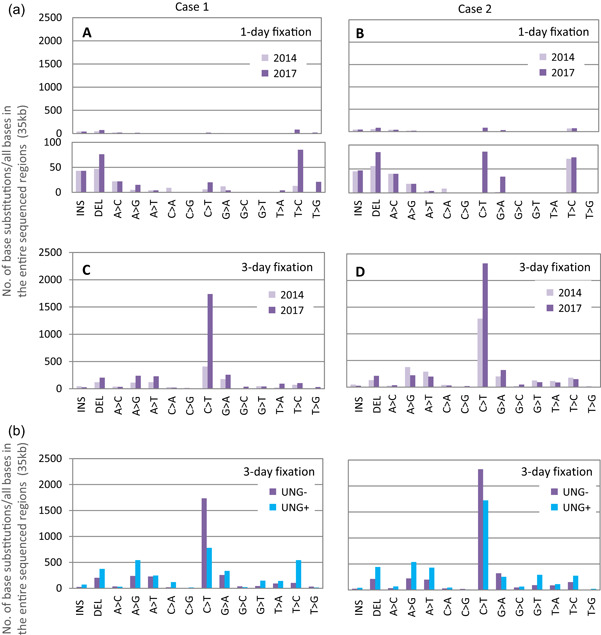
Chemically induced base substitution due to prolonged duration of formalin‐fixed paraffin‐embedded (FFPE) block storage and the effect of uracil DNA N‐glycosylase (UNG)‐treatment on base repair. Amplicon sequencing using the TruSeq Amplicon Cancer Panel (Illumina) was performed on surgical specimens obtained from two colorectal cancer patients, fixed for 1 and 3 days, respectively. The analysis was performed twice in 2014 (immediately after FFPE block preparation) and again in 2017 (3 years post‐preparation). A comparative analysis was performed in 2017 to examine the effects of UNG treatment on samples fixed for up to 3 days using two nucleic acid extraction kits, the QIAamp DNA FFPE Tissue Kit (without treatment), and the GeneRead DNA FFPE Tissue Kit (with treatment) (Qiagen). (a) In both samples (1 and 3 days fixation), the base substitution increased due to long‐term storage [A–D]. In particular, the C > T substitution increased significantly (lower insets in A and B are magnifications of upper diagrams). The number of base changes resulting from long‐term storage was proportional to the number at the beginning of storage. (b) A lower number of C > T base substitutions were observed in the UNG‐treated samples (UNG+) compared to the untreated (UNG‐) samples, while the number of some types of base substitutions, such as T > C substitutions, increased. The total number of reads and the mean read depth were ≥eightfold higher in the UNG+ samples. As previously reported, DNA quality improved with UNG treatment; however, the effect was not uniform. Thus, the effects in preliminary experiments should be checked to decide whether UNG treatment is required
Note for 2.5: Commercial kits for nucleic acid extraction from FFPE samples should be carefully selected, as the purity and yield differ among kits. 29
Note for 2.5: Additional treatment with uracil DNA N‐glycosylase (UNG) during nucleic acid extraction enables the removal of chemical modifications generated by formalin (mainly by deamination of cytosine bases). UNG can suppress the production of reads containing artifacts by restoring part of the base substitution in the original base sequences caused by formalin fixation (Figure 11 and 22 ).
Note for 2.6: The A260/A280 ratios for the purity of DNA and RNA extracted from FFPE samples typically range between 1.7–1.9 and 1.9–2.1, respectively. Caution should be exercised if the ratio is low, as this suggests contamination with proteins. However, if DNA is contaminated with RNA, the A260/A280 ratio will be slightly higher. 30 Additionally, checking the A260/A230 ratio or the scan results between A220 and A320 to screen for other contaminants is desirable.
Note for 2.7: The known quality control (QC) indicators for nucleic acid integrity assessment are listed in Table 4.
Table 4.
| QC measure | Target | Explanation |
|---|---|---|
| C t value (ΔC t , ΔΔC t ) | DNA/RNA | It is a simple method requiring no special instrument to assess the quality of nucleic acids using C t (also called Cq) values obtained by real‐time PCR (DNA) or real‐time RT‐PCR (RNA). In the quality assessment method for DNA, the difference between C t values (ΔC t value) obtained from two amplicons of different lengths (e.g., a short‐chain amplicon of 50–100 bp and a long‐chain amplicon of 100–300 bp) is usually used. In the SCRUM‐Japan/GI‐SCREEN study, 30 ΔC t value calculation was performed for over 2000 FFPE samples, demonstrating its usefulness |
| DIN | DNA | DIN is a value on a 1–10 scale that is assigned based on the degradation of gDNA as measured by the Genomic DNA ScreenTape assay using the Agilent 2200/4200 TapeStation system to assess the quality of DNA from FFPE samples |
| Q‐value | DNA | The Q‐value is a measure of the quality of DNA developed by the National Cancer Center, 31 which is calculated by dividing the value measured using the real‐time PCR method (PCR‐active DNA quantity) by the value measured using the fluorescence method (dsDNA quantity). The success rate of sequencing (when an NCC Oncopanel v2 is used) is ~85% when the Q‐value is 0.2 or higher |
| DV200 | RNA | DV200 is a measure of RNA quality that was developed by Illumina, and it calculates the proportion of RNA fragments equal to and longer than 200 nucleotides using Fragment Analyzer using AATI or an Agilent 2100 Bioanalyzer. The quality classification by DV200 is assigned as follows: >70% as high, 50%–70% as medium, 30%–50% as low, and <30% as too degraded. 32 FFPE samples that are too degraded at <30% are not recommended for use in library preparation for RNA sequencing |
Abbreviations: Cq, quantification cycle; C t , threshold cycle; DIN, DNA integrity number; FFPE, formalin‐fixed paraffin‐embedded; QC, quality control.
PERSPECTIVES
Cancer genomic testing under the national health insurance system was started in 2019, and so far, FFPE samples have been handled following the Japanese version of the practical guidelines released in 2018 by the JSP (https://pathology.or.jp/genome_med/). The NCC Oncopanel, one of the IVD‐approved NGS‐based testing systems, has been performed in more than 2000 patients in Japan as of April 2020, with a success rate of ≥90% (unpublished data), similar to that observed in the MSK‐IMPACT study. 33 However, some samples did not work; therefore, further improvements in the sample preparation methods are needed. Genomic testing in Japan is mainly based on DNA, whereas the larger‐scale gene panel test system for over 400 genes, currently under development, uses both DNA and RNA extracted from FFPE samples. The use of FFPE samples in NGS‐based whole‐exome and whole‐transcriptome analyses has increased in recent years, as evident from the exploratory studies performed during or after the completion of intervention‐based clinical trials conducted at the same level as clinical practice. Therefore, samples should be handled in a manner that enables the extraction of higher‐quality RNA as well as DNA. In addition to NGS‐based testing, the development of non‐NGS‐based profile testing is in progress; therefore, it is necessary to apply these procedures in various genomic testing systems. As genomic technologies are changing rapidly, revising these guidelines to match the actual situation in Japan will be considered.
CONFLICT OF INTERESTS
Yutaka Hatanaka received lecture fees from AstraZeneca K.K. and Novartis Pharma K.K., and research funds from Taiho Pham Co., Ltd, Shionogi Co., Ltd, Sysmex Corp., Thermo Fisher Scientific K.K., DNA Chip Research Inc., and Denka Co. Ltd. Takeshi Kuwata received research funds from Daiichi Sankyo Co. Ltd and Ono Pharm Co. Ltd. Hitoshi Ichikawa received research funds from Chugai Pharm Co., Ltd, Eisai Co., Ltd, Healios K.K. and Ono Pharm Co., Ltd. Kazuto Nishio received lecture fees from Chugai Pharm Co., Ltd, and research funds from Nippon Boehringer Ingelheim Co., Ltd and Nichirei Biosciences Inc. Satoshi Fujii received lecture fees from MSD K.K., and research funds from Roche Diagnostics K.K. and Daiichi Sankyo Co. Ltd. Takayuki Yoshino received lecture fees from Chugai Pharm Co. Ltd, Merck Biopharma Co. Ltd, Bayer Yakuhin Ltd, and Ono Pharm Co., Ltd, and research funds from Sanofi K.K., Taiho Pham Co., Ltd, MSD K.K., and Amgen K.K.
AUTHOR CONTRIBUTIONS
All The Japanese Society of Pathology (JSP) working group members (Yutaka Hatanaka, Takeshi Kuwata, Eiichi Morii, Yae Kanai, Atsushi Ochiai, and Yoshinao Oda) contributed to the conception and design of the study. Hitoshi Ichikawa, Takashi Kubo, Kanako C. Hatanaka, Yutaka Hatanaka, Kazuko Sakai, Kazuto Nishio, Takeshi Kuwata, Satoshi Fujii, Wataru Okamoto, and Takayuki Yoshino acquired and interpreted the empirical data and drafted the figures. Yutaka Hatanaka, Takeshi Kuwata, and Yoshinao Oda wrote the first draft of the manuscript. All authors commented on previous versions of the manuscript and approved the final manuscript.
ACKNOWLEDGMENTS
We thank the pathologists, clinicians, medical technologists, and research technicians at the collaborative institutions for help with obtaining empirical data on the handling of samples. We also thank Drs Katsuya Tsuchihara (National Cancer Center) and Takashi Kohno (National Cancer Center) for critical advice and constructive suggestions. This work was supported by the Japanese Society of Pathology (JSP), and the guideline was developed in collaboration with two major research projects; the SCRUM‐Japan GI‐SCREEN and TOP‐GEAR. Several study groups were supported by a Health and Labor Sciences Research Grant (Grant No. H26‐Policy for Cancer General‐005 [TK]), The National Cancer Center Research and Development Fund (Grant No. 28‐A‐5 [Takayuki Yoshino]), and projects commissioned by the AMED (Grant Nos 17ck0106233h0002 [Takayuki Yoshino] and 16ck0106232h0001 [Kazuto Nishio]).
Hatanaka Y, Kuwata T, Morii E, Kanai Y, Ichikawa H, Kubo T, et al. The Japanese Society of Pathology Practical Guidelines on the handling of pathological tissue samples for cancer genomic medicine. Pathology International. 2021;71:725–740. 10.1111/pin.13170
The original version of “The Japanese Society of Pathology (JSP) Practical Guidelines on the Handling of Pathological Tissue Samples for Cancer Genomic Medicine” appeared in Japanese as Genome Shinryoyo Byori Soshiki Kentai Toriatsukai Kitei from the JSP, Tokyo, in 2018 (https://pathology.or.jp/genome_med/)
REFERENCES
- 1. Mano H. Cancer genomic medicine in Japan. Proc Jpn Acad Ser B Phys Biol Sci. 2020;96:316–21. [DOI] [PMC free article] [PubMed] [Google Scholar]
- 2. Ebi H, Bando H. Precision oncology and the universal health coverage system in Japan. JCO Precis Oncol. 2019;3:PO.19.00291. [DOI] [PMC free article] [PubMed] [Google Scholar]
- 3. Bass BP, Engel KB, Greytak SR, Moore HM. A review of preanalytical factors affecting molecular, protein, and morphological analysis of formalin‐fixed, paraffin‐embedded (FFPE) tissue: how well do you know your FFPE specimen? Arch Pathol Lab Med. 2014;138:1520–30. [DOI] [PubMed] [Google Scholar]
- 4. Kuwata T, Wakabayashi M, Hatanaka Y, Morii E, Oda Y, Taguchi K, et al. on behalf of SCRUM‐Japan GI‐SCREEN Pathology Group, Impact of DNA integrity on the success rate of tissue‐based next‐generation sequencing: Lessons from nationwide cancer genome screening project SCRUM‐Japan GI‐SCREEN. Pathol Int. 2020;70:932–42. [DOI] [PMC free article] [PubMed]
- 5. Sunami K, Ichikawa H, Kubo T, Kato M, Fujiwara Y, Shimomura A, et al. Feasibility and utility of a panel testing for 114 cancer‐associated genes in a clinical setting: a hospital‐based study. Cancer Sci. 2019;110:1480–90. [DOI] [PMC free article] [PubMed] [Google Scholar]
- 6. Kanai Y, Nishihara H, Miyagi Y, Tsuruyama T, Taguchi K, Katoh H, et al. The Japanese Society of Pathology Guidelines on the handling of pathological tissue samples for genomic research: standard operating procedures based on empirical analyses. Pathol Int. 2018;68:63–90. [DOI] [PubMed] [Google Scholar]
- 7. Hammond MEH, Hayes DF, Wolff AC, Mangu PB, Temin S. American Society of Clinical Oncology/College of American Pathologists guideline recommendations for immunohistochemical testing of estrogen and progesterone receptors in breast cancer. J Oncol Pract. 2010;6:195–7. [DOI] [PMC free article] [PubMed] [Google Scholar]
- 8. Khoury T, Sait S, Hwang H, Chandrasekhar R, Wilding G, Tan D, et al. Delay to formalin fixation effect on breast biomarkers. Mod Pathol. 2009;22:1457–7. [DOI] [PubMed] [Google Scholar]
- 9. Srinivasan M, Sedmak D, Jewell S. Effect of fixatives and tissue processing on the content and integrity of nucleic acids. Am J Pathol. 2002;161:1961–71. [DOI] [PMC free article] [PubMed] [Google Scholar]
- 10.The Japan Agency for Medical Research and Development (AMED), Report on the “Handling of biological samples for OMICS research” supported by the AMED Grant. 2017. Available from: https://www.amed.go.jp/content/000055269
- 11.The Ministry of Health, Labour and Welfare (MHLW), Report on the “Pathological diagnosis completed locally and the construction of a network connecting clinical and pathological departments to provide advanced medical care for cancer” supported by A Health and Labor Sciences Research Grant. 2016. Available from: https://www.jcancer.jp/wp-content/uploads/2016/12/07kuwata.pdf
- 12.The Japanese Society of Pathology (editors), Guidelines for pathological diagnosis of HER2 in gastric and breast cancers. 1st ed. Kanehara & Co., Ltd; 2015.
- 13. Wolff AC, Hammond MEH, Hicks DG, Dowsett M, McShane LM, Allison KH, et al. Recommendations for human epidermal growth factor receptor 2 testing in breast cancer: American Society of Clinical Oncology/College of American Pathologists clinical practice guideline update. J Clin Oncol. 2013;31:3997–4013. [DOI] [PubMed] [Google Scholar]
- 14.The Japan Lung Cancer Society (Committee for Biomarker) (editors), Guidance for EGFR gene mutation testing in lung cancer patients (ver 4). 2020. Available from: https://www.haigan.gr.jp/modules/guideline/index.php?content_id=7
- 15.The Japan Lung Cancer Society (Committee for Biomarker) (editors), Guidance for ALK fusion gene testing in lung cancer patients (ver 3). 2019. Available from: https://www.haigan.gr.jp/modules/guideline/index.php?content_id=7
- 16. Lindeman NI, Cagle PT, Beasley MB, Chitale DA, Dacic S, Giaccone G, et al. Molecular testing guideline for selection of lung cancer patients for EGFR and ALK tyrosine kinase inhibitors: guideline from the College of American Pathologists, International Association for the Study of Lung Cancer, and Association for Molecular Pathology. J Thorac Oncol. 2013;8:823–59. [DOI] [PMC free article] [PubMed] [Google Scholar]
- 17.The Japan Lung Cancer Society (Committee for Biomarker) (editors), Guidance for ROS1 fusion gene testing in lung cancer patients (ver 1). 2017. Available from: https://www.haigan.gr.jp/modules/guideline/index.php?content_id=7
- 18.The Japan Lung Cancer Society (Committee for Biomarker) (editors), Guidance for PD‐L1 testing in lung cancer patients (ver 1). 2017. Available from: https://www.haigan.gr.jp/modules/guideline/index.php?content_id=7
- 19. Ebi H, Bando H, Taniguchi H, Sunakawa Y, Okugawa Y, Hatanaka Y, et al. Japanese Society of Medical Oncology Clinical Guidelines: molecular testing for colorectal cancer treatment, 4th edition. Cancer Sci. 2020;111:3962–9. 10.1111/cas.14567 [DOI] [PMC free article] [PubMed] [Google Scholar]
- 20. Sato M, Kojima M, Nagatsuma AK, Nakamura Y, Saito N, Ochiai A. Optimal fixation for total preanalytic phase evaluation in pathology laboratories: a comprehensive study including immunohistochemistry, DNA, and mRNA assays. Pathol Int. 2014;64:209–16. [DOI] [PubMed] [Google Scholar]
- 21. Williams C, Pontén F, Moberg C, Söderkvist P, Uhlén M, Pontén J, et al. A high frequency of sequence alterations is due to formalin fixation of archival specimens. Am J Pathol. 1999;155:1467–71. [DOI] [PMC free article] [PubMed] [Google Scholar]
- 22. Do H, Dobrovic A. Sequence artifacts in DNA from formalin‐fixed tissues: causes and strategies for minimization. Clin Chem. 2015;61:64–71. [DOI] [PubMed] [Google Scholar]
- 23. von Ahlfen S, Missel A, Bendrat K, Schlumpberger M. Determinants of RNA quality from FFPE samples. PLoS One. 2007;2:e1261. [DOI] [PMC free article] [PubMed] [Google Scholar]
- 24. Fujii S, Yoshino T, Yamazaki K, Muro K, Yamaguchi K, Nishina T, et al. Histopathological factors affecting the extraction of high quality genomic DNA from tissue sections for next‐generation sequencing. Biomed Rep. 2019;11:171–80. [DOI] [PMC free article] [PubMed] [Google Scholar]
- 25. Cree IA, Deans Z, Ligtenberg MJ, Normanno N, Edsjö A, Rouleau E, et al. Guidance for laboratories performing molecular pathology for cancer patients. J Clin Pathol. 2014;67:923–31. [DOI] [PMC free article] [PubMed] [Google Scholar]
- 26. Jennings LJ, Arcila ME, Corless C, Kamel‐Reid S, Lubin IM, Pfeifer J, et al. Guidelines for validation of next‐generation sequencing‐based oncology panels: a joint consensus recommendation of the Association for Molecular Pathology and College of American Pathologists. J Mol Diagn. 2017;19:341–65. [DOI] [PMC free article] [PubMed] [Google Scholar]
- 27. Chen H, Luthra R, Goswami RS, Singh RR, Chowdhuri SR. Analysis of pre‐analytic factors affecting the success of clinical next‐generation sequencing of solid organ malignancies. Cancers. 2015;7:1699–715. [DOI] [PMC free article] [PubMed] [Google Scholar]
- 28.New York State Department of Health. Next Generation Sequencing (NGS) guidelines for somatic genetic variant detection. 2018. Available from: https://www.wadsworth.org/sites/default/files/WebDoc/3NextGenSeqONCOGuidelines%2012318.pdf
- 29. Janecka A, Adamczyk A, Gasińska A. Comparison of eight commercially available kits for DNA extraction from formalin‐fixed paraffin‐embedded tissues. Anal Biochem. 2015;476:8–10. [DOI] [PubMed] [Google Scholar]
- 30. Simbolo M, Gottardi M, Corbo V, Fassan M, Mafficini A, Malpeli G, et al. DNA qualification workflow for next generation sequencing of histopathological samples. PLoS One. 2013;8:e62692. [DOI] [PMC free article] [PubMed] [Google Scholar]
- 31. Tanabe Y, Ichikawa H, Kohno T, Yoshida H, Kubo T, Kato M, et al. Comprehensive screening of target molecules by next‐generation sequencing in patients with malignant solid tumors: guiding entry into phase I clinical trials. Mol Cancer. 2016;15:73. [DOI] [PMC free article] [PubMed] [Google Scholar]
- 32. Fujii T, Uchiyama T, Matsuoka M, Myojin T, Sugimoto S, Nitta Y, et al. Evaluation of DNA and RNA quality from archival formalin‐fixed paraffin‐embedded tissue for next‐generation sequencing ‐ retrospective study in Japanese single institution. Pathol Int. 2020 Sep;70(9):602–11. [DOI] [PubMed] [Google Scholar]
- 33. Zehir A, Benayed R, Shah RH, Syed A, Middha S, Kim HR, et al. Mutational landscape of metastatic cancer revealed from prospective clinical sequencing of 10,000 patients. Nat Med. 2017;23:703–13. [DOI] [PMC free article] [PubMed] [Google Scholar]


