

Abstract
Background:
Immunotherapy is a rapidly evolving treatment option in breast cancer (BC); However, the BC immune microenvironment is understudied in Black and younger (<50 years) patients.
Methods:
We used histological and RNA-based immunoprofiling methods to characterize the BC immune landscape in 1,952 tumors from the Carolina Breast Cancer Study, a population-based study that oversampled Black (n=1,030) and young women (n=1,039). We evaluated immune response leveraging markers for 10 immune cell populations, compared profiles to those in the Cancer Genome Atlas Project [n=1095 tumors, Black (n=183), and young women (n=295)], and evaluated in association with clinical and demographic variables, including recurrence.
Results:
Consensus clustering identified three immune clusters in CBCS [adaptive-enriched, innate-enriched, or immune-quiet] that varied in frequency by race, age, tumor grade and subtype; however, only two clusters were identified in TCGA, which were predominantly comprised of adaptive-enriched and innate-enriched tumors. In CBCS, the strongest adaptive immune response was observed for basal-like, HER2+, TNBC, and high-grade tumors. Younger patients had higher proportions of adaptive-enriched tumors, particularly among estrogen receptor (ER)-negative cases. Black patients had higher frequencies of both adaptive-enriched and innate-enriched tumors. Immune clusters were associated with recurrence among ER-negative tumors, with adaptive-enriched showing the best and innate-enriched showing the poorest 5-year recurrence-free survival.
Conclusion:
These data suggest that immune microenvironments are intricately related to race, age, tumor subtype, and grade.
Impact:
Given higher mortality among Black and young women, more defined immune classification using cell-type specific panels could help explain higher recurrence and ultimately lead to targetable interventions.
INTRODUCTION
The tumor microenvironment plays a major role in the clinical course of breast cancer (BC). Clinical trials have shown that high levels of tumor-infiltrating lymphocytes (TILs), consisting primarily of cytotoxic (CD8+) T cells, CD19+ B cells and a small population of natural killer (NK) cells1, 2 positively predict therapeutic response in triple-negative (TNBC) and HER2-positive BC3–5. Gene expression surrogates of TILs and immune biomarkers have corroborated these findings6, 7. However, few studies have evaluated immune response in diverse patient populations8, 9. Black women and young patients may have unique immune responses10–13, but are often under-represented in clinical studies. Furthermore, both groups experience higher mortality rates than older and non-Hispanic White women14–16 and are more likely to be diagnosed with basal-like and TNBC subtypes9, 16–18, which tend to be more immune infiltrated19.
Several studies have shown increased immune infiltrates in tumors from Black BC patients20–25, but studies have conflicted. Resolution of this literature has been challenging due to focus on small numbers of immune cell-specific markers, and smaller sample sizes of Black and young women, which has limited ability to simultaneously consider the role of tumor subtype, grade and age. Prior studies have also emphasized tumor banks and clinical trials, which tend not to include earlier stage, smaller tumors that are an important part of the clinical population of breast cancers. In light of intensive ongoing research on immune-targeting therapies, studies clearly defining the tumor immune landscape among clinically and racially diverse patient populations and with a broad panel of immune markers are needed to develop a clearer picture of the immune landscapes of breast cancers.
Here, we used gene expression profiling and histologic approaches to characterize the BC immune microenvironment, leveraging data from the Carolina Breast Cancer Study (N=1,952 cases), a population-based study that oversampled Black (n=1,030) and younger (n=1,039) women. We selected 48 RNA-based markers indicative of 10 major cell-types (B-cell, T-cell, CD8-T cell, T-helper cell, Treg, Tfh, eosinophil, neutrophil, natural killer (NK) cell, and macrophage) to evaluate overall global patterns of immune response and to assess the role of immune gene expression in recurrence within a diverse, population-based sample.
METHODS
Study Population
The Carolina Breast Cancer Study (CBCS)26 is a three-phase population-based study that utilized rapid case ascertainment with the North Carolina Central Cancer Registry to identify women aged 20–74 years across 44 counties diagnosed with first primary BC from 1993–1996 (Phase 1), 1996–2001 (Phase 2), and 2008–2013 (Phase 3). Black and younger women (<50 years) were oversampled using randomized recruitment26. Of 4,806 BC cases enrolled, 1,952 bulk tumor samples were profiled by Nanostring (Phase 1: N=252; Phase 2: N=454; Phase 3: N=1246) after exclusions for depleted tissue (n=1,188) or low-quality RNA (n=241). Samples with depleted tissue and degraded RNA were predominantly from the older, Phase 1 study where fewer sections were collected and stored in suboptimal conditions for RNA isolation. This study was approved by the University of North Carolina at Chapel Hill (UNC-CH) School of Medicine Institutional Review Board in accordance with the revised U.S. Common rule, and participants provided written informed consent.
Demographic and Clinical Characteristics
Health history, demographic variables and measurements for body mass index (BMI) were collected by a nurse during in-home interviews. Race was self-reported and categorized as White/non-Black or African American/Black; <5% of non-Black participants self-identified as multiracial, Hispanic, or other race/ethnicity and were grouped with non-Black for statistical analyses. While genetic ancestry and self-reported race are strongly concordant in CBCS27, we interpret race herein as a social construct, representing the culmination of biological, social and environmental exposures. Tumor size, AJCC stage, estrogen receptor (ER), progesterone receptor (PR), HER2 receptor, node status, and tumor grade were obtained from medical records, pathology reports and immunohistochemical (IHC) staining performed at UNC-CH. Tumor grade was assigned by a pathologist in Phases 1 and 3. For grade adjustment analyses, missing grade (474/1952) was imputed with the Multivariate Imputation by Chained Equations package28, incorporating ER/PR/HER2 status, node status, race, age, tumor stage, size, p53 mutation status, survival, grade and study phase as predictor variables, using the method described by Ali et al29. In a sensitivity analysis including clinically assigned grade and a missing value indicator, RFDs and 95% confidence intervals remained stable relative to imputed grade (Supplemental Table 1). Patient characteristics are described in Table 1. Sample percentages are displayed both unweighted and weighted to original NC demographics to account for the sampling design of CBCS, which oversampled Black and younger women using randomized recruitment. Sampling weights were set based on incidence to ensure equal proportions of younger Black, older Black, younger non-Black and older non-Black participants30.
Table 1.
Characteristics of Study Population
| TCGA BRCA | CBCS | CBCS Weighted %* | |
|---|---|---|---|
|
|
|
|
|
| n (%) | n (%) | (%)* | |
| Total | 1095 | 1952 | |
| Age | |||
| <50 years | 295 (26.9) | 1039 (53.2) | (34.0) |
| ≥50 years | 798 (72.9) | 913 (46.8) | (66.0) |
| Missing | 2 (0.2) | ||
| Race | |||
| Black | 183 (16.7) | 1030 (52.8) | (26.1) |
| non-Black | 816 (74.5) | 922 (47.2) | (73.9) |
| Missing | 96 (8.8) | ||
| Grade | |||
| Grade I | NA | 248 (12.7) | (16.9) |
| Grade II | NA | 511 (26.2) | (30.9) |
| Grade III | NA | 719 (36.8) | (31.1) |
| Missing | 474 (24.3) | (21.2) | |
| Stage | |||
| Stage I | 182 (16.6) | 655 (33.6) | (39.6) |
| Stage II | 619 (56.5) | 952 (48.8) | (44.7) |
| Stage III | 249 (22.7) | 255 (13.1) | (12.1) |
| Stage IV | 20 (1.8) | 67 (3.4) | (2.6) |
| Missing | 25 (2.3) | 23 (1.2) | (0.9) |
| Node Status | |||
| Negative | 516 (47.1) | 1109 (56.8) | (59.0) |
| Positive | 558 (51) | 843 (43.2) | (41.0) |
| Missing | 21 (1.9) | ||
| ER Status | |||
| Positive | 807 (73.7) | 1228 (62.9) | (71.0) |
| Negative | 239 (21.8) | 714 (36.6) | (28.6) |
| Missing | 49 (4.5) | 10 (0.5) | (0.4) |
| PAM50 | |||
| Basal | 190 (17.4) | 536 (27.5) | (20.8) |
| HER2-enriched | 82 (7.5) | 179 (9.2) | (8.2) |
| Luminal A | 566 (51.7) | 850 (43.5) | (51.4) |
| Luminal B | 217 (19.8) | 307 (15.7) | (14.8) |
| Normal-like | 40 (3.7) | 66 (3.4) | (4.0) |
| Missing | - | 14 (0.7) | (0.9) |
Percentages weighted for study design to approximate distribution of age and race in NC population.
TCGA= the Cancer Genome Atlas, BRCA= breast cancer, CBCS = Carolina Breast Cancer Study, ER = estrogen receptor.
Recurrence data were available for CBCS Phase 3 (2008–2013; n = 1246). Recurrence-free survival (RFS) was defined as the time between date of diagnosis to first local, regional or distant recurrent BC and verified through medical record review. Recurrence data are complete through October 2019 with 5-year follow-up for all women. Among 1246 eligible women, 47 participants were stage IV at diagnosis and excluded from recurrence analysis. Among 1199 patients (Stage I-III), 143 recurrences were identified.
Gene Expression Data
Normalization, Molecular Subtyping and Immune-Related Genes
RNA was isolated from bulk tumor tissue using the Qiagen FFPE RNeasy isolation kit (Germantown, MD) and assayed using Nanostring nCounter technology (Seattle, Washington) as previously described18. Multiple codesets, including the PAM50 molecular subtype predictor31 and an immune expression panel were used; therefore, we utilized Remove Unwanted Variation (RUV) to harmonize across batches as previously described32 (Supplemental Table 2). PAM50 molecular subtyping was performed using a research version of the predictor to classify tumors as Luminal A, Luminal B, HER2-Enriched, Basal-like or Normal-like, and to generate risk of recurrence scores (ROR-PT) incorporating tumor size, proliferation and subtype18, 31. We also curated a 48-gene panel of immune markers based on previous work33, 34, representing 10 major cell types from both adaptive and innate arms of the immune system (B-cell, T-cell, CD8-T cell, T-helper cell, Treg, T follicular helper (Tfh), eosinophil, neutrophil, NK and macrophages), cytotoxic cells and PDL1 (CD274)(Supplemental Table 3).
Immune Cell Scores and Identification of RNA-Based Global Immune Clusters
Three tiers of immune variables were considered in this study: (1) global immune clusters based on clustering across all immune genes; (2) adaptive-cell vs. innate-cell scores calculated across multiple cell types based on median expression, and (3) individual cell-type scores calculated based on median expression across cell-type specific genes.
For each participant, 10 cell-type specific scores were calculated for all n genes related to a given cell type (e.g. B-cell genes, n=7), in addition to scores for cytotoxic cells, adaptive-cells, innate-cells and PD-L1, as listed in Supplemental Table 333, 34. The median and average log2 expression (computed for each participant across the n genes) were similar and the median was ultimately selected to minimize skew due to extreme values. Adaptive-cell scores were calculated by computing the median log2 expression among all genes related to B-cell, T-cell, CD8-T cell, T-helper cell, Treg and Tfh cells, and an innate-cell score was calculated by computing the median log2 expression among all genes related to eosinophil, neutrophil, NK and macrophages. Cytotoxic-cell genes and PD-L1 (CD274) were not included in adaptive-cell and innate-cell scores due to expression of these markers on cells from both arms of the immune system35. In a validation experiment, we used immunofluorescence and protein-based digital spatial profiling (DSP)36 to assess concordance between RNA-based and protein-based measurements (Supplemental Figure 1). Immunofluorescence-based CD19 was positively correlated with RNA-based CD19 quantification and RNA-based B-cell scores (Supplemental Figure 1A,B). Similarly, RNA-based ICOS and CD8A expression was positively correlated with DSP-based expression (Supplemental Figure 1C,D).
For each tumor, we also assigned a single global immune class. Global immune classes (clusters) were based on clustering analysis in CBCS and TCGA, and used to group tumors based on similarity in their immune-related gene expression patterns across all 48 immune genes in our panel. Due to differences in RNA expression platforms (i.e., NanoString vs RNAseq), the scope of immune genes present, and sample population, we began with independent immune class discovery in CBCS and TCGA to validate use of our immune panel. To ensure stability of these global immune clusters in each dataset, the ConsensusClusterPlus Bioconductor package37 was used to run 1000 clustering iterations with 90% subsampling, the Pearson distance metric and average linkage method. Gene expression was median-centered and visualized using the ComplexHeatmap R package38. To explore relationships with tumor and patient characteristics, we also developed a classifier of CBCS immune clusters using Classification to the Nearest Centroid (ClaNC)39 and applied to TCGA.
Quantification of tumor infiltrating lymphocytes
The Genie algorithm from Aperio’s digital pathology software (Leica Biosystems) was trained to digitally quantify TILs from hematoxylin and eosin stained tissue microarrays, excluding cores with degraded tissue, >50% red blood cells or cysts (n=996 with RNA immunoprofiling). The tissue classifier was trained using a representative feature library of manually annotated epithelium, stroma, adipose and immune (TILs) tissue compartments, and optimized through iterative rounds of adjustment parameter modification and visual assessment. Each quantified compartment area was then divided by the total tissue area per case and multiplied by 100. Reproducibility of digital lymphocyte quantification was evaluated by a study pathologist, where high agreement was found between digital and pathological review40. Percent of TILs in tissue was considered as a continuous variable and log2-transformed for analysis.
Statistical Analysis
Comparison of expression levels and TILs across global immune clusters was performed using ANOVA with Tukey multiple comparisons test and Welch’s two sample t-tests. Generalized linear models (glm) were used to calculate relative frequency differences (RFD) as the measure of association between immune clusters and covariates of interest. RFDs are estimated based on a general linear model, and are interpretable as the percentage difference between index and referent groups. Multivariable models were adjusted for age and race in reduced models, and additionally adjusted for tumor grade in full models. Note that in reduced models comparing age or race, age comparisons were only adjusted for race, and race comparisons were only adjusted for age. Kaplan-Meier curves and log-rank tests were used to compare mean time to recurrence across global immune clusters in stage I-III cases (n=1199). Hazard ratios (HR) and 95% CI were calculated using Cox proportional hazard models, and adjusted for patient age, race, and tumor stage. The assumption of proportionality was assessed via the Wald p-value. There was evidence of non-proportional hazards, however point estimates from models that included covariate-time interaction terms did not differ substantially from the model without the time interaction term. All statistical analyses were performed in R version 4.0.3.
Data Availability
TCGA BC dataset, including 1095 primary tumors, is publicly available under dbGaP accession phs000178.v1.p1. TCGA BC dataset was used to validate the use of our immune panel in BC samples, and leveraged for the availability of multiple data platforms for each case, including RNA sequencing, leukocyte-specific DNA methylation markers41 and histological TIL quantification by study pathologists. These data and description of related methods are available at https://gdc.cancer.gov/about-data/publications/PanCan-CellOfOrigin41, with patient characteristics described in Table 1. CBCS data are available upon request (https://unclineberger.org/cbcs).
RESULTS
Global Immune Classes of the BC immune microenvironment
We evaluated immune gene expression in two datasets [CBCS (n=1952) and TCGA BC (n=1095)], that differed according to clinical and demographic variables. The population-based CBCS sample was comprised of 53.2% young women (<50 years) and 52.8% Black participants, while 38.9% of tumors were classified as low-grade, 33.6% low-stage, 56.8% node-negative 62.9% ER-positive and 27.5% Basal-like (Table 1). Compared to TCGA, CBCS had higher proportions of young (<50 years) and Black participants, and higher proportions of low-stage, node-negative, ER-negative, and Basal-like tumors (Table 1). After accounting for randomized recruitment, the distribution of molecular tumor subtypes was similar between both studies, but younger age, low stage, node-negative and ER-negative remained more prevalent in CBCS.
We identified three stable global immune clusters in CBCS using consensus clustering with our 48-gene panel: (1) adaptive-enriched, (2) innate-enriched and (3) immune-quiet (Figure 1A). Tumors in the adaptive-enriched cluster displayed the highest median immune expression (Figure 1B) and was characterized by the highest expression of the overall adaptive-cell score, and highest levels of B-cell, Tfh, Treg, T-helper cell, T-cell, CD8-T cell and PD-L1 (CD274) scores (Supplemental Figure 2). The innate-enriched cluster had the highest eosinophil and neutrophil scores (Supplemental Figure 1) and the highest overall innate-cell score expression. The immune-quiet cluster had the lowest overall immune expression (Figure 1B), including the lowest adaptive-cell and innate-cell score expression, but displayed significantly elevated macrophage scores (Supplemental Figure 2). Corresponding with pathologic evaluation, TILs were significantly higher in adaptive-enriched tumors compared to immune-quiet (p=0.00001) and innate-enriched (p<0.000001) (Figure 1C,D). Thus, these clusters represent both overall immune expression patterns and cell-type specific differences in immune response.
Figure 1. Global immune clusters in CBCS.
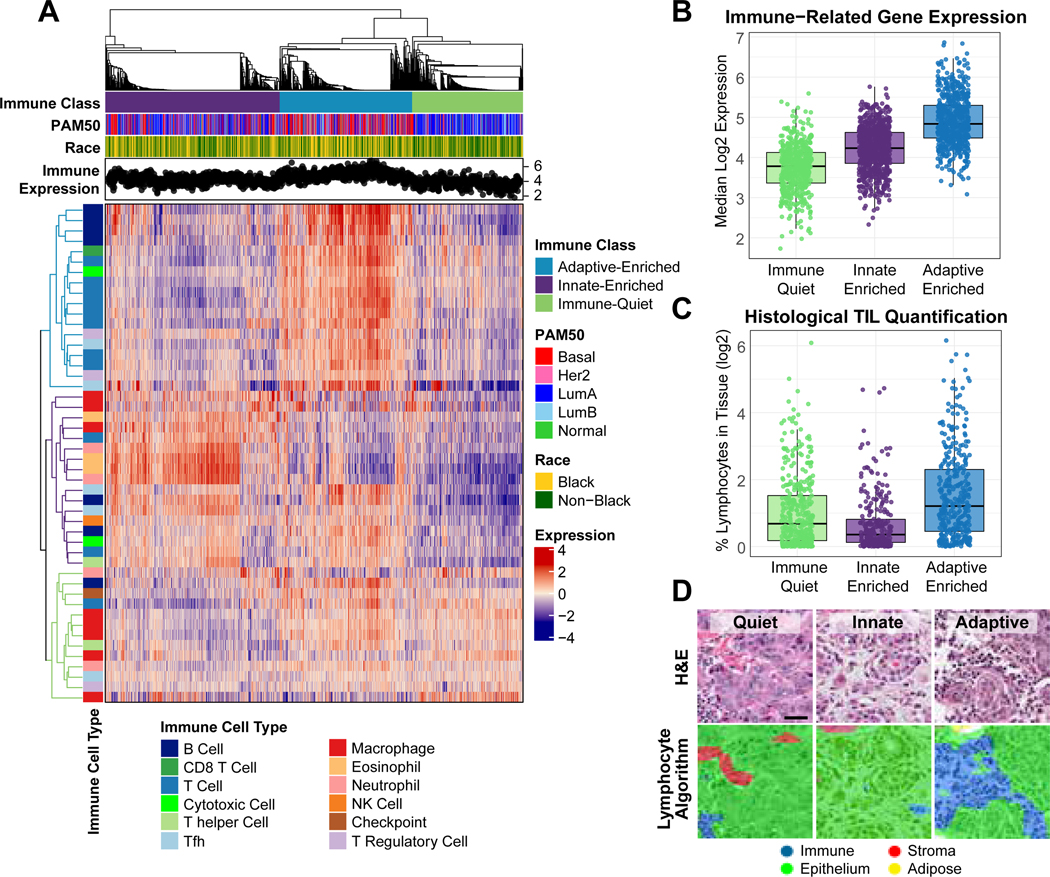
(A) Heatmap of RNA immune expression, with top dendrogram ordered by consensus clustering and displaying adaptive-enriched (blue), innate-enriched (Purple) and immune-quiet (green) classes. Denoted are PAM50 molecular subtype, race, and sample-level overall median immune expression across clusters. Highly expressed immune genes in each cluster are indicated by the colored dendrograms on the left of the heat map (B) Overall median immune gene expression across three global immune clusters. (C) Boxplot displaying the log2-transformed percent of lymphocytes quantified in tissue from CBCS tissue microarrays (D) Representative H&E images of immune-quiet, innate-enriched and adaptive enriched tissue sections (upper panel), with lymphocyte quantification algorithm overlay (lower panel).
Given the availability of the full CIBERSORT 547-gene immune deconvolution panel in TCGA RNA-Seq data42, we compared our classification with CIBERSORT-based estimation, filtering to the cell types represented in our targeted immune panel. Expression patterns by CIBERSORT expression patterns mirrored those in our targeted panel (Figure 2A, lower panel). However, in independent analysis, only two stable immune clusters were identified in TCGA: overall Immune-High and Immune-Low (Figure 2A,B), which could be reflective of differing tumor and demographic characteristics in this dataset. The Immune-High group shared features of the CBCS adaptive-enriched cluster, with higher DNA methylation-based estimates of leukocytes41 (Figure 2C), and higher TIL counts (Figure 2D,E).
Figure 2. Immune clusters in TCGA BC.

(A) Heatmap of RNA immune expression clusters identified by consensus clustering using 48-gene panel, showing immune-high (dark blue) and immune-low (sky blue) classes, PAM50 subtype and race (upper panel), as well as CIBERSORT immune cell estimates (lower panel). (B) Boxplots displaying overall median immune gene expression, (C) DNA leukocyte scores (D) and histological TIL quantification across RNA-based immune classes. (E) Representative H&E images of lymphocytic infiltrate in immune-low and immune-high tissue sections.
Because the TCGA seemed not to include the immune-quiet cluster based on unsupervised clustering in independent discovery, we used CBCS centroids to identify all three immune classes in TCGA. Distance to centroid showed that 85.5% of Immune-High tumors were classified as adaptive-enriched, while 87.5% of Immune-Low tumors were innate-enriched or immune-quiet. The adaptive-enriched cluster was found in nearly half (n=489, 44.7%) of TCGA tumors, while innate enriched was the other dominant class (n=532, 48.6%). The immune-quiet cluster was rare in TCGA (n=74, 6.8%) and similar to CBCS, consisted predominantly of low stage (I/II) and Luminal A tumors (Supplemental Figure 3).
We compared our three clusters to 6 published immune-related subtypes identified using 160 validated immune signatures in TCGA PanCancer43. The adaptive-enriched cluster had the highest frequency of ‘C2-IFNγ-dominant’ and ‘C3-Inflammatory’ subtypes. Innate-enriched and immune quiet were associated with ‘C1-Wound-healing’ and ‘C4-Lymphocyte-depleted’. Additionally, the immune-quiet had the highest frequency of the rare (3% prevalence in TCGA PanCancer) ‘C6-TGFβ-dominant’ subtype, which is characterized by an immunosuppressive phenotype (Supplemental Figure 3).
Immune Response, Patient and Tumor Characteristics in CBCS
We evaluated associations between immune clusters and patient age at diagnosis, race, tumor grade, stage, node status and BMI in CBCS. Relative to immune-quiet, the adaptive-enriched cluster was associated with young age, high grade, and low BMI, while both adaptive-enriched and innate-enriched were associated with Black race (Figure 3). Adaptive-enriched and innate-enriched clusters remained significantly associated with Black race when also adjusting for tumor grade, but associations between adaptive-enriched, young age and BMI were attenuated. There were no significant associations with node status or tumor stage.
Figure 3. Association between CBCS immune clusters, patient and tumor characteristics.

Forest plot displaying relative frequency differences and 95% confidence intervals for patient age, race, BMI, tumor grade, stage and node status across global immune clusters. Reduced models were adjusted for age and race in where appropriate (black points) and full models were additionally adjusted for grade (blue points). Referent groups for each individual model are indicated in figure, and sample size (n) and percentages are listed for each model. RFD: relative frequency difference; 95% CI: 95% confidence interval; BMI: body mass index; Immune referent group= Immune-Quiet for all models.
Global immune clusters were strongly associated with both clinical and molecular BC subtypes. Adaptive-enriched was associated with IHC-based HER2+/HR- (HER2+) BC, and both adaptive-enriched and innate-enriched were strongly associated with TNBC, the RNA-based Basal-like subtype and high ROR-PT scores (Figure 4). Combined race and age adjustments were not possible in PAM50 and ROR-PT models due to high collinearity. However, we performed a sensitivity analysis restricting to ER-positive tumors, since this subtype is known to be less immunogenic19. Among ER-positive tumors only, adaptive-enriched remained strongly associated with Black race and high grade, but not age (Supplemental Figure 4). Conversely, young age was associated with both adaptive- and innate-enriched clusters among ER-negative tumors, despite race and grade adjustments (Adaptive RFD [95%CI]:14.2 [2.4, 25.9]; Innate: 14.2 [2.3, 26.0]).
Figure 4. Association between CBCS immune clusters and clinical and molecular tumor subtypes.

Forest plot displaying relative frequency differences and 95% confidence intervals for clinical (IHC-based) HER2+/HR- and TNBC subtypes, RNA-based Basal-like vs non-Basal molecular subtypes and ROR-PT scores adjusted for age (black points) and both age and race (blue points). Referent groups for each individual model are indicated in figure, and sample size (n) and percentages are listed for each model. RFD: relative frequency difference; 95% CI: 95% confidence interval; BMI: body mass index; Immune referent group= Immune-Quiet for all models.
Global Immune Clusters and Recurrence
The CBCS identified 143 recurrences during the first five years of follow up and we assessed associations between the three immune clusters and recurrence using both Kaplan-Meier analyses and multivariate Cox proportional hazards models. Results underscore the importance of ER as a modifier. Considering all tumor subtypes, immune-quiet and adaptive-enriched tumors were associated with improved RFS, while innate-enriched had the poorest RFS (Figure 5A). However, after stratification by ER status, significant associations were limited to ER-negative tumors (Figure 5B,C), where adaptive-enriched tumors had the best RFS and innate-enriched tumors had the poorest RFS.
Figure 5. Five-year recurrence-free survival (RFS) by global immune cluster in CBCS.

Kaplan-Meier survival analysis illustrating 5 year RFS in (A) all CBCS phase 3 cases, (B) among ER-negative tumors only and (C) among ER-positive tumors only. Cox proportional hazard ratios and 95% confidence intervals adjusted for patient age, race and tumor stage are displayed within each plot for innate-enriched and immune-quiet clusters relative to adaptive-enriched. All analyses were restricted to stage I-III tumors. Tick marks represent censored individuals. ER: estrogen receptor; HR: hazard ratio; 95% CI: 95% Confidence Interval. Referent group= Adaptive-enriched for CoxPH models.
DISCUSSION
This study investigated the BC immune microenvironment in a large and diverse population-based study and identified a novel class of immune response that is immune-quiet. This subtype was present at very low prevalence in TCGA, emphasizing that diverse cohorts representing the full range of tumor phenotypes are valuable for understanding the diversity of immune response. In this racially diverse cohort, we also showed that Black women had higher frequencies of adaptive-enriched and innate-enriched tumors. These racial differences persisted in ER-stratified analyses, suggesting that they are not driven exclusively by subtype and may reflect other race-associated exposures or stressors. Young age and high grade were also associated with adaptive response. Immune response differences showed the strongest relationships with recurrence among ER-negative cancers.
Our results showing associations between immune response and tumor molecular subtypes are in line with previous literature, where the highest immune expression levels were observed in aggressive tumors (TNBC, basal-like, HER2-enriched subtypes19, high ROR-PT scores and high grade44). Several smaller studies have reported immunological differences between Black and non-Black BC patients suggesting elevated immune infiltrates in tumors from Black women20–25. Here, we observed strong and independent associations between race and the immune microenvironment; but race differences were consistently smaller in magnitude than those for grade and subtype. Our finding of increased adaptive-enriched expression was consistent with a smaller study by Yao et al24 that identified higher TILs in tumors from Black women while matching on age and subtype. However, adaptive immune responses in cancer are complex, with conflicting associations between the presence of certain lymphocyte populations and patient outcomes45–48. Thus, further delineation and spatial evaluation of the distribution of specific immune cell populations may be needed to resolve some of the conflicting studies. We also observed a high frequency of innate-enriched tumors in Black women. This cluster may be particularly important, as it was associated with aggressive subtypes/high ROR-PT scores and had the highest recurrence hazards in our study.
Studies of tumor immune microenvironment have emphasized clinical features, but herein we also assessed immune differences by age and BMI, as both can systemically impact immune function11. Building upon previous work in rodent models12, young age was associated with the strongest immune response among ER-negative tumors. Conversely, tumors from patients with BMI ≥25 were more frequently immune-quiet. Previous studies have suggested that high BMI is associated with increased macrophage infiltration, and we found evidence that immune-quiet tumors had high macrophage infiltration (while lacking other innate immune cell signals). Thus, the association of high BMI with this cluster appears consistent with multiple studies linking obesity with macrophage-mediated BC pathogenesis49–51. Identification of other social or institutional variables that impact immune phenotypes is important, particularly in understanding race as a social construct. As such, disentangling race, age, and a larger range of individual and community-level variables is an important future direction.
While our study recapitulated previous findings emphasizing abundance of immune cell infiltrates (i.e. TILs) showing that robust adaptive response predicts lower recurrence among ER-negative tumors3–5, we also present novel data suggesting that the character of immune response, not just abundance, is important in BC outcomes. Specifically, we show that innate-enriched tumors had the poorest RFS. While the innate-enriched group had the lowest lymphocyte-related expression, this finding also suggests that the patterns of specific innate cell types may be important, particularly given that the immune-quiet cluster also had lower lymphocyte expression but did not convey the poorest survival. Previous studies have found some associations between innate immune cell expression, poor survivorship52 and resistance to neoadjuvant chemotherapy in BC53. Our data extends those previous findings in largely Caucasian tumor bank studies to a population-based cohort enriched for younger and Black women. Given that Black race was strongly associated with both adaptive-enriched and innate-enriched clusters, these data suggest that some Black women may be candidates for immune-checkpoint blockade. However, in-depth investigation of the role of innate immune cells in BC is needed to address the high prevalence of poor-prognosis innate-enriched tumors among this patient population.
The CBCS and TCGA differ in that TCGA is skewed toward more late stage, large breast tumors due to the minimum tissue requirements, and has larger proportions of older, white women (PMID: 30131556). In contrast, CBCS represents a broader and more natural distribution of stage in the population, including an increased frequency of small, early-stage tumors. In line with our finding that immune-quiet tumors tended to be smaller and ER-positive, our results suggest higher proportions of immune-quiet tumors in CBCS, making this cluster more readily discernable. These data suggest this immune subtype would be higher in clinical populations than predicted based on TCGA breast cancer data.
A strength of our analysis was use of a large, population-based cohort for which we optimized a custom immune cell-focused codeset suited to FFPE specimens. This targeted approach may miss some rare cell types (i.e. mast cells) and differs from immune panels focused on activation/exhaustion states. Nevertheless, our custom panel has twice the number of innate cell-specific genes than the commonly used nCounter Breast Cancer 360 Panel (BC360™). This balanced inclusion of cell markers resulted in strong representation from both adaptive and innate pathways and correlated with large and validated immune signatures42, 43. However, future studies of cell type distribution and spatial arrangement of cell types may be valuable. Future studies, with larger recurrence rates or longer follow up times, could also consider how subtype, age, race and immune response interact on a more granular level (e.g. stratifying on age, race, and subtype).
Given that younger patients and Black women are more frequently diagnosed with aggressive BC subtypes and have higher burden of poor outcomes, it is important to understand immunological differences in these patients. Our discovery of a novel immune-quiet cluster with 27% prevalence in a population-based cohort also suggests that it is important to study immune response in diverse cohorts. In addition, methods that utilize cell-type specific markers are important because of distinct survivorship patterns among ER-negatives that depend on the dominant immune phenotype present.
Supplementary Material
Acknowledgements:
We are grateful to CBCS participants for their generous participation, as well as study staff. The authors would like to acknowledge the UNC-CH BioSpecimen Processing Facility for sample processing, storage, and sample disbursements (http://bsp.web.unc.edu/). This work and the Carolina Breast Cancer Study was supported by a grant from UNC Lineberger Comprehensive Cancer Center, which is funded by the University Cancer Research Fund of North Carolina; the Susan G. Komen Foundation (OGUNC1202 and TREND21686258) to M.A. Troester; and the National Cancer Institute of the National Institutes of Health (P01CA151135) to M.A. Troester, including the National Cancer Institute Specialized Program of Research Excellence (SPORE) in Breast Cancer (P50CA058223) to C.M. Perou, J.S. Serody, S.M. Downs-Canner, M.A. Troester and K.A. Hoadley. In addition, this work was supported by R01CA253450 to M.A. Troester and K.A. Hoadley, F31CA257388 to A.M. Hamilton, Komen Career Catalyst Grant (CCR16376756) to K.A. Hoadley, and University of North Carolina at Chapel Hill Cancer Control Education Program (T32CA057726) to A.N. Walens. This research recruited participants and/or obtained data with the assistance of Rapid Case Ascertainment, a collaboration between the North Carolina Central Cancer Registry and UNC Lineberger. Rapid Case Ascertainment is supported by a grant from the National Cancer Institute of the National Institutes of Health (P30CA016086). The Pathology Services Core is supported in part by National Cancer Institute of the National Institutes of Health Center Core Support Grant (P30CA016080) and the University of North Carolina at Chapel Hill University Cancer Research Fund.
Footnotes
Conflict of Interest Statement: C.M.P is an equity stockholder and consultant of BioClassifier LLC; C.M.P is also listed as an inventor on patent applications for the Breast PAM50 Subtyping assay. The other authors declare no potential conflicts of interest.
REFERENCES
- 1.Whitford P, Mallon EA, George WD, and Campbell AM, Flow cytometric analysis of tumour infiltrating lymphocytes in breast cancer. Br J Cancer, 1990. 62(6): p. 971–5. [DOI] [PMC free article] [PubMed] [Google Scholar]
- 2.Chin Y, Janseens J, Vandepitte J, Vandenbrande J, Opdebeek L, and Raus J, Phenotypic analysis of tumor-infiltrating lymphocytes from human breast cancer. Anticancer Res, 1992. 12(5): p. 1463–6. [PubMed] [Google Scholar]
- 3.Loi S, Sirtaine N, Piette F, Salgado R, Viale G, Van Eenoo F, et al. , Prognostic and Predictive Value of Tumor-Infiltrating Lymphocytes in a Phase III Randomized Adjuvant Breast Cancer Trial in Node-Positive Breast Cancer Comparing the Addition of Docetaxel to Doxorubicin With Doxorubicin-Based Chemotherapy: BIG 02–98. Journal of Clinical Oncology, 2013. 31(7): p. 860–867. [DOI] [PubMed] [Google Scholar]
- 4.Denkert C, Von Minckwitz G, Brase JC, Sinn BV, Gade S, Kronenwett R, et al. , Tumor-Infiltrating Lymphocytes and Response to Neoadjuvant Chemotherapy With or Without Carboplatin in Human Epidermal Growth Factor Receptor 2–Positive and Triple-Negative Primary Breast Cancers. Journal of Clinical Oncology, 2015. 33(9): p. 983–991. [DOI] [PubMed] [Google Scholar]
- 5.Adams S, Gray RJ, Demaria S, Goldstein L, Perez EA, Shulman LN, et al. , Prognostic Value of Tumor-Infiltrating Lymphocytes in Triple-Negative Breast Cancers From Two Phase III Randomized Adjuvant Breast Cancer Trials: ECOG 2197 and ECOG 1199. 2014. 32(27): p. 2959–2966. [DOI] [PMC free article] [PubMed] [Google Scholar]
- 6.Iglesia MD, Parker JS, Hoadley KA, Serody JS, Perou CM, and Vincent BG, Genomic Analysis of Immune Cell Infiltrates Across 11 Tumor Types. Journal of the National Cancer Institute, 2016. 108(11): p. djw144. [DOI] [PMC free article] [PubMed] [Google Scholar]
- 7.Lee HJ, Lee J-J, Song IH, Park IA, Kang J, Yu JH, et al. , Prognostic and predictive value of NanoString-based immune-related gene signatures in a neoadjuvant setting of triple-negative breast cancer: relationship to tumor-infiltrating lymphocytes. Breast Cancer Research and Treatment, 2015. 151(3): p. 619–627. [DOI] [PubMed] [Google Scholar]
- 8.Millikan RC, Newman B, Tse CK, Moorman PG, Conway K, Dressler LG, et al. , Epidemiology of basal-like breast cancer. Breast Cancer Res Treat, 2008. 109(1): p. 123–39. [DOI] [PMC free article] [PubMed] [Google Scholar]
- 9.Palmer JR, Ambrosone CB, and Olshan AF, A collaborative study of the etiology of breast cancer subtypes in African American women: the AMBER consortium. Cancer Causes Control, 2014. 25(3): p. 309–19. [DOI] [PMC free article] [PubMed] [Google Scholar]
- 10.Pawelec G, Age and immunity: What is “immunosenescence”? Exp Gerontol, 2018. 105: p. 4–9. [DOI] [PubMed] [Google Scholar]
- 11.Cramer DW and Finn OJ, Epidemiologic perspective on immune-surveillance in cancer. Curr Opin Immunol, 2011. 23(2): p. 265–71. [DOI] [PMC free article] [PubMed] [Google Scholar]
- 12.McAllister SS Abstract IA023: TIME and Age: Impact of age on the tumor immune microenvironment and response to therapy. American Association for Cancer Research. [Google Scholar]
- 13.Ajilore O. and Thames AD, The fire this time: The stress of racism, inflammation and COVID-19. Brain Behav Immun, 2020. 88: p. 66–67. [DOI] [PMC free article] [PubMed] [Google Scholar]
- 14.DeSantis CE, Fedewa SA, Goding Sauer A, Kramer JL, Smith RA, and Jemal A, Breast cancer statistics, 2015: Convergence of incidence rates between black and white women. CA Cancer J Clin, 2016. 66(1): p. 31–42. [DOI] [PubMed] [Google Scholar]
- 15.Siegel RL, Miller KD, and Jemal A, Cancer statistics, 2020. CA Cancer J Clin, 2020. 70(1): p. 7–30. [DOI] [PubMed] [Google Scholar]
- 16.Anders CK, Hsu DS, Broadwater G, Acharya CR, Foekens JA, Zhang Y, et al. , Young age at diagnosis correlates with worse prognosis and defines a subset of breast cancers with shared patterns of gene expression. J Clin Oncol, 2008. 26(20): p. 3324–30. [DOI] [PubMed] [Google Scholar]
- 17.O’Brien KM, Cole SR, Tse CK, Perou CM, Carey LA, Foulkes WD, et al. , Intrinsic breast tumor subtypes, race, and long-term survival in the Carolina Breast Cancer Study. Clin Cancer Res, 2010. 16(24): p. 6100–10. [DOI] [PMC free article] [PubMed] [Google Scholar]
- 18.Troester MA, Sun X, Allott EH, Geradts J, Cohen SM, Tse CK, et al. , Racial Differences in PAM50 Subtypes in the Carolina Breast Cancer Study. J Natl Cancer Inst, 2018. 110(2): p. 176–182. [DOI] [PMC free article] [PubMed] [Google Scholar]
- 19.Iglesia MD, Parker JS, Hoadley KA, Serody JS, Perou CM, and Vincent BG, Genomic Analysis of Immune Cell Infiltrates Across 11 Tumor Types. J Natl Cancer Inst, 2016. 108(11): p. djw144. [DOI] [PMC free article] [PubMed] [Google Scholar]
- 20.Martin DN, Boersma BJ, Yi M, Reimers M, Howe TM, Yfantis HG, et al. , Differences in the tumor microenvironment between African-American and European-American breast cancer patients. PLoS One, 2009. 4(2): p. e4531. [DOI] [PMC free article] [PubMed] [Google Scholar]
- 21.Jenkins BD, Martini RN, Hire R, Brown A, Bennett B, Brown I, et al. , Atypical Chemokine Receptor 1 (DARC/ACKR1) in Breast Tumors Is Associated with Survival, Circulating Chemokines, Tumor-Infiltrating Immune Cells, and African Ancestry. Cancer Epidemiol Biomarkers Prev, 2019. 28(4): p. 690–700. [DOI] [PMC free article] [PubMed] [Google Scholar]
- 22.Koru-Sengul T, Santander AM, Miao F, Sanchez LG, Jorda M, Gluck S, et al. , Breast cancers from black women exhibit higher numbers of immunosuppressive macrophages with proliferative activity and of crown-like structures associated with lower survival compared to non-black Latinas and Caucasians. Breast Cancer Res Treat, 2016. 158(1): p. 113–126. [DOI] [PMC free article] [PubMed] [Google Scholar]
- 23.Deshmukh SK, Srivastava SK, Bhardwaj A, Singh AP, Tyagi N, Marimuthu S, et al. , Resistin and interleukin-6 exhibit racially-disparate expression in breast cancer patients, display molecular association and promote growth and aggressiveness of tumor cells through STAT3 activation. Oncotarget, 2015. 6(13): p. 11231–41. [DOI] [PMC free article] [PubMed] [Google Scholar]
- 24.Yao S, Cheng TD, Elkhanany A, Yan L, Omilian A, Abrams SI, et al. , Breast Tumor Microenvironment in Black Women: A Distinct Signature of CD8+ T Cell Exhaustion. J Natl Cancer Inst, 2021. 113(8): p. 1036–1043. [DOI] [PMC free article] [PubMed] [Google Scholar]
- 25.Abdou Y, Attwood K, Cheng TD, Yao S, Bandera EV, Zirpoli GR, et al. , Racial differences in CD8(+) T cell infiltration in breast tumors from Black and White women. Breast Cancer Res, 2020. 22(1): p. 62. [DOI] [PMC free article] [PubMed] [Google Scholar]
- 26.Newman B, Moorman PG, Millikan R, Qaqish BF, Geradts J, Aldrich TE, et al. , The Carolina Breast Cancer Study: integrating population-based epidemiology and molecular biology. Breast Cancer Res Treat, 1995. 35(1): p. 51–60. [DOI] [PubMed] [Google Scholar]
- 27.Bhattacharya A, Garcia-Closas M, Olshan AF, Perou CM, Troester MA, and Love MI, A framework for transcriptome-wide association studies in breast cancer in diverse study populations. Genome Biol, 2020. 21(1): p. 42. [DOI] [PMC free article] [PubMed] [Google Scholar]
- 28.van Buuren S G-OK, mice: Multivariate Imputation by Chained Equations in R. Journal of Statistical Software, 2011. 45(3): p. 1–67. [Google Scholar]
- 29.Ali AM, Dawson SJ, Blows FM, Provenzano E, Ellis IO, Baglietto L, et al. , Comparison of methods for handling missing data on immunohistochemical markers in survival analysis of breast cancer. Br J Cancer, 2011. 104(4): p. 693–9. [DOI] [PMC free article] [PubMed] [Google Scholar]
- 30.Troester MA, Sun X, Allott EH, Geradts J, Cohen SM, Tse C-K, et al. , Racial Differences in PAM50 Subtypes in the Carolina Breast Cancer Study. JNCI: Journal of the National Cancer Institute, 2018. 110(2): p. 176–182. [DOI] [PMC free article] [PubMed] [Google Scholar]
- 31.Parker JS, Mullins M, Cheang MC, Leung S, Voduc D, Vickery T, et al. , Supervised risk predictor of breast cancer based on intrinsic subtypes. J Clin Oncol, 2009. 27(8): p. 1160–7. [DOI] [PMC free article] [PubMed] [Google Scholar]
- 32.Bhattacharya A, Hamilton AM, Furberg H, Pietzak E, Purdue MP, Troester MA, et al. , An approach for normalization and quality control for NanoString RNA expression data. Brief Bioinform, 2021. 22(3): p. bbaa163. [DOI] [PMC free article] [PubMed] [Google Scholar]
- 33.Danaher P, Warren S, Dennis L, D’Amico L, White A, Disis ML, et al. , Gene expression markers of Tumor Infiltrating Leukocytes. J Immunother Cancer, 2017. 5: p. 18. [DOI] [PMC free article] [PubMed] [Google Scholar]
- 34.Bindea G, Mlecnik B, Tosolini M, Kirilovsky A, Waldner M, Obenauf AC, et al. , Spatiotemporal dynamics of intratumoral immune cells reveal the immune landscape in human cancer. Immunity, 2013. 39(4): p. 782–95. [DOI] [PubMed] [Google Scholar]
- 35.Lyons YA, Wu SY, Overwijk WW, Baggerly KA, and Sood AK, Immune cell profiling in cancer: molecular approaches to cell-specific identification. NPJ Precis Oncol, 2017. 1(1): p. 26. [DOI] [PMC free article] [PubMed] [Google Scholar]
- 36.Walens A, Olsson LT, Gao X, Hamilton AM, Kirk EL, Cohen SM, et al. , Protein-based immune profiles of basal-like vs. luminal breast cancers. Lab Invest, 2021. 101: p. 785–793. [DOI] [PMC free article] [PubMed] [Google Scholar]
- 37.Wilkerson MD and Hayes DN, ConsensusClusterPlus: a class discovery tool with confidence assessments and item tracking. Bioinformatics, 2010. 26(12): p. 1572–3. [DOI] [PMC free article] [PubMed] [Google Scholar]
- 38.Gu Z, Eils R, and Schlesner M, Complex heatmaps reveal patterns and correlations in multidimensional genomic data. Bioinformatics, 2016. 32(18): p. 2847–9. [DOI] [PubMed] [Google Scholar]
- 39.Dabney AR, Classification of microarrays to nearest centroids. Bioinformatics, 2005. 21(22): p. 4148–4154. [DOI] [PubMed] [Google Scholar]
- 40.Olsson LT, Williams LA, Midkiff BR, Kirk EL, Troester MA, and Calhoun BC, Quantitative Analysis of Breast Cancer Tissue Composition and Associations with Tumor Subtype. Hum Pathol, 2022. 23:S0046–8177(22)00046–6. doi: 10.1016/j.humpath.2022.02.013. Epub ahead of print. [DOI] [PMC free article] [PubMed] [Google Scholar]
- 41.Hoadley KA, Yau C, Hinoue T, Wolf DM, Lazar AJ, Drill E, et al. , Cell-of-Origin Patterns Dominate the Molecular Classification of 10,000 Tumors from 33 Types of Cancer. Cell, 2018. 173(2): p. 291–304 e6. [DOI] [PMC free article] [PubMed] [Google Scholar]
- 42.Newman AM, Liu CL, Green MR, Gentles AJ, Feng W, Xu Y, et al. , Robust enumeration of cell subsets from tissue expression profiles. Nat Methods, 2015. 12(5): p. 453–7. [DOI] [PMC free article] [PubMed] [Google Scholar]
- 43.Thorsson V, Gibbs DL, Brown SD, Wolf D, Bortone DS, Ou Yang T-H, et al. , The Immune Landscape of Cancer. Immunity, 2019. 51(2): p. 411–412. [DOI] [PubMed] [Google Scholar]
- 44.Pujani M, Jain H, Chauhan V, Agarwal C, Singh K, and Singh M, Evaluation of Tumor infiltrating lymphocytes in breast carcinoma and their correlation with molecular subtypes, tumor grade and stage. Breast Dis, 2020. 39(2): p. 61–69. [DOI] [PubMed] [Google Scholar]
- 45.Wheeler DA, Takebe N, Hinoue T, Hoadley KA, Cardenas MF, Hamilton AM, et al. , Molecular Features of Cancers Exhibiting Exceptional Responses to Treatment. Cancer Cell, 2021. 39(1): p. 38–53 e7. [DOI] [PMC free article] [PubMed] [Google Scholar]
- 46.Helmink BA, Reddy SM, Gao J, Zhang S, Basar R, Thakur R, et al. , B cells and tertiary lymphoid structures promote immunotherapy response. Nature, 2020. 577(7791): p. 549–555. [DOI] [PMC free article] [PubMed] [Google Scholar]
- 47.Hollern DP, Xu N, Thennavan A, Glodowski C, Garcia-Recio S, Mott KR, et al. , B Cells and T Follicular Helper Cells Mediate Response to Checkpoint Inhibitors in High Mutation Burden Mouse Models of Breast Cancer. Cell, 2019. 179(5): p. 1191–1206 e21. [DOI] [PMC free article] [PubMed] [Google Scholar]
- 48.Yuen GJ, Demissie E, and Pillai S, B lymphocytes and cancer: a love-hate relationship. Trends Cancer, 2016. 2(12): p. 747–757. [DOI] [PMC free article] [PubMed] [Google Scholar]
- 49.Maliniak ML, Cheriyan AM, Sherman ME, Liu Y, Gogineni K, Liu J, et al. , Detection of crown-like structures in breast adipose tissue and clinical outcomes among African-American and White women with breast cancer. Breast Cancer Res, 2020. 22(1): p. 65. [DOI] [PMC free article] [PubMed] [Google Scholar]
- 50.Arendt LM, McCready J, Keller PJ, Baker DD, Naber SP, Seewaldt V, et al. , Obesity promotes breast cancer by CCL2-mediated macrophage recruitment and angiogenesis. Cancer Res, 2013. 73(19): p. 6080–93. [DOI] [PMC free article] [PubMed] [Google Scholar]
- 51.Mullooly M, Yang HP, Falk RT, Nyante SJ, Cora R, Pfeiffer RM, et al. , Relationship between crown-like structures and sex-steroid hormones in breast adipose tissue and serum among postmenopausal breast cancer patients. Breast Cancer Res, 2017. 19(1): p. 8. [DOI] [PMC free article] [PubMed] [Google Scholar]
- 52.Tekpli X, Lien T, Rossevold AH, Nebdal D, Borgen E, Ohnstad HO, et al. , An independent poor-prognosis subtype of breast cancer defined by a distinct tumor immune microenvironment. Nat Commun, 2019. 10(1): p. 5499. [DOI] [PMC free article] [PubMed] [Google Scholar]
- 53.Hoadley KA, Hyslop T, Fan C, Berry DA, Hahn O, Tolaney SM, et al. , Multivariate analysis of subtype and gene expression signatures predictive of pathologic complete response (pCR) in triple-negative breast cancer (TNBC): CALGB 40603 (Alliance). Cancer Research, 2017. 77. [Google Scholar]
Associated Data
This section collects any data citations, data availability statements, or supplementary materials included in this article.
Supplementary Materials
Data Availability Statement
TCGA BC dataset, including 1095 primary tumors, is publicly available under dbGaP accession phs000178.v1.p1. TCGA BC dataset was used to validate the use of our immune panel in BC samples, and leveraged for the availability of multiple data platforms for each case, including RNA sequencing, leukocyte-specific DNA methylation markers41 and histological TIL quantification by study pathologists. These data and description of related methods are available at https://gdc.cancer.gov/about-data/publications/PanCan-CellOfOrigin41, with patient characteristics described in Table 1. CBCS data are available upon request (https://unclineberger.org/cbcs).