

Abstract
Fatty acid receptors have been recognized as important players in glycaemic control. This study is the first to describe a role for the medium‐chain fatty acid (MCFA) receptor G‐protein‐coupled receptor (Gpr) 84 in skeletal muscle mitochondrial function and insulin secretion. We are able to show that Gpr84 is highly expressed in skeletal muscle and adipose tissue. Mice with global deletion of Gpr84 [Gpr84 knockout (KO)] exhibit a mild impairment in glucose tolerance when fed a MCFA‐enriched diet. Studies in mice and pancreatic islets suggest that glucose intolerance is accompanied by a defect in insulin secretion. MCFA‐fed KO mice also exhibit a significant impairment in the intrinsic respiratory capacity of their skeletal muscle mitochondria, but at the same time also exhibit a substantial increase in mitochondrial content. Changes in canonical pathways of mitochondrial biogenesis and turnover are unable to explain these mitochondrial differences. Our results show that Gpr84 plays a crucial role in regulating mitochondrial function and quality control.—Montgomery, M. K., Osborne, B., Brandon, A. E., O'Reilly, L., Fiveash, C. E., Brown, S. H. J., Wilkins, B. P., Samsudeen, A., Yu, J., Devanapalli, B., Hertzog, A., Tolun, A. A., Kavanagh, T., Cooper, A. A., Mitchell, T. W., Biden, T. J., Smith, N. J., Cooney, G. J., Turner, N. Regulation of mitochondrial metabolism in murine skeletal muscle by the medium‐chain fatty acid receptor Gpr84. FASEB J. 33, 12264‐12276 (2019). www.fasebj.org
Keywords: mitochondrial function, insulin secretion, insulin resistance
ABBREVIATIONS
- β‐HAD
β‐hydroxy‐acyl‐dehydrogenase
- BAT
brown adipose tissue
- BSA
bovine serum albumin
- DAG
diacylglycerol
- ETC
electron transport chain
- FA
fatty acid
- FFA
free fatty acid
- GAPDH
glyceraldehyde 3‐phosphate dehydrogenase
- GIR
glucose infusion rate
- Gpr84
G‐protein‐coupled receptor 84
- GSIS
glucose‐stimulated insulin secretion
- GTT
glucose tolerance test
- iAUC
incremental area under the curve
- KO
knockout
- LCFA
long‐chain fatty acid
- LOOH
lipid hydroperoxide
- MCFA
medium‐chain fatty acid
- RER
respiratory exchange ratio
- RNA‐Seq
RNA sequencing
- ROS
reactive oxygen species
- SDH
succinate dehydrogenase
- TAG
triglyceride
- TBARS
thiobarbituric acid reactive substance
- WT
wild type
Excess intake of dietary fats is considered a key contributor to the development of major metabolic disorders such as obesity, diabetes, and cardiovascular disease (1). Much of our knowledge of the mechanisms of fat‐induced metabolic disease has come from studies using diets rich in long‐chain (C14‐22) fatty acids (LCFAs) (2, 3), which are recognized risk factors for the above disorders. However, it is also known that not all dietary fats produce the same metabolic effects. There is an extensive literature documenting the health benefits of ω‐3 fatty acids (FAs) (4, 5) and studies in humans and animals have shown that diets containing medium‐chain (C8‐12) fatty acids (MCFAs) increase energy expenditure, and thus do not produce the same degree of obesity or deterioration in glucose homeostasis as equivalent consumption of a diet high in LCFAs (6–10).
Dietary intake of MCFAs is typically low in humans (1‐2% of total dietary FAs); however, rodent studies have shown that diets enriched in MCFA lead to lower fat accumulation than diets containing equivalent amounts of LCFA (6, 7, 10, 11). MCFA supplementation has also been shown to promote weight loss in overweight humans (8, 9), and many studies have reported beneficial effects on insulin sensitivity of introducing dietary MCFAs (7, 10, 12, 13). Much of the difference between LCFAs and MCFAs has been proposed to be a result of elevated oxidation of MCFAs because they are less hydrophobic than LCFAs and can therefore bypass many of the regulatory steps controlling uptake of FAs into cells and entry into mitochondria for oxidation (11). Consistent with studies in humans (9), we have shown that diets rich in MCFAs increase whole‐body energy expenditure in mice, and this occurs in association with markedly enhanced mitochondrial function in skeletal muscle (10, 14).
In addition to their role in energy provision, FAs also act as important signaling molecules. Perhaps the best characterized signaling pathway for FAs is that involving their activation of peroxisome proliferator activated receptors (15, 16). In the last decade, it has also emerged that FAs act as ligands for a series of GPCRs, which include free fatty acid receptor (FFA)1 [formerly G‐protein‐coupled receptor (GPR) 40], FFA2 (GPR43), FFA3 (GPR41), FFA4 (GPR120), GPR84, and GPR119 (16, 17). These receptors display variations in tissue‐specific distribution and FA specificity and have been linked with the regulation of a diverse range of physiologic processes, including insulin secretion, inflammatory processes, intestinal hormone secretion, and insulin action (18–23).
In this study, we investigated the metabolic function of Gpr84, which was identified as an MCFA receptor by Wang et al. (24) approximately a decade ago. There has been relatively limited investigation of this receptor to date, with the majority of studies focusing on a putative role for this receptor in immune processes (25–29), largely as a result of early work suggesting high expression of Gpr84 in cells and tissues of the immune system (e.g., spleen, bone marrow) (24). Our re‐examination of Gpr84 expression indicates Gpr84 protein levels are highest in skeletal muscle. This is of interest because our previous work shows that skeletal muscle is a major target tissue for the metabolic effects of MCFAs (10, 14). Accordingly, we have examined the role of Gpr84 in regulating skeletal muscle mitochondrial metabolism and whole‐body energy homeostasis.
MATERIALS AND METHODS
Animal studies
C57BL/6 mice were obtained from the Animal Resources Centre (Perth, WA, Australia). Mice with global deletion of Gpr84 (on a C57BL/6 background) were generated. Gpr84tm1(KOMP)Vlcg targeted embryonic stem cells were obtained from the Knockout Mouse Project (KOMP) repository (University of California‐Davis, Davis, CA, USA), and Gpr84 heterozygous mice were produced, using these cells, by the Australian Phenomics Network (Monash node) (30). Mice were crossed with mice expressing ROSA‐Cre to remove the selection cassette, and the resulting Gpr84 heterozygous pairs were used for subsequent breeding.
Gpr84 knockout (KO) mice and wild‐type (WT) littermates were maintained in a temperature‐controlled room (22°C ± 1°C) with a 12‐h light/dark cycle and ad libitum access to food and water. Mice received either a standard chow laboratory diet (8% calories from fat; Gordon's Specialty Stock Feeds, Yanderra, NSW, Australia) or a MCFA‐enriched high‐fat diet (45% calories as fat) supplemented with hydrogenated coconut oil for 8 wk. The dietary FA composition of the diet has been previously described by our group (10). At the conclusion of the feeding regime, plasma and tissue samples were collected from mice at 09:00‐10:00 am without any prior unfed period. All experiments were approved by the University of New South Wales and Garvan Institute/St Vincent's Hospital Animal Care and Ethics Committees and followed guidelines issued by the National Health and Medical Research Council of Australia.
Body composition and energy expenditure
Fat mass was measured using the EchoMRI‐900 Body Composition Analyzer (EchoMRI Corp., Singapore) in accordance with the manufacturer's instructions. Heat production and respiratory exchange ratio (RER) were measured using an Oxymax Indirect Calorimeter (Comprehensive Laboratory Animal Monitoring System, Columbus Instruments, Columbus, OH, USA), as previously described by Turner et al. (31).
Glucose tolerance
Mice were not fed for 6 h, then received an intraperitoneal glucose injection (2g/kg lean mass), and blood glucose levels were monitored from the tail tip using an AccuCheck II glucometer (Roche, Basel, Switzerland). Plasma insulin levels were determined by ELISA (Crystal Chem, Elk Grove Village, IL, USA).
Hyperinsulinemic euglycemic clamps
Mice underwent dual cannulation surgery as described elsewhere by Holt et al. (32). Approximately 4‐7 d postsurgery, and after ~5 h of being unfed, a hyperinsulinaemiceuglycaemic clamp was conducted. Mice were conscious, unrestrained, and were not handled during the procedure to minimize stress. At ‐90 min, a primed (5 μCi) continuous infusion (0.05 μCi/min) of [3‐3H]glucose (PerkinElmer, Waltham, MA, USA) was commenced. At ‐30, ‐20, ‐10, and 0 min, samples were collected for basal glucose turnover and glucose and insulin levels (‐30 and 0). At time 0, the rate of [3‐3H]glucose was increased to (0.1 μCi/min) and primed to (16 μU/kg), continuous (4 μU/kg/min) infusion of insulin commenced (Actrapid; Novo Nordisk, Bagsværd, Denmark). Glucose (25%) was infused at a variable rate to maintain glycaemia at ~8 mM. Once blood glucose was stable, 4 sequential samples were taken for glucose turnover and insulin determination. A bolus of 2[14C]deoxyglucose (13 μCi; PerkinElmer) was then administered, and blood was sampled at 2, 5, 10, 15, 20, and 30 min for measurement of glucose uptake into specific tissues. Animals were then euthanised and organs removed, snap frozen in liquid nitrogen, and stored at ‐80°C for further analysis. Tissue glucose uptake was assessed as described by Holt et al. (32).
Plasma metabolites
Plasma triacylglycerol content was determined using a colorimetric assay kit [triglycerides (TAGs) GPO‐PAP; Roche], whereas plasma nonesterified FAs were measured using a Colorimetric Kit (Wako Diagnostics, Osaka, Japan).
Gene expression analysis
RNA was extracted using TriReagent (MilliporeSigma, Burlington, MA, USA) according to the manufacturer's protocol, followed by DNase treatment (RQ1 RNase‐free DNase; Promega, Madison, WI, USA) and synthesis of cDNA using Random Primer 9 (New England Biolabs, Ipswich, MA, USA) and Superscript III reverse transcriptase (Thermo Fisher Scientific, Waltham, MA, USA) according to the manufacturer's instructions. Real‐time PCR was performed using the Lightcycler 480 Probes Master Mix or Sybr Green (Qiagen, Germantown, MD, USA) on a real‐time PCR System (7900HT; Thermo Fisher Scientific). The value obtained for each specific product was normalized to a control gene (hypoxanthine‐guanine phospho ribosyl transferase in adipose tissue or ribosomal protein RPL27 in liver and muscle). Primer sequences are shown in Supplemental Table S1.
RNA sequencing library preparation and sequencing
Five micrograms of RNA were used as input for depletion of rRNA and mitochondrial rRNA transcripts by ribonuclease H digestion as previously described by Adiconus et al. (33). Depleted RNA was then used to generate paired‐end RNA sequencing (RNA‐Seq) libraries using the TruSeq Stranded mRNA Kit (Illumina, San Diego, CA, USA). Samples were prepared as per the manufacturer's protocol, except half reactions were used. Prepared libraries were pooled into an equimolar mixture that was assessed for quality and sequenced on 3 lanes of the HiSeq 2500 (Illumina) by the Kinghorn Centre for Clinical Genomics (Garvan Institute, Sydney, NSW, Australia). RNA‐Seq reads were demultiplexed and converted to files by the Kinghorn Centre for Clinical Genomics.
RNA‐Seq analysis
All FASTQ files were assessed for quality using the FastQC tool. Reads were then aligned to the mm10 reference mouse genome using STAR v.2.5.1a (34). Gene expression was then quantified with RSEM v.1.2.26 (35). Read counts were analyzed in R with edgeR v.3.20.9 (36, 37) and normalized with the glmQLF model. Heat maps of specific genes were created using scaled and normalized log2 counts per million with the gplots package. Principal component analysis plots were generated using ggbiplot package and the prcomp function in R on normalized reads.
Immunoblotting analysis
Whole‐tissue lysates were prepared from powdered muscle and liver by manual homogenization in RIPA buffer (38). Proteins were resolved by SDS‐PAGE, and immunoblot analysis was conducted as described elsewhere (10, 31). Immunolabeled bands were quantified using ImageJ 1.44p software (National Instututes of Health, Bethesda, MD, USA), with representative gel images and quantitation of immunoblots provided in Supplemental Figs. S2 and S3. Information on primary antibodies can be found in Supplemental Table S2. For the validation of the Gpr84 antibody, Gpr84 was overexpressed (Gpr84‐pcDNA3.1; GenScript, Nanjing, China) or knocked down (using Gpr84 short hairpin RNA plasmids, sc‐60752‐SH; Santa Cruz Biotechnology, Dallas, TX, USA) in tibialis anterior muscle using the method of gene transfer by electroporation, as previously described by Stöckli et al. (39).
Lipidomics analysis
Lipid extraction and mass spectrometry analysis was carried out as recently described by Montgomery et al. (40).
Mitochondrial measurements
Mitochondria from skeletal muscle (from mixed hindlimb muscle) and heart were isolated by differential centrifugation as previously described by Trzcionka et al. (41). Briefly, muscle and heart were diced in CP‐1 medium (100 mM KCl, 50 mM Tris/HCl, pH 7.4, and 2 mM EGTA), digested on ice for 3 min in CP‐2 medium [CP‐1, to which was added 0.5% (w/v) bovine serum albumin (BSA), 5 mM MgCl2, 1 mM ATP, and 2.45 U/ml Protease Type VIII (P 5380; MilliporeSigma)] and homogenized using an ultra‐turrax homogenizer. The homogenate was spun for 5 min at 500 g and 4°C. The resulting supernatant was subjected to a high‐speed spin (10,600 g, 10 min, 4°C) and the pellet was resuspended in CP‐1. The 10,600 g spin cycle was repeated twice. Protein content was measured using the Bradford method (Bio‐Rad, Hercules, CA, USA). Detailed methods on mitochondrial respiration and free radical production have been previously published by Montgomery et al. (14). Experimental details on permeabilized fiber preparation and analysis can be found in Turner et al.(42).
Measurement of enzyme activities and oxidative damage
Enzyme activities were measured in muscle homogenates as previously described in refs. 31 and 43. Similarly, thiobarbituric acid reactive substances (TBARSs), lipid hydroperoxide (LOOH), and protein carbonyls were measured in homogenates according to published methods (44–46).
Determination of mitochondrial content
Mitochondrial content was determined as the ratio of Mitochondrial D‐Loop DNA (mitochondrially encoded) to β‐actin (nuclear encoded) DNA. DNA was extracted from mixed quadriceps muscle (DNeasy Blood and Tissue Kits; Qiagen), and real‐time PCR was carried out as previously described. Primer sequences are shown in Supplemental Table S1.
Pancreatic islet isolation
Pancreatic islets were isolated by collagenase digestion and cultured for 48 h in DMEM with 11 mM glucose supplemented with 10% fetal bovine serum and either 200 μM lauric acid/0.92% BSA or BSA alone. Glucose‐stimulated insulin secretion (GSIS) was assessed using batches of 8 islets that were size‐matched by handpicking. Assays were performed in HBSS (supplemented with 0.5% BSA and 20 mM HEPES) with 2 mM glucose for 30 min, then 16.7 mM glucose for 30 min, at 37°C with 5% CO2. Secreted insulin and islet insulin content were assayed by radioimmunoassay (47).
Insulin staining in pancreatic sections
Pancreata fixed in formaldehyde were embedded in paraffin, sectioned at 5 μM and dewaxed in xylene and ethanol. Sections were blocked in 2% BSA before overnight incubation in insulin antibody (Abcam, Cambridge, MA, USA). Sections were incubated in H2O2 to block peroxidase activity before incubation with extravidin. Sections were then incubated in biotinylated goat anti‐guinea pig secondary for an hour at room temperature before being reacted with 3,3'diaminobenzidine reagent for 2 min. Sections were washed in PBS and counterstained in hemotoxylin prior to mounting with a mixture of distyrene, tricresyl phosphate, and xylene (DPX) mounting medium. Brightfield images were obtained at X20 magnification on an Olympus BX51 microscope (Olympus, Tokyo, Japan). ImageJ software was used to analyze the proportion of islet staining positive for insulin.
Assessment of acylcarnitine species
Muscle (60 mg) was lyophylized and reconstituted in 1 ml 80% acetonitrile containing internal acylcarnitine standards. Samples were sonicated and centrifuged, and 100 μl of supernatant was dried and reconstituted in 100 μl of 50% acetonitrile with 0.1% formic acid. Mass spectrometric analysis of acylcarnitine species was conducted on 1 μl of this solution on a Waters Xevo TQS LC‐MS/MS (Milford, MA, USA).
Statistical analysis
Results are presented as means ± sem. Data were analyzed with 2‐tailed Student's t tests, 1‐ or 2‐way ANOVA with Bonferroni post hoc analysis, where appropriate. Statistical significance was accepted at P < 0.05.
RESULTS
Tissue distribution of Gpr84
Previous data indicating that Gpr84 is most highly expressed in immune cells involved normalization of Gpr84 mRNA levels to the housekeeper glyceraldehyde 3‐phosphate dehydrogenase (Gapdh) (24). We evaluated Gpr84 and Gapdh mRNA expression across 18 mouse tissues and found that the abundance of Gapdh mRNA varies up to 500‐fold between tissues (very low expression in pancreas, spleen, lymph nodes, and bone marrow, with the highest expression in skeletal muscle, Supplemental Fig. S1A). In line with the previous approach (24), when Gpr84 mRNA was corrected for Gapdh mRNA, we similarly found that Gpr84 expression was the highest in immune tissues such as lymph nodes and spleen (Fig. 1 A). However, when using a Gpr84 serial dilution standard curve with well‐defined copies of Gpr84 DNA and measuring Gpr84 gene expression as copies of Gpr84 mRNA/ μg of total RNA, we observed that Gpr84 is expressed at the mRNA level in many tissues, including skeletal muscle, liver, and adipose tissue (Fig. 1 B). To examine if this pattern translated to the protein level, immunoblotting for Gpr84 was conducted, and this analysis revealed substantial differences in Gpr84 protein, with the greatest abundance in skeletal muscle (quadriceps, gastrocnemius, tibialis anterior and soleus muscle), followed by brown adipose tissue (BAT) and inguinal and epididymal white adipose, with low levels of Gpr84 protein also found in the heart (Fig. 1 C). Gpr84 protein was observed at high levels in bone marrow, with a small amount also in lymph node. Although we detected Gpr84 mRNA in the pancreas, we could not detect Gpr84 protein in this tissue. To validate the specificity of the Gpr84 antibody, we overexpressed and knocked down Gpr84 in mouse tibialis anterior muscle using gene electrotransfer and observed increased and decreased expression, respectively (48) (Fig. 1 D).
Figure 1.
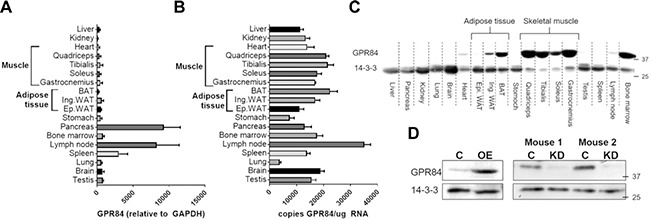
A, B) Tissue characterization of Gpr84 in mice. Relative (A) and absolute (B) quantification of Gpr84 mRNA expression. C) Tissue distribution of Gpr84 at the protein level. D) Specificity of the Gpr84 antibody was determined through overexpression (OE) or knockdown (KD) of Gpr84 in tibialis anterior muscle using in vivo electrotransfer. Shown are means ± sem, n =4 mice/group and assessment.
Body composition and inflammatory markers in Gpr84 KO mice
Given the very high expression of Gpr84 in skeletal muscle and our previous work indicating a potent effect of MCFA in this tissue (10, 14), we generated Gpr84 KO mice to assess the importance of Gpr84 in mediating the metabolic effects of MCFA. Deletion of Gpr84 was confirmed in quadriceps muscle by real‐time quantitative PCR (Fig. 2 A) and by immunoblotting analysis in quadriceps and heart (~90% decrease in Gpr84 protein, Fig. 2 B). Gpr84 KO and WT littermates were fed a standard chow diet or a high‐fat diet enriched in MCFA. Mice fed the MCFA diet exhibited a significant increase in body weight (Fig. 2 C), whole‐body fat mass (Fig. 2 D), and energy expenditure (Fig. 2 E) relative to those receiving control diet, with no significant differences observed between genotypes. Caloric intake was not different between genotypes but increased by 25% in MCFA‐fed mice (chow WT 10.8 ± 0.5, chow KO 9.6 ± 0.2, MCFA WT 12.8 ± 0.3, MCFA KO 13.1 ± 0.6 kcal/d per mouse; n = 6‐11 per group; assessed over a 4‐wk period), which is consistent with the significant increase in body weight and fat deposition in MCFA‐fed mice. The MCFA diet reduced the RER to a similar extent in both WT and KO mice, consistent with an increase in fat oxidation (Fig. 2 F). Liver and heart weight was unaffected by diet and genotype, whereas in line with the whole‐body adiposity data, the mass of the epididymal, inguinal, or BAT depots were increased in the MCFA‐fed groups but with no genotype effect (Table 1). Given the previous link between Gpr84 and the immune system, we also assessed inflammatory markers in quadriceps muscle, adipose tissue, and liver but found no differences in mice lacking Gpr84 on either diet (Supplemental Fig. S1B, C, E).
Figure 2.
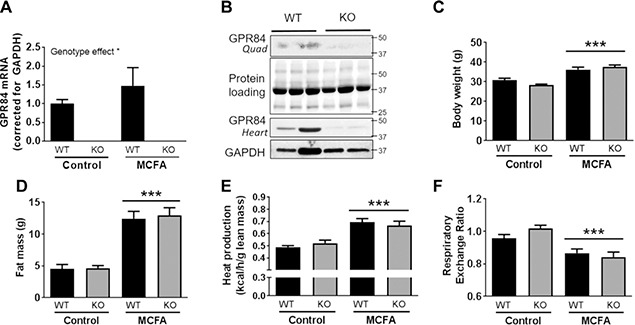
Phenotypic characterization of Gpr84 KO mice and their WT littermates, fed either chow diet (control) or an MCFA‐enriched high‐fat diet for 8 wk. Gpr84 mRNA (A) and protein levels (B) in quadriceps muscle of WT and KO mice, body weight (C), fat mass as determined by EchoMRI (D), heat production as a measure of whole‐body energy expenditure (E), and RER (F). Shown are means ± sem, n = 6‐12/group. Statistical differences were determined by 2‐way ANOVA followed by Bonferroni post hoc test.
Table 1.
Plasma analysis and tissue weights in chow‐ and MCFA‐fed Gpr84 KO and WT mice
| Control | MCFA | |||
|---|---|---|---|---|
| Variable | WT | KO | WT | KO |
| Blood glucose (mM) | 9.6 ± 0.2 | 9.6 ± 0.4 | 11 ± 0.5 | 10.9 ± 0.5 |
| Plasma insulin (ng/ml) | 0.67 ± 0.13 | 0.62 ± 0.08 | 2.07 ± 0.38 | 1.36 ± 0.17 |
| Liver (g) | 1.53 ± 0.07 | 1.43 ± 0.06 | 1.44 ± 0.06 | 1.58 ± 0.12 |
| Heart (mg) | 129.4 ± 4.7 | 123.9 ± 2.0 | 126.8 ± 4.5 | 126.5 ± 3.6 |
| Epi. WAT (g) | 0.63 ± 0.15 | 0.50 ± 0.06 | 1.62 ± 0.14 | 1.71 ± 0.16 |
| Ing. WAT (g) | 0.39 ± 0.05 | 0.36 ± 0.02 | 1.07 ± 0.09 | 1.25 ± 0.13 |
| BAT (mg) | 118.0 ± 13.7 | 93.1 ± 8.6 | 171.6 ± 14.4 | 185.4 ± 16.1 |
Blood glucose and plasma insulin were determined following not being fed for 4 h. Shown are means ± sem, with n = 9‐13/group. Epi. WAT, epididymal white adipose tissue; Ing.WAT, inguinal white adipose tissue.
Glucose metabolism in Gpr84 KO mice
MCFA‐enriched diets do not induce the same degree of glucose intolerance when compared to mice fed isocaloric diets enriched with LCFAs (10, 14) and to determine if Gpr84 is involved in this effect, mice were subjected to an intraperitoneal glucose tolerance test (GTT). Interestingly, MCFA‐fed KO mice exhibited a significant impairment in glucose clearance [incremental area under the curve (iAUC) 641.5 ± 76.7] when compared to chow WT (iAUC 429.4 ± 53.1) or chow KO mice (iAUC 435.4 ± 27.7). In contrast, glucose tolerance in MCFA‐fed WT mice (iAUC 514.3 ± 55.4) was not significantly different to the 2 chow‐fed groups (Fig. 3 A), suggesting that Gpr84 might play a role in preserving glucose tolerance on an MCFA‐enriched diet. There was no difference in fasting glucose between genotypes on the respective diets (Table 1), but there was attenuated hyperinsulinemia (fasting and after glucose injection) in the MCFA‐fed KO mice compared to MCFA WT mice (Fig. 3 B and Table 1). These differences were suggestive of an effect of Gpr84 on both basal and dynamic insulin levels, which could be mediated either through direct effects on insulin secretion or through peripheral effects on insulin clearance and sensitivity. To determine if Gpr84 was important in directly regulating insulin secretion, pancreatic islets were isolated from chow‐fed WT and KO mice and incubated for 48 h in either control or lauric acid (C12:0)‐enriched medium, followed by determination of basal and GSIS. Pretreatment with lauric acid led to an augmentation of the high glucose response in WT islets, with this effect lost in KO islets (Fig. 3 C). These results suggest that MCFAs sensitize islets to subsequent glucose stimulation, and this is dependent on Gpr84. We did not observe any differences in islet insulin content between genotypes or after exposure to laurate (Fig. 3 D). This lack of difference in islet insulin content between WT and KO mice was further confirmed by insulin staining in pancreatic sections from chow‐ and MCFA‐fed WT and GPR84 KO mice (Fig. 3 E, F).
Figure 3.
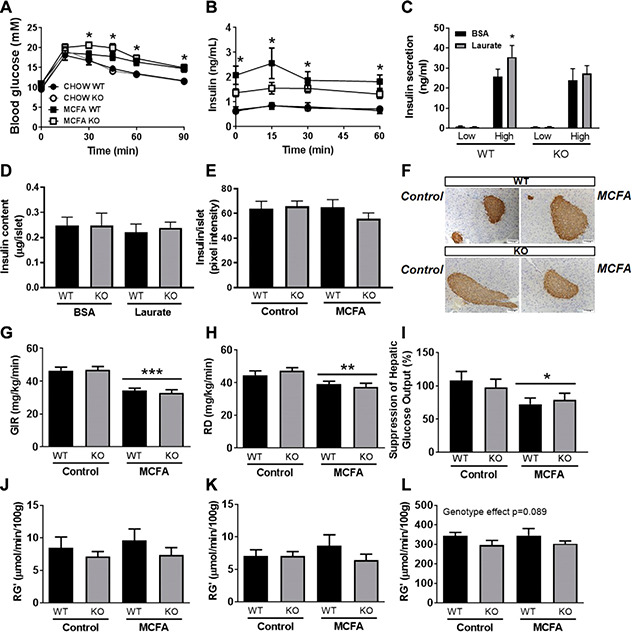
A‐D) Glucose metabolism in Gpr84 KO mice and their WT littermates, fed either a chow diet (control) or an MCFA‐enriched high‐fat diet for 8 wk. Glucose excursion during an ip.GTT (A), insulin levels during the GTT (B), GSIS (C), and insulin content of islets isolated from Gpr84 KO and WT mice, and incubated in either control or lauric acid‐enriched medium (D). E, F) Relative islet insulin content based on insulin staining and representative pancreatic images from chow and MCFA‐fed WT and Gpr84 KO mice. G‐L) Hyperinsulinemic euglycemic clamp data: GIR (G), glucose disposal rate (RD) (H), suppression of hepatic glucose output (I), and peripheral glucose uptake in quadriceps muscle (J), gastrocnemius muscle (K), and heart (L). Shown are means ± sem, n = 6‐12/group. Statistical differences were determined by 2‐way ANOVA followed by Bonferroni post hoc test. A) Asterisks show statistical difference between MCFA KO and CHOW WT as well as CHOW KO at respective time points. B) Asterisks show statistical difference between MCFA WT and CHOW WT.
Insulin sensitivity in Gpr84 KO mice: hyperinsulinemic‐euglycaemic clamps
Given the documented effect for MCFA diets to preserve insulin sensitivity in muscle (10, 14), we next assessed if deletion of Gpr84 affected peripheral insulin action, using hyperinsulinemic‐euglycaemic clamps. Under insulin‐stimulated conditions, the glucose infusion rate (GIR) and glucose disposal rate were significantly reduced in MCFA‐fed mice compared to chow‐fed mice, pointing to whole‐body insulin resistance; however, there was no difference in GIR or glucose disposal rate between genotypes (Fig. 3 G, H). In addition, we observed a reduction in the capacity of MCFA‐fed mice to suppress hepatic glucose output (Fig. 3 I) but no differences between genotypes. The MCFA diet did not cause skeletal muscle or heart insulin resistance (i.e., there was no difference in Rg' between chow and MCFA‐fed mice in any of the 3 tissues), but Gpr84 KO mice showed a mild but nonsignificant impairment in glucose uptake (Rg') into quadriceps muscle (Fig. 3 J), gastrocnemius muscle (Fig. 3 K), and heart (Fig. 3 L) irrespective of diet.
Skeletal muscle lipid composition
Differences in ectopic lipid accumulation have been associated with maintained muscle insulin sensitivity in MCFA‐fed mice (10, 14). To determine if Gpr84 was important in regulating muscle lipid metabolism, we next carried out full lipidomics profiling in quadriceps muscle of chow and MCFA‐fed WT and KO mice. In contrast to our previous findings (10, 14), mice fed the MCFA diet exhibited a significant 3‐ to 6‐fold increase in muscle TAG content (Fig. 4 A‐C). Although TAG content and species were almost identical between WT and Gpr84 KO mice when fed the MCFA‐enriched diet (Fig. 4 C), KO mice on a standard chow diet showed a significant increase in various TAG species(Fig. 4 A) and a 2‐fold increase in total TAG content (Fig. 4 B). Of note, as the MCFA diet is enriched in FAs with chain lengths C8‐C14, the distribution of TAG species in muscle of MCFA‐fed mice is shifted toward the left (i.e., toward an increased content of MCFA‐containing TAG species). There was no significant difference between diets or genotypes in total diacylglycerol (DAG) content (Fig. 4 D), whereas Gpr84 deletion had little impact on the abundance of specific DAG species (Fig. 4E, F). Similarly, there was no major difference in total ceramide content (Fig. 4 G) or ceramide species (Fig. 4 H, I) between genotypes, with only C16:0, C22:0, and C23: 0 being mildly increased in chow‐fed Gpr84 KO mice.
Figure 4.
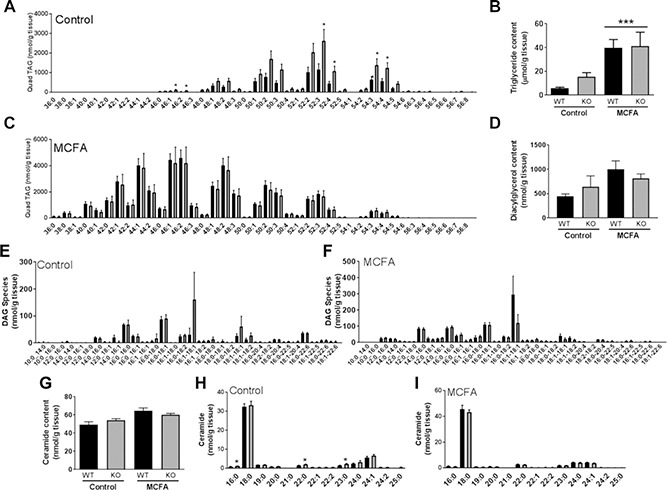
A— C) Lipidomics analysis of quadriceps muscle of Gpr84 KO mice and their WT littermates, fed either a chow diet (control) or an MCFA‐enriched high‐fat diet for 8 wk. Total TAG content (B) as well as the respective TAG species in control (A) and MCFA‐fed mice (C). D‐F) Total DAG content (D) as well as the respective DAG species in control (E) and MCFA‐fed mice (F). G—I) Total ceramide content (G) as well as the respective ceramide species in control (H) and MCFA‐fed mice (I). Shown are means ± sem, with n = 5/group. Statistical differences were determined by 2‐way ANOVA followed by Bonferroni post hoc test (for total lipid content), or by Student's t test comparing specific lipid species between WT and KO mice.
Mitochondrial metabolism in skeletal muscle of Gpr84 KO mice
An MCFA‐enriched diet increases mitochondrial content in skeletal muscle (10) as well as the intrinsic respiratory capacity of mitochondria (14); therefore, we investigated if Gpr84 was involved in mediating differences in mitochondrial respiration and mitochondrial oxidative stress, as well as mitochondrial content and oxidative capacity. Oxygen consumption (states II, III, and IV) was measured in isolated muscle mitochondria using succinate as the substrate. State 3 and 4 respiration was significantly reduced in Gpr84 KO muscle mitochondria in both chow‐and MCFA‐fed mice (Fig. 5 A), pointing toward a defect in the intrinsic mitochondrial capacity of KO mice. Changes in mitochondrial substrate flux are commonly accompanied by alterations in mitochondrial reactive oxygen species (ROS) production, with Gpr84 KO mice displaying elevated H2O2 production in the presence of succinate alone (ROS production by complex I and III) but not with the addition of rotenone (ROS production by complex III only) (Fig. 5 B). These findings indicate that Gpr84 deletion promotes ROS production at complex I of the mitochondrial electron transport chain (ETC). Consistent with the findings in isolated muscle mitochondria, markers of oxidative stress (measured as TBARS and LOOH content in tissue homogenates) were increased in Gpr84 KO mice, most prominently when fed the MCFA‐enriched diet (Fig. 5 C, D), suggesting that muscle of KO mice is exposed to more oxidative stress. Although there was a substantial impairment in the intrinsic oxidative capacity of mitochondria (i.e., per unit mitochondria) from Gpr84 KO mice, respiration measured in permeabilized muscle fibers showed the opposite phenotype: a significant increase in oxidative capacity in fibers isolated from KO mice fed the MCFA diet in the presence of the substrates glutamate and glutamate and ADP but not succinate and ADP (Fig. 5 E).
Figure 5.
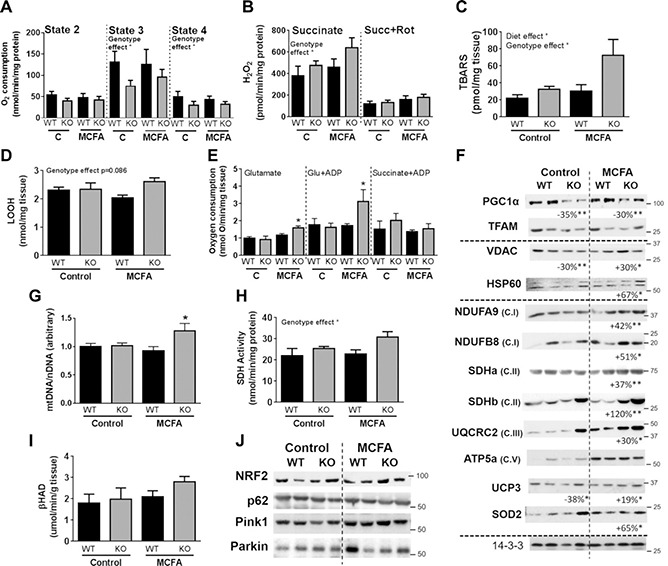
Skeletal muscle metabolic characterization of Gpr84 KO mice and their WT littermates, fed either a chow diet (control) or an MCFA‐enriched high‐fat diet for 8 wk. A‐D) Succinate‐driven state 2, 3, and 4 respiration in isolated mitochondria (A), hydrogen peroxide generation in isolated mitochondria in the presence of succinate or succinate and rotenone (B), as well as determination of TBARS (C) and LOOH content in whole muscle homogenates (D). E) Respiration of intact muscle fibers in the presence of glutamate, glutamate and ADP, and succinate and ADP. F) Immunoblotting analysis of various markers of mitochondrial capacity. Representative immunoblots show n = 2/group; however, indicated percentage changes and statistical significance refer to n = 8/group. G—I) Mitochondrial DNA/nuclear DNA ratio as an indicator of mitochondrial content (G), SDH (H), and β‐HAD activity (I) in muscle lysates. J) Immunoblotting analysis of autophagy regulators/markers in whole quad lysates. Shown are means ± sem, n = 7‐10 mice/assessment/group. Statistical differences were determined by 2‐way ANOVA followed by Bonferroni post hoc test; or by Student's t test for the immunoblotting analysis.
To investigate the disconnect between a reduction in mitochondrial respiration (per unit of mitochondria) but an increase in mitochondrial respiration (per gram of tissue), we investigated changes in the protein content of regulators of mitochondrial biogenesis (peroxisome proliferator‐activated receptor γ coactivator 1α and transcription factor A, mitochondrial), markers of mitochondrial content [voltage‐dependent anion channel (VDAC) and heat shock protein 60 (HSP60)] and a large set of protein subunits of various complexes of the ETC NADH dehydrogenase (ubiquinone) (NDUF)1α subunit 9 and NDUFβ subunit 8 (complex I), succinate dehydrogenase (SDH) a and SDHb (complex II), ubiquinol‐cytochrome c reductase core protein 2 (complex III), and ATP5a (complex V). Gpr84 KO muscle exhibited a significant reduction in PGC1α protein on both diets without any changes in the downstream mitochondrial transcription factor TFAM (Fig. 5 F). Interestingly, however, VDAC (i.e., mitochondrial porin), which is commonly used as a marker of total mitochondrial content, as well as all ETC complex subunits, showed a differential dietary response. Under standard chow conditions, there was no effect of Gpr84 deletion on those markers of mitochondrial capacity and content; however, upon exposure to dietary MCFA (which would normally activate Gpr84), Gpr84 KO mice exhibited a substantial up‐regulation of essentially all mitochondrial proteins examined (Fig. 5 F and Supplemental Figs. S2 and S3), pointing toward a substantial increase in mitochondrial content in skeletal muscle. To further investigate the potential increase in mitochondrial content, we measured 1) the mitochondrial to nuclear DNA ratio, which was also significantly increased in MCFA‐fed Gpr84 KO mice (Fig. 5G); 2) SDH (i.e., ETC complex II) activity, which was also increased by 36% in MCFA‐fed KO mice (Fig. 5 H); and 3) β‐hydroxy‐acyl‐dehydrogenase (β‐HAD) activity as a measure of mitochondrial β‐oxidation. β‐HAD activity (Fig. 5 I) did not differ between genotypes. To further assess if β‐oxidation capacity was affected by diet or genotype, we measured a range of acylcarnitine species (C8:0‐C16:0) in quadriceps muscle. Although acylcarnitine species C10: 0, C12:0, and C14:0 were increased in MCFA‐fed mice, confirmative of increased dietary supply of these MCFAs, there were no differences in acylcarnitine species between genotypes (Supplemental Fig. S1E). Collectively, these findings suggest diet‐dependent changes in mitochondrial content and function in skeletal muscle of Gpr84 KO mice. Of note, this effect was specific to skeletal muscle because we investigated mitochondrial metabolism in heart (another tissue expressing Gpr84) and observed no major effect of Gpr84 deletion on mitochondrial respiration (Supplemental Fig. S4A), mitochondrial ROS production (Supplemental Fig. S4B), Glutathione peroxidase activity (Supplemental Fig. S4C), or SDH activity (Supplemental Fig. S4D).
The density of mitochondria in a tissue is determined by the balance between synthesis (i.e., biogenesis) and degradation. A potential mechanism for the disconnect between mitochondrial content and mitochondrial intrinsic capacity in muscle (i.e., respiration per unit of mitochondria) could be changes in autophagic removal and degradation of damaged mitochondria. Examination of the protein content for mitophagic mediators (p62, Parkin, and Pink‐1), as well as nuclear factor erythroid 2‐related factor 2 (Nrf2) [a transcriptional regulator of mitophagy (49)] revealed no significant differences between genotypes or in response to diet (Fig. 5 J and Supplemental Figs. S2 and S3).
To explore the potential underlying basis for the mitochondrial differences further we performed transcriptomics. Principal components analysis of the entire transcriptome did not reveal an obvious clustering of the different groups (Supplemental Fig. S5), so we focused our examination on the mRNA expression of genes encoding a broad suite of autophagy/mitophagy regulators (Fig. 6 A), ETC proteins (Fig. 6 B), respiratory complex assembly factors (Fig. 6 C), and mitochondrial import/export proteins (Fig. 6 D) (please refer to the Supplemental Data S1 for a full list of proteins in each group). Although there were a number of genes differentially expressed in skeletal muscle due to diet (Supplemental Data S2), hierarchical clustering revealed no discernible pattern between genotypes and diets for the expression of all the mitochondrial genes, indicating that the observed changes in mitochondrial function and content (Fig. 5) cannot be explained by any obvious coordinated change in expression of genes involved in mitochondrial biogenesis, assembly, or mitophagy (Fig. 6).
Figure 6.
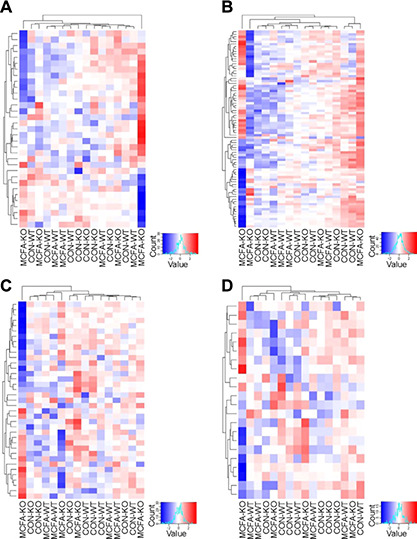
RNA‐Seq transcriptomic analysis of quadriceps muscle (n = 4/group). Shown is hierarchical clustering of genes encoding a broad suite of autophagy/mitophagy regulators (A), ETC proteins (B), respiratory complex assembly factors (C), and mitochondrial import/export proteins (D) for Gpr84 KO mice and their WT littermates, fed either a chow diet (con) or an MCFA‐enriched high‐fat diet for 8 wk.
DISCUSSION
This is the first study to show that the MCFA receptor Gpr84 is highly abundant in skeletal muscle and that deletion of Gpr84 has a major impact on mitochondrial metabolism. Our data reveal that Gpr84 plays a critical role in the control of mitochondrial integrity, and that loss of Gpr84 results in the accumulation of functionally compromised mitochondria. The accumulation of defective mitochondria in muscle is accompanied by an elevation in oxidative stress, but this has limited direct impact on insulin action in this tissue, with the small diet‐dependent glucose intolerance phenotype observed in Gpr84 KO mice potentially related to differences in insulin secretion (or clearance).
Gpr84 was first described and cloned in 2001 (50, 51) and was provisionally deorphanized in 2006 (24). This later study not only showed that Gpr84 was activated by MCFAs but also postulated that the expression in humans and mice is limited to tissues of the immune system (thymus, lymph node, spleen, bone marrow) (24). This concept, that the function of Gpr84 is primarily immune related, has now largely become the dogma in the field. Indeed there is some evidence to indicate that Gpr84 has a proinflammatory role and is involved in activation of TNFα (52), IL1β, IL6, and TNFα in macrophages (53), as well as amplification of LPS‐stimulated production of IL‐8 from leukocytes and TNFα from macrophages (54). Our findings provide strong evidence for important roles of Gpr84 beyond the immune system. Using a Gpr84‐specific antibody (specificity confirmed through overexpression and knockdown of Gpr84 in muscle), we showed that in addition to expression in some immune tissues, the organ with the greatest expression and protein content of Gpr84 is skeletal muscle. Gpr84 was also expressed in BAT, white adipose tissue, and the heart. Global deletion of Gpr84 had no impact on inflammation or cellular stress responses in liver, adipose tissue, or skeletal muscle, suggesting that Gpr84 might not be a proinflammatory receptor at these sites or that it was not activated by an appropriate ligand under the current study conditions. It is worth noting that a recent study reported Gpr84 did not promote proinflammatory responses in mouse primary cultured microglia (55).
Because MCFAs have potent effects on mitochondrial metabolism in skeletal muscle (10, 14) and Gpr84 is highly abundant in this tissue, we hypothesized that Gpr84 might be a molecular mediator of these effects. Although we initially anticipated that Gpr84 deletion would attenuate the MCFA‐induced increase in mitochondrial content/capacity in muscle, we observed a far more complex role for Gpr84 in the regulation of muscle mitochondrial metabolism. Under conditions of enhanced MCFA availability, the absence of Gpr84 appeared to influence mitochondrial turnover, resulting in a significant increase in the abundance of dysfunctional mitochondria. However, these marked effects could not be explained by obvious changes in mRNA or protein levels for canonical pathways of mitochondrial biogenesis or mitophagy. The number of upstream regulators and effector molecules that are involved in the synthesis and degradation of mitochondria continues to grow (56–58), and our findings suggest the existence of an alternate pathway of Gpr84‐mediated mitochondrial regulation that is only engaged in the presence of MCFAs.
There were very similar levels of lipids across multiple classes in muscle of MCFA‐fed WT and Gpr84 KO mice, indicating that the differences in mitochondrial metabolism between genotypes were unlikely due to a major change in the flux of MCFA into this tissue. It is possible that differential generation of breakdown products of MCFA (e.g., short‐chain FA) between genotypes may partially contribute to changes in mitochondrial metabolism given their documented role in regulating muscle mitochondria (59). More likely was that changes in Gpr84‐associated intracellular signaling pathways may partly explain the distinct mitochondrial phenotypes. Gpr84 signals through a Gαi/o‐coupled pathway (24), with recent work suggesting a complex interplay of ligand binding and regulation at the level of the receptor (60). A typical consequence of Gαi signaling is inhibition of adenylate cyclase, decreased cAMP levels, and inhibition of PKA (61). This is of relevance as PKA is recruited to the outer mitochondrial membrane, where it regulates mitochondrial dynamics, structure, and mitochondrial respiration (62). Importantly, mitochondria‐localized PKA is involved in mitochondrial turnover by phosphorylating outer mitochondrial membrane‐localized dynamin‐related protein 1 to subsequently inhibit mitochondrial fission (63, 64) and phosphorylating the proapoptotic protein BCL2‐associated agonist of cell death to promote survival (65). In addition, activation of Gi signaling activates the MAPK/ERK signaling pathway (66), which has been implicated in both the regulation of mitochondrial dynamics and mitochondria‐related apoptosis (67–70). The absence of Gpr84 in the presence of excess ligand (i.e., MCFA‐enriched diet) could potentially lead to altered activity in either of these pathways, which may underpin the changes in mitochondrial turnover. Availability of potent, selective Gpr84 ligands would help to specify the precise role of Gpr84 in these effects.
Another metabolic alteration in MCFA‐fed Gpr84 KO mice was a mild impairment in glucose tolerance, which contrasts with findings from another recent study, where glucose tolerance was similar in WT and Gpr84 KO mice (71). This change in glucose tolerance was associated with a reduction in circulating insulin levels, with clamp studies revealing only limited effect of Gpr84 deletion on insulin‐stimulated glucose uptake in muscle, despite the profound alterations in mitochondrial content/function. It is important to point out that the marked decrease in intrinsic mitochondrial function was somewhat masked by the substantial increase in mitochondrial number, and as such the bioenergetic capacity at the level of the whole muscle was essentially retained. Of interest was the fact that muscle insulin action was largely unperturbed in Gpr84 KO mice, despite increases in both mitochondrial ROS production and markers of oxidative damage. The reason for the dissociation between oxidative stress and insulin resistance in Gpr84 KO muscle requires further investigation, but it is worth noting that the relationship between ROS and insulin resistance is by no means simple (72).
The decreased plasma insulin in MCFA‐fed KO mice during the GTT suggested that Gpr84 might influence insulin secretion directly. In isolated pancreatic islets, we found that MCFA pretreatment led to slight augmentation of GSIS that was wholly dependent on the presence of Gpr84. Differences in insulin secretion were not due to differences in islet insulin content, which was not affected by laurate treatment, MCFA feeding, or genotype. The augmentation in insulin secretion was surprising as Gi‐coupled receptors are usually associated with inhibitory GSIS effects in β cells (73). However, in this study, pancreatic islets were preincubated with MCFAs, and MCFAs were not present during the acute GSIS experiments, potentially suggesting that the 48 h pretreatment could have induced gene expression changes independent of the acute Gi‐coupled regulation of insulin secretion. Furthermore, the effect of MCFA contrasts with that of β cells chronically exposed to long‐chain saturated or unsaturated FAs, whereby GSIS is inhibited (74). This chronic inhibitory response, which depends on both FA metabolism and stimulation of GPCRs such as GPR40, is not to be confused with the acute, stimulatory effects of LCFAs on insulin secretion (75).
In summary, our study has revealed novel roles for Gpr84 in both the regulation of mitochondrial metabolism in muscle and as a mediator of MCFA‐induced insulin secretion. Increased understanding of the pharmacology of Gpr84 (60), along with further development of agents specifically targeting this receptor (76) will help to define how the pleiotropic actions of Gpr84 are regulated under both physiologic and pathologic conditions.
AUTHOR CONTRIBUTIONS
M. K. Montgomery and N. Turner designed research; M. K. Montgomery, B. Osborne, A. E. Brandon, L. O'Reilly, C. E. Fiveash, S. H.J. Brown, B. P. Wilkins, A. Samsudeen, J. Yu, B. Devanapalli, A. Hertzog, A. A. Tolun, T. Kavanagh, N. J. Smith, and N. Turner performed experiments; A. A. Cooper, T. W. Mitchell, T. J. Biden, N. J. Smith, and G. J. Cooney contributed reagents and analytical tools; M. K. Montgomery, N. Turner, B. Osborne, A. E. Brandon, L. O'Reilly, C. E. Fiveash, S. H.J. Brown, B. P. Wilkins, and T. Kavanagh analyzed data; and M. K. Montgomery and N. Turner wrote the manuscript.
Supporting information
Supplemental Figure 1
Supplemental Figure 2
Supplemental Figure 3
Supplemental Figure 4
Supplemental Figure 5
Supplemental Table 1
Supplemental Table 2
ACKNOWLEDGMENTS
The authors thank Prof. Bob Graham (Victor Chang Cardiac Research Institute) and Dr. Michael Lazarou (Monash University, Melbourne, VIC, Australia) for generous advice on aspects of this study. This work was supported by funding from the National Health and Medical Research Council of Australia, the Australian Research Council, and the University of Wollongong. M.K.M. was supported by a National Health and Medical Research Council (NHMRC) Career Development Fellowship. Gpr84tm1(KOMP)Vlcg embryonic stem cells used for this research project were generated by the Trans‐U.S. National Institutes of Health (NIH) Knockout Mouse Project and obtained from the Knockout Mouse Project Repository (www.komp.org). NIH National Human Genome Research Institute (NHGRI) Grant U01HG004085 to Velocigene at Regeneron, and the CSD Consortium (U01HG004080) funded the generation of gene‐targeted embryonic stem cells for 8500 genes in the Knockout Mouse Project Program and archived and distributed by the Knockout Mouse Project Repository at the University of California‐Davis (Davis, CA, USA), and Children's Hospital Oakland Research Institute (CHORI; U42RR024244). Animal work was made possible thanks to kind staff in the University of New South Wales Biological Resources Centre and the Garvan Institute Biological Testing Facility. The authors declare no conflicts of interest.
Montgomery, M. K , Osborne, B. , Brandon, A. E , O' Reilly, L. , Fiveash, C. E , Brown, S. H. J. , Wilkins, B. P , Samsudeen, A. , Yu, J. , Devanapalli, B. , Hertzog, A. , Tolun, A. A , Kavanagh, T. , Cooper, A. A , Mitchell, T. W , Biden, T. J , Smith, N. J , Cooney, G. J , Turner, N. Regulation of mitochondrial metabolism in murine skeletal muscle by the medium‐chain fatty acid receptor Gpr84. FASEB J. 33, 12264–12276 (2019). www.fasebj.org
This article includes supplemental data. Please visit http://www.fasebj.org to obtain this information.
REFERENCES
- 1. Cornier, M. A. , Dabelea, D. , Hernandez, T. L. , Lindstrom, R. C. , Steig, A. J. , Stob, N. R. , Van Pelt, R. E. , Wang, H. , and Eckel, R. H. (2008) The metabolic syndrome. Endocr. Rev. 29, 777–822 [DOI] [PMC free article] [PubMed] [Google Scholar]
- 2. Kraegen, E. W. , and Cooney, G. J. (2008) Free fatty acids and skeletal muscle insulin resistance. Curr. Opin. Lipidol. 19, 235–241 [DOI] [PubMed] [Google Scholar]
- 3. Savage, D. B. , Petersen, K. F. , and Shulman, G. I. (2007) Disordered lipid metabolism and the pathogenesis of insulin resistance. Physiol. Rev. 87, 507–520 [DOI] [PMC free article] [PubMed] [Google Scholar]
- 4. Swanson, D. , Block, R. , and Mousa, S. A. (2012) Omega‐3 fatty acids EPA and DHA health benefits throughout life. Adv. Nutr. 3, 1–7 [DOI] [PMC free article] [PubMed] [Google Scholar]
- 5. Elagizi, A. , Lavie, C. J. , Marshall, K. , Di Nicolantonio, J. J. , O'Keefe, J. H. , and Milani, R. V. (2018) Omega‐3 polyunsaturated fatty acids and cardiovascular health: a comprehensive review. Prog. Cardiovasc. Dis. 61, 76–85 [DOI] [PubMed] [Google Scholar]
- 6. Baba, N. , Bracco, E. F. , and Hashim, S. A. (1982) Enhanced thermogenesis and diminished deposition of fat in response to overfeeding with diet containing medium chain triglyceride. Am. J. Clin. Nutr. 35, 678–682 [DOI] [PubMed] [Google Scholar]
- 7. Han, J. , Hamilton, J. A. , Kirkland, J. L. , Corkey, B. E. , and Guo, W. (2003) Medium‐chain oil reduces fat mass and down‐regulates expression of adipogenic genes in rats. Obes. Res. 11, 734–744 [DOI] [PubMed] [Google Scholar]
- 8. St‐Onge, M. P. , and Bosarge, A. (2008) Weight‐loss diet that includes consumption of medium‐chain triacylglycerol oil leads to a greater rate of weight and fat mass loss than does olive oil. Am. J. Clin. Nutr. 87, 621–626 [DOI] [PMC free article] [PubMed] [Google Scholar]
- 9. St‐Onge, M. P. , Ross, R. , Parsons, W. D. , and Jones, P. J. H. (2003) Medium‐chain triglycerides increase energy expenditure and decrease adiposity in overweight men. Obes. Res. 11, 395–402 [DOI] [PubMed] [Google Scholar]
- 10. Turner, N. , Hariharan, K. , Tid Ang, J. , Frangioudakis, G. , Beale, S. M. , Wright, L. E. , Zeng, X. Y. , Leslie, S. J. , Li, J. Y. , Kraegen, E. W. , Cooney, G. J. , and Ye, J. M. (2009) Enhancement of muscle mitochondrial oxidative capacity and alterations in insulin action are lipid species dependent: potent tissue‐specific effects of medium‐chain fatty acids. Diabetes 58, 2547–2554; erratum: 59, 1283 [DOI] [PMC free article] [PubMed] [Google Scholar]
- 11. Papamandjaris, A. A. , MacDougall, D. E. , and Jones, P. J. (1998) Medium chain fatty acid metabolism and energy expenditure: obesity treatment implications. Life Sci. 62, 1203–1215 [DOI] [PubMed] [Google Scholar]
- 12. Han, J. R. , Deng, B. , Sun, J. , Chen, C. G. , Corkey, B. E. , Kirkland, J. L. , Ma, J. , and Guo, W. (2007) Effects of dietary medium‐chain triglyceride on weight loss and insulin sensitivity in a group of moderately overweight free‐living type 2 diabetic Chinese subjects. Metabolism 56, 985–991 [DOI] [PubMed] [Google Scholar]
- 13. Wein, S. , Woffram, S. , Schrezenmeir, J. , Gasperiková, D. , Klimes, I. , and Seböková, E. (2009) Medium‐chain fatty acids ameliorate insulin resistance caused by high‐fat diets in rats. Diabetes Metab. Res. Rev. 25, 185–194 [DOI] [PubMed] [Google Scholar]
- 14. Montgomery, M. K. , Osborne, B. , Brown, S. H. J. , Small, L. , Mitchell, T. W. , Cooney, G. J. , and Turner, N. (2013) Contrasting metabolic effects of medium‐ versus long‐chain fatty acids in skeletal muscle. J. Lipid Res. 54, 3322–3333 [DOI] [PMC free article] [PubMed] [Google Scholar]
- 15. Jump, D. B. , and Clarke, S. D. (1999) Regulation of gene expression by dietary fat. Annu. Rev. Nutr. 19, 63–90 [DOI] [PubMed] [Google Scholar]
- 16. Oh, D. Y. , and Lagakos, W. S. (2011) The role of G‐protein‐coupled receptors in mediating the effect of fatty acids on inflammation and insulin sensitivity. Curr. Opin. Clin. Nutr. Metab. Care 14, 322–327 [DOI] [PubMed] [Google Scholar]
- 17. Talukdar, S. , Olefsky, J. M. , and Osborn, O. (2011) Targeting GPR120 and other fatty acid‐sensing GPCRs ameliorates insulin resistance and inflammatory diseases. Trends Pharmacol. Sci. 32, 543–550 [DOI] [PMC free article] [PubMed] [Google Scholar]
- 18. Itoh, Y. , Kawamata, Y. , Harada, M. , Kobayashi, M. , Fujii, R. , Fukusumi, S. , Ogi, K. , Hosoya, M. , Tanaka, Y. , Uejima, H. , Tanaka, H. , Maruyama, M. , Satoh, R. , Okubo, S. , Kizawa, H. , Komatsu, H. , Matsumura, F. , Noguchi, Y. , Shinohara, T. , Hinuma, S. , Fujisawa, Y. , and Fujino, M. (2003) Free fatty acids regulate insulin secretion from pancreatic beta cells through GPR40. Nature 422, 173–176 [DOI] [PubMed] [Google Scholar]
- 19. Maslowski, K. M. , Vieira, A. T. , Ng, A. , Kranich, J. , Sierro, F. , Yu, D. , Schilter, H. C. , Rolph, M. S. , Mackay, F. , Artis, D. , Xavier, R. J. , Teixeira, M. M. , and Mackay, C. R. (2009) Regulation of inflammatory responses by gut microbiota and chemoattractant receptor GPR43. Nature 461, 1282–1286 [DOI] [PMC free article] [PubMed] [Google Scholar]
- 20. Tolhurst, G. , Heffron, H. , Lam, Y. S. , Parker, H. E. , Habib, A. M. , Diakogiannaki, E. , Cameron, J. , Grosse, J. , Reimann, F. , and Gribble, F. M. (2012) Short‐chain fatty acids stimulate glucagon‐like peptide‐1 secretion via the G‐protein‐coupled receptor FFAR2. Diabetes 61, 364–371 [DOI] [PMC free article] [PubMed] [Google Scholar]
- 21. Lauffer, L. M. , Iakoubov, R. , and Brubaker, P. L. (2009) GPR119 is essential for oleoylethanolamide‐induced glucagon‐like peptide‐1 secretion from the intestinal enteroendocrine L‐cell. Diabetes 58, 1058–1066 [DOI] [PMC free article] [PubMed] [Google Scholar]
- 22. Oh, D. Y. , Talukdar, S. , Bae, E. J. , Imamura, T. , Morinaga, H. , Fan, W. , Li, P. , Lu, W. J. , Watkins, S. M. , and Olefsky, J. M. (2010) GPR120 is an omega‐3 fatty acid receptor mediating potent anti‐inflammatory and insulin‐sensitizing effects. Cell 142, 687–698 [DOI] [PMC free article] [PubMed] [Google Scholar]
- 23. Stoddart, L. A. , Smith, N. J. , and Milligan, G. (2008) International Union of Pharmacology. LXXI. Free fatty acid receptors FFA1, ‐2, and ‐3: pharmacology and pathophysiological functions. Pharmacol. Rev. 60, 405–417 [DOI] [PubMed] [Google Scholar]
- 24. Wang, J. , Wu, X. , Simonavicius, N. , Tian, H. , and Ling, L. (2006) Medium‐chain fatty acids as ligands for orphan G protein‐coupled receptor GPR84. J. Biol. Chem. 281, 34457–34464 [DOI] [PubMed] [Google Scholar]
- 25. Bouchard, C. , Pagé, J. , Bédard, A. , Tremblay, P. , and Vallières, L. (2007) G protein‐coupled receptor 84, a microglia‐associated protein expressed in neuroinflammatory conditions. Glia 55, 790–800 [DOI] [PubMed] [Google Scholar]
- 26. Venkataraman, C. , and Kuo, F. (2005) The G‐protein coupled receptor, GPR84 regulates IL‐4 production by T lymphocytes in response to CD3 crosslinking. Immunol. Lett. 101, 144–153 [DOI] [PubMed] [Google Scholar]
- 27. Lattin, J. E. , Schroder, K. , Su, A. I. , Walker, J. R. , Zhang, J. , Wiltshire, T. , Saijo, K. , Glass, C. K. , Hume, D. A. , Kellie, S. , and Sweet, M. J. (2008) Expression analysis of G Protein‐Coupled Receptors in mouse macrophages. Immunome Res. 4, 5 [DOI] [PMC free article] [PubMed] [Google Scholar]
- 28. Huang, Q. , Feng, D. , Liu, K. , Wang, P. , Xiao, H. , Wang, Y. , Zhang, S. , and Liu, Z. (2014) A medium‐chain fatty acid receptor Gpr84 in zebrafish: expression pattern and roles in immune regulation. Dev. Comp. Immunol. 45, 252–258 [DOI] [PubMed] [Google Scholar]
- 29. Nagasaki, H. , Kondo, T. , Fuchigami, M. , Hashimoto, H. , Sugimura, Y. , Ozaki, N. , Arima, H. , Ota, A. , Oiso, Y. , and Hamada, Y. (2012) Inflammatory changes in adipose tissue enhance expression of GPR84, a medium‐chain fatty acid receptor: TNFα enhances GPR84 expression in adipocytes. FEBS Lett. 586, 368–372 [DOI] [PubMed] [Google Scholar]
- 30. Cotton, L. M. , Meilak, M. L. , Templeton, T. , Gonzales, J. G. , Nenci, A. , Cooney, M. , Truman, D. , Rodda, F. , Lynas, A. , Viney, E. , Rosenthal, N. , Bianco, D. M. , O'Bryan, M. K. , and Smyth, I. M. (2015) Utilising the resources of the International knockout mouse Consortium: the Australian experience. Mamm. Genome 26, 142–153 [DOI] [PubMed] [Google Scholar]
- 31. Turner, N. , Bruce, C. R. , Beale, S. M. , Hoehn, K. L. , So, T. , Rolph, M. S. , and Cooney, G. J. (2007) Excess lipid availability increases mitochondrial fatty acid oxidative capacity in muscle: evidence against a role for reduced fatty acid oxidation in lipid‐induced insulin resistance in rodents. Diabetes 56, 2085–2092 [DOI] [PubMed] [Google Scholar]
- 32. Holt, L. J. , Brandon, A. E. , Small, L. , Suryana, E. , Preston, E. , Wilks, D. , Mokbel, N. , Coles, C. A. , White, J. D. , Turner, N. , Daly, R. J. , and Cooney, G. J. (2018) Ablation of Grb10 specifically in muscle impacts muscle size and glucose metabolism in mice. Endocrinology 159, 1339–1351 [DOI] [PubMed] [Google Scholar]
- 33. Adiconis, X. , Borges‐Rivera, D. , Satija, R. , De Luca, D. S. , Busby, M. A. , Berlin, A. M. , Sivachenko, A. , Thompson, D. A. , Wysoker, A. , Fennell, T. , Gnirke, A. , Pochet, N. , Regev, A. , and Levin, J. Z. (2013) Comparative analysis of RNA sequencing methods for degraded or low‐input samples. Nat. Methods 10, 623–629; erratum: 11, 210 [DOI] [PMC free article] [PubMed] [Google Scholar]
- 34. Dobin, A. , Davis, C. A. , Schlesinger, F. , Drenkow, J. , Zaleski, C. , Jha, S. , Batut, P. , Chaisson, M. , and Gingeras, T. R. (2013) STAR: ultrafast universal RNA‐seq aligner. Bioinformatics 29, 15–21 [DOI] [PMC free article] [PubMed] [Google Scholar]
- 35. Li, B. , and Dewey, C. N. (2011) RSEM: accurate transcript quantification from RNA‐Seq data with or without a reference genome. BMC Bioinformatics 12, 323 [DOI] [PMC free article] [PubMed] [Google Scholar]
- 36. Robinson, M. D. , McCarthy, D. J. , and Smyth, G. K. (2010) edgeR a Bioconductor package for differential expression analysis of digital gene expression data. Bioinformatics 26, 139–140 [DOI] [PMC free article] [PubMed] [Google Scholar]
- 37. McCarthy, D. J. , Chen, Y. , and Smyth, G. K. (2012) Differential expression analysis of multifactor RNA‐Seq experiments with respect to biological variation. Nucleic Acids Res. 40, 4288–4297 [DOI] [PMC free article] [PubMed] [Google Scholar]
- 38. Cleasby, M. E. , Lau, Q. , Polkinghorne, E. , Patel, S. A. , Leslie, S. J. , Turner, N. , Cooney, G. J. , Xu, A. , and Kraegen, E. W. (2011) The adaptor protein APPL1 increases glycogen accumulation in rat skeletal muscle through activation of the PI3‐kinase signalling pathway. J. Endocrinol. 210, 81–92 [DOI] [PMC free article] [PubMed] [Google Scholar]
- 39. Stöckli, J. , Meoli, C. C. , Hoffman, N. J. , Fazakerley, D. J. , Pant, H. , Cleasby, M. E. , Ma, X. , Kleinert, M. , Brandon, A. E. , Lopez, J. A. , Cooney, G. J. , and James, D. E. (2015) The RabGAP TBC1D1 plays a central role in exercise‐regulated glucose metabolism in skeletal muscle. Diabetes 64, 1914–1922 [DOI] [PubMed] [Google Scholar]
- 40. Montgomery, M. K. , Brown, S. H. J. , Mitchell, T. W. , Coster, A. C. F. , Cooney, G. J. , and Turner, N. (2017) Association of muscle lipidomic profile with high‐fat diet‐induced insulin resistance across five mouse strains. Sci. Rep. 7, 13914 [DOI] [PMC free article] [PubMed] [Google Scholar]
- 41. Trzcionka, M. , Withers, K. W. , Klingenspor, M. , and Jastroch, M. (2008) The effects of fasting and cold exposure on metabolic rate and mitochondrial proton leak in liver and skeletal muscle of an amphibian, the cane toad Bufo marinus. J. Exp. Biol. 211, 1911–1918 [DOI] [PubMed] [Google Scholar]
- 42. Turner, N. , Lim, X. Y. , Toop, H. D. , Osborne, B. , Brandon, A. E. , Taylor, E. N. , Fiveash, C. E. , Govindaraju, H. , Teo, J. D. , McEwen, H. P. , Couttas, T. A. , Butler, S. M. , Das, A. , Kowalski, G. M. , Bruce, C. R. , Hoehn, K. L. , Fath, T. , Schmitz‐Peiffer, C. , Cooney, G. J. , Montgomery, M. K. , Morris, J. C. , and Don, A. S. (2018) A selective inhibitor of ceramide synthase 1 reveals a novel role in fat metabolism. Nat. Commun. 9, 3165 [DOI] [PMC free article] [PubMed] [Google Scholar]
- 43. Montgomery, M. K. , Buttemer, W. A. , and Hulbert, A. J. (2012) Does the oxidative stress theory of aging explain longevity differences in birds? II. Antioxidant systems and oxidative damage. Exp. Gerontol. 47, 211–222 [DOI] [PubMed] [Google Scholar]
- 44. Bou, R. , Codony, R. , Tres, A. , Decker, E. A. , and Guardiola, F. (2008) Determination of hydroperoxides in foods and biological samples by the ferrous oxidation‐xylenol orange method: a review of the factors that influence the method's performance. Anal. Biochem. 377, 1–15 [DOI] [PubMed] [Google Scholar]
- 45. Buege, J. A. , and Aust, S. D. (1978) Microsomal lipid peroxidation. Methods Enzymol. 52, 302–310 [DOI] [PubMed] [Google Scholar]
- 46. Levine, R. L. , Garland, D. , Oliver, C. N. , Amici, A. , Climent, I. , Lenz, A. G. , Ahn, B. W. , Shaltiel, S. , and Stadtman, E. R. (1990) Determination of carbonyl content in oxidatively modified proteins. Methods Enzymol. 186, 464–478 [DOI] [PubMed] [Google Scholar]
- 47. Cantley, J. , Burchfield, J. G. , Pearson, G. L. , Schmitz‐Peiffer, C. , Leitges, M. , and Biden, T. J. (2009) Deletion of PKCepsilon selectively enhances the amplifying pathways of glucose‐stimulated insulin secretion via increased lipolysis in mouse β‐cells. Diabetes 58, 1826–1834 [DOI] [PMC free article] [PubMed] [Google Scholar]
- 48. Boden, M. J. , Brandon, A. E. , Tid‐Ang, J. D. , Preston, E. , Wilks, D. , Stuart, E. , Cleasby, M. E. , Turner, N. , Cooney, G. J. , and Kraegen, E. W. (2012) Overexpression of manganese superoxide dismutase ameliorates high‐fat diet‐induced insulin resistance in rat skeletal muscle. Am. J. Physiol. Endocrinol. Metab. 303, E798–E805 [DOI] [PMC free article] [PubMed] [Google Scholar]
- 49. Dinkova‐Kostova, A. T. , and Abramov, A. Y. (2015) The emerging role of Nrf2 in mitochondrial function. Free Radic. Biol. Med. 88, 179–188 [DOI] [PMC free article] [PubMed] [Google Scholar]
- 50. Wittenberger, T. , Schaller, H. C. , and Hellebrand, S. (2001) An expressed sequence tag (EST) data mining strategy succeeding in the discovery of new G‐protein coupled receptors. J. Mol. Biol. 307, 799–813 [DOI] [PubMed] [Google Scholar]
- 51. Yousefi, S. , Cooper, P. R. , Potter, S. L. , Mueck, B. , and Jarai, G. (2001) Cloning and expression analysis of a novel G‐protein‐coupled receptor selectively expressed on granulocytes. J. Leukoc. Biol. 69, 1045–1052 [PubMed] [Google Scholar]
- 52. Müller, M. M. , Lehmann, R. , Klassert, T. E. , Reifenstein, S. , Conrad, T. , Moore, C. , Kuhn, A. , Behnert, A. , Guthke, R. , Driesch, D. , and Slevogt, H. (2017) Global analysis of glycoproteins identifies markers of endotoxin tolerant monocytes and GPR84 as a modulator of TNFα expression. Sci. Rep. 7, 838 [DOI] [PMC free article] [PubMed] [Google Scholar]
- 53. Nicol, L. S. C. , Dawes, J. M. , La Russa, F. , Didangelos, A. , Clark, A. K. , Gentry, C. , Grist, J. , Davies, J. B. , Malcangio, M. , and McMahon, S. B. (2015) The role of G‐protein receptor 84 in experimental neuropathic pain. J. Neurosci. 35, 8959–8969 [DOI] [PMC free article] [PubMed] [Google Scholar]
- 54. Suzuki, M. , Takaishi, S. , Nagasaki, M. , Onozawa, Y. , Iino, I. , Maeda, H. , Komai, T. , and Oda, T. (2013) Medium‐chain fatty acid‐sensing receptor, GPR84, is a proinflammatory receptor. J. Biol. Chem. 288, 10684–10691 [DOI] [PMC free article] [PubMed] [Google Scholar]
- 55. Wei, L. , Tokizane, K. , Konishi, H. , Yu, H.‐R. , and Kiyama, H. (2017) Agonists for G‐protein‐coupled receptor 84 (GPR84) alter cellular morphology and motility but do not induce pro‐inflammatory responses in microglia. J. Neuroinflammation 14, 198 [DOI] [PMC free article] [PubMed] [Google Scholar]
- 56. Palikaras, K. , Lionaki, E. , and Tavernarakis, N. (2018) Mechanisms of mitophagy in cellular homeostasis, physiology and pathology. Nat. Cell Biol. 20, 1013–1022 [DOI] [PubMed] [Google Scholar]
- 57. Pickles, S. , Vigié, P. , and Youle, R. J. (2018) Mitophagy and quality control mechanisms in mitochondrial maintenance. Curr. Biol. 28, R170–R185 [DOI] [PMC free article] [PubMed] [Google Scholar]
- 58. Herst, P. M. , Rowe, M. R. , Carson, G. M. , and Berridge, M. V. (2017) Functional mitochondria in health and disease. Front. Endocrinol. (Lausanne) 8, 296 [DOI] [PMC free article] [PubMed] [Google Scholar]
- 59. Gao, Z. , Yin, J. , Zhang, J. , Ward, R. E. , Martin, R. J. , Lefevre, M. , Cefalu, W. T. , and Ye, J. (2009) Butyrate improves insulin sensitivity and increases energy expenditure in mice. Diabetes 58, 1509–1517 [DOI] [PMC free article] [PubMed] [Google Scholar]
- 60. Mahmud, Z. A. , Jenkins, L. , Ulven, T. , Labéguère, F. , Gosmini, R. , De Vos, S. , Hudson, B. D. , Tikhonova, I. G. , and Milligan, G. (2017) Three classes of ligands each bind to distinct sites on the orphan G protein‐coupled receptor GPR84. Sci. Rep. 7, 17953 [DOI] [PMC free article] [PubMed] [Google Scholar]
- 61. Baker, J. G. , and Hill, S. J. (2007) Multiple GPCR conformations and signalling pathways: implications for antagonist affinity estimates. Trends Pharmacol. Sci. 28, 374–381 [DOI] [PMC free article] [PubMed] [Google Scholar]
- 62. Dagda, R. K. , and Das Banerjee, T. (2015) Role of protein kinase A in regulating mitochondrial function and neuronal development: implications to neurodegenerative diseases. Rev. Neurosci. 26, 359–370 [DOI] [PMC free article] [PubMed] [Google Scholar]
- 63. Loh, J.‐K. , Lin, C.‐C. , Yang, M.‐C. , Chou, C.‐H. , Chen, W.‐S. , Hong, M.‐C. , Cho, C.‐L. , Hsu, C.‐M. , Cheng, J.‐T. , Chou, A.‐K. , Chang, C.‐H. , Tseng, C.‐N. , Wang, C.‐H. , Lieu, A.‐S. , Howng, S.‐L. , and Hong, Y.‐R. (2015) GSKIP‐ and GSK3‐mediated anchoring strengthens cAMP/PKA/Drp1 axis signaling in the regulation of mitochondrial elongation. Biochim. Biophys. Acta 1853, 1796–1807 [DOI] [PubMed] [Google Scholar]
- 64. Dickey, A. S. , and Strack, S. (2011) PKA/AKAP1 and PP2A/Bβ2 regulate neuronal morphogenesis via Drp1 phosphorylation and mitochondrial bioenergetics. J. Neurosci. 31, 15716–15726 [DOI] [PMC free article] [PubMed] [Google Scholar]
- 65. Affaitati, A. , Cardone, L. , de Cristofaro, T. , Carlucci, A. , Ginsberg, M. D. , Varrone, S. , Gottesman, M. E. , Avvedimento, E. V. , and Feliciello, A. (2003) Essential role of A‐kinase anchor protein 121 for cAMP signaling to mitochondria. J. Biol. Chem. 278, 4286–4294 [DOI] [PubMed] [Google Scholar]
- 66. Sugden, P. H. , and Clerk, A. (1997) Regulation of the ERK subgroup of MAP kinase cascades through G protein‐coupled receptors. Cell. Signal. 9, 337–351 [DOI] [PubMed] [Google Scholar]
- 67. Duarte, A. , Castillo, A. F. , Podestá, E. J. , and Poderoso, C. (2014) Mitochondrial fusion and ERK activity regulate steroidogenic acute regulatory protein localization in mitochondria. PLoS One 9, e100387 [DOI] [PMC free article] [PubMed] [Google Scholar]
- 68. Ishikawa, Y. , Kusaka, E. , Enokido, Y. , Ikeuchi, T. , and Hatanaka, H. (2003) Regulation of Bax translocation through phosphorylation at Ser‐70 of Bcl‐2 by MAP kinase in NO‐induced neuronal apoptosis. Mol. Cell. Neurosci. 24, 451–459 [DOI] [PubMed] [Google Scholar]
- 69. Jin, K. , Mao, X. O. , Zhu, Y. , and Greenberg, D. A. (2002) MEK and ERK protect hypoxic cortical neurons via phosphorylation of Bad. J. Neurochem. 80, 119–125 [DOI] [PubMed] [Google Scholar]
- 70. Lee, H. J. , Bach, J. H. , Chae, H. S. , Lee, S. H. , Joo, W. S. , Choi, S. H. , Kim, K. Y. , Lee, W. B. , and Kim, S. S. (2004) Mitogen‐activated protein kinase/extracellular signal‐regulated kinase attenuates 3‐hydroxykynurenine‐induced neuronal cell death. J. Neurochem. 88, 647–656 [DOI] [PubMed] [Google Scholar]
- 71. Du Toit, E. , Browne, L. , Irving‐Rodgers, H. , Massa, H. M. , Fozzard, N. , Jennings, M. P. , and Peak, I. R. (2018) Effect of GPR84 deletion on obesity and diabetes development in mice fed long chain or medium chain fatty acid rich diets. Eur. J. Nutr. 57, 1737–1746 [DOI] [PubMed] [Google Scholar]
- 72. Tiganis, T. (2011) Reactive oxygen species and insulin resistance: the good, the bad and the ugly. Trends Pharmacol. Sci. 32, 82–89 [DOI] [PubMed] [Google Scholar]
- 73. Tang, C. , Ahmed, K. , Gille, A. , Lu, S. , Gröne, H.‐J. , Tunaru, S. , and Offermanns, S. (2015) Loss of FFA2 and FFA3 increases insulin secretion and improves glucose tolerance in type 2 diabetes. Nat. Med. 21, 173–177 [DOI] [PubMed] [Google Scholar]
- 74. Biden, T. J. , Robinson, D. , Cordery, D. , Hughes, W. E. , and Busch, A. K. (2004) Chronic effects of fatty acids on pancreatic beta‐cell function: new insights from functional genomics. Diabetes 53 (Suppl 1), S159–S165 [DOI] [PubMed] [Google Scholar]
- 75. Kebede, M. , Alquier, T. , Latour, M. G. , Semache, M. , Tremblay, C. , and Poitout, V. (2008) The fatty acid receptor GPR40 plays a role in insulin secretion in vivo after high‐fat feeding. Diabetes 57, 2432–2437 [DOI] [PMC free article] [PubMed] [Google Scholar]
- 76. Liu, Y. , Zhang, Q. , Chen, L.‐H. , Yang, H. , Lu, W. , Xie, X. , and Nan, F.‐J. (2016) Design and synthesis of 2‐Alkylpyrimidine‐4,6‐diol and 6‐Alkylpyridine‐2,4‐diol as potent GPR84 agonists. ACS Med. Chem. Lett. 7, 579–583 [DOI] [PMC free article] [PubMed] [Google Scholar]
Associated Data
This section collects any data citations, data availability statements, or supplementary materials included in this article.
Supplementary Materials
Supplemental Figure 1
Supplemental Figure 2
Supplemental Figure 3
Supplemental Figure 4
Supplemental Figure 5
Supplemental Table 1
Supplemental Table 2