

abstract
NG2 glia display wide proliferation and differentiation potential under physiological and pathological conditions. Here, we examined these two features following different types of brain disorders such as focal cerebral ischemia (FCI), cortical stab wound (SW), and demyelination (DEMY) in 3‐month‐old mice, in which NG2 glia are labeled by tdTomato under the Cspg4 promoter. To compare NG2 glia expression profiles following different CNS injuries, we employed single‐cell RT‐qPCR and self‐organizing Kohonen map analysis of tdTomato‐positive cells isolated from the uninjured cortex/corpus callosum and those after specific injury. Such approach enabled us to distinguish two main cell populations (NG2 glia, oligodendrocytes), each of them comprising four distinct subpopulations. The gene expression profiling revealed that a subpopulation of NG2 glia expressing GFAP, a marker of reactive astrocytes, is only present transiently after FCI. However, following less severe injuries, namely the SW and DEMY, subpopulations mirroring different stages of oligodendrocyte maturation markedly prevail. Such injury‐dependent incidence of distinct subpopulations was also confirmed by immunohistochemistry. To characterize this unique subpopulation of transient astrocyte‐like NG2 glia, we used single‐cell RNA‐sequencing analysis and to disclose their basic membrane properties, the patch‐clamp technique was employed. Overall, we have proved that astrocyte‐like NG2 glia are a specific subpopulation of NG2 glia emerging transiently only following FCI. These cells, located in the postischemic glial scar, are active in the cell cycle and display a current pattern similar to that identified in cortical astrocytes. Astrocyte‐like NG2 glia may represent important players in glial scar formation and repair processes, following ischemia.
Keywords: astrocytes, demyelination, ischemia, NG2 glia, oligodendrocytes, stab wound
Main Points
Gene expression profiling revealed marked differences in the incidence of NG2 glia subpopulations between the cortex and corpus callosum.
Following focal cerebral ischemia, astrocyte–like NG2 glia and immature oligodendrocytes represent prevailing subpopulations.
Astrocyte–like NG2 glia express GFAP and display a current pattern similar to that of cortical astrocytes.
1. INTRODUCTION
NG2 glia account for ~10% of cells in the developing and adult brain both in gray and white matter. They belong to the glial cells of the central nervous system (CNS), expressing platelet‐derived growth factor receptor alpha (Pdgfrα) and NG2 antigen (Nishiyama, Watanabe, Yang, & Bu, 2002). NG2 antigen is also expressed by vascular cells, pericytes that can be distinguished based on their morphology or different surface marker (platelet‐derived growth factor receptor beta (Pdgfrβ; Ozerdem, Grako, Dahlin‐Huppe, Monosov, & Stallcup, 2001). NG2 glia are known for their ability to proliferate and generate new oligodendrocytes (OLs) during development as well as in adulthood, and therefore, they are also termed oligodendrocyte precursor cells (OPCs). Moreover, their even distribution throughout the entire CNS parenchyma, suggests that NG2 glia also possess additional functions in addition to being purely progenitor cells (Hill & Nishiyama, 2014). It is well known that NG2 glia receive glutamatergic synaptic input from neurons in the hippocampus, cortex, and cerebellum (Bergles, Roberts, Somogyi, & Jahr, 2000; Kukley et al., 2008), but there remains, however, limited knowledge on the molecular characteristics and functional significance of these synapses (Kula, Chen, & Kukley, 2019). Based on the differentiation capacity of NG2 glia, they have been extensively investigated in several genetically modified mice. NG2 glia in the white matter mainly differentiate into mature OLs, but most NG2 glia in the gray matter are maintained in an immature state, even after CNS damage (Dimou, Simon, Kirchhoff, Takebayashi, & Gotz, 2008; Rivers et al., 2008). The proliferation and differentiation of NG2 glia are strongly accelerated in CNS disorders where they restore a certain degree of plasticity (Levine, 2016). There is a general consensus that NG2 glia are restricted to the OL lineage, but numerous reports have described their differentiation into astrocytes or even neurons, for reviews see (Kirdajova & Anderova, 2020; Nishiyama, Boshans, Goncalves, Wegrzyn, & Patel, 2016; Vigano & Dimou, 2016). Several studies suggested that astrocytes can originate from embryonic rather than postnatal or adult NG2 glia, in the intact CNS (Huang et al., 2014; Huang, Guo, Bai, Scheller, & Kirchhoff, 2019; Kang, Fukaya, Yang, Rothstein, & Bergles, 2010; Tsoa, Coskun, Ho, & de Vellis, 2014; Zhu et al., 2011; Zhu, Bergles, & Nishiyama, 2008). In reaction to CNS pathology, some studies reported that a small fraction of NG2 glia can differentiate into astrocytes after spinal cord injury (Hackett et al., 2018; Huang et al., 2018) and after brain injury (Dimou et al., 2008; Honsa et al., 2016; Honsa, Pivonkova, Dzamba, Filipova, & Anderova, 2012; Komitova, Serwanski, Lu, & Nishiyama, 2011; Valny et al., 2018), while others showed that fewer NG2 glia, if any, become astrocytes (Kang et al., 2010; Tripathi, Rivers, Young, Jamen, & Richardson, 2010; Zawadzka et al., 2010).
Such inconsistencies between studies can be explained by employing different types of cre recombinase transgenic mice and CNS injuries, various methods of astrocyte identification, or different protocols of tamoxifen (TX) administration. Therefore, the aim of our study was to compare the fate of NG2 glia, with the main focus on NG2 glia‐derived astrocytes, between different types of CNS disorders in TX‐inducible BAC transgenic mice. Cre recombinase was under the control of the Cspg4 promoter, which facilitated the genetic fate‐mapping of all oligodendroglial lineage cells, based on the expression of red fluorescent protein (tdTomato). To avoid the off‐target effect that could lead to a false identification of reporter positive cells, we used TX protocol (Valny, Honsa, Kirdajova, Kamenik, & Anderova, 2016). To address the hypothesis that NG2 glia differentiation potential into astrocytes is only triggered by severe CNS injury, we performed single‐cell gene expression profiling, protein expression analyses employing immunohistochemistry quantification, and electrophysiological characterization, in order to identify NG2 glia‐derived cells following CNS injuries, namely focal cerebral ischemia (FCI), cortical stab wound (SW), and demyelination (DEMY).
2. MATERIALS AND METHODS
2.1. Animals
All procedures involving the use of laboratory animals were performed in accordance with the European Communities Council Directive 24 November 1986 (86/609/EEC) and animal care guidelines approved by the Institute of Experimental Medicine, Academy of Sciences of the Czech Republic (Animal Care Committee on March 15, 2017; approval number 2/2017). All efforts were made to minimize both the suffering and the number of animals used. Experiments were performed on 3‐month‐old mice, which were derived by cross breeding mouse strain B6.Cg‐Tg(Cspg4‐cre/Esr1*)BAkik/J and B6;129S6‐Gt(ROSA)26Sortm14 (CAG‐tdTomato)Hze/J; Jackson Laboratory, Bar Harbor, Maine) further termed as Cspg4/tdTomato mouse, in which the expression of TX‐inducible cre recombinase is controlled by the Cspg4 promoter (Zhu et al., 2011; Figure 1a). After TX administration, tdTomato red fluorescent protein is expressed in Cspg4‐positive (Cspg4+) cells—predominantly in NG2 glia and cells derived therein. Tamoxifen was administered intraperitoneally for 2 days (100 mg/kg, Sigma–Aldrich, St. Louis, MO; Valny et al. 2016) and CNS injuries were induced 14 days after the last TX injection (Figure 1c). In addition, to follow NG2‐glia derived astrocytes, the Cspg4/tdTomato mice were cross‐bred with constitutive Gfap/EGFP mice, in which the visualization of astrocytes is feasible because of the enhanced green fluorescent protein (EGFP) under the control of the human promoter for glial fibrillary acidic protein (GFAP, Nolte et al., 2001; Figure 1b). This approach enabled the identification of NG2 glia, that differentiated into astrocyte‐like NG2 glia based on their co‐expression of tdTomato and EGFP.
FIGURE 1.
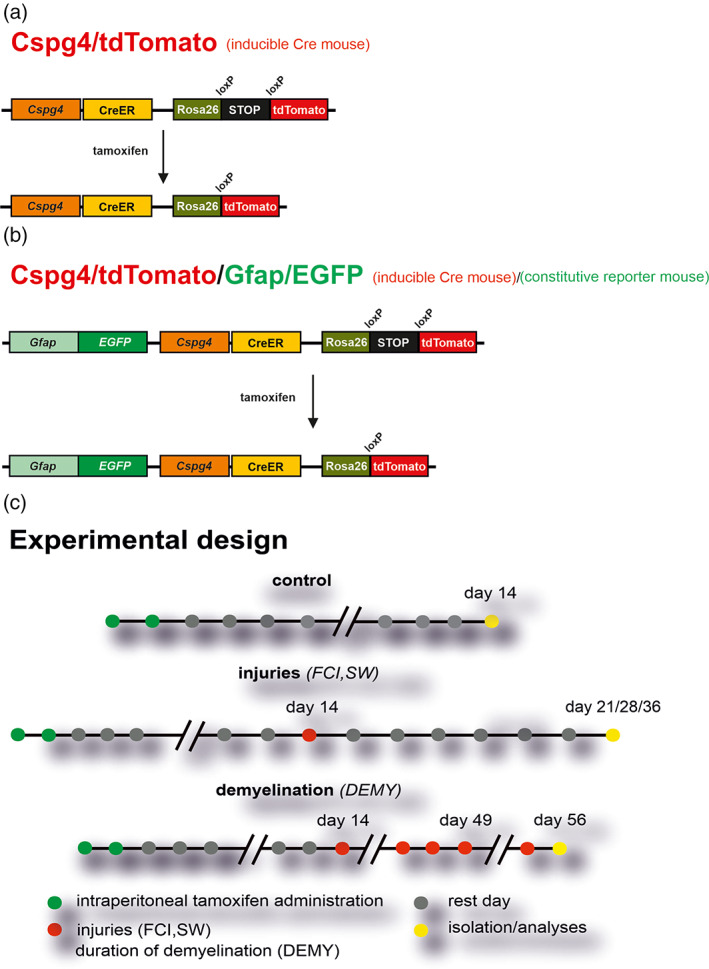
Scheme summarizing genetically modified mouse strains used in the experiments, and tamoxifen applications. (a) Cspg4/tdTomato mouse in which red fluorescent protein (tdTomato) is expressed in NG2 glia and cells derived therefrom. (b) Cspg4/tdTomato/Gfap/EGFP mouse in which, in addition to red NG2 glia, enhanced green fluorescent protein (EGFP) is constitutively expressed under the control of glial fibrillary acidic protein (GFAP) promoter, an astrocytic marker. (c) Scheme of administration of tamoxifen. DEMY, demyelination; FCI, focal cerebral ischemia; SW, stab wound
2.2. The induction of focal cerebral ischemia
Mice were anesthetized with 3% isoflurane (Abbot, Abbot Park, IL) and maintained in 2% isoflurane using a vaporizer (Tec‐3, Cyprane Ltd., Keighley, UK). A skin incision between the orbit and the external auditory meatus was made and a 1–2 mm hole was drilled through the frontal bone, 1 mm rostral to the fusion of the zygoma and the squamosal bone and about 3.5 mm ventrally to the dorsal surface of the brain. The middle cerebral artery was exposed after the dura was opened and removed. The middle cerebral artery was occluded by short coagulation with bipolar tweezers (SMT, Czech Republic) at a proximal location, followed by transection of the vessel to ensure permanent occlusion. During the surgery, the body temperature was maintained at 37 ± 1°C using a heat pad. The sham‐operated animals (CTRL) were subjected to the same surgery procedure, but without dura opening and vessel occlusion. This middle cerebral artery occlusion model yields small infarct lesions in the parietal cortical region (Figure 2a).
FIGURE 2.
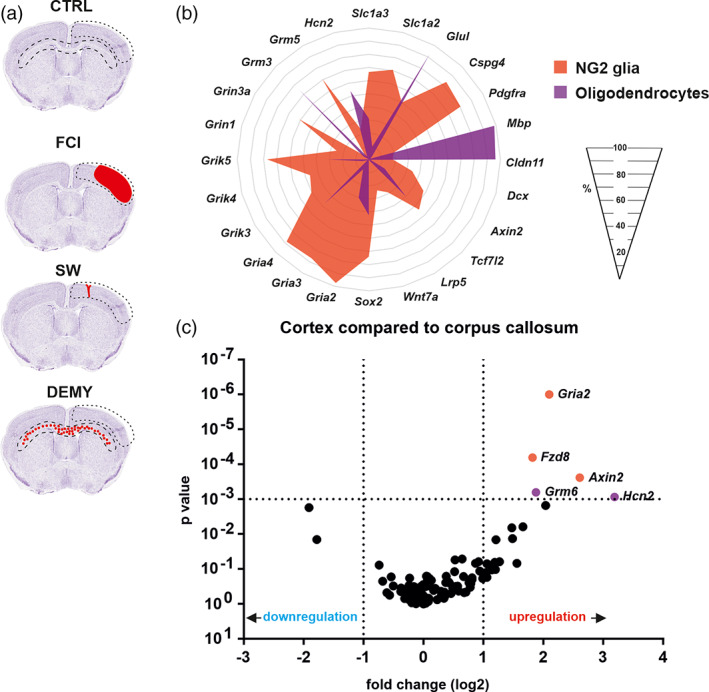
(a) Scheme depicting brain regions (dashed lines) which were used for tdTomato+ cell isolation. (b) NG2 glia and oligodendrocytes isolated from uninjured mice differ in percentage of cells expressing particular genes. (c) Volcano plots showing higher levels of expression (red) of several genes in the cortex (CTX) compared to corpus callosum (CC) in NG2 glia (orange) or oligodendrocytes (purple). Statistics were calculated using multiple t‐test. In the case of “b”, only statistically significant differences with p < .05 are shown. In the case of “c”, only statistically significant differences with p < .001 and log fold change >1 are shown. CTRL, control; DEMY, demyelination; FCI, focal cerebral ischemia; SW, stab wound
2.3. The induction of a cortical stab wound
Prior to the SW, mice were anesthetized with 3% isoflurane and maintained in 2% isoflurane using a vaporizer (Tec‐3, Cyprane Ltd., Keighley, UK). The cranium was thinned in 1.5 mm2 area to pass the sharp knife, 2 mm caudal to the bregma, 1 mm lateral to the midline. Then, a 1.1 mm sterile sharp knife was inserted vertically into the right cerebral hemisphere 1 mm deep to the dura surface (Figure 2a). The skin incision was closed with sutures. CTRL mice were subjected to the same surgical procedure, but without dura opening and SW (Buffo et al., 2005).
2.4. The induction of demyelination
DEMY was induced by administration of 0.3% cuprizone (Sigma‐Aldrich, Inc., St. Louis, MO) to mice ad libitum in chow (Ssniff Spezialdiäten GmbH, Soest, Germany; Figure 2a). The treated mice received cuprizone chow for 5 weeks to cause DEMY and, after this period, they were returned to a regular diet and allowed to recover for 7 days. CTRL mice received regular mice chow, without cuprizone, for the entire period.
2.5. The preparation of single‐cell suspension from the mouse cortex and corpus callosum
The mice were deeply anesthetized with pentobarbital (PTB) (100 mg/kg, i.p.), and perfused transcardially with a cold (4–8°C) isolation buffer containing (in mM): NaCl 136.0, KCl 5.4, HEPES 10.0, glucose 5.5, osmolality 290 ± 3 mOsmol/kg. To isolate the cerebral cortex (CTX) and corpus callosum (CC), the brain was sliced into 600 μm coronal sections using a vibrating microtome HM650V (MICROM International GmbH, Germany). Sections were dissected from different regions depending on the type of CNS injury; FCI (+1.5 to −2 mm from bregma) of CTX, SW (−1.3 to −2.5 mm from bregma) of CTX and DEMY (1.5 to −2.5 mm from bregma) of CTX and CC (Figure 2a). The collected tissue was incubated with continuous shaking at 37°C for 45 min in 1 ml of papain solution (20 U/ml) and 0.2 ml DNase (both from Worthington, NJ) prepared in isolation buffer. After papain treatment, the tissue was mechanically dissociated by gentle trituration using a 1 ml pipette. The dissociated cells were layered on top of 5 ml of ovomucoid inhibitor solution (Worthington, NJ) and harvested by centrifugation (70×g for 6 min). This method routinely yielded ~2 × 10⁶ cells per mouse brain. Cell aggregates were removed by filtering with 70 μm cell strainers (Becton Dickinson, NJ), and the cells were kept on ice until sorting.
2.6. The collection of single cells
Single cells were sorted using fluorescent activated cell sorting (FACS; BD Influx, San Jose, CA). The flow cytometer was manually calibrated to deposit a single cell in the center of each collection tube. Hoechst 33258 (Life Technologies, Carlsbad, CA) was added to the suspension of cells to check viability (Figure S1). Single cells were collected into 96‐well plates (Life Technologies, Carlsbad, CA) containing 5 μl nuclease‐free water with bovine serum albumin (1 mg/μl, Fermentas, Rockford, IL) and RNaseOut 20 U (Life Technologies, Carlsbad, CA). The plates were placed on a pre‐cooled rack and stored at −80°C until analyzed.
2.7. Single‐cell RT‐qPCR analysis
The single‐cell RT‐qPCR analysis was used to profile individual cells from three 3‐month‐old male mice (Cspg4/tdTomato). It was performed using the protocol described in (Rusnakova et al., 2013). Briefly, samples were reverse transcribed into cDNA using SuperScript III (ThermoFisher Scientific, Waltham, MA). Nondiluted cDNA was pre‐amplified using a mix of 95 primers (Table S1). The primers were designed using Primer‐BLAST (Ye et al., 2012). When possible, each primer pair was designed to span introns to avoid the amplification of genomic DNA. For each assay, the specificity was tested by the melt curve analysis and gel electrophoresis; the efficiency was determined using a standard dilution series spanning six orders of magnitude. Pre‐amplified cDNA was four times diluted and analyzed in BioMark platform (Fluidigm, San Francisco, CA), measuring the expression of 95 genes. The data was pre‐processed in Fluidigm Real‐Time Analysis software (Fludigm, San Francisco, CA) and further analyzed by GenEx 6 software (MultiD, Gothenburg, Sweden). In total, 550 single cells were analyzed.
2.8. Self‐organizing Kohonen maps
Kohonen self‐organizing maps (SOM) of size 8 × 1, dividing the cells into four groups, were trained using GenEx 6 (MultiD, Gothenburg, Sweden) software with the following parameters: 0.60 learning rate, eight neighbors, and 5000 iterations. The SOM analysis was repeated eight times with identical classification of the cells in each of the repeats (Table S2). This classification of cells into groups was substantiated with the principal component analysis (PCA).
2.9. Immunohistochemistry
For immunohistochemical analyses, the animals were deeply anesthetized with PTB (100 mg/kg, i.p.) and perfused transcardially with 20 ml of saline followed by 20 ml of cooled 4% paraformaldehyde (PFA) in 0.1 M phosphate buffer. The brains were dissected out, postfixed overnight with PFA, and treated with a sucrose gradient (ranging from 10% to 30%) for cryoprotection. Coronal 30‐μm‐thick slices were prepared using a cryostat (Leica CM1850, Leica Microsystems, Wetzlar, Germany). For immunohistochemical staining, the slices were washed in a phosphate buffer saline followed by blocking of the nonspecific binding sites with 5% Chemiblocker (Millipore, Billerica, MA), and 0.2% Triton in phosphate buffer saline. The blocking solution was also used as the diluent for the antisera. The slices were incubated with the primary antibodies overnight, and the secondary antibodies were applied for 2 hr at 4–8°C. The following primary antibodies were used: mouse anti‐adenomatous polyposis coli (APC, CC1, 1:200; Merck, Frankfurt, Germany), mouse anti‐GFAP (1:300; coupled to Alexa 488, Ebioscience, San Diego, CA), rabbit anti‐aldehyde dehydrogenase 1 family, member L1 (ALDH1L1 1:500; Abcam, Cambridge, UK), mouse anti‐vimentin (VIM), rabbit anti‐KI67 (1:1000; Abcam, Cambridge, UK), mouse anti‐proliferating cell nuclear antigen (PCNA, 1:800; Abcam, Cambridge, UK). The secondary antibodies were goat anti‐rabbit IgG or goat anti‐mouse IgG conjugated with Alexa Fluor 488 (Thermo Scientific, Waltham, MA). All chemicals were purchased from Sigma–Aldrich (St. Louis, MO) unless otherwise stated. A Zeiss 510DUO LSM confocal microscope equipped with Ar/HeNe lasers and ×40 oil objective was used for the immunohistochemical analysis. Stacks of consecutive confocal images taken at intervals of 3 μm were acquired sequentially with the two lasers to avoid cross‐talk between fluorescent labels. The background noise of each confocal image was reduced by averaging four image inputs. Co‐localization images and maximum z‐projection images were made using a Zeiss LSM Image Browser (Zeiss, Oberkochen, Germany).
2.10. Cell counts
To determine the number of cells, confocal images (318 μm × 318 μm × 15 μm) were taken covering the studied regions from the brain coronal slices prepared from the CTRL mice, or from the mice 7 days after CNS injury (five animals from each group, three brain slices and 5–6 regions from each slice) and stained for the antibodies listed above. The percentage of double‐positive cells for tdTomato and PCNA, KI67, APC, GFAP, VIM and ALDH1L1 were counted in the CTX or CC of adult CTRL mice (3‐month‐old), and those after FCI, SW, or DEMY (Figure S2).
2.11. Single‐cell RNA‐sequencing
The single‐cell RNA‐Sequencing (RNA‐Seq) analysis was employed to analyze the transcriptome of NG2 glia and astrocytes in 3‐month‐old male CTRL and ischemic mice using the Cspg4/tdTomato mouse strain. The preparation of cell suspension followed the standard protocol described above, apart from two modifications. First, transcriptional inhibitor actinomycin D (Sigma–Aldrich, St. Louis, MO) was added into media (30 μM during enzymatic dissociation, 3 μM in follow‐up steps) to prevent activation of immediate‐early genes (Wu, Pan, Zuo, Li, & Hong, 2017). Second, the final cell suspension was labeled with ACSA‐2 antibodies (4°C, 10 min; Miltenyi‐Biotec, Germany) to allow for the enrichment of astrocytes (Kantzer et al., 2017). The cells were enriched using flow cytometry (FACS; BD Influx) calibrated to sort tdTomato+, ACSA‐2+, and tdTomato+/ACSA‐2+ cells (Figure S3). Hoechst 33258 (ThermoFisher Scientific, Waltham, MA) was used to check viability. The cells were collected into 200 μl of Advanced Dulbecco's Modified Eagle Medium, supplemented with 10% fetal bovine serum (ThermoFisher Scientific Waltham, MA). Three animals per condition were pooled for the preparation of cell suspension. After FACS, cell suspension was spun down, concentrated, and used for library preparation using ×10 Chromium Next GEM Single‐Cell 3′ Reagent Kits v3.1 (×10 Genomics; Pleasanton, CA). The prepared libraries were sequenced on NovaSeq 6000 using SP flow cell, 100 cycles (Illumina, San Diego, CA).
Raw sequencing data consisting of 951 M reads were de‐multiplexed, aligned to the mouse GRCm38 reference genome and unique molecular identifier (UMI)‐collapsed using STAR aligner (Dobin et al., 2013). EmptyDrops function from the DropletUtils R package was used to identify cell‐containing droplets (Lun et al., 2019), resulting in 1656 cells in the CTRL sample and 2978 cells in the ischemic sample. The mapping statistics showed the mean values of 107,495 reads, 8316 UMIs, and 2882 genes per cell. The total number of genes detected was 23,194. Both samples were combined and normalized using the SCTransform function in Seurat v3 (Stuart et al., 2019). To visualize cell clusters, we generated a UMAP plot using the first 15 principal components and resolution parameter, set to 0.5. Cell clusters were annotated using scCATCH (Shao et al., 2020), as well as using a manual curation based on a referenced database (Zeisel et al., 2018). As we only identified seven NG2 glia in the CTRL sample, we limited our further analysis just to the ischemic dataset. In the ischemic sample, we removed all the other cell types, keeping only the cells that had the characteristics of NG2 glia, astrocytes or both. The resulting expression matrix contained 666 cells, expressing 10,635 genes in total; each gene was expressed in at least 5% of cells (only 4000 genes with the highest expression are shown in Table S3). For the final analysis, the matrix was uploaded and analyzed using the updated version of ASAP software (David, Litovchenko, Deplancke, & Gardeux, 2020). Briefly, the cells were quality controlled, excluding 117 cells from the analysis (fewer than 1000 genes detected and/or more than 20% of mitochondrial reads). The expression matrix was further reduced to 2249 highly variable genes, and normalized using Seurat implementation. The cells were visualized on a UMAP plot and clustered using the hierarchical clustering method. The Wilcoxon test was employed for differential expression (DE) analysis. Sets of DE genes (FDR < 0.05, FC > 2) were analyzed using Fisher's exact test against gene ontology collections.
2.12. The preparation of acute brain slices
Mice were anesthetized with an intraperitoneal injection of a lethal dose (100 mg/kg) of 1% PTB diluted in saline (Sigma‐Aldrich, St. Louis, MO), transcardially perfused with an ice‐cold isolation solution, and then decapitated. The brains were dissected and placed into a cold isolation solution (4–8 °C), bubbled with 5% CO2. Coronal slices (200 μm) were cut using an HM650 V vibratome (MICROM International GmbH, Waldorf, Germany). The brain slices were then incubated for 40 min at 34°C in the isolation solution. After the incubation period, the slices were kept at room temperature (23–25°C) in an artificial cerebrospinal fluid (aCSF) containing (in mM): 122 NaCl, 3 KCl, 1.5 CaCl2, 1.3 MgCl2, 1.25 Na2HPO4, 28 NaHCO3, and 10 D‐glucose (osmolality 300 mmol/kg).
2.13. The patch‐clamp technique
Cell membrane currents were recorded in situ 7 days after FCI, using the patch‐clamp technique in the whole‐cell configuration. Recording pipettes with a tip resistance of 8–12 MΩ were made from borosilicate capillaries (Sutter Instruments, Novato, CA,) using a P‐97 Brown‐Flaming micropipette puller (Sutter Instruments, Novato, CA). The recording pipettes were filled with an intracellular solution containing (in mM): 130 KCl, 0.5 CaCl2, 2 MgCl2, 5.0 EGTA, and 10 HEPES (pH 7.2). All the recordings were made in aCSF. The solution was continuously gassed with 5% CO2, to maintain a final pH of 7.4. The electrophysiological data were measured with a 10 kHz sample frequency, using an EPC9 or EPC10 amplifier, controlled by PatchMaster software (HEKA Elektronik, Lambrecht/Pfalz, Germany), and filtered using a Bessel filter. The slices were transferred to the recording chamber of an upright Axioscop microscope (Zeiss, Gottingen, Germany), equipped with electronic micromanipulators (Luigs & Neumann, Ratingen, Germany) and a high‐resolution AxioCam HR digital camera (Zeiss, Gottingen, Germany). The resting membrane potential (Vm) was measured by switching the EPC9 or EPC10 amplifier to the current‐clamp mode. With the use of FitMaster software (HEKA Elektronik, Lambrecht/Pfalz, Germany), input resistance (IR) was calculated from the current value at 40 ms after the onset of the depolarizing 10 mV pulse, from the holding potential of −70 to −60 mV. Membrane capacitance (C m ) was determined automatically from the Lock‐in protocol by PatchMaster. The current patterns were obtained by hyper‐ and depolarizing the cell membrane from the holding potential of −70 mV to the values ranging from −160 to +40 mV, at 10 mV intervals. The pulse duration was 50 ms. In order to isolate the delayed outwardly rectifying K+ (KDR) current components, a voltage step from −70 to −60 mV was used to subtract the time‐ and voltage‐independent currents, as previously described (Anderová et al., 2006; Neprasova et al., 2007). To activate the KDR currents only, the cells were held at −50 mV, and the amplitude of the KDR currents was measured at 40 mV, 40 ms after the onset of the pulse. The inwardly rectifying potassium K+ (K IR) currents were determined analogously at −140 mV, also 40 ms after the onset of the pulse, while the cells were held at −70 mV. The fast activating and inactivating outwardly rectifying K+ (K A) currents were isolated by subtracting the current traces clamped at −110 mV from those clamped at −50 mV, and its amplitude was measured at the peak value. The current densities were calculated by dividing the maximum current amplitudes by the corresponding Cm values for each individual cell.
2.14. Data analysis and statistics
The list of the applied tests in experiments and the results of post hoc analyses are included in Table S4. Values of p < .05 were considered significant, p < .01 very significant, and p < .001 extremely significant.
3. RESULTS
To compare the NG2 glia expression profiles of individual cells in different types of brain disorders, we performed single‐cell RT‐qPCR, in which we analyzed the expression of 95 genes (Table S1). To achieve this, we used Cspg4/tdTomato mice, in which the TX‐application triggers the expression of the red fluorescent protein in NG2 glia and the cells derived therefrom (Figure 1a). In all experiments, we administrated the TX 14 days before the analysis/disorder induction in the 3‐month‐old mice (Figure 1c). In order to disclose changes in the gene expression of NG2 glia in glial scar formation (Wanner et al., 2013) and remyelination (Skripuletz, Gudi, Hackstette, & Stangel, 2011), we isolated two different regions of the brain (CC and CTX) from the CTRLs and mice 7 days after the induction of FCI/SW or withdrawal of the cuprizone diet (DEMY; Figure 2a). Raw data are listed in Table S2.
3.1. NG2 glia and oligodendrocytes in the uninjured brain
Primarily, we sorted all the cells based on their marker genes as NG2 glia (Cspg4, Pdgfrα; n = 75 cells/10 mice) and OLs, derived from the NG2 glia (Mbp, Cldn11; n = 80 cells/11 mice; Figures 2b and S4). Despite the fact that these cells were isolated from different regions of the brain (CTX, CC) they displayed a similar expression pattern within the populations. Besides the well‐known cell‐type‐specific genes of NG2 glia and OLs, we detected a high percentage (92.0 ± 2.5%) of OLs that expressed the gene for glutamine synthetase (GS, Glul gene; Figure 2b). Even though this gene is considered as a marker for astrocytes our data are in accordance with the latest findings, confirming that OLs express both mRNA for GS as well as the protein (Marques et al., 2016; Xin et al., 2019; Zhang et al., 2014). The metabolic coupling between OLs and axons has been generally accepted (Saab et al., 2016; Simons & Nave, 2015), but it has now been shown, from the studies of OLs‐GS knock‐outs, that OLs do not require GS for survival and myelination; however, the loss of OLs GS disrupts neuronal glutamate signaling and glutamate‐dependent behavior (Xin et al., 2019). Recently, glutamate signaling has been shown to play a role in the regulation of OL maturation and differentiation (Suárez‐Pozos, Thomason, & Fuss, 2020). Further genes previously considered as astrocytic markers ‐ Slc1a2 and Slc1a3, were also detected in NG2 glia (75.0 ± 6.8% and 73.5 ± 9.8%; Figure 2b), which accords well with the previous findings (DeSilva, Kabakov, Goldhoff, Volpe, & Rosenberg, 2009), supporting a developmentally regulated expression pattern of Slc1a2 and Slc1a3. Their highest expressions were found in the earlier stages of OLs development, prior to robust myelination (Chamling et al., 2021; DeSilva et al., 2009; Marques et al., 2016; Zhang et al., 2014). Martinez‐Lozada et al. suggested that the activation of sodium‐dependent glutamate transporters (Slc1a2, Slc1a3) promotes a transient increase in intracellular calcium levels, which leads to changes in the actin‐cytoskeleton and leads to OLs maturation (Martinez‐Lozada et al., 2014). In line with other studies, we hardly observed any OLs (3.4 ± 0.9%) expressing Dcx, while its expression was detected in NG2 glia (33.8 ± 6.5%; Figure 2b). This indicates that Dcx is not only associated with the immature neuronal phenotype and our findings are in agreement with those of Boulanger et al., who found that almost all OPCs express Dcx but also the levels of expression appear to be much lower than those found in the neural precursor. Dcx is downregulated when NG2 glia start expressing mature OLs markers, and is absent in myelinating OLs. Their study also proposed that Dcx could either be involved in cell migration, or that it may represent another marker of progenitor cells, which also accords well with our previous studies (Boulanger & Messier, 2017; Honsa et al., 2016; Marques et al., 2016; Tamura et al., 2007; Zhang et al., 2014). The transcription factors of the Sox family have been widely studied in the context of OL development. We observed 74.3 ± 6.5% of NG2 glia expressed Sox2, compared to only 42.5 ± 9.4% of OLs (Figure 2b). This is in agreement with the findings that Sox2 maintains cells in a proliferative state, and prepares NG2 glia for myelination (Zhang et al., 2018; Zhao et al., 2015). We also analyzed all subunits of ionotropic and metabotropic glutamate receptors, as these may play important roles in CNS disorders. NG2 glia had a higher percentage of cells which expressed AMPA (Gria2, Gria3, Gria4) and kainate receptor subunits (Grik3, Grik4, Grik5), compared to OLs (Figure 2b). The presence of glutamate receptors in NG2 glia suggests that they are well equipped to sense neuronal activity, as already suggested (Káradóttir, Hamilton, Bakiri, & Attwell, 2008; Kukley et al., 2008). NG2 glia show the highest density of ionotropic glutamate receptors compared to later lineage stages (De Biase, Nishiyama, & Bergles, 2010), which is very well reviewed by (Ceprian & Fulton, 2019; Song et al., 2017; Spitzer, Volbracht, Lundgaard, & Karadottir, 2016). We also confirmed our previous results about subunits of metabotropic glutamate receptors (Valny et al., 2018); Grm5 was predominantly expressed by NG2 glia (70.2 ± 7.3%) and Grm3 by OLs (75.5 ± 5.6%; Figure 2b). Interestingly, in the optic nerve these two types of metabotropic receptors were shown to be protective for OLs in neuropathologies involving excitotoxicity and ischemia (Butt, Vanzulli, Papanikolaou, De La Rocha, & Hawkins, 2017); therefore, we hypothesize that such increased levels of Grm5 in NG2 glia and Grm3 in OLs might be protective. Hyperpolarization‐activated cyclic nucleotide‐gated (Hcn) channel subunit 2 was highly expressed in a large number of OLs. Notomi and Shigemoto found HCN2‐immunopositivity in a type of perineuronal OLs that are in the gray matter close to the neuronal perikarya (Notomi & Shigemoto, 2004). However, to the best of our knowledge, there are no reports on HCN2 functioning in mature OLs. Nevertheless, they might participate in setting the V m to more positive values, like in NG2 glia or astrocytes (Battefeld, Klooster, & Kole, 2016; Honsa et al., 2012).
Since we isolated the gray matter (CTX) and the white matter (CC) of the brain, we compared NG2 glia and OLs in these two regions. Based on our single‐cell RT‐qPCR analyses, which comprised 95 genes, we found only subtle differences between CTX and CC—neither in the case of NG2 glia nor in the case of OLs. In cortical NG2 glia, the expression of two genes of the Wnt signaling pathway (Fzd8, Axin2) and AMPA receptor subunit Gria2, was up‐regulated (Figure 2c) when compared to the white matter NG2 glia. The cortical OLs expression of Grm6 and Hcn2 were up‐regulated (Figure 2c) compared to the white matter OLs. Similarly, within the two adult brain regions, Marques et al. were unable to identify specific subpopulations of OLs, but some OL populations were present throughout the brain and other OLs were enriched in certain regions (Marques et al., 2016).
3.2. The gene expression profiles of NG2 glia following CNS disorders
To compare NG2 glia heterogeneity following different pathophysiological conditions of the brain, we collected single cells 7 days after the induction of three different types of brain disorders: CTX after FCI (n = 127 cells), SW (n = 87 cells), and DEMY (n = 93 cells) and CC after DEMY (n = 88 cells). We merged all the cells from uninjured CTX (n = 75 cells) and CC (n = 80 cells) with their injured counterparts and performed SOM analyses, which revealed eight distinct cell subpopulations: four subpopulations of NG2 glia and four subpopulations of OLs (Figure 3a). Two subpopulations of NG2 glia were termed NG2 glia (S1) and NG2 glia (S2), characterized by a high percentage of cells expressing typical markers of NG2 glia, such as Cspg4 and Pdgfrα (Figure 4a,b). The expression pattern of these two groups was similar to NG2 glia from the uninjured brain, except for the fact that NG2 glia (S2) had a higher expression of several genes compared to the NG2 glia (S1). The difference is visible at the level of the percentage of cells expressing the given gene (Figure 4a,b). The most pronounced difference is the percentage of cells expressing Glul within each subpopulation, 67.2 ± 6.4% of NG2 glia (S2), compared to 19.0 ± 5.3% of NG2 glia (S1) (Figure 4a,b).
FIGURE 3.
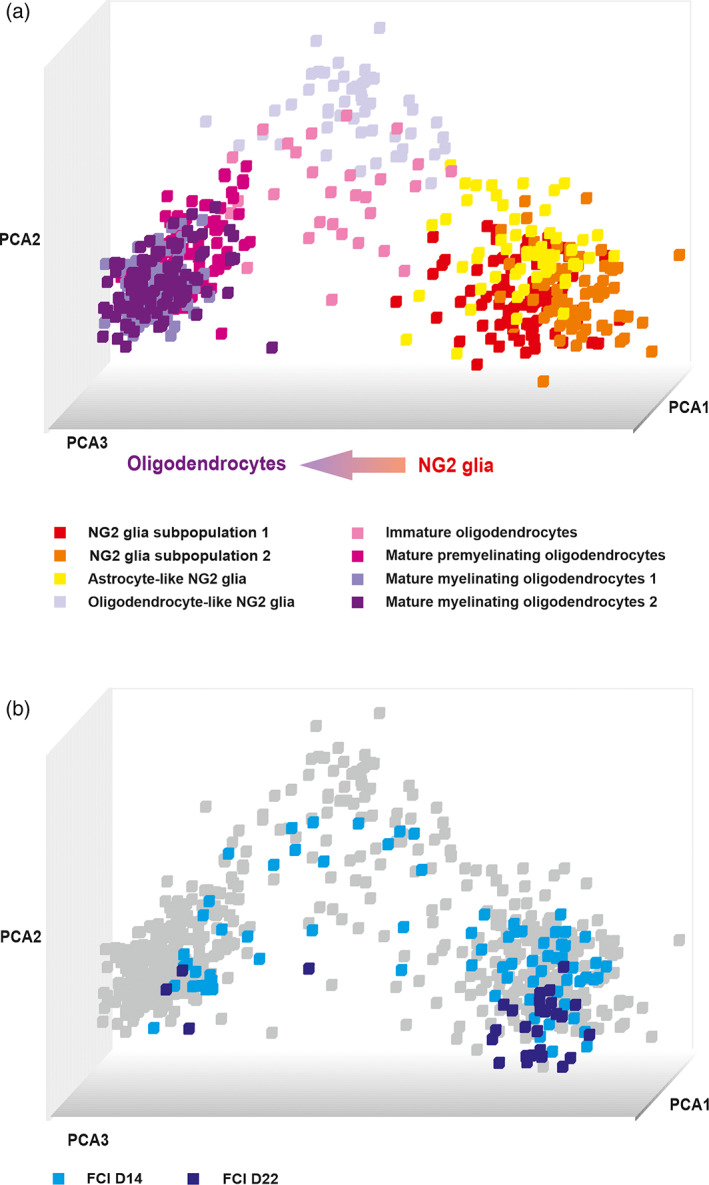
(a) Principal component analysis (PCA) showing the distribution of four subpopulations of NG2 glia and four subpopulations of oligodendrocytes 7 days after injury. (b) PCA showing the distribution of cells from two additional time points (14 and 22 days) after focal cerebral ischemia across the subpopulations of NG2 glia and oligodendrocytes. OLs, oligodendrocytes
FIGURE 4.
Four NG2 glia subpopulations identified using self‐organizing map analysis. (a) NG2 glia subpopulation 1, (b) NG2 glia subpopulation 2, (c) astrocyte‐like NG2 glia, and (d) oligodendrocyte‐like NG2 glia differ in the percentage of cells expressing genes or in gene expression levels (e). (a–d) Only genes, of whose expression is changed significantly (p < .05), are depicted, with the exception of the marker genes. (e) Asterisks show significance compared to the NG2 glia subpopulation 2. Hashtags show significances compared to the astrocyte‐like NG2 glia subpopulation. Dollar show significances compared to the oligodendrocyte‐like NG2 glia subpopulation. ***,###,$$$ p < .001. Statistics are calculated using multiple t test or two‐way ANOVA, comparing each subpopulation with each other. S, subpopulation
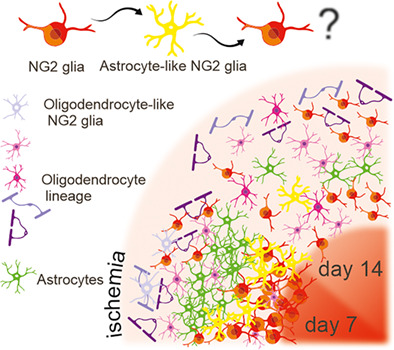
The third population of NG2 glia is a specific group of cells characterized by the highest number of cells expressing astroglial markers Gfap (37.5 ± 7.1%) and Vim (92.9 ± 1.2%; Figure 4c), and was further termed astrocyte‐like NG2 glia. These genes for intermediate filaments are typically upregulated in reactive astrocytes (Pablo, Nilsson, Pekna, & Pekny, 2013), which could highlight the astrogliogenic potential of these cells. In this subpopulation, the expression of Cspg4 and Pdgfrα is lower (4.8 ± 2.2 log2E and 9.3 ± 2.3 log2E, respectively) than in NG2 glia (S2) (6.8 ± 2.1 log2E and 11.2 ± 1.2 log2E, respectively; Figure 4e), which could also indicate differentiation to astrocytes. When NG2 glia differentiate to OLs, they gradually lose the expression of Cspg4 and Pdgfrα, and enter an intermediate pro‐oligodendrocyte stage before finally expressing the markers of mature OLs (Polito & Reynolds, 2005). Astrocyte‐like NG2 glia display a decreased percentage of cells expressing Grm5 (53.6 ± 5.7%) and its expression level is also reduced (3.1 ± 0.4 log2E), the opposite to NG2 glia (Figure 4c). Both NG2 glia (S2) and astrocyte‐like NG2 glia subpopulations are characterized by a high expression of Dcx (55.2 ± 7.0% and 67.9 ± 7.0%, respectively), mentioned above as a marker of cell motility (Figure 4b,c). Moreover, astrocyte‐like NG2 glia are characterized by their proliferation potential as this subpopulation has the highest percentage of cells expressing MKi67 (39.3 ± 7.0%), a marker of proliferation (Figure 4c), and its highest expression (3.1 ± 0.6 log2E) when compared to all subpopulations (Figure 4e). This suggests that astrocyte‐like NG2 glia retain the ability to proliferate differing to oligodendrogliogenesis, where this ability is lost (Hassannejad et al., 2019).
The fourth subpopulation is oligodendrocyte‐like NG2 glia, characterized by a high percentage of cells expressing oligodendrocyte‐committed genes, such as Mbp (98.0 ± 3.8%), Cldn11 (100.0 ± 0.0%), and Tcf7l2 (100.0 ± 0.0%) and a lower percentage of NG2 glia‐committed genes, such as Cspg4 (28.6 ± 5.4%) and Pdgfrα (8.2 ± 3.7%; Figure 4d). Interestingly, some astrocyte‐like NG2 glia expressed Mbp (39.3 ± 4.7%), Cldn11 (80.4 ± 8.5%), and Tcf7l2 (76.8 ± 4.9%; Figure 4c, d) but their expression was much lower (Mbp, 1.8 ± 0.3 log2E; Cldn11, 4.9 ± 0.4 log2E; Tcf7l2, 5.71 ± 0.5 log2E) than in oligodendrocyte‐like NG2 glia (Mbp, 11.6 ± 0.4 log2E; Cldn11, 10.2 ± 0.3 log2E; Tcf7l2 11.2 ± 0.3 log2E; Figure 4e). In oligodendrocyte‐like NG2 glia, we found a decreased expression of Grm5 (10.2 ± 4.0%; Figure 4e), while Grm3 expression was not detected (Table S2). Another feature of this subpopulation is the expression of Trpv4, which was also described by Marques et al. in committed OPC (Marques et al., 2016; Figure 4d).
The distribution of the four NG2 glia subpopulations varied among the regions of the uninjured brain, as well as in response to pathological stimuli. The proportion of the two subpopulations of NG2 glia between CTX and CC is already significantly different in the uninjured brain. There is a large number of NG2 glia (S2) that has a higher expression of several genes than NG2 glia (S1), differing to that in CC (Figure 5a). Oligodendrocyte‐like NG2 glia are equally distributed in the gray (CTX) and white (CC) matter and no astrocyte‐like NG2 glia are present in the uninjured brain (Figure 5a). Interestingly, astrocyte‐like NG2 glia represent the prevailing subpopulation (48.5 ± 8.5%) after FCI, at the expense of NG2 glia (S1) and (S2). With regard to the DEMY CTX two transitions states, namely oligodendrocyte‐ and astrocyte‐like NG2 glia, these disappear completely, and we found only a few transitions of NG2 glia in DEMY CC (Figure 5a). In the case of SW, the distribution is similar to its corresponding CTRL (Figure 5a).
FIGURE 5.
(a) Distribution of four subpopulations of NG2 glia and (b) four subpopulations of oligodendrocytes is unequal in controls (CTRLs) and following injuries. Note that astrocyte‐like NG2 glia only become greatly emerged after focal cerebral ischemia (FCI). (c) Changes in the distribution of four subpopulations of NG2 glia and (d) four subpopulations of oligodendrocytes at different time points after focal cerebral ischemia. Statistics were calculated using two‐way ANOVA, comparing incidences of a particular subpopulation among groups. The percentage of subpopulations was calculated as an average of the percentage from different mice. In the case of “a”, asterisks show significances between CTRLs. In the case of “b”, asterisks show significance compared to CTRL and hashtags show significances compared to FCI. *p < .05; ## p < .01; ***p < .001. CC corpus callosum; CTX, cortex; DEMY, demyelination; OLs, oligodendrocytes; SW, stab wound
In order to determine whether FCI‐specific astrocyte‐like NG2 glia is a permanent or transient subpopulation within NG2 glia subpopulations, we performed a single‐cell RT‐qPCR analysis 14 and 22 days after FCI (Figure 3b). This subpopulation was still present 14 days after FCI, but with a decreasing tendency (Figure 5c). In the late stages (22 days), astrocyte‐like NG2 glia were not observed which was in favor of NG2 glia (S2) (Figure 5c).
3.3. Different oligodendrocyte subpopulations after CNS injuries
Besides the NG2 glia subpopulations, we also identified four subpopulations of OLs. We classified them based on previous findings (Guo et al., 2015; Valny et al., 2018) as immature OLs, mature premyelinating OLs, and two subtypes of mature myelinating OLs (1 and 2; Figure 6). The first two groups of OLs have the residual expression of Cspg4 and other genes typical for NG2 glia, such as Grm5, Axin2, and Gria3 (Figure 6a,b). Interestingly, in immature OLs, only 77.4 ± 6.6% cells expressed Mbp and 71.0 ± 8.8% cells expressed Cldn11 unlike oligodendrocyte‐like NG2 glia (Mbp 98.0 ± 3.8%, Cldn11 100.0 ± 0.0%; Figure 6a; Figure 4d). Additionally, there was a relatively lower incidence of cells expressing Glul and Grm3 (including their expression levels) within immature OLs (Figure 6a,e). The tendency is that the expression pattern of these genes within OLs subpopulations increases (Figure 6e) with the progressing maturation of OLs. The number of cells expressing the gene of Shh signaling Ptch1 increases with the maturation of OLs (Figure 6). Shh signaling is implicated in controlling both the generation of OLs during embryonic development, and their production in adulthood (Loulier, Ruat, & Traiffort, 2006; Wang & Almazan, 2016). The need for the Shh genes in the OL lineage is due to Shh signaling not only being involved in differentiation but also in OL branching once they are mature (Wang & Almazan, 2016), and it is a necessary factor playing a positive role during demyelination/remyelination (Ferent, Zimmer, Durbec, Ruat, & Traiffort, 2013). Thus, an increased transcription of suppressor receptor Ptch1 in mature myelinating OLs 2 suggests that the Shh pathway is no long needed. The Hcn2 gene could serve as an indicator at the stage of OL differentiation. This gene is barely expressed in immature and premyelinating OLs (0.7 ± 0.4 log2E; 0.5 ± 0.2 log2E), while in the both mature stages it is highly expressed (8.5 ± 0.2 log2E; 9.6 ± 0.2 log2E; Figure 6a–e). Moreover, the number of cells expressing the subunits of AMPA receptors, Gria2 and Gria3, gradually decreases with OLs maturation. The exception is that within the subpopulation of mature myelinating OLs 2, a relatively high number of cells express Gria2 (35.0 ± 6.4%) compared to the mature myelinating OLs 1 (Figure 6c,d). This is one of the characteristics of mature myelinating OLs 2 which distinguishes them from mature myelinating OLs 1, as comparably described by Valny and colleagues (Valny et al., 2018). The overexpression of Gria2 stimulates the transcriptional activities linked to myelin formation, even in the absence of injury (Khawaja et al., 2021). Moreover, Ca2+‐permeable AMPA receptors were shown to mediate ischemia‐induced excitotoxic damage in OLs (Dewar, Underhill, & Goldberg, 2003; Leuchtmann, Ratner, Vijitruth, Qu, & McDonald, 2003; McDonald et al., 1998). This suggests that the upregulation of Gria2 can be beneficial to OL repair in pathology, and it protects them from Ca2+ overloading. Another difference between the two mature subpopulations was observed in the expression and the number of cells expressing kainate receptor subunit Grik5 (Figure 6c–e), making them vulnerable to glutamate excitotoxicity (Alberdi, Sánchez‐Gómez, Marino, & Matute, 2002; Sanchez‐Gomez, Alberdi, Perez‐Navarro, Alberch, & Matute, 2011). The role of another highly expressed subunit of glutamate receptors, Grm7 (Figure 6e), which is known to be involved in the regulation of proliferation, remains elusive in mature OLs 2 as they are apparently terminally differentiated (Xia, Liu, & Jiao, 2015). Unlike NG2 glia subpopulations, the distribution of OL subpopulations was comparable between the gray and white matter (Figure 5b). Following FCI, no premyelinating OLs were present, but there was a significantly higher incidence of immature OLs (Figure 5b). This was in contrast to DEMY in CTX and following cortical SW, where the immature subpopulation of OLs was barely present (Figure 5b). This might be due to the various rates of remyelination caused by the different severity of injury. This idea is supported by data from the later stages following FCI where premyelinating OLs appeared after 14 days, and after 22 days, the proportion of OL subpopulations was similar to that from CTRL CTX (Figure 5d).
FIGURE 6.
Four oligodendrocyte (OLs) subpopulations identified using self‐organizing map analysis. (a) Immature OLs, (b) mature premyelinating OLs, (c) mature myelinating OLs 1 and (d) mature myelinating OLs 2 differ in the percentage of cells expressing genes or differ in gene expression levels (e). (a–d) only genes, where expression is changed significantly (p < .05), are depicted, with the exception of the marker genes. (e) Asterisks show significance compared to the immature OLs. Hashtags show significances compared to the mature premyelinating OLs. Dollar show significances compared to the mature myelinating OLs 1. ***,###,$$$ p < .001. Statistics were calculated using multiple t‐test or two‐way ANOVA, comparing each subpopulation with each other
3.4. The immunohistochemical identification of NG2 glia progeny following CNS injuries
To further verify the phenotypic differences of identified tdTomato+ subpopulations we stained uninjured brains, and those following FCI, SW, or DEMY, against the combinations of cell‐type‐specific markers, such as GFAP, AlDH1L1 (astrocytes) and, APC, the cell‐body marker of OLs and proliferation markers (PCNA, KI67). The overlap of signals from tdTomato with an appropriate marker (Figures 7 and 8), was detected in the depicted areas of the brain (Figure 2a). To assess proliferation rate of NG2 glia, we employed two frequently used markers, PCNA and KI67. According to PCNA staining, proliferation was increased in response to each type of injury, when compared to the corresponding CTRL. The highest number of proliferating cells was in the CTX and CC, following DEMY (Figure 7a). Interestingly, KI67 staining showed different results. The proliferation was only increased in the blood–brain‐barrier‐damaging CNS disorders (FCI and SW,) and not in DEMY (Figure 7b). NG2 glia differentiation into OLs is very well known. Notably, the most pronounced oligodendrogliogenesis was detected in the CTX after SW (24.5 ± 2.4%), while following FCI and DEMY, it was comparable with the CTRL (Figure 7c). As we expected, oligodendrogliogenesis differs between the brain regions in the CTRLs, as well as after DEMY; it is much higher in white matter than in the gray matter (Figure 7c). We used immunohistochemistry to confirm that astrocyte‐like NG2 glia only arise after FCI. We clearly showed that tdTomato/GFAP+ cells are only present after FCI in a higher number (31.4 ± 1.9%), compared to the CTRLs or the other types of injury (Figure 8a). These cells were mainly located on the border of ischemia between NG2 glia and astrocytes (Figure 8a) in the close vicinity of the lesion, as already observed by Valny et al. (Valny et al., 2018). Another astrocytic marker, ALDH1L1, did not confirm the increased number of astrocyte‐like NG2 glia (Figure 8c), however, other studies showed that GFAP+ cells may not necessarily be positive for ALDH1L1 (Hackett et al., 2018). For that reason, we used another very typical marker of reactive astrocytes‐VIM, which was also increased following FCI, but to a lesser extent than that of GFAP (Figure 8d). To validate the single‐cell RT‐qPCR results from the later stages following FCI (Figure 5c) we also conducted double‐labeling for tdTomato/GFAP mice at 14 and 22–30 days after FCI. We already observed a GFAP immunoreactivity decay at 14 days (Figure 8b). This suggests that astrocyte‐like NG2 glia represent a transient subpopulation unique to FCI. In summary, NG2 glia only form astrocyte‐like NG2 glia following severe ischemic damage, while cortical SW or DEMY are not able to evoke such NG2 glia multipotency.
FIGURE 7.
Graphs showing the percentage of tdTomato+ cells expressing a given marker, and their representative images depicting the co‐localization of proliferation and oligodendrocyte markers under physiological and pathological conditions. (a) Showing tdTomato+ NG2 glia expressing proliferating cell nuclear antigen (PCNA), (b) showing tdTomato+ NG2 glia expressing proliferation marker KI67, (c) showing tdTomato+ NG2 glia expressing oligodendroglial marker, adenomatous polyposis coli (APC). (a–c) Arrows indicate the co‐localization of green and red signals. Statistics were calculated using one‐way ANOVA. Asterisks show significance compared to the corresponding control (CTRL) unless otherwise indicated. Hashtags show significances between CTRLs (CTX, CC). *,# p < .05; **p < .01; ***,### p < .001. Scale bars, 50 μm. CC corpus callosum; CTX, cortex; DEMY, demyelination; FCI, focal cerebral ischemia; SW, stab wound
FIGURE 8.
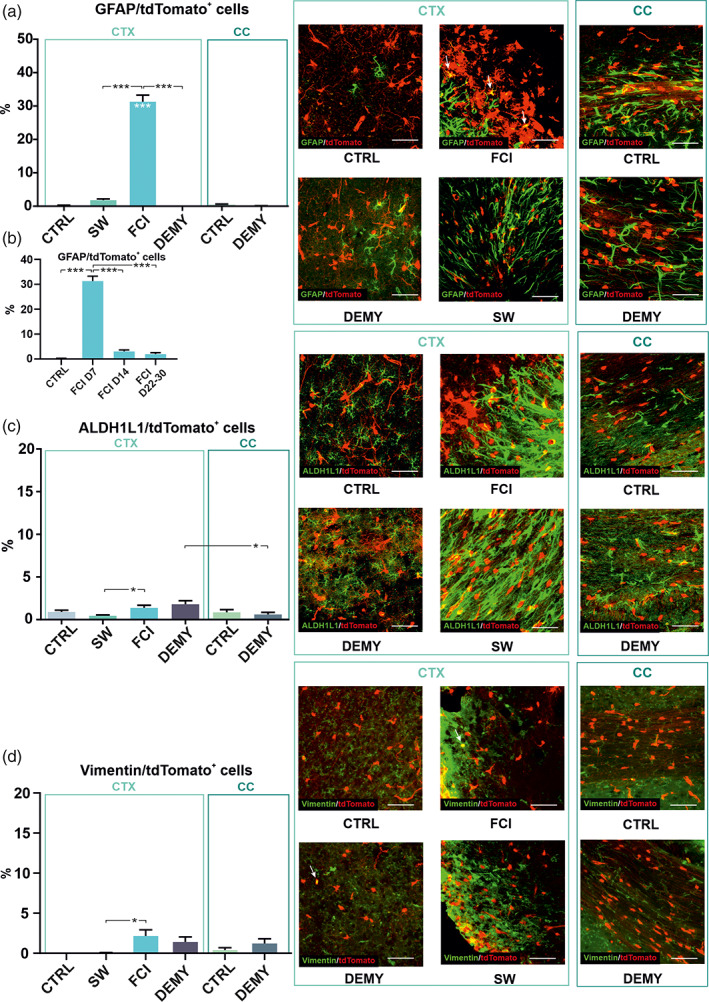
Graphs showing the percentage of tdTomato+ cells expressing a given marker and their representative images depicting the co‐localization of astrocyte markers under physiological and pathological conditions. (a, b) Showing tdTomato+ NG2 glia expressing astrocyte markers glial fibrillary acidic protein (GFAP), (c) aldehyde dehydrogenase 1 family member L1 (ALDH1L1) and (d) vimentin (VIM). (a–d) arrows indicate the co‐localization of green and red signals. Statistics are calculated using one‐way ANOVA. Asterisks show significances compared to the corresponding CTRL unless otherwise indicated. *p < .05; ***p < .001. Scale bars, 50 μm. CC corpus callosum; CTRL, control; CTX, cortex; DEMY, demyelination; FCI, focal cerebral ischemia; SW, stab wound
3.5. Astrocyte‐like NG2 glia features
To characterize astrocyte‐like NG2 glia on a genome‐wide level, we performed a single‐cell RNA‐seq experiment using Cspg4/tdTomato mice. We analyzed three uninjured (CTRL) and three postischemic mice (day seven) using high‐throughput platform Chromium Single‐Cell Gene Expression. NG2 glia and astrocytes were enriched using FACS selection of tdTomato+ and ACSA‐2+ cells, a recently identified marker of astrocytes (Kantzer et al., 2017). Single‐ and double‐positive populations were collected and analyzed. In total, we acquired a single‐cell transcriptome of 4634 cells (1656 in CTRLs and 2978 in ischemic animals). The preliminary analysis identified clusters of various cell types. Some of them were expected, for example, various maturation stages of OLs or Cspg4+ pericytes, other were rather surprising, for example, clusters composed of myeloid or vascular cells. For further analysis, we only selected cells expressing typical NG2 glia and astrocyte markers, resulting in 1134 cells. Unfortunately, we only collected seven NG2 glia in the CTRL animals, where the majority of tdTomato+ cells were identified as pericytes, therefore we further limited our analysis only to cells under ischemic conditions (549 cells).
In the ischemic animals, we identified four cell clusters (Figure 9a). Two clusters expressed typical markers of NG2 glia and astrocytes (Figure 9b), whereas the remaining two represented separate subpopulations sharing the expression of both cell type markers (Figure 9b). It was noted that both subpopulations demonstrated a similar level of Gfap expression (Figure 9b) as well as the percentage of Gfap + cells, compared to astrocytes, and a similar expression level and positivity of the Cspg4 gene, in comparison to NG2 glia (Figure 9b). To characterize these transient subpopulations, we performed a DE analysis identifying 288 and 353 marker genes that were upregulated in the subpopulations (fold change >2, adjusted p value <.05, Table S3).
FIGURE 9.
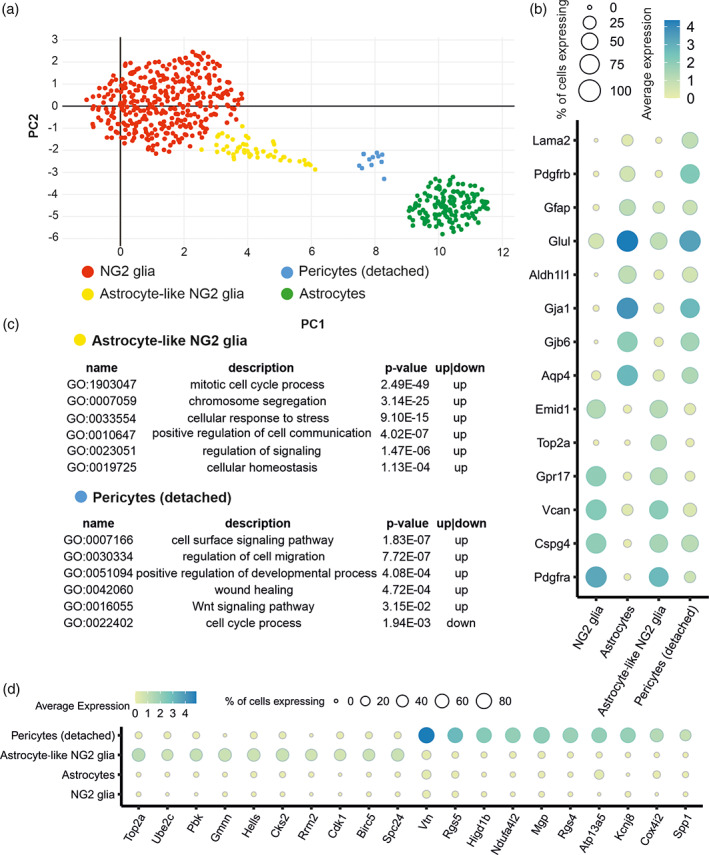
Single‐cell RNA‐Seq analysis of NG2 glia and astrocytes 7 days following focal cerebral ischemia. (a) Uniform manifold approximation and projection (UMAP) visualization of 549 cells expressing markers of NG2 glia and/or astrocytes; (b) marker genes of astrocytes, NG2 glia, astrocyte‐like NG2 glia and pericytes (detached); and (c) functional annotation of two transient subpopulations—astrocyte‐like NG2 glia and pericytes (detached)—shown selection of representative GO terms (Fisher's exact test). (d) Expression of canonical markers of NG2 glia, astrocytes, astrocyte‐like NG2 glia and pericytes
The first transient subpopulation we termed as pericytes (detached; 15 cells) because, in addition to Gfap and Cspg4 expression, this subpopulation showed a high expression of genes typically found in pericytes (e.g., Vtn, Rgs5; Figure 9d). These were characterized by the positive regulation of the cell migration, angiogenesis, and wound healing (Figure 9c). We speculate that these cells represent a unique population of pericytes, which migrate into the ischemic lesion and differ from classic pericytes, which are attached to the capillaries and venules (Figure 9b). Notably classic pericytes were removed from the analysis during the preprocessing steps, so we may assume that this is a unique population of pericytes sharing the expression of some typical astrocytic genes (Aqp4, Gjb6, Aldh1l1; Figure 9b). Interestingly, a recent report studying the role of pericytes in fibrotic scarring, identified a population of pericytes displaying a distinctive morphology that was located close to the glial‐fibrotic lesion (Dias et al., 2020). We suggest that the close vicinity of astrocytes and pericytes at the ischemic border may initiate transcriptional changes, making pericytes similar to astrocytes. However, the validity of this hypothesis needs to be confirmed by additional studies.
The second transient subpopulation was identified as astrocyte‐like NG2 glia (50 cells), because they shared typical markers of both astrocytes (Gfap, Glul, Gja1, Aqp4, Gjb6; Figure 9B) and NG2 glia (Cspg4, Pdgfrα; Figure 9b). Moreover, within the 10 top DE genes of astrocyte‐like NG2 glia population, there are genes typical for NG2 glia (Ube2c, Rrm2, Pbk, Birc5, Spc24), and also genes typical for astrocytes (Top2a, Hells; Figure 9d; Cahoy et al., 2008; Zhang et al., 2014). Furthermore, the list of top10 DE genes in the astrocyte‐like NG2 glia included genes associated with the cell cycle and mitosis (e.g., Top2a, Cdk1; Figure 9d). Interestingly, this population differentially expressed Kcne1, encoding the accessory subunits of acetylcholine‐inhibited channels, Kcnq1 and Kcnq4, which has already been identified as a typical marker of astrocytes (Cahoy et al., 2008; Table S3). Moreover, this subpopulation may respond to intracellular Ca2+ signals because the cells express S100a10, a Ca2+‐binding protein that generally modulates cellular target proteins. It is known to be expressed in multiple neuronal cell types, but the group of Milosevic showed that S100a10 is expressed by astrocytes and a small population of NG2 glia (Milosevic et al., 2017). To gain a deeper insight into the role of the two transition populations, we performed gene over‐representation analysis (Table S3). The analysis revealed the upregulation of processes associated with mitotic cell cycle division and chromosome segregation in astrocyte‐like NG2 glia (Figure 9c). These data accord well with our recent work, which showed that up to 75% of NG2 glia have to undergo cell division before they start to express markers of astrocytes, including the production of GFAP protein (Valny et al., 2018). Additionally, this subpopulation is characterized by upregulated processes of cellular homeostasis, a regulation of signaling, and a positive regulation of cell–cell communication (Figure 9c).
3.6. The electrophysiological characteristics of astrocyte‐like NG2 glia
Based on the RNA‐seq data, we found that astrocyte‐like NG2 glia is a specific and distinct subpopulation of NG2 glia, only arising after FCI. Therefore, it was of interest to determine the electrophysiological properties of astrocyte‐like NG2 glia 7 days after FCI. Here, we cross‐bred Cspg4/tdTomato mice with Gfap/EGFP mice, which enabled the measurement of astrocytes (EGFP+ cells), NG2 glia (tdTomato+ cells), and astrocyte‐like NG2 glia (EGFP+/tdTomato+ cells; Figure 1b). The membrane currents were recorded from all the above‐mentioned cells at the ischemic lesion border (CTX) of adult mice, using the patch‐clamp technique in the whole‐cell configuration. The predicted electrophysiological recordings revealed a complex current pattern typical of NG2 glia, that is, they displayed K DR, K A, and K IR currents (Honsa et al., 2012; Schools, Zhou, & Kimelberg, 2003). Their average V m was −71.9 ± 3.5 mV (n = 9), IR was 160.2 ± 41.6 MΩ, and C m was 8.1 ± 1.0 pF. The current densities were 14.7 ± 3.0 pA/pF for K IR currents, 28.7 ± 8.3 pA/pF for K DR currents, and 50.6 ± 14.3 pA/pF for K A currents (Figure 10a). In general, ischemic astrocytes elicit predominantly time‐ and voltage‐independent currents. This type of membrane current, carried primarily by K+ ions, has been shown to be typical of mature astrocytes (Pivonkova, Benesova, Butenko, Chvatal, & Anderova, 2010; Wallraff, Odermatt, Willecke, & Steinhäuser, 2004; Zhou, Schools, & Kimelberg, 2006). Their average V m was −75.3 ± 3.3 mV (n = 8), IR was 115.5 ± 34.9 MΩ and C m was 8.4 ± 1.2 pF. The current densities were 5.6 ± 1.9 pA/pF for K IR currents, and 2.4 ± 1.4 pA/pF for KDR currents (Figure 10c). Astrocyte‐like NG2 glia membrane currents resulted in a shift between the current pattern of NG2 glia and astrocytes (Figure 10b). Their passive membrane properties did not significantly differ from NG2 glia/astrocytes after FCI. However, they had considerably reduced K IR (3.5 ± 0.8 pA/pF), KDR (4.2 ± 1.1 pA/pF) and K A (0.2 ± 0.2 pA/pF) current densities, when compared to NG2 glia, while they did not differ from those obtained in cortical astrocytes (Figure 10b).
FIGURE 10.
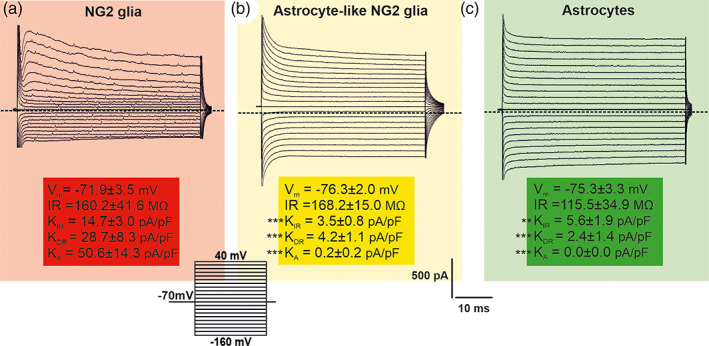
Current patterns of NG2 glia, astrocyte‐like NG2 glia, and astrocytes 7 days after focal cerebral ischemia (FCI). Typical current patterns of (a) NG2 glia, (b) astrocyte‐like NG2 glia, (c) and astrocytes were obtained by hyper‐ and depolarizing the cell membrane from the holding potential of −70 mV to the values ranging from −160 to 40 mV, in 10 mV increments (see the inset, bottom). Zero current is marked by the dashed line. Statistics were calculated using one‐way ANOVA. Asterisks show significances compared to NG2 glia, **p < .01; ***p < .001
4. DISCUSSION
The capacity of NG2 glia to proliferate and differentiate into other cell types has been extensively investigated in several genetically modified mice (Aguirre & Gallo, 2004; Guo, Ma, McCauley, Bannerman, & Pleasure, 2009; Huang et al., 2014; Huang et al., 2018; Huang et al., 2019; Kang et al., 2010; Zhu et al., 2008; Zhu et al., 2011). It is generally accepted that NG2 glia are restricted to the OL lineage (Kang et al., 2010; Zawadzka et al., 2010), but numerous reports describe their differentiation into astrocytes (Dimou et al., 2008; Honsa et al., 2012; Honsa et al., 2016; Huang et al., 2014; Huang et al., 2019). However, the majority of such studies only focuses on one type of injury, such as ischemia (Honsa et al., 2012), cortical SW (Komitova et al., 2011), or a demyelinating injury (Zawadzka et al., 2010). Therefore, it is difficult to compare these studies when using various types of cre transgenic mice, different modes of TX administration, and identify different cell types. In this study, we analyzed NG2 glia and the cells derived from them, under physiological and pathological conditions in Cspg4/tdTomato mice. This approach allowed us to compare NG2 glia heterogeneity after different types of CNS disorders (FCI, SW, DEMY), without any inter‐lab variability. Four subpopulations of NG2 glia and four subpopulations of OLs that differed according to the region of the brain or type of injury, were identified. In this study, we have proven that the unique subpopulation of astrocyte‐like NG2 glia only emerges following FCI, while these cells appear in negligible numbers following SW and DEMY. Using the RNA‐Seq and patch‐clamp technique, we characterized astrocyte‐like NG2 glia as cells which are very active in the cell cycle, and display a current pattern similar to that observed in cortical astrocytes. Our findings suggest that astrocyte‐like NG2 glia may represent important players in glial scar formation and the CNS repair process. For the reason that astrocytes do not migrate towards lesion and only a limited number of astrocytes divide (Sofroniew & Vinters, 2010), astrocyte‐like NG2 glia could temporarily perform the functions of astrocytes in the vicinity of the lesion. Moreover, recent studies have shown that proliferating NG2 glia participate in the first steps of tissue remodeling and healing following acute injury in the brain and the ablation of these cells delays wound closure (Streitberg et al., 2021). Even though the astrocyte‐like NG2 glia are only present for a limited time, the early response of this fast‐reacting cell type might contribute to the first cellular scaffold built, and be crucial for the later healing.
4.1. NG2 glia and oligodendrocytes in the uninjured brain
The difference between NG2 glia and OLs starts on the gene expression level. Many studies described a transcriptional continuum between OL populations and their marker genes (Marques et al., 2016; Marques, van Bruggen, & Castelo‐Branco, 2019). Our present study is in accordance with the very well‐known expression of classic marker genes (Cspg4, Pdgfra, Mbp, Cldn11), but suggests the reevaluation of genes that are considered to be marker genes of astrocyte (Glul, Slc1a3, and Slc1a2). We also proposed Hcn2 as the other typically expressed gene in mature myelinating OLs, however, to the best of our knowledge there are no reports on Hcn2 functioning in OLs. We confirmed that OL lineage cells, at all stages, express glutamate receptors, enabling them to sense and respond to neuronal activity (Spitzer et al., 2016). However, NG2 glia had the highest expression of subunits of ionotropic glutamate receptors compared to OLs, in accordance with other studies (De Biase et al., 2010).
4.2. Region‐specific differences of NG2 glia
Whether NG2 glia represent regionally distinct cell populations is still controversial but regardless, NG2 glia differ in their capability to differentiate into myelinating OLs. For example, NG2 glia from the CC differentiate into myelinating OLs more efficiently than NG2 glia from the CTX (Viganò, Möbius, Götz, & Dimou, 2013). In line with this, the electrophysiological studies reported that NG2 glia start out as a homogeneous population but become functionally heterogeneous, depending on both the brain regions as well as aging (Chittajallu, Aguirre, & Gallo, 2004; Spitzer et al., 2019). It seems that NG2 glial regional heterogeneity is determined by environmental factors rather than being solely regulated by the intrinsic mechanisms or developmental stages (Spitzer et al., 2019). In agreement with the recent work of Marques and coauthors (Marques et al., 2016), we found hardly any differences in the transcriptional profile on NG2 glia between CTX and CC (Figure 3a). However, after merging all the cells from the uninjured and injured brain, we identified four subpopulations; one of them (NG2 glia S1) was not equally distributed between these two regions. Based on our findings (Figure 4a) and previous findings from Castelo‐Branco's group (Marques et al., 2018), we consider NG2 glia (S1) less mature when compared to NG2 glia (S2), because they display reduced expression levels in the 20 genes. Interestingly, the incidence of NG2 glia (S1) was significantly higher in the CC, which was not the case in the CTX (Figure 5a). Since it is well known from previous studies that NG2 glia from white matter have a shorter cell cycle and faster differentiation into OLs compared to NG2 glia from gray matter (Young et al., 2013), we hypothesize that the different level of expression of these genes, between NG2 glia subpopulations in the CTX and CC, could serve for predicting their future fate. Thus, a decreased expression of given genes in NG2 glia (S1) may indicate a shorter cell cycle and suitability for differentiation into OLs, despite the fact that they still do not present OL markers.
4.3. The formation of a transient subpopulation of astrocyte‐like NG2 glia occurs following focal cerebral ischemia
Three out of four subpopulations of NG2 glia were always present in the uninjured, as well as in the injured, brain. Since a specific subpopulation of astrocyte‐like NG2 glia, which emerges following FCI, was already reported in our previous publications (Honsa et al., 2016; Valny et al., 2018) here we clearly state that astrocyte‐like NG2 glia represent a unique, FCI‐specific subpopulation. It is neither present in the other two types of injuries (DEMY, SW), nor in neurodegenerative diseases such as Alzheimer's disease (Valny et al., 2018). The subpopulation of astrocyte‐like NG2 glia is not permanent and it disappears during the progression of glial scar, most likely in favor of NG2 glia subpopulation 2. Nevertheless, it suggests that for a certain period following ischemia, NG2 glia are multipotential and represent, together with astrocytes, crucial players in postischemic regeneration. Some studies demonstrated that NG2 glia can differentiate into reactive astrocytes in addition to their proliferation potential (Dimou et al., 2008; Honsa et al., 2016; Huang et al., 2014; Huang et al., 2018; Komitova et al., 2011), but none of them compared their astrocytic differentiation potential among different types of injuries which would elucidate whether this phenomenon is injury‐specific. It has still not been clarified what factors contribute to the differential switch of NG2 glia towards the astrocytic phenotype. Our previous studies suggested Sonic hedgehog as a potential modulator (Honsa et al., 2016), however, additional studies are needed to understand the reprogramming of NG2 glia from oligodendrogenesis to astrogliogenesis. Since massive astrogliosis and inflammation occur following ischemia and have a great impact on the repair processes (Magaki, Williams, & Vinters, 2018), we hypothesize that the immune response, together with astrogliosis, may only initiate NG2 glia transient increase of astrocytic markers in severe types of CNS injuries. Recent findings show that bone morphogenic protein, which is secreted by astrocytes, inhibits the generation of myelinating OLs, and promotes differentiation into the astrocyte phenotype (Magaki et al., 2018). Moreover, neuroinflammatory factor interferon‐γ prevents NG2 glia from generating OLs, and leads to an increased tendency to generate astrocytes (Tanner, Cherry, & Mayer‐Pröschel, 2011). Astrocyte‐like NG2 glia, characterized by a high expression of reactive (Vim, Gfap), proliferation (MKi67), and motility (Dcx) markers 7 days following ischemia, indicate that NG2 glia significantly contribute to the glial scar formation prior to the generation of OLs 14 and 22 days following FCI. It is not clear why cortical SW, which also leads to marked astrogliosis and microglia activation, does not result in a similarly increased number of astrocyte‐like NG2 glia. A possible explanation for their unique generation following ischemia may dwell from the diverse concentrations of extracellular glutamate/K+, that occur during FCI and SW (Anderová et al., 2004; Hansen, 1978) and may result in a diverse severity of these CNS injuries.
4.4. Oligodendrocytes derived from NG2 glia
Oligodendrogliogenesis is the most noted feature of NG2 glia and therefore, OLs and their different stages of maturation are an integral part of NG2 glia differentiation. We detected four subpopulations of OLs in the uninjured and injured mouse brain. These types of cells cease to express genes typical of NG2 glia and start to express typical markers of OLS. Additionally, OLs start to express a variety of genes such as Glul, Grm3, and Hcn2. These genes have a great predisposition to become an indicator of OL maturation, apart from the classic markers. The distribution of these four OL subpopulations was comparable in the uninjured brain, which was not the case in the injured brain. The subpopulation of immature OLs was significantly higher after FCI, when compared to its corresponding CTRL (CTX), but also to DEMY CTX or SW. This suggests that the onset of the remyelination processes starts earlier after DEMY CTX and SW, unlike after FCI. It has been shown that proliferation/differentiation of NG2 glia in the cuprizone model of DEMY begins during the administration of cuprizone, and remyelination is completed approximately 4 days after its administration (Gudi, Gingele, Skripuletz, & Stangel, 2014). In contrast, proliferation and differentiation of NG2 glia only start 2–4 days after FCI (Zhang et al., 2010). For this reason, we suggest that there is a possible shift between the differentiation and final maturation of OLs among injuries.
4.5. Astrocyte‐like NG2 glia can be identified by immunohistochemistry
The different time window of proliferation and differentiation of NG2 glia is well documented by our immunohistochemical analyses. Employing a frequently used marker of proliferation KI67, we demonstrated that 7 days after injury, the proliferation is only increased after the blood–brain‐barrier‐damaging CNS disorders (FCI, SW), while no proliferation was detected after cuprizone‐induced DEMY. These results suggest an earlier proliferation of NG2 glia, which cannot be detected at 7 days after the withdrawal of the cuprizone diet, but is detectable following FCI and SW. Proliferation cell nuclear antigen staining showed results that do not correlate with KI67 staining. Based on the PCNA staining following all injuries, NG2 glia proliferate and, following DEMY, even more so after FCI and SW. The expression of KI67 and PCNA occurs during very similar phases of the cell cycle (G1/S), which makes them both good markers of cell proliferation. Nevertheless, the fundamental difference is that PCNA has an essential role in nucleic acid metabolism, as a component of the DNA replication and repair machinery (Essers et al., 2005; Juríková, Danihel, Polák, & Varga, 2016; Shivji, Kenny, & Wood, 1992). This marker therefore represents a less specific proliferation marker, due to its redundant role in the DNA repair. Thus, the immunohistochemical detection of PCNA may not only locate actively dividing cells, but also those undergoing DNA repair (Haneda et al., 1991), which explains the detection of this marker after all types of injury.
To inspect oligodendrogliogenesis, we used the cell‐body marker of OLs APC. The formation of new OLs following FCI and DEMY, did not change compared to their corresponding CTRLs. Nevertheless, in the uninjured brain there is a higher percentage of newly formed OLs in the CC, when compared to the CTX, and a similar trend was identified in these regions following DEMY. These findings correlate very well with the results of Baxi et al., who showed that the dynamics of NG2 glia differentiation varies significantly between white and gray matter. While NG2 glia rapidly repopulate white matter and mature into APC+ OLs, differentiation in the gray matter occurs much slower (Baxi et al., 2017). The higher percentage of new OLs derived from NG2 glia, surprisingly proved to be in SW. We have already shown that FCI and SW are incomparable injuries, with respect to the appearance of astrocyte‐like NG2 glia. A possible explanation for this is that following FCI, these cells develop at the expense of NG2 glia (S2), while in SW, where astrocyte‐like NG2 glia are not present, NG2 glia (S2) further differentiate towards a more advanced stage of oligodendrogenesis, specifically oligodendrocyte‐like NG2 glia. In addition, the fact that NG2 glia generate transient astrocyte‐like NG2 glia following FCI was confirmed on the protein level by immunohistochemical analysis using GFAP, ALDH1L1, and VIM markers. GFAP+ cells arising from NG2 glia were solely present after FCI, and these cells were not positive for another widely used marker, ALDH1L1, and only minimally for VIM. Even though this marker appears to be abundant in the large spectrum of astrocytes, it seems that not all GFAP+ astrocytes necessarily express ALDH1L1 (Hackett et al., 2018).
4.6. Astrocyte‐like NG2 glia are one of the players in the ischemic glial scar
The unique subpopulation of astrocyte‐like NG2 glia detected only after FCI has never been deeply explored, and the role of these cells still needs to be fully explained. Few studies have also reported on NG2 glia as positive for astrocyte markers. The expression of GFAP in astrocyte‐like NG2 glia could be a sign of their ability to create fully functional astrocytes. Therefore, using RNA‐Seq and the patch‐clamp technique, we aimed to reveal some of their properties and functions in the ischemic lesion.
The subpopulation of astrocyte‐like NG2 glia expressed typical markers for NG2 glia (Pdgfrα, Cspg4, Gpr17, Emid1) and astrocytes (Aqp4, Glul, Gja1, Gjb6). In addition, we also found genes that were typical of astrocytes within top10 DE genes, such as Top2a or Hells (Cahoy et al., 2008; Zhang et al., 2014 ). This list also clearly included genes typical for NG2 glia, such as Ube2c, Rrm2, Pbk, Birc5, Spc24 (Cahoy et al., 2008; Zhang et al., 2014). The differentially expressed genes of astrocyte‐like NG2 glia, suggest that this group of cells is highly involved in mitotic cell cycle division, chromosome segregation, and cellular stress response, which makes this subpopulation very active at the border of the ischemic lesion. A similar subpopulation, called OPC cycling, found by the Castelo‐Branco's group (Marques et al., 2018) had 18.4% of the genes in common with our astrocyte‐like subpopulation. One of the common genes is Gpr17, often associated with NG2 glia after injury. The subpopulation of NG2 glia expressing Gpr17 participates in the cell proliferation in the postacute stages after injury (Boda et al., 2011) and migrates towards the lesion; however, most of these cells remain undifferentiated (Bonfanti et al., 2017). Since the Gpr17 expression is downregulated when NG2 glia complete their final maturation, it could highlight its involvement in NG2 glia multipotency. Less pronounced but still significantly upregulated in astrocyte‐like NG2 glia, are the processes of positive regulation of cell communication, cell differentiation, and cell migration, suggesting that these cells play a key role in glial scar formation, together with astrocytes and classic NG2 glia. Astrocytes in the glial scar show a strong GFAP expression, obvious hypertrophy, and a certain degree of proliferation (He, Liu, & Chen, 2020). Similarly to astrocyte‐like NG2 glia, a series of stress reactions, including inflammatory reaction and cell division, are triggered after CNS injury, impairing astrocytic metabolism, which accelerates the aggregation, migration, and proliferation of reactive astrocytes (Mori et al., 2008; Zhu & Dahlström, 2007). Based on the MKi67 level, as well as its incidence in astrocyte‐like NG2 glia, we can conclude that they divide considerably (Valny et al., 2018) and, therefore, should be considered important contributors to the glial scar formation. Moreover, since these cells express Gfap, a key player in the formation of the glial scar (Nawashiro, Brenner, Fukui, Shima, & Hallenbeck, 2000), astrocyte‐like NG2 glia should be taken into consideration in the nervous tissue repair/regeneration via manipulating the glial scar.
Finally, we estimated the basic electrophysiological properties of astrocyte‐like NG2 glia and revealed that these cells display passive membrane properties and current patterns, that are comparable with those observed in cortical astrocytes. They have significantly reduced K DR, K IR, and K A current densities when compared to NG2 glia, while they do not differ from those obtained in cortical astrocytes. Interestingly, passive membrane properties of all three cell types were not significantly different. However, we cannot exclude the possibility that astrocyte‐like NG2 glia may have sets of ion channels participating in their passive conductance different from astrocytes, in which two‐pore domain K+ channels play an important role (Zhou et al., 2009). More detailed studies are needed to precisely characterize the electrophysiological properties of astrocyte‐like NG2 glia, as they may represent important cellular elements of postischemic tissue.
COnflict of Interest
The authors declare no conflict of interest.
Supporting information
APPENDIX S1: Supporting Information
Acknowledgments
The authors would like to thank Helena Pavlikova and Marketa Hemerova for their excellent technical assistance. We also thank Frances Zatrepalkova for manuscript editing. This study was supported by grants 20‐05770S and 19‐03016S from the Czech Science Foundation, and by the Institutional support, RVO 86652036, RVO 68378041 and BIOCEV CZ.1.05/1.1.00/02.0109.
Kirdajova, D. , Valihrach, L. , Valny, M. , Kriska, J. , Krocianova, D. , Benesova, S. , Abaffy, P. , Zucha, D. , Klassen, R. , Kolenicova, D. , Honsa, P. , Kubista, M. , & Anderova, M. (2021). Transient astrocyte‐like NG2 glia subpopulation emerges solely following permanent brain ischemia. Glia, 69(11), 2658–2681. 10.1002/glia.24064
Funding information Czech Science Foundation, Grant/Award Numbers: 19‐03016S, 20‐05770S
DATA AVAILABILITY STATEMENT
Data sharing is not applicable to this article as no new data were created or analyzed in this study.
references
- Aguirre, A. , & Gallo, V. (2004). Postnatal neurogenesis and gliogenesis in the olfactory bulb from NG2‐expressing progenitors of the subventricular zone. The Journal of Neuroscience: The Official Journal of the Society for Neuroscience, 24(46), 10530–10541. 10.1523/JNEUROSCI.3572-04.2004 [DOI] [PMC free article] [PubMed] [Google Scholar]
- Alberdi, E. , Sánchez‐Gómez, M. V. , Marino, A. , & Matute, C. (2002). Ca(2+) influx through AMPA or kainate receptors alone is sufficient to initiate excitotoxicity in cultured oligodendrocytes. Neurobiology of Disease, 9(2), 234–243. 10.1006/nbdi.2001.0457 [DOI] [PubMed] [Google Scholar]
- Anderová, M. , Antonova, T. , Petrík, D. , Neprasová, H. , Chvátal, A. , & Syková, E. (2004). Voltage‐dependent potassium currents in hypertrophied rat astrocytes after a cortical stab wound. Glia, 48(4), 311–326. 10.1002/glia.20076 [DOI] [PubMed] [Google Scholar]
- Anderová, M. , Kubinová, S. , Jelitai, M. , Neprasová, H. , Glogarová, K. , Prajerová, I. , … Syková, E. (2006). Transplantation of embryonic neuroectodermal progenitor cells into the site of a photochemical lesion: Immunohistochemical and electrophysiological analysis. Journal of Neurobiology, 66(10), 1084–1100. 10.1002/neu.20278 [DOI] [PubMed] [Google Scholar]
- Battefeld, A. , Klooster, J. , & Kole, M. H. (2016). Myelinating satellite oligodendrocytes are integrated in a glial syncytium constraining neuronal high‐frequency activity. Nature Communications, 7, 11298. 10.1038/ncomms11298 [DOI] [PMC free article] [PubMed] [Google Scholar]
- Baxi, E. G. , DeBruin, J. , Jin, J. , Strasburger, H. J. , Smith, M. D. , Orthmann‐Murphy, J. L. , … Calabresi, P. A. (2017). Lineage tracing reveals dynamic changes in oligodendrocyte precursor cells following cuprizone‐induced demyelination. Glia, 65(12), 2087–2098. 10.1002/glia.23229 [DOI] [PMC free article] [PubMed] [Google Scholar]
- Bergles, D. E. , Roberts, J. D. , Somogyi, P. , & Jahr, C. E. (2000). Glutamatergic synapses on oligodendrocyte precursor cells in the hippocampus. Nature, 405(6783), 187–191. 10.1038/35012083 [DOI] [PubMed] [Google Scholar]
- Boda, E. , Viganò, F. , Rosa, P. , Fumagalli, M. , Labat‐Gest, V. , Tempia, F. , … Buffo, A. (2011). The GPR17 receptor in NG2 expressing cells: Focus on in vivo cell maturation and participation in acute trauma and chronic damage. Glia, 59(12), 1958–1973. 10.1002/glia.21237 [DOI] [PubMed] [Google Scholar]
- Bonfanti, E. , Gelosa, P. , Fumagalli, M. , Dimou, L. , Viganò, F. , Tremoli, E. , … Abbracchio, M. P. (2017). The role of oligodendrocyte precursor cells expressing the GPR17 receptor in brain remodeling after stroke. Cell Death & Disease, 8(6), e2871. 10.1038/cddis.2017.256 [DOI] [PMC free article] [PubMed] [Google Scholar]
- Boulanger, J. J. , & Messier, C. (2017). Doublecortin in oligodendrocyte precursor cells in the adult mouse brain. Frontiers in Neuroscience, 11, 143. 10.3389/fnins.2017.00143 [DOI] [PMC free article] [PubMed] [Google Scholar]
- Buffo, A. , Vosko, M. R. , Erturk, D. , Hamann, G. F. , Jucker, M. , Rowitch, D. , & Gotz, M. (2005). Expression pattern of the transcription factor Olig2 in response to brain injuries: Implications for neuronal repair. Proceedings of the National Academy of Sciences of the United States of America, 102(50), 18183–18188. 10.1073/pnas.0506535102 [DOI] [PMC free article] [PubMed] [Google Scholar]
- Butt, A. M. , Vanzulli, I. , Papanikolaou, M. , de la Rocha, I. C. , & Hawkins, V. E. (2017). Metabotropic glutamate receptors protect oligodendrocytes from acute ischemia in the mouse optic nerve. Neurochemical Research, 42(9), 2468–2478. 10.1007/s11064-017-2220-1 [DOI] [PMC free article] [PubMed] [Google Scholar]
- Cahoy, J. D. , Emery, B. , Kaushal, A. , Foo, L. C. , Zamanian, J. L. , Christopherson, K. S. , … Barres, B. A. (2008). A transcriptome database for astrocytes, neurons, and oligodendrocytes: A new resource for understanding brain development and function. The Journal of Neuroscience: The Official Journal of the Society for Neuroscience, 28(1), 264–278. 10.1523/jneurosci.4178-07.2008 [DOI] [PMC free article] [PubMed] [Google Scholar]
- Ceprian, M. , & Fulton, D. (2019). Glial cell AMPA receptors in nervous system health, injury and disease. International Journal of Molecular Sciences, 20(10), 2450. 10.3390/ijms20102450 [DOI] [PMC free article] [PubMed] [Google Scholar]
- Chamling, X. , Kallman, A. , Fang, W. X. , Berlinicke, C. A. , Mertz, J. L. , Devkota, P. , … Zack, D. J. (2021). Single‐cell transcriptomic reveals molecular diversity and developmental heterogeneity of human stem cell‐derived oligodendrocyte lineage cells. Nat Commun. 12(1), 652. 10.1101/2020.10.07.328971 [DOI] [PMC free article] [PubMed] [Google Scholar]
- Chittajallu, R. , Aguirre, A. , & Gallo, V. (2004). NG2‐positive cells in the mouse white and grey matter display distinct physiological properties. The Journal of Physiology, 561(Pt 1), 109–122. 10.1113/jphysiol.2004.074252 [DOI] [PMC free article] [PubMed] [Google Scholar]
- David, F. P. A. , Litovchenko, M. , Deplancke, B. , & Gardeux, V. (2020). ASAP 2020 update: An open, scalable and interactive web‐based portal for (single‐cell) omics analyses. Nucleic Acids Research, 48(W1), W403–w414. 10.1093/nar/gkaa412 [DOI] [PMC free article] [PubMed] [Google Scholar]
- de Biase, L. M. , Nishiyama, A. , & Bergles, D. E. (2010). Excitability and synaptic communication within the oligodendrocyte lineage. The Journal of Neuroscience: The Official Journal of the Society for Neuroscience, 30(10), 3600–3611. 10.1523/jneurosci.6000-09.2010 [DOI] [PMC free article] [PubMed] [Google Scholar]
- DeSilva, T. M. , Kabakov, A. Y. , Goldhoff, P. E. , Volpe, J. J. , & Rosenberg, P. A. (2009). Regulation of glutamate transport in developing rat oligodendrocytes. The Journal of Neuroscience: The Official Journal of the Society for Neuroscience, 29(24), 7898–7908. 10.1523/jneurosci.6129-08.2009 [DOI] [PMC free article] [PubMed] [Google Scholar]
- Dewar, D. , Underhill, S. M. , & Goldberg, M. P. (2003). Oligodendrocytes and ischemic brain injury. Journal of Cerebral Blood Flow and Metabolism, 23(3), 263–274. 10.1097/01.WCB.0000053472.41007.F9 [DOI] [PubMed] [Google Scholar]
- Dias, D. O. , Kalkitsas, J. , Kelahmetoglu, Y. , Estrada, C. P. , Tatarishvili, J. , Ernst, A. , … Göritz, C. (2020). Pericyte‐derived fibrotic scarring is conserved across diverse central nervous system lesions. bioRxiv, 2020.2004.2030.068965. 10.1101/2020.04.30.068965 [DOI] [PMC free article] [PubMed] [Google Scholar]
- Dimou, L. , Simon, C. , Kirchhoff, F. , Takebayashi, H. , & Gotz, M. (2008). Progeny of Olig2‐expressing progenitors in the gray and white matter of the adult mouse cerebral cortex. The Journal of Neuroscience: The Official Journal of the Society for Neuroscience, 28(41), 10434–10442. 10.1523/jneurosci.2831-08.2008 [DOI] [PMC free article] [PubMed] [Google Scholar]
- Dobin, A. , Davis, C. A. , Schlesinger, F. , Drenkow, J. , Zaleski, C. , Jha, S. , … Gingeras, T. R. (2013). STAR: ultrafast universal RNA‐seq aligner. Bioinformatics, 29(1), 15–21. 10.1093/bioinformatics/bts635 [DOI] [PMC free article] [PubMed] [Google Scholar]
- Essers, J. , Theil, A. F. , Baldeyron, C. , van Cappellen, W. A. , Houtsmuller, A. B. , Kanaar, R. , & Vermeulen, W. (2005). Nuclear dynamics of PCNA in DNA replication and repair. Molecular and Cellular Biology, 25(21), 9350–9359. 10.1128/mcb.25.21.9350-9359.2005 [DOI] [PMC free article] [PubMed] [Google Scholar]
- Ferent, J. , Zimmer, C. , Durbec, P. , Ruat, M. , & Traiffort, E. (2013). Sonic Hedgehog signaling is a positive oligodendrocyte regulator during demyelination. The Journal of Neuroscience: The Official Journal of the Society for Neuroscience, 33(5), 1759–1772. 10.1523/jneurosci.3334-12.2013 [DOI] [PMC free article] [PubMed] [Google Scholar]
- Gudi, V. , Gingele, S. , Skripuletz, T. , & Stangel, M. (2014). Glial response during cuprizone‐induced de‐ and remyelination in the CNS: Lessons learned. Frontiers in Cellular Neuroscience, 8, 73. 10.3389/fncel.2014.00073 [DOI] [PMC free article] [PubMed] [Google Scholar]
- Guo, F. , Lang, J. , Sohn, J. , Hammond, E. , Chang, M. , & Pleasure, D. (2015). Canonical Wnt signaling in the oligodendroglial lineage: Puzzles remain. Glia, 63(10), 1671–1693. 10.1002/glia.22813 [DOI] [PubMed] [Google Scholar]
- Guo, F. , Ma, J. , McCauley, E. , Bannerman, P. , & Pleasure, D. (2009). Early postnatal proteolipid promoter‐expressing progenitors produce multilineage cells in vivo. The Journal of Neuroscience: The Official Journal of the Society for Neuroscience, 29(22), 7256–7270. 10.1523/jneurosci.5653-08.2009 [DOI] [PMC free article] [PubMed] [Google Scholar]
- Hackett, A. R. , Yahn, S. L. , Lyapichev, K. , Dajnoki, A. , Lee, D. H. , Rodriguez, M. , … Lee, J. K. (2018). Injury type‐dependent differentiation of NG2 glia into heterogeneous astrocytes. Experimental Neurology, 308, 72–79. 10.1016/j.expneurol.2018.07.001 [DOI] [PMC free article] [PubMed] [Google Scholar]
- Haneda, H. , Katabami, M. , Miyamoto, H. , Isobe, H. , Shimizu, T. , Ishiguro, A. , … Kawakami, Y. (1991). The relationship of the proliferating cell nuclear antigen protein to cis‐diamminedichloroplatinum (II) resistance of a murine leukemia cell line P388/CDDP. Oncology, 48(3), 234–238. 10.1159/000226934 [DOI] [PubMed] [Google Scholar]
- Hansen, A. J. (1978). The extracellular potassium concentration in brain cortex following ischemia in hypo‐ and hyperglycemic rats. Acta Physiologica Scandinavica, 102(3), 324–329. 10.1111/j.1748-1716.1978.tb06079.x [DOI] [PubMed] [Google Scholar]
- Hassannejad, Z. , Shakouri‐Motlagh, A. , Mokhatab, M. , Zadegan, S. A. , Sharif‐Alhoseini, M. , Shokraneh, F. , & Rahimi‐Movaghar, V. (2019). Oligodendrogliogenesis and axon remyelination after traumatic spinal cord injuries in animal studies: A systematic review. Neuroscience, 402, 37–50. 10.1016/j.neuroscience.2019.01.019 [DOI] [PubMed] [Google Scholar]
- He, Y. , Liu, X. , & Chen, Z. (2020). Glial scar: A promising target for improving outcomes after CNS injury. Journal of Molecular Neuroscience, 70(3), 340–352. 10.1007/s12031-019-01417-6 [DOI] [PubMed] [Google Scholar]
- Hill, R. A. , & Nishiyama, A. (2014). NG2 cells (polydendrocytes): Listeners to the neural network with diverse properties. Glia, 62(8), 1195–1210. 10.1002/glia.22664 [DOI] [PMC free article] [PubMed] [Google Scholar]
- Honsa, P. , Pivonkova, H. , Dzamba, D. , Filipova, M. , & Anderova, M. (2012). Polydendrocytes display large lineage plasticity following focal cerebral ischemia. PLoS One, 7(5), e36816. 10.1371/journal.pone.0036816 [DOI] [PMC free article] [PubMed] [Google Scholar]
- Honsa, P. , Valny, M. , Kriska, J. , Matuskova, H. , Harantova, L. , Kirdajova, D. , … Anderova, M. (2016). Generation of reactive astrocytes from NG2 cells is regulated by sonic hedgehog. Glia, 64(9), 1518–1531. 10.1002/glia.23019 [DOI] [PubMed] [Google Scholar]
- Huang, W. , Bai, X. , Stopper, L. , Catalin, B. , Cartarozzi, L. P. , Scheller, A. , & Kirchhoff, F. (2018). During development NG2 glial cells of the spinal cord are restricted to the oligodendrocyte lineage, but generate astrocytes upon acute injury. Neuroscience, 385, 154–165. 10.1016/j.neuroscience.2018.06.015 [DOI] [PubMed] [Google Scholar]
- Huang, W. , Guo, Q. , Bai, X. , Scheller, A. , & Kirchhoff, F. (2019). Early embryonic NG2 glia are exclusively gliogenic and do not generate neurons in the brain. Glia, 67(6), 1094–1103. 10.1002/glia.23590 [DOI] [PubMed] [Google Scholar]
- Huang, W. , Zhao, N. , Bai, X. , Karram, K. , Trotter, J. , Goebbels, S. , … Kirchhoff, F. (2014). Novel NG2‐CreERT2 knock‐in mice demonstrate heterogeneous differentiation potential of NG2 glia during development. Glia, 62(6), 896–913. 10.1002/glia.22648 [DOI] [PubMed] [Google Scholar]
- Juríková, M. , Danihel, Ľ. , Polák, Š. , & Varga, I. (2016). Ki67, PCNA, and MCM proteins: Markers of proliferation in the diagnosis of breast cancer. Acta Histochemica, 118(5), 544–552. 10.1016/j.acthis.2016.05.002 [DOI] [PubMed] [Google Scholar]
- Kang, S. H. , Fukaya, M. , Yang, J. K. , Rothstein, J. D. , & Bergles, D. E. (2010). NG2+ CNS glial progenitors remain committed to the oligodendrocyte lineage in postnatal life and following neurodegeneration. Neuron, 68(4), 668–681. 10.1016/j.neuron.2010.09.009 [DOI] [PMC free article] [PubMed] [Google Scholar]
- Kantzer, C. G. , Boutin, C. , Herzig, I. D. , Wittwer, C. , Reiß, S. , Tiveron, M. C. , … Bosio, A. (2017). Anti‐ACSA‐2 defines a novel monoclonal antibody for prospective isolation of living neonatal and adult astrocytes. Glia, 65(6), 990–1004. 10.1002/glia.23140 [DOI] [PubMed] [Google Scholar]
- Káradóttir, R. , Hamilton, N. B. , Bakiri, Y. , & Attwell, D. (2008). Spiking and nonspiking classes of oligodendrocyte precursor glia in CNS white matter. Nature Neuroscience, 11(4), 450–456. 10.1038/nn2060 [DOI] [PMC free article] [PubMed] [Google Scholar]
- Khawaja, R. R. , Amit, A. , Fukaya, M. , Jeong, H.‐k. , Gross, S. , Gonzalez‐Fernandez, E. , Soboloff, J. , Bergles, D. E. , & Kang, S. H. (2021). GluA2 overexpression in oligodendrocyte progenitors promotes postinjury oligodendrocyte regeneration. Cell Reports, 35(7), 109147. 10.2139/ssrn.3422305 [DOI] [PMC free article] [PubMed] [Google Scholar]
- Kirdajova, D. , & Anderova, M. (2020). NG2 cells and their neurogenic potential. Current Opinion in Pharmacology, 50, 53–60. 10.1016/j.coph.2019.11.005 [DOI] [PubMed] [Google Scholar]
- Komitova, M. , Serwanski, D. R. , Lu, Q. R. , & Nishiyama, A. (2011). NG2 cells are not a major source of reactive astrocytes after neocortical stab wound injury. Glia, 59(5), 800–809. 10.1002/glia.21152 [DOI] [PMC free article] [PubMed] [Google Scholar]
- Kukley, M. , Kiladze, M. , Tognatta, R. , Hans, M. , Swandulla, D. , Schramm, J. , & Dietrich, D. (2008). Glial cells are born with synapses. The FASEB Journal, 22(8), 2957–2969. 10.1096/fj.07-090985 [DOI] [PubMed] [Google Scholar]
- Kula, B. , Chen, T. J. , & Kukley, M. (2019). Glutamatergic signaling between neurons and oligodendrocyte lineage cells: Is it synaptic or non‐synaptic? Glia, 67(11), 2071–2091. 10.1002/glia.23617 [DOI] [PubMed] [Google Scholar]
- Leuchtmann, E. A. , Ratner, A. E. , Vijitruth, R. , Qu, Y. , & McDonald, J. W. (2003). AMPA receptors are the major mediators of excitotoxic death in mature oligodendrocytes. Neurobiology of Disease, 14(3), 336–348. 10.1016/j.nbd.2003.07.004 [DOI] [PubMed] [Google Scholar]
- Levine, J. (2016). The reactions and role of NG2 glia in spinal cord injury. Brain Research, 1638, 199–208. 10.1016/j.brainres.2015.07.026 [DOI] [PMC free article] [PubMed] [Google Scholar]
- Loulier, K. , Ruat, M. , & Traiffort, E. (2006). Increase of proliferating oligodendroglial progenitors in the adult mouse brain upon sonic hedgehog delivery in the lateral ventricle. Journal of Neurochemistry, 98(2), 530–542. 10.1111/j.1471-4159.2006.03896.x [DOI] [PubMed] [Google Scholar]
- Lun, A. T. L. , Riesenfeld, S. , Andrews, T. , Dao, T. P. , Gomes, T. , & Marioni, J. C. (2019). EmptyDrops: Distinguishing cells from empty droplets in droplet‐based single‐cell RNA sequencing data. Genome Biology, 20(1), 63. 10.1186/s13059-019-1662-y [DOI] [PMC free article] [PubMed] [Google Scholar]
- Magaki, S. D. , Williams, C. K. , & Vinters, H. V. (2018). Glial function (and dysfunction) in the normal & ischemic brain. Neuropharmacology, 134, 218–225. 10.1016/j.neuropharm.2017.11.009 [DOI] [PMC free article] [PubMed] [Google Scholar]
- Marques, S. , van Bruggen, D. , & Castelo‐Branco, G. (2019). Single‐cell RNA sequencing of Oligodendrocyte lineage cells from the mouse central nervous system. Methods in Molecular Biology, 1936, 1–21. 10.1007/978-1-4939-9072-6_1 [DOI] [PubMed] [Google Scholar]
- Marques, S. , van Bruggen, D. , Vanichkina, D. P. , Floriddia, E. M. , Munguba, H. , Varemo, L. , … Castelo‐Branco, G. (2018). Transcriptional convergence of oligodendrocyte lineage progenitors during development. Developmental Cell, 46(4), 504–517.e507. 10.1016/j.devcel.2018.07.005 [DOI] [PMC free article] [PubMed] [Google Scholar]
- Marques, S. , Zeisel, A. , Codeluppi, S. , van Bruggen, D. , Mendanha Falcao, A. , Xiao, L. , … Castelo‐Branco, G. (2016). Oligodendrocyte heterogeneity in the mouse juvenile and adult central nervous system. Science, 352(6291), 1326–1329. 10.1126/science.aaf6463 [DOI] [PMC free article] [PubMed] [Google Scholar]
- Martinez‐Lozada, Z. , Waggener, C. T. , Kim, K. , Zou, S. , Knapp, P. E. , Hayashi, Y. , … Fuss, B. (2014). Activation of sodium‐dependent glutamate transporters regulates the morphological aspects of oligodendrocyte maturation via signaling through calcium/calmodulin‐dependent kinase IIβ's actin‐binding/‐stabilizing domain. Glia, 62(9), 1543–1558. 10.1002/glia.22699 [DOI] [PMC free article] [PubMed] [Google Scholar]
- McDonald, J. W. , Bhattacharyya, T. , Sensi, S. L. , Lobner, D. , Ying, H. S. , Canzoniero, L. M. , & Choi, D. W. (1998). Extracellular acidity potentiates AMPA receptor‐mediated cortical neuronal death. The Journal of Neuroscience: The Official Journal of the Society for Neuroscience, 18(16), 6290–6299. 10.1523/jneurosci.18-16-06290.1998 [DOI] [PMC free article] [PubMed] [Google Scholar]
- Milosevic, A. , Liebmann, T. , Knudsen, M. , Schintu, N. , Svenningsson, P. , & Greengard, P. (2017). Cell‐ and region‐specific expression of depression‐related protein p11 (S100a10) in the brain. The Journal of Comparative Neurology, 525(4), 955–975. 10.1002/cne.24113 [DOI] [PMC free article] [PubMed] [Google Scholar]
- Mori, T. , Tan, J. , Arendash, G. W. , Koyama, N. , Nojima, Y. , & Town, T. (2008). Overexpression of human S100B exacerbates brain damage and periinfarct gliosis after permanent focal ischemia. Stroke, 39(7), 2114–2121. 10.1161/strokeaha.107.503821 [DOI] [PMC free article] [PubMed] [Google Scholar]
- Nawashiro, H. , Brenner, M. , Fukui, S. , Shima, K. , & Hallenbeck, J. M. (2000). High susceptibility to cerebral ischemia in GFAP‐null mice. Journal of Cerebral Blood Flow & Metabolism, 20(7), 1040–1044. 10.1097/00004647-200007000-00003 [DOI] [PubMed] [Google Scholar]
- Neprasova, H. , Anderova, M. , Petrik, D. , Vargova, L. , Kubinova, S. , Chvatal, A. , & Sykova, E. (2007). High extracellular K(+) evokes changes in voltage‐dependent K(+) and Na (+) currents and volume regulation in astrocytes. Pflügers Archiv, 453(6), 839–849. 10.1007/s00424-006-0151-9 [DOI] [PubMed] [Google Scholar]
- Nishiyama, A. , Boshans, L. , Goncalves, C. M. , Wegrzyn, J. , & Patel, K. D. (2016). Lineage, fate, and fate potential of NG2‐glia. Brain Research, 1638, 116–128. 10.1016/j.brainres.2015.08.013 [DOI] [PMC free article] [PubMed] [Google Scholar]
- Nishiyama, A. , Watanabe, M. , Yang, Z. , & Bu, J. (2002). Identity, distribution, and development of polydendrocytes: NG2‐expressing glial cells. Journal of Neurocytology, 31(6–7), 437–455. [DOI] [PubMed] [Google Scholar]
- Nolte, C. , Matyash, M. , Pivneva, T. , Schipke, C. G. , Ohlemeyer, C. , Hanisch, U. K. , … Kettenmann, H. (2001). GFAP promoter‐controlled EGFP‐expressing transgenic mice: A tool to visualize astrocytes and astrogliosis in living brain tissue. Glia, 33(1), 72–86. [PubMed] [Google Scholar]
- Notomi, T. , & Shigemoto, R. (2004). Immunohistochemical localization of Ih channel subunits, HCN1‐4, in the rat brain. The Journal of Comparative Neurology, 471(3), 241–276. 10.1002/cne.11039 [DOI] [PubMed] [Google Scholar]
- Ozerdem, U. , Grako, K. A. , Dahlin‐Huppe, K. , Monosov, E. , & Stallcup, W. B. (2001). NG2 proteoglycan is expressed exclusively by mural cells during vascular morphogenesis. Developmental Dynamics, 222(2), 218–227. 10.1002/dvdy.1200 [DOI] [PubMed] [Google Scholar]
- Pablo, Y. , Nilsson, M. , Pekna, M. , & Pekny, M. (2013). Intermediate filaments are important for astrocyte response to oxidative stress induced by oxygen‐glucose deprivation and reperfusion. Histochemistry and Cell Biology, 140(1), 81–91. 10.1007/s00418-013-1110-0 [DOI] [PubMed] [Google Scholar]
- Pivonkova, H. , Benesova, J. , Butenko, O. , Chvatal, A. , & Anderova, M. (2010). Impact of global cerebral ischemia on K+ channel expression and membrane properties of glial cells in the rat hippocampus. Neurochemistry International, 57(7), 783–794. 10.1016/j.neuint.2010.08.016 [DOI] [PubMed] [Google Scholar]
- Polito, A. , & Reynolds, R. (2005). NG2‐expressing cells as oligodendrocyte progenitors in the normal and demyelinated adult central nervous system. Journal of Anatomy, 207(6), 707–716. 10.1111/j.1469-7580.2005.00454.x [DOI] [PMC free article] [PubMed] [Google Scholar]
- Rivers, L. E. , Young, K. M. , Rizzi, M. , Jamen, F. , Psachoulia, K. , Wade, A. , … Richardson, W. D. (2008). PDGFRA/NG2 glia generate myelinating oligodendrocytes and piriform projection neurons in adult mice. Nature Neuroscience, 11(12), 1392–1401. 10.1038/nn.2220 [DOI] [PMC free article] [PubMed] [Google Scholar]
- Rusnakova, V. , Honsa, P. , Dzamba, D. , Ståhlberg, A. , Kubista, M. , & Anderova, M. (2013). Heterogeneity of astrocytes: From development to injury ‐ single cell gene expression. PLoS One, 8(8), e69734. 10.1371/journal.pone.0069734 [DOI] [PMC free article] [PubMed] [Google Scholar]
- Saab, A. S. , Tzvetavona, I. D. , Trevisiol, A. , Baltan, S. , Dibaj, P. , Kusch, K. , … Nave, K. A. (2016). Oligodendroglial NMDA receptors regulate glucose import and axonal energy metabolism. Neuron, 91(1), 119–132. 10.1016/j.neuron.2016.05.016 [DOI] [PMC free article] [PubMed] [Google Scholar]
- Sanchez‐Gomez, M. V. , Alberdi, E. , Perez‐Navarro, E. , Alberch, J. , & Matute, C. (2011). Bax and calpain mediate excitotoxic oligodendrocyte death induced by activation of both AMPA and kainate receptors. The Journal of Neuroscience: The Official Journal of the Society for Neuroscience, 31(8), 2996–3006. 10.1523/JNEUROSCI.5578-10.2011 [DOI] [PMC free article] [PubMed] [Google Scholar]
- Schools, G. P. , Zhou, M. , & Kimelberg, H. K. (2003). Electrophysiologically “complex” glial cells freshly isolated from the hippocampus are immunopositive for the chondroitin sulfate proteoglycan NG2. Journal of Neuroscience Research, 73(6), 765–777. 10.1002/jnr.10680 [DOI] [PubMed] [Google Scholar]
- Shao, X. , Liao, J. , Lu, X. , Xue, R. , Ai, N. , & Fan, X. (2020). scCATCH: Automatic annotation on cell types of clusters from single‐cell RNA sequencing data. iScience, 23(3), 100882. 10.1016/j.isci.2020.100882 [DOI] [PMC free article] [PubMed] [Google Scholar]
- Shivji, K. K. , Kenny, M. K. , & Wood, R. D. (1992). Proliferating cell nuclear antigen is required for DNA excision repair. Cell, 69(2), 367–374. 10.1016/0092-8674(92)90416-a [DOI] [PubMed] [Google Scholar]
- Simons, M. , & Nave, K. A. (2015). Oligodendrocytes: Myelination and axonal support. Cold Spring Harbor Perspectives in Biology, 8(1), a020479. 10.1101/cshperspect.a020479 [DOI] [PMC free article] [PubMed] [Google Scholar]
- Skripuletz, T. , Gudi, V. , Hackstette, D. , & Stangel, M. (2011). De‐ and remyelination in the CNS white and grey matter induced by cuprizone: The old, the new, and the unexpected. Histology and Histopathology, 26(12), 1585–1597. [DOI] [PubMed] [Google Scholar]
- Sofroniew, M. V. , & Vinters, H. V. (2010). Astrocytes: Biology and pathology. Acta Neuropathologica, 119(1), 7–35. 10.1007/s00401-009-0619-8 [DOI] [PMC free article] [PubMed] [Google Scholar]
- Song, F. E. , Huang, J. L. , Lin, S. H. , Wang, S. , Ma, G. F. , & Tong, X. P. (2017). Roles of NG2‐glia in ischemic stroke. CNS Neuroscience & Therapeutics, 23(7), 547–553. 10.1111/cns.12690 [DOI] [PMC free article] [PubMed] [Google Scholar]
- Spitzer, S. , Volbracht, K. , Lundgaard, I. , & Karadottir, R. T. (2016). Glutamate signalling: A multifaceted modulator of oligodendrocyte lineage cells in health and disease. Neuropharmacology, 110, 574–585. 10.1016/j.neuropharm.2016.06.014 [DOI] [PubMed] [Google Scholar]
- Spitzer, S. O. , Sitnikov, S. , Kamen, Y. , Evans, K. A. , Kronenberg‐Versteeg, D. , Dietmann, S. , … Karadottir, R. T. (2019). Oligodendrocyte progenitor cells become regionally diverse and heterogeneous with age. Neuron, 101(3), 459–471.e455. 10.1016/j.neuron.2018.12.020 [DOI] [PMC free article] [PubMed] [Google Scholar]
- Streitberg, A. , Jäkel, S. , Eugenin von Bernhardi, J. , Straube, C. , Buggenthin, F. , Marr, C. , & Dimou, L. (2021). NG2‐glia transiently overcome their homeostatic network and contribute to wound closure after brain injury. Frontiers in Cell and Developmental Biology, 9, 662056–662056. 10.3389/fcell.2021.662056 [DOI] [PMC free article] [PubMed] [Google Scholar]
- Stuart, T. , Butler, A. , Hoffman, P. , Hafemeister, C. , Papalexi, E. , Mauck, W. M., 3rd , … Satija, R. (2019). Comprehensive integration of single‐cell data. Cell, 177(7), 1888–1902.e1821. 10.1016/j.cell.2019.05.031 [DOI] [PMC free article] [PubMed] [Google Scholar]
- Suárez‐Pozos, E. , Thomason, E. J. , & Fuss, B. (2020). Glutamate transporters: expression and function in oligodendrocytes. Neurochemical Research, 45(3), 551–560. 10.1007/s11064-018-02708-x [DOI] [PMC free article] [PubMed] [Google Scholar]
- Tamura, Y. , Kataoka, Y. , Cui, Y. , Takamori, Y. , Watanabe, Y. , & Yamada, H. (2007). Multi‐directional differentiation of doublecortin‐ and NG2‐immunopositive progenitor cells in the adult rat neocortex in vivo. The European Journal of Neuroscience, 25(12), 3489–3498. 10.1111/j.1460-9568.2007.05617.x [DOI] [PubMed] [Google Scholar]
- Tanner, D. C. , Cherry, J. D. , & Mayer‐Pröschel, M. (2011). Oligodendrocyte progenitors reversibly exit the cell cycle and give rise to astrocytes in response to interferon‐γ. The Journal of Neuroscience: The Official Journal of the Society for Neuroscience, 31(16), 6235–6246. 10.1523/jneurosci.5905-10.2011 [DOI] [PMC free article] [PubMed] [Google Scholar]
- Tripathi, R. B. , Rivers, L. E. , Young, K. M. , Jamen, F. , & Richardson, W. D. (2010). NG2 glia generate new oligodendrocytes but few astrocytes in a murine experimental autoimmune encephalomyelitis model of demyelinating disease. The Journal of Neuroscience: The Official Journal of the Society for Neuroscience, 30(48), 16383–16390. 10.1523/jneurosci.3411-10.2010 [DOI] [PMC free article] [PubMed] [Google Scholar]
- Tsoa, R. W. , Coskun, V. , Ho, C. K. , & de Vellis, J. (2014). Spatiotemporally different origins of NG2 progenitors produce cortical interneurons versus glia in the mammalian forebrain. Proceedings of the National Academy of Sciences of the United States of America, 111(20), 7444–7449. 10.1073/pnas.1400422111 [DOI] [PMC free article] [PubMed] [Google Scholar]
- Valny, M. , Honsa, P. , Kirdajova, D. , Kamenik, Z. , & Anderova, M. (2016). Tamoxifen in the mouse brain: Implications for fate‐mapping studies using the Tamoxifen‐inducible Cre‐loxP system. Frontiers in Cellular Neuroscience, 10, 243. 10.3389/fncel.2016.00243 [DOI] [PMC free article] [PubMed] [Google Scholar]
- Valny, M. , Honsa, P. , Waloschkova, E. , Matuskova, H. , Kriska, J. , Kirdajova, D. , … Anderova, M. (2018). A single‐cell analysis reveals multiple roles of oligodendroglial lineage cells during post‐ischemic regeneration. Glia, 66(5), 1068–1081. 10.1002/glia.23301 [DOI] [PubMed] [Google Scholar]
- Vigano, F. , & Dimou, L. (2016). The heterogeneous nature of NG2‐glia. Brain Research, 1638, 129–137. 10.1016/j.brainres.2015.09.012 [DOI] [PubMed] [Google Scholar]
- Viganò, F. , Möbius, W. , Götz, M. , & Dimou, L. (2013). Transplantation reveals regional differences in oligodendrocyte differentiation in the adult brain. Nature Neuroscience, 16(10), 1370–1372. 10.1038/nn.3503 [DOI] [PubMed] [Google Scholar]
- Wallraff, A. , Odermatt, B. , Willecke, K. , & Steinhäuser, C. (2004). Distinct types of astroglial cells in the hippocampus differ in gap junction coupling. Glia, 48(1), 36–43. 10.1002/glia.20040 [DOI] [PubMed] [Google Scholar]
- Wang, L. C. , & Almazan, G. (2016). Role of sonic hedgehog signaling in oligodendrocyte differentiation. Neurochemical Research, 41(12), 3289–3299. 10.1007/s11064-016-2061-3 [DOI] [PubMed] [Google Scholar]
- Wanner, I. B. , Anderson, M. A. , Song, B. , Levine, J. , Fernandez, A. , Gray‐Thompson, Z. , … Sofroniew, M. V. (2013). Glial scar Borders are formed by newly proliferated, elongated astrocytes that interact to corral inflammatory and fibrotic cells via STAT3‐dependent mechanisms after spinal cord injury. Journal of Neuroscience, 33(31), 12870–12886. 10.1523/jneurosci.2121-13.2013 [DOI] [PMC free article] [PubMed] [Google Scholar]
- Wu, Y. E. , Pan, L. , Zuo, Y. , Li, X. , & Hong, W. (2017). Detecting activated cell populations using single‐cell RNA‐Seq. Neuron, 96(2), 313–329.e316. 10.1016/j.neuron.2017.09.026 [DOI] [PubMed] [Google Scholar]
- Xia, W. , Liu, Y. , & Jiao, J. (2015). GRM7 regulates embryonic neurogenesis via CREB and YAP. Stem Cell Reports, 4(5), 795–810. 10.1016/j.stemcr.2015.03.004 [DOI] [PMC free article] [PubMed] [Google Scholar]
- Xin, W. , Mironova, Y. A. , Shen, H. , Marino, R. A. M. , Waisman, A. , Lamers, W. H. , … Bonci, A. (2019). Oligodendrocytes support neuronal glutamatergic transmission via expression of glutamine synthetase. Cell Reports, 27(8), 2262–2271 e2265. 10.1016/j.celrep.2019.04.094 [DOI] [PMC free article] [PubMed] [Google Scholar]
- Ye, J. , Coulouris, G. , Zaretskaya, I. , Cutcutache, I. , Rozen, S. , & Madden, T. L. (2012). Primer‐BLAST: A tool to design target‐specific primers for polymerase chain reaction. BMC Bioinformatics, 13, 134. 10.1186/1471-2105-13-134 [DOI] [PMC free article] [PubMed] [Google Scholar]
- Young, K. M. , Psachoulia, K. , Tripathi, R. B. , Dunn, S. J. , Cossell, L. , Attwell, D. , … Richardson, W. D. (2013). Oligodendrocyte dynamics in the healthy adult CNS: Evidence for myelin remodeling. Neuron, 77(5), 873–885. 10.1016/j.neuron.2013.01.006 [DOI] [PMC free article] [PubMed] [Google Scholar]
- Zawadzka, M. , Rivers, L. E. , Fancy, S. P. , Zhao, C. , Tripathi, R. , Jamen, F. , … Franklin, R. J. (2010). CNS‐resident glial progenitor/stem cells produce Schwann cells as well as oligodendrocytes during repair of CNS demyelination. Cell Stem Cell, 6(6), 578–590. 10.1016/j.stem.2010.04.002 [DOI] [PMC free article] [PubMed] [Google Scholar]
- Zeisel, A. , Hochgerner, H. , Lonnerberg, P. , Johnsson, A. , Memic, F. , van der Zwan, J. , … Linnarsson, S. (2018). Molecular architecture of the mouse nervous system. Cell, 174(4), 999–1014.e1022. 10.1016/j.cell.2018.06.021 [DOI] [PMC free article] [PubMed] [Google Scholar]
- Zhang, L. , Chopp, M. , Zhang, R. L. , Wang, L. , Zhang, J. , Wang, Y. , … Zhang, Z. G. (2010). Erythropoietin amplifies stroke‐induced oligodendrogenesis in the rat. PLoS One, 5(6), e11016. 10.1371/journal.pone.0011016 [DOI] [PMC free article] [PubMed] [Google Scholar]
- Zhang, S. , Zhu, X. , Gui, X. , Croteau, C. , Song, L. , Xu, J. , … Guo, F. (2018). Sox2 is essential for oligodendroglial proliferation and differentiation during postnatal brain myelination and CNS Remyelination. The Journal of Neuroscience: The Official Journal of the Society for Neuroscience, 38(7), 1802–1820. 10.1523/JNEUROSCI.1291-17.2018 [DOI] [PMC free article] [PubMed] [Google Scholar]
- Zhang, Y. , Chen, K. , Sloan, S. A. , Bennett, M. L. , Scholze, A. R. , O'Keeffe, S. , … Guarnieri, P. (2014). An RNA‐sequencing transcriptome and splicing database of glia, neurons, and vascular cells of the cerebral cortex. Journal of Neuroscience, 34(36), 11929–11947. 10.1523/jneurosci.1860-14.2014 [DOI] [PMC free article] [PubMed] [Google Scholar]
- Zhao, C. , Ma, D. , Zawadzka, M. , Fancy, S. P. J. , Elis‐Williams, L. , Bouvier, G. , … Franklin, R. J. M. (2015). Sox2 sustains recruitment of Oligodendrocyte progenitor cells following CNS demyelination and primes them for differentiation during Remyelination. The Journal of Neuroscience: The Official Journal of the Society for Neuroscience, 35(33), 11482–11499. 10.1523/JNEUROSCI.3655-14.2015 [DOI] [PMC free article] [PubMed] [Google Scholar]
- Zhou, M. , Schools, G. P. , & Kimelberg, H. K. (2006). Development of GLAST(+) astrocytes and NG2(+) glia in rat hippocampus CA1: Mature astrocytes are electrophysiologically passive. Journal of Neurophysiology, 95(1), 134–143. 10.1152/jn.00570.2005 [DOI] [PubMed] [Google Scholar]
- Zhou, M. , Xu, G. , Xie, M. , Zhang, X. , Schools, G. P. , Ma, L. , … Chen, H. (2009). TWIK‐1 and TREK‐1 are potassium channels contributing significantly to astrocyte passive conductance in rat hippocampal slices. The Journal of Neuroscience: The Official Journal of the Society for Neuroscience, 29(26), 8551–8564. 10.1523/jneurosci.5784-08.2009 [DOI] [PMC free article] [PubMed] [Google Scholar]
- Zhu, H. , & Dahlström, A. (2007). Glial fibrillary acidic protein‐expressing cells in the neurogenic regions in normal and injured adult brains. Journal of Neuroscience Research, 85(12), 2783–2792. 10.1002/jnr.21257 [DOI] [PubMed] [Google Scholar]
- Zhu, X. , Bergles, D. E. , & Nishiyama, A. (2008). NG2 cells generate both oligodendrocytes and gray matter astrocytes. Development, 135(1), 145–157. 10.1242/dev.004895 [DOI] [PubMed] [Google Scholar]
- Zhu, X. , Hill, R. A. , Dietrich, D. , Komitova, M. , Suzuki, R. , & Nishiyama, A. (2011). Age‐dependent fate and lineage restriction of single NG2 cells. Development, 138(4), 745–753. 10.1242/dev.047951 [DOI] [PMC free article] [PubMed] [Google Scholar]
Associated Data
This section collects any data citations, data availability statements, or supplementary materials included in this article.
Supplementary Materials
APPENDIX S1: Supporting Information
Data Availability Statement
Data sharing is not applicable to this article as no new data were created or analyzed in this study.