

Abstract
Background
The objective of the current study was to define and compare rates of textbook outcomes (TO) among patients undergoing colorectal, lung, esophagus, liver, and pancreatic surgery for cancer at U.S. News & World Report (USNWR) ranked hospitals.
Methods
Medicare Inpatient Standard Analytic Files 2013‐2015 were utilized to examine the relationship of TO and USNWR hospital ratings following surgery for colorectal, lung, esophageal, pancreatic, and liver cancer. TO was defined as no postoperative surgical complications, no prolonged length of hospital stay, no readmission within 90 days after discharge, and no postoperative mortality within 90 days after surgery.
Results
Among the 35,352 Medicare patients included in the cohort, 16,820 (47.6%) underwent surgery at honor roll hospitals, whereas 18 532 (52.4%) underwent surgery at non‐honor roll hospitals. The overall proportion of patients who achieved TO was 50.1%. In examining the clinical outcomes of patients who underwent surgery, there was no difference in the odds of achieving TO at honor roll vs non‐honor roll hospitals (colorectal: odds ratio [OR], 0.87; 95% confidence interval [CI], 0.69‐1.10; lung: OR, 1.07; 95% CI, 0.87‐1.32; esophagus: OR, 1.44; 95% CI, 0.72‐2.89; liver: OR, 1.27; 95% CI, 0.87‐1.84; pancreas: OR, 1.04; 95% CI, 0.67‐1.62).
Conclusion and Relevance
Patients undergoing surgery for lung, esophageal, liver, pancreatic, and colorectal cancer had comparable rates of TO at honor roll vs non‐honor roll hospitals. No linear association was observed between hospital position in the rank and postoperative outcomes such as TO indicating that patients should not overly focus on the exact position within USNWR ranked hospitals. These data highlight to patients and physicians that up to one‐half of patients undergoing surgery for cancer should anticipate at least one adverse outcome.
Keywords: cancer, honor roll, surgery, textbook outcomes, USNWR
1. INTRODUCTION
Defining, assessing, and delivering high‐quality care in the management of patients undergoing surgery for cancer remains a challenge. The Institute of Medicine defines quality as the degree to which health services for individuals and populations increase the likelihood of desired health outcomes that are consistent with current professional knowledge. 1 The Center for Medicare and Medicaid Services (CMS) has made efforts to improve the quality of the healthcare delivery system through passage of policies such as Accountable Care Organization, which rewards hospitals that provide high‐quality care at low costs. 2 In an attempt to identify the “best” hospitals, various organizations have derived different rating and ranking systems to evaluate hospital performance. Such data on hospital performance may be helpful to policymakers and referring physicians, as well as provide important information for patients to understand which hospital may best suit their medical needs. One of the most commonly used ranking systems is the U.S. News & World Report (USNWR) Best Hospital rankings. 3
Previous studies have investigated the relationship of USNWR top‐ranked hospitals and short‐term outcomes such as 30‐day mortality and readmissions among patients undergoing surgery for various cardiovascular diseases. 4 Traditionally, ranking systems have used individual outcomes such as mortality, morbidity, and readmissions to assess the quality of a particular hospital for surgical procedures. 5 , 6 , 7 , 8 Using single “siloed” metrics may be problematic; however, as a particular hospital might perform better on one parameter and not as well on a different parameter. 9 Moreover, individual measures do not capture the multidimensional aspect of the whole surgical process from the patient's perspective, as individuals experience an episode of care as an “all or none” phenomenon. 9 In addition, parameters with a low event rate, such as mortality, maybe due to chance and focus on such metrics may not provide reproducible and accurate information into actual variation around quality measures among different hospitals. In turn, several investigators have proposed composite outcomes measures as being more reliable to assess healthcare quality rather than focusing on individual outcome parameters. 10 , 11 , 12 Textbook outcome (TO) is one such composite measure that has gained increased adoption as a means to provide more comprehensive information about hospital performance. TO involves the concept that the desired outcome is only accomplished when all individual composite outcomes (eg, no complication, no prolonged length of stay, no mortality, etc) are achieved together. This concept was originally described by a group of colorectal surgeons from the Netherlands in an effort to characterize variations in hospital performance after colon cancer resection. 12 In this manner, TO may provide better information on the overall quality of patient care around the time of surgery, as well as facilitate the detection of more meaningful differences among hospitals that are less likely to be due to random sampling errors.
While few studies have evaluated use of TO as a measure of quality of care in patients undergoing surgery for lung, colorectal, gastric, bariatric, liver, and pancreas malignancies, 10 , 11 , 12 no study have specifically investigated whether USNWR hospital ranking may translate into a higher chance of achieving a TO outcome among patients undergoing surgery for cancer. Similarly, the association between TO and USNWR ranking position remains largely unknown. To this end, the aim of the current study was to define and compare rates of TO among patients undergoing colorectal, lung, esophagus, liver, and pancreatic surgery for cancer at honor roll and nonhonor roll hospitals. In addition, we also sought to assess the correlation between hospital volume and TO at honor roll and nonhonor roll hospitals.
2. METHODS
2.1. Data sources and study population
The analytic cohort was derived from 100% Medicare Inpatient and Outpatient Standard Analytic Files (SAF) from 2013 to 2015. The SAF includes patient‐level information on demographic characteristics, diagnoses, and procedures. The International Classification of Diseases, Ninth Revision (ICD‐9) diagnosis and procedure codes were used to identify patients who underwent colorectal, lung, esophageal, pancreatic, and hepatic resection for cancer surgery (Tables S1 and S2). Patients younger than 65 years of age, people having a benign diagnosis or emergent/urgent admission type were excluded from the study.
The top 20 honor roll hospitals based on the quality of care provided to cancer patients were recognized from the USNWR website (https://health.usnews.com/best‐hospitals/rankings/cancer) whereas the remaining hospitals that were ranked but not included in the honor roll list were described as “nonhonor roll” hospitals. Of note, the analytic cohort in the current study included patients with cancer; therefore, USNWR cancer‐specific rankings were utilized. The USNWR reports ranking for 50 hospitals for cancer specialty; after the top 50 hospital rankings, other hospitals do not receive a specific rank by USNWR. The study was approved by the Institutional Review Board at The Ohio State University Wexner Medical Center.
2.2. Textbook outcome
TO was defined as no postoperative surgical complications, no prolonged length of hospital stay (LOS), no readmission 90 days after discharge, and no postoperative mortality 90 days after surgery. TO definition was based on a selection of relevant outcome parameters representing an optimal patient outcome after surgery. 10 ICD‐9‐CM diagnosis and procedure codes were utilized to identify patients having postoperative surgical complications. 13 , 14 , 15 Table S3 depicts the codes utilized for postsurgical complications. Readmissions were defined as admission to any hospital within 90 days after discharge. Mortality was defined as death within 90 days of the index operation; prolonged LOS was defined as LOS during the index hospitalization >75th percentile for each procedure. 16 , 17 , 18 , 19 TO was achieved when none of the four adverse outcomes occurred.
2.3. Statistical analyses
Patient demographics and postoperative outcome characteristics were compared among patients who underwent surgery at honor roll vs nonhonor roll hospitals. Continuous variables were described as medians and interquartile ranges (IQRs) and categorical variables were described as total count and frequencies (%). Bivariate analyses were executed using Pearson χ 2 or Wilcoxon rank test as appropriate to measure differences in TO at honor roll vs nonhonor roll stratified by procedure type. For each procedure, multivariable logistic regression analyses were conducted to compare TO among honor roll and nonhonor roll hospitals. Multivariable models were controlled for patient characteristics including sex, age, race, Charlson comorbidity score, and surgical approach (ie, open or minimally invasive) as fixed effects, and hospital variation as random effects. To better understand the relationship between rankings of hospital and rates of TO, multivariable simple linear regression was performed. Funnel plots were used to assess the volume‐outcome relationship for honor roll and nonhonor roll hospitals. Hospital volume was calculated based on the number of procedure‐specific surgeries performed at each hospital included in the study cohort. The model fit was evaluated by assessing C‐statistic for each model. A P < .05 was considered statistically significant. All analyses were performed with SAS 9.4.
3. RESULTS
3.1. Overall characteristics
Among 35 352 patients who met inclusion criteria, roughly half of patients were male (N = 18 748; 53.0%) with a median age of 73 years (IQR, 69‐78); the vast majority of patients were White (N = 32 184; 91.0%) (Table 1). Overall, 10 984 (31.1%) patients underwent a colorectal resection, 12 608 (35.7%) lung resection, 1792 (5.1%) esophagectomy, 7140 (20.0%) hepatectomy, and 2828 (8.0%) pancreatectomy.
Table 1.
Patient characteristics at honor roll and nonhonor roll hospitals
| Variable | Total | Nonhonor roll hospitals | Honor roll hospitals | P value |
|---|---|---|---|---|
| Sex | .80 | |||
| Male | 18 748 (53%) | 9840 (53.1%) | 8908 (53.0%) | |
| Female | 16 604 (47%) | 8692 (46.9%) | 7912 (47.0%) | |
| Age | 73 (69‐78) | 73 (69‐78) | 73 (69‐78) | .41 |
| Race | <.001 | |||
| White | 32 184 (91%) | 16 592(89.5%) | 15 592 (92.7%) | |
| Black | 1872 (5.3%) | 1240 (6.7%) | 632 (3.8%) | |
| Other | 1296 (3.7%) | 700 (3.8%) | 596 (3.5%) | |
| Charlson score | <.001 | |||
| 2 | 9952 (28.2%) | 5452 (29.4%) | 4500 (26.8%) | |
| 3 | 7504 (21.2%) | 4040 (21.8%) | 3464 (20.6%) | |
| 4 | 3812 (10.8%) | 2048 (11.1%) | 1764 (10.5%) | |
| 5 or more | 14 084 (39.8%) | 6992 (37.7%) | 7092 (42.2%) | |
| Prior admission | <.001 | |||
| 0 | 24 604 (69.6%) | 12 708 (68.6%) | 11 896 (70.7%) | |
| 1 | 7800 (22.1%) | 4244 (22.9%) | 3556 (21.1%) | |
| 2 | 2072 (5.9%) | 1104 (6%) | 968 (5.8%) | |
| 3 or more | 876 (2.5%) | 476 (2.6%) | 400 (2.4%) | |
| Procedure | <.001 | |||
| Colorectal | 10 984 (31.1%) | 5596 (30.2%) | 5388 (32%) | |
| Lung | 12 608 (35.7%) | 6700 (36.2%) | 5908 (35.1%) | |
| Esophagus | 1792 (5.1%) | 864 (4.7%) | 928 (5.5%) | |
| Liver | 7140(20.2%) | 3808 (20.5%) | 3332 (19.8%) | |
| Pancreas | 2828 (8%) | 1564 (8.4%) | 1264 (7.5%) | |
| Surgical approach | <.001 | |||
| Open | 20 820 (58.9%) | 9688 (52.3%) | 11 132 (66.2%) | |
| MIS | 14 532 (41.1%) | 8844 (47.7%) | 5688 (33.8%) | |
Abbreviation: MIS, minimally invasive surgery.
Overall, 16 820 (47.6%) patients underwent surgery at an honor roll hospital whereas 18 532 (52.4%) patients underwent surgery at a nonhonor roll hospital. Overall, patient age and sex were comparable among patients receiving care at honor roll vs nonhonor roll hospitals (all Ps > .05). In contrast, patients treated at honor roll hospitals had higher Charlson comorbidity scores (CS) (CS > 5: honor roll n = 7092 [42.2%] vs nonhonor roll n = 6992 [37.7%]; P < .001) and were more likely to undergo surgery using an open approach vs nonhonor roll hospitals (n = 11 132 [66.2%] vs n = 9688 [52.3%]; P < .001) (Table 1).
3.2. TO rates
The overall proportion of patients who achieved TO was 50.1%. The rates of the components included in the definition of TO and their cumulative percentages are presented in Figure 1. The rates of TO varied widely based on procedure type (Table 2). Patients undergoing surgery for esophageal cancer had lowest rates of TO followed by pancreatic, hepatic, colorectal, and lung cancer (esophagectomy: n = 388 [21.7%]; pancreatectomy: n = 608 [37.8%]; hepatectomy: n = 2748 [38.5%]; colorectal: n = 5440 [49.5%]; lung: n = 8348 [66.2%]). Patients undergoing surgery for the lung, esophagus, liver, and pancreas had comparable rates of TO at honor roll and nonhonor roll hospitals (Table 2). In contrast, patients undergoing colorectal cancer surgery at honor roll hospitals had a slightly lower rate of TO compared with nonhonor roll hospitals (honor roll n = 2520 [46.8%] vs nonhonor roll n = 2920 [52.2%]; P < .001).
Figure 1.
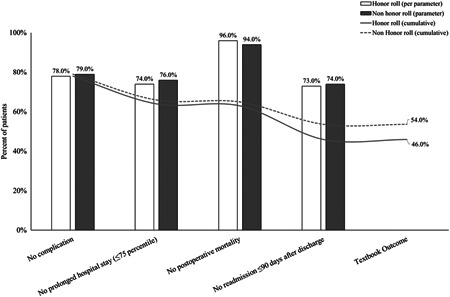
Textbook outcome distribution by its definition among honor roll and nonhonor roll hospitals
Table 2.
Unadjusted rates postoperative outcomes at honor roll and nonhonor roll hospitals
| Outcomes | Total | Nonhonor roll hospitals | Honor roll hospitals | P value |
|---|---|---|---|---|
| Colorectal | ||||
| No complications | 8204 (74.7%) | 4308 (77.0%) | 3896 (72.3%) | <.001 |
| No readmissions | 8092 (73.7%) | 4204 (75.1%) | 3888 (72.2%) | <.001 |
| No prolonged LOS | 8496 (77.3%) | 4388 (78.4%) | 4108 (76.2%) | .007 |
| No mortality | 10 580 (96.3%) | 5380 (96.1%) | 5200 (96.5%) | .300 |
| Textbook outcomes | 5440 (49.5%) | 2920 (52.2%) | 2520 (46.8%) | <.001 |
| Lung | ||||
| No complications | 11 356 (90.1%) | 6032 (90%) | 5324 (90.1%) | .870 |
| No readmissions | 9980 (79.2%) | 5320 (79.4%) | 4660 (78.9%) | .470 |
| No prolonged LOS | 10 892 (86.4%) | 5832 (87%) | 5060 (85.6%) | .022 |
| No mortality | 12 092 (95.9%) | 6400 (95.5%) | 5692 (96.3%) | .020 |
| Textbook outcomes | 8348 (66.2%) | 4488 (67.0%) | 3860 (65.3%) | .051 |
| Esophagus | ||||
| No complications | 1216 (67.9%) | 576 (66.7%) | 640 (69.0%) | .300 |
| No readmissions | 1136 (63.4%) | 528 (61.1%) | 608 (65.5%) | .050 |
| No prolonged LOS | 628 (35.0%) | 336 (38.9%) | 292 (31.5%) | <.001 |
| No mortality | 1612 (90.0%) | 768 (88.9%) | 844 (90.9%) | .150 |
| Textbook outcomes | 388 (21.7%) | 192 (22.2%) | 196 (21.1%) | .570 |
| Liver | ||||
| No complications | 5572 (78.0%) | 2860 (75.1%) | 2712 (81.4%) | <.001 |
| No readmissions | 4716 (66.1%) | 2512 (66.0%) | 2204 (66.1%) | .871 |
| No prolonged LOS | 4244 (59.4%) | 2284 (60.0%) | 1960 (58.8%) | .320 |
| No mortality | 6672 (93.4%) | 3516 (92.3%) | 3156 (94.7%) | <.001 |
| Textbook outcomes | 2748 (38.5%) | 1428 (37.5%) | 1320 (39.6%) | .070 |
| Pancreas | ||||
| No complications | 1508 (53.3%) | 880 (56.3%) | 628 (49.7%) | <.001 |
| No readmissions | 2024 (71.6%) | 1088 (69.6%) | 936 (74.1%) | .009 |
| No prolonged LOS | 2188 (77.4%) | 1224 (78.3%) | 964 (76.3%) | .210 |
| No mortality | 2608 (92.2%) | 1432 (91.6%) | 1176 (93%) | .140 |
| Textbook outcomes | 1068 (37.8%) | 608 (38.9%) | 460 (36.4%) | .180 |
Abbreviation: LOS, length of hospital stay.
3.3. The impact of hospital quality on clinical outcomes
On multivariable analyses, the association of honor roll hospitals and clinical outcomes varied based on procedure type. For instance, patients undergoing esophageal surgery for malignancy had 36% higher odds of not being readmitted to the honor hospital compared with nonhonor roll hospitals (odds ratio [OR], 1.36; 95% confidence interval [CI], 1.11‐1.66). In contrast, patients undergoing hepatic surgery at honor roll hospitals had 30% lower odds of not having a complication compared with nonhonor roll hospitals (OR, 0.70; 95% CI, 0.51‐0.96). In examining clinical outcomes of patients who underwent colorectal, lung, esophageal, pancreatic, and hepatic surgery, there was no difference in the odds of achieving TO at honor roll vs nonhonor roll hospitals (colorectal: OR, 0.87; 95% CI, 0.69‐1.10; lung: OR, 1.07; 95% CI, 0.87‐1.32; esophagus: OR, 1.44; 95% CI, 0.72‐2.89; liver: OR, 1.27; 95% CI, 0.87‐1.84; pancreas: OR, 1.04; 95% CI, 0.67‐1.62) (Table 3).
Table 3.
Multivariable logistic regression comparing outcomes of patients undergoing surgery at honor roll and nonhonor roll hospitals
| Outcomes | Honor roll hospitals | P value |
|---|---|---|
| Colorectal | ||
| No complications | 1.04 (0.67‐1.62) | .480 |
| No readmissions | 1.04 (0.84‐1.29) | .729 |
| No prolonged LOS | 1.09 (0.76‐1.55) | .654 |
| No mortality | 0.84 (0.51‐1.39) | .497 |
| Textbook outcomes | 0.87 (0.69‐1.10) | .243 |
| Lung | ||
| No complications | 0.81 (0.57‐1.14) | .214 |
| No readmissions | 0.95 (0.77‐1.17) | .626 |
| No prolonged LOS | 1.03 (0.63‐1.68) | .913 |
| No mortality | 0.73 (0.44‐1.22) | .230 |
| Textbook outcomes | 1.07 (0.87‐1.32) | .514 |
| Esophagus | ||
| No complications | 0.79 (0.52‐1.20) | .261 |
| No readmissions | 1.36 (1.11‐1.66) | .033 |
| No prolonged LOS | 0.81 (0.32‐2.04) | .649 |
| No mortality | 1.32 (0.52‐3.35) | .560 |
| Textbook outcomes | 1.44 (0.72‐2.89) | .307 |
| Liver | ||
| No complications | 0.70 (0.51‐0.96) | .025 |
| No readmissions | 0.88 (0.68‐1.15) | .137 |
| No prolonged LOS | 0.82 (0.51‐1.32) | .280 |
| No mortality | 0.77 (0.51‐1.17) | .156 |
| Textbook outcomes | 1.27 (0.87‐1.84) | .607 |
| Pancreas | ||
| No complications | 1.31 (0.84‐2.03) | .235 |
| No readmissions | 0.74 (0.49‐1.11) | .105 |
| No prolonged LOS | 0.92 (0.51‐1.67) | .515 |
| No mortality | 0.78 (0.36‐1.69) | .525 |
| Textbook outcomes | 1.04 (0.67‐1.62) | .480 |
Abbreviation: LOS, length of hospital stay.
Note: Bold values are statistically significant.
In examining the relationship between the rankings of hospitals and TO, there was no association between rankings of the top 50 hospitals and the risk‐adjusted rates of TO among different hospitals for patients undergoing surgery for colorectal, lung, esophagus, liver, and pancreatic cancer (colorectal β = 0.190, lung β = 0.057, esophagus β = 0.045, liver β = 0.047, pancreas β = 0.152; all Ps > .05). For example, patients undergoing surgery for pancreatic resection, the percentage of TO for patients undergoing each hospital increases by only 0.152 for each unit increase in hospital rank (P = .263). Interestingly, no linear association between hospital position in the rank and TO was observed when evaluating TO among USNWR ranked hospitals (Figure 2).
Figure 2.
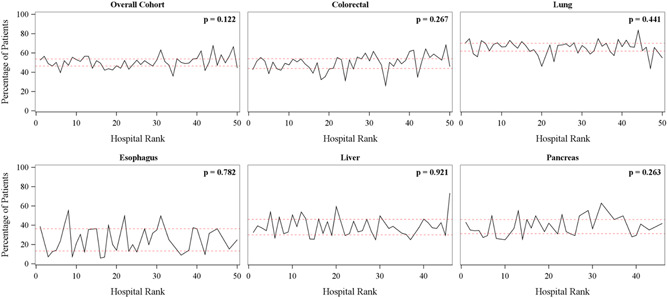
Rates of textbook outcomes (TOs) among patients undergoing surgery for cancer at the U.S. News & World Report 50 ranked hospitals stratified by procedure type. Note: P value depicts no linear relationship between the rank of hospital and rate of TO [Color figure can be viewed at wileyonlinelibrary.com]
Figure 3 depicts rates of TO for individual hospitals among patients undergoing surgery for colorectal, lung, esophagus, liver, and pancreatic surgery at honor roll and nonhonor roll hospitals, respectively. TO rates ranged from 0.39 to 0.58 for honor roll vs 0.36 to 0.68 for nonhonor roll hospitals. Of note, there was no correlation between hospital volume and TO for patients undergoing surgery at honor and nonhonor roll hospitals (Figure 3A,B).
Figure 3.
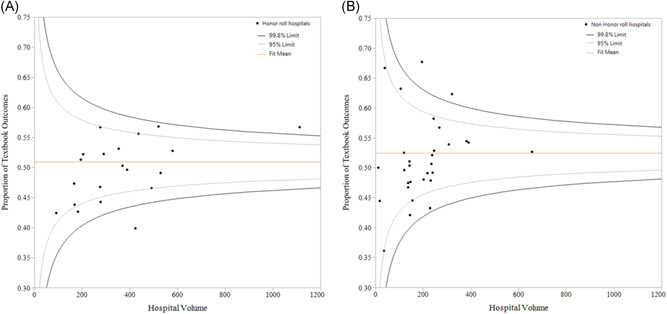
A, Textbook outcome variations across hospital volumes among patients undergoing surgical procedures at honor roll hospitals. B, Textbook outcome variations across hospital volumes among patients undergoing surgical procedures at nonhonor roll hospitals [Color figure can be viewed at wileyonlinelibrary.com]
4. DISCUSSION
Quality of surgical care delivered by hospitals has been under increased scrutiny over the past several decades. Monitoring quality of care among various hospitals can be challenging and relative differences in outcomes can be difficult to discern. To address this need, multiple organizations such as The Leapfrog Group, CMS, and USNWR have proposed different rating and ranking schemes to encourage transparency. 20 , 21 , 22 In turn, these data have been increasingly used by patients and policyholders to differentiate high vs low performing hospitals. In fact, rankings such as the USNWR have been demonstrated to influence patient decision‐making and choice of hospital. 3 These hospital ranking systems have; however, largely focused on assessing performance relative to individual metrics such as mortality, morbidity, and readmission. 23 , 24 , 25 , 26 More recently, composite measures have been proposed as a better means to assess variation among hospital performance rather than individual parameters. 9 , 27 To this point, our group and others have proposed TO as an “all or none” measure that more accurately represent a patient‐centered care perspective. 28 , 29 , 30 , 31 , 32 The current study was important because we examined USNWR rankings relative to success in achieving TO among patients undergoing colorectal, lung, esophagus, liver, and pancreatic surgery for cancer at honor roll and nonhonor roll hospitals. Of note, the likelihood among patients undergoing surgery for colorectal, lung, liver, pancreas, and esophagus at honor roll hospitals and nonhonor roll patients was comparable. In particular, the exact USWNR rank position among hospitals within the top 50 USNWR rankings also had no linear relationship with the rates of TO following surgical intervention. Interestingly, rates of TO varied widely across different procedure types with a patient undergoing esophageal surgery having the lowest rates of TO while individuals who underwent lung cancer surgery having the highest rates of TO.
Public reporting of hospital quality measures is one of the main tools utilized by patients and providers to facilitate informed decision‐making when selecting hospitals for a surgical procedure. 33 Despite the face validity and importance that patients, policymakers and other stakeholders of healthcare place on USNWR rankings, previous data have suggested that USNWR rankings among top‐ranked hospitals may not correlate with clinical outcomes. 20 For instance, Williams et al 34 noted that USNWR top‐ranked hospitals regularly failed to apply evidence‐based care for patients undergoing cardiac surgery. In fact, many non–top ranked hospitals performed better than USNWR top‐ranked hospitals in providing cardiovascular care consistent with NCCN guidelines. 34 The current study expanded on this previous work by specifically focusing on surgical care among cancer patients. In particular, we noted that risk‐adjusted rates of TO were comparable among honor roll and nonhonor roll hospitals among patients undergoing surgery for a wide range of different cancer diagnoses. In fact, there was no linear trend observed in assessing the relationship among USNWR ranked hospitals and TO in assessing the overall cohort, as well as according to each specific separate surgical procedure (Figure 2). The reason why TO did not differ among honor roll and nonhonor roll hospitals is undoubtedly multifactorial, yet it may be attributed to the fact that USNWR ranking methodology disproportionately takes into consideration subjective measures not necessarily related to quality such as reputation. 35 To this point, Cua et al 36 noted that the Best Hospital rankings for cancer, cardiology, gastroenterology, neurology, and orthopedics were more influenced by reputation on the total USWNR score than other objective metrics. Collectively, these data suggest that the exact ranking position within the USNWR had a minor impact on the likelihood of a patient achieving a TO.
Previous reports have noted that the USNWR ranking performed better when assessing certain clinical outcome measures, while failing to perform well on other measures. 24 , 25 For instance, Wang et al 4 reported that USNWR top‐ranked hospitals had better rates of 30‐day mortality for cardiovascular surgery while the rates of 30‐day readmissions were comparable with non–top ranked hospitals. Therefore, evaluating single parameters may not capture the multidimensional aspect of surgical quality as top‐ranked hospitals might perform better on one parameter while not as well on others. To this end, composite outcome measures such as TO might prove to be superior for the analyses of overall patient‐centered hospital performance. 37 Van Roessel et al 38 noted that TO can better reflect the quality and may be a powerful parameter to assess quality between different hospitals during regular audits for pancreatic surgery. Similarly, several other investigators reported TO as a useful tool to assess interhospital variations among patients undergoing complex surgery. 10 , 11 , 37 As the TO composite measure combines important quality parameters into a single metric, TO may increase the reliability to evaluate overall hospital performance. In addition, TO is easier to interpret than examining trends in varied individual performance parameters. 39 , 40 As such, TO represents a better standard quality parameter to assess whether a patient had a “textbook” or “ideal” episode of care. Interestingly, TO varied considerably based on the surgical procedure. For example, only roughly 1 in 5 patients undergoing an esophageal cancer operation had a TO; in contrast, 2 in 3 patients who had a lung resection could expect a TO. As such, these data highlight that a majority of patients undergoing surgery should anticipate encountering at least one adverse event. In turn, the data have important potential implications for patients, providers, and policymakers in assessing “real world” patient‐centered, episode‐based outcomes. Further investigations are needed; however, to evaluate whether composite measures such as TO along with individual parameters should be considered for incorporation into the methodology of USNWR hospital rankings for cancer surgery.
The current study should be interpreted in light of several limitations. As with any retrospective study, selection bias was possible. Furthermore, clinical data, such as the stage of the disease, histologic characteristics, estimated operative blood loss, and surgical margins were not adjusted in the multivariable analyses as USNWR takes into consideration the severity and complexity of the disease while ranking hospitals. In addition, as this study utilized Medicare data, clinical parameters such as tumor size, number of tumors, and extent of resection (ie, major vs minor) could not be captured; as such, unmeasured differences in tumor‐ and surgery‐related characteristics may have influenced the results. Due to the fact, that the current study included only Medicare patients, the results may not be applicable to a patient population younger than 65 years of age, individuals with other types of insurance, or patients with benign indications undergoing similar procedures. Despite its limitation, Medicare user files are important as they represent one of the largest patient population cohorts in the United States. Finally, other hospital characteristics were not controlled in the analyses, given that—by definition—the USNWR rankings scores take such hospital measures into account for specific hospital characteristics such as hospital teaching status, urban/rural hospitals, and availability of advanced technologies were not accounted for in the analyses, since the USNWR rankings take such hospital characteristics into account in the calculation of ranking scores. 41 However, differences in hospital characteristics were also accounted for using the random‐effects model when comparing outcomes among hospitals. Also, as USNWR rankings are generalized for all high‐ and low‐risk cancer procedures, the findings of the current study and the USNWR rankings may not be appropriate to use to select hospitals for a given specific high‐risk cancer procedure.
In conclusion, patients undergoing surgery for lung, esophageal, liver, pancreatic, and colorectal cancer had comparable rates of TO at honor roll vs nonhonor roll hospitals. In addition, no linear association was observed between hospital position in the rank and TO rates indicating that patients should not overly focus on the exact position within USNWR ranked hospitals. In turn, the data serve to inform patients and physicians that up to one‐half of patients undergoing surgery for cancer should anticipate at least one adverse outcome (ie, readmission within 90 days, prolonged LOS, postoperative complications, etc) following lung, esophageal, liver, pancreatic, and colorectal surgery. Furthermore, the current study served to highlight that patients may not benefit from overly prioritizing USNWR rankings when deciding where to undergo surgery for cancer.
CONFLICT OF INTERESTS
The authors declare that there are no conflict of interests.
SYNOPSIS
Patients undergoing surgery for lung, esophageal, liver, pancreatic, and colorectal cancer had comparable rates of textbook outcome (TO) at honor roll vs nonhonor roll hospitals. No linear association was observed between hospital position in the rank and TO indicating that patients should not overly focus on the exact position within U.S. News & World Report ranked hospitals.
Supporting information
Supporting information
Mehta R; Tsilimigras DI; Paredes AZ, et al. Comparing textbook outcomes among patients undergoing surgery for cancer at U. S. News & World Report ranked hospitals. J Surg Oncol. 2020;121:927–935. 10.1002/jso.25833
DATA AVAILABILITY STATEMENT
The data that support the findings of this study are available from the corresponding author upon reasonable request.
REFERENCES
- 1.Understanding Quality Measurement. https://www.ahrq.gov/professionals/quality‐patient‐safety/quality‐resources/tools/chtoolbx/understand/index.html. Accessed July 13, 2019.
- 2.Accountable Care Organizations. https://www.cms.gov/Medicare/Medicare‐Fee‐for‐Service‐Payment/ACO/. Accessed July 13, 2019.
- 3.Murphy MGOEGJ. U.S. News & World Report Best Hospitals 2015‐16. https://www.usnews.com/pubfiles/BH2015‐16MethodologyReport.pdf. Accessed July 13, 2019.
- 4. Wang DE, Wadhera RK, Bhatt DL. Association of rankings with cardiovascular outcomes at top‐ranked hospitals vs nonranked hospitals in the United States. JAMA Cardiol. 2018;3(12):1222‐1225. [DOI] [PMC free article] [PubMed] [Google Scholar]
- 5. Burgers JA, Damhuis RA. 30‐day mortality after the start of systemic anticancer therapy for lung cancer: is it really a useful performance indicator? ERJ Open Res. 2018;4(4):00030‐2018. [DOI] [PMC free article] [PubMed] [Google Scholar]
- 6. Graham LA, Mull HJ, Wagner TH, et al. Comparison of a potential hospital quality metric with existing metrics for surgical quality‐associated readmission. JAMA Netw Open. 2019;2(4):e191313. [DOI] [PMC free article] [PubMed] [Google Scholar]
- 7. Kneuertz PJ, Pitt HA, Bilimoria KY, et al. Risk of morbidity and mortality following hepato‐pancreato‐biliary surgery. J Gastrointest Surg. 2012;16(9):1727‐1735. [DOI] [PubMed] [Google Scholar]
- 8. Parina RP, Chang DC, Rose JA, Talamini MA. Is a low readmission rate indicative of a good hospital? J Am Coll Surg. 2015;220(2):169‐176. [DOI] [PubMed] [Google Scholar]
- 9. Dimick JB, Staiger DO, Baser O, Birkmeyer JD. Composite measures for predicting surgical mortality in the hospital. Health Aff. 2009;28(4):1189‐1198. [DOI] [PubMed] [Google Scholar]
- 10. Merath K, Chen Q, Bagante F, et al. Textbook outcomes among medicare patients undergoing hepatopancreatic surgery. Ann Surg. 2018:1. [DOI] [PubMed] [Google Scholar]
- 11. Salet N, Bremmer RH, Verhagen MAMT, et al. Is textbook outcome a valuable composite measure for short‐term outcomes of gastrointestinal treatments in the Netherlands using hospital information system data? A retrospective cohort study. BMJ Open. 2018;8(2):e019405. [DOI] [PMC free article] [PubMed] [Google Scholar]
- 12. Kolfschoten NE, Kievit J, Gooiker GA, et al. Focusing on desired outcomes of care after colon cancer resections; hospital variations in 'textbook outcome'. Eur J Surg Oncol. 2013;39(2):156‐163. [DOI] [PubMed] [Google Scholar]
- 13. Lawthers AG, McCarthy EP, Davis RB, Peterson LE, Palmer RH, Iezzoni LI. Identification of in‐hospital complications from claims data. Is it valid? Med Care. 2000;38(8):785‐795. [DOI] [PubMed] [Google Scholar]
- 14. Weingart SN, Iezzoni LI, Davis RB, et al. Use of administrative data to find substandard care: validation of the complications screening program. Med Care. 2000;38(8):796‐806. [DOI] [PubMed] [Google Scholar]
- 15. Iezzoni LI, Daley J, Heeren T, et al. Identifying complications of care using administrative data. Med Care. 1994;32(7):700‐715. [DOI] [PubMed] [Google Scholar]
- 16. Osborne NH, Nicholas LH, Ryan AM, Thumma JR, Dimick JB. Association of hospital participation in a quality reporting program with surgical outcomes and expenditures for medicare beneficiaries. JAMA. 2015;313(5):496‐504. [DOI] [PMC free article] [PubMed] [Google Scholar]
- 17. Chen Y, Scholten A, Chomsky‐Higgins K, et al. Risk factors associated with perioperative complications and prolonged length of stay after laparoscopic adrenalectomy. JAMA Surg. 2018;153(11):1036‐1041. [DOI] [PMC free article] [PubMed] [Google Scholar]
- 18. Mehta R, Ejaz A, Hyer JM, et al. The impact of dedicated cancer centers on outcomes among medicare beneficiaries undergoing liver and pancreatic cancer surgery. Ann Surg Oncol. 2019;26(12):4083‐4090. [DOI] [PubMed] [Google Scholar]
- 19. Pradarelli JC, Healy MA, Osborne NH, Ghaferi AA, Dimick JB, Nathan H. Variation in medicare expenditures for treating perioperative complications: the cost of rescue. JAMA Surg. 2016;151(12):e163340. [DOI] [PubMed] [Google Scholar]
- 20. Wang DE, Wadhera RK, Bhatt DL. Association of rankings with cardiovascular outcomes at top‐ranked hospitals vs nonranked hospitals in the United States. JAMA Cardiol. 2018;3:1222‐1225. [DOI] [PMC free article] [PubMed] [Google Scholar]
- 21. Galvin RS, Delbanco S, Milstein A, Belden G. Has the leapfrog group had an impact on the health care market? Health Aff. 2005;24(1):228‐233. [DOI] [PubMed] [Google Scholar]
- 22. Kaye DR, Norton EC, Ellimoottil C, et al. Understanding the relationship between the Centers for Medicare and Medicaid Services' Hospital Compare star rating, surgical case volume, and short‐term outcomes after major cancer surgery. Cancer. 2017;123(21):4259‐4267. [DOI] [PMC free article] [PubMed] [Google Scholar]
- 23. De AC. How helpful are hospital rankings and ratings for the public's health? Milbank Q. 2016;94(4):729‐732. [DOI] [PMC free article] [PubMed] [Google Scholar]
- 24. Sheetz KH, Chhabra K, Nathan H, Dimick JB. The quality of surgical care at hospitals associated with America's highest‐rated medical centers. Ann Surg. 2019:1. [published online ahead of print January 18, 2019]. [DOI] [PubMed] [Google Scholar]
- 25. Lichtman JH, Leifheit EC, Wang Y, Goldstein LB. Hospital quality metrics: "America's Best Hospitals" and outcomes after ischemic stroke. J Stroke Cerebrovasc Dis. 2019;28(2):430‐434. [DOI] [PubMed] [Google Scholar]
- 26. Pope DG. Reacting to rankings: evidence from "America's Best Hospitals". J Health Econ. 2009;28(6):1154‐1165. [DOI] [PubMed] [Google Scholar]
- 27. Samuel CA, Zaslavsky AM, Landrum MB, Lorenz K, Keating NL. Developing and evaluating composite measures of cancer care quality. Med Care. 2015;53(1):54‐64. [DOI] [PubMed] [Google Scholar]
- 28. Shwartz M, Restuccia JD, Rosen AK. Composite measures of health care provider performance: a description of approaches. Milbank Q. 2015;93(4):788‐825. [DOI] [PMC free article] [PubMed] [Google Scholar]
- 29. Reeves D, Campbell SM, Adams J, Shekelle PG, Kontopantelis E, Roland MO. Combining multiple indicators of clinical quality: an evaluation of different analytic approaches. Med Care. 2007;45(6):489‐496. [DOI] [PubMed] [Google Scholar]
- 30. Merkow RP, Hall BL, Cohen ME, et al. Validity and feasibility of the American college of surgeons colectomy composite outcome quality measure. Ann Surg. 2013;257(3):483‐489. [DOI] [PubMed] [Google Scholar]
- 31. Poelemeijer YQM, Marang‐van de Mheen PJ, Wouters M, Nienhuijs SW, Liem RSL. Textbook outcome: an ordered composite measure for quality of bariatric surgery. Obes Surg. 2019;29(4):1287‐1294. [DOI] [PubMed] [Google Scholar]
- 32. Priego P, Cuadrado M, Ballestero A, Galindo J, Lobo E. Comparison of laparoscopic versus open gastrectomy for treatment of gastric cancer: analysis of a textbook outcome. J Laparoendosc Adv Surg Tech A. 2019;29(4):458‐464. [DOI] [PubMed] [Google Scholar]
- 33. Dy SM, Chan KS, Chang HY, Zhang A, Zhu J, Mylod D. Patient perspectives of care and process and outcome quality measures for heart failure admissions in US hospitals: how are they related in the era of public reporting? Int J Qual Health Care. 2016;28(4):522‐528. [DOI] [PubMed] [Google Scholar]
- 34. Williams SC, Koss RG, Morton DJ, Loeb JM. Performance of top‐ranked heart care hospitals on evidence‐based process measures. Circulation. 2006;114(6):558‐564. [DOI] [PubMed] [Google Scholar]
- 35. Sehgal AR. The role of reputation in U.S. News & World Report's rankings of the top 50 American hospitals. Ann Intern Med. 2010;152(8):521‐525. [DOI] [PubMed] [Google Scholar]
- 36. Cua S, Moffatt‐Bruce S, White S. Reputation and the Best Hospital Rankings: what does it really mean? Am J Med Qual. 2017;32(6):632‐637. [DOI] [PubMed] [Google Scholar]
- 37. Merath K, Chen Q, Bagante F, et al. A multi‐institutional international analysis of textbook outcomes among patients undergoing curative‐intent resection of intrahepatic cholangiocarcinoma. JAMA Surg. 2019;154:e190571. [DOI] [PMC free article] [PubMed] [Google Scholar]
- 38. Van Roessel S, Mackay TM, van Dieren S, et al. Textbook outcome: nationwide analysis of a novel quality measure in pancreatic surgery. Ann Surg. 2020;27:155‐162. [DOI] [PubMed] [Google Scholar]
- 39. Marang‐van de Mheen PJ, Dijs‐Elsinga J, Otten W, et al. The relative importance of quality of care information when choosing a hospital for surgical treatment: a hospital choice experiment. Med Decis Making. 2011;31(6):816‐827. [DOI] [PubMed] [Google Scholar]
- 40. Dijs‐Elsinga J, Otten W, Versluijs MM, et al. Choosing a hospital for surgery: the importance of information on quality of care. Med Decis Making. 2010;30(5):544‐555. [DOI] [PubMed] [Google Scholar]
- 41.Staff USN. How and Why We Rank and Rate Hospitals. https://health.usnews.com/health‐care/best‐hospitals/articles/faq‐how‐and‐why‐we‐rank‐and‐rate‐hospitals. Accessed July 13, 2019.
Associated Data
This section collects any data citations, data availability statements, or supplementary materials included in this article.
Supplementary Materials
Supporting information
Data Availability Statement
The data that support the findings of this study are available from the corresponding author upon reasonable request.