

Summary
Background
Glucagon‐like peptide‐1 receptor agonists may be a treatment option in patients with non‐alcoholic fatty liver disease (NAFLD).
Aims
To investigate the effects of semaglutide on liver stiffness and liver fat in subjects with NAFLD using non‐invasive magnetic resonance imaging (MRI) methods.
Methods
This randomised, double‐blind, placebo‐controlled trial enrolled subjects with liver stiffness 2.50‐4.63 kPa by magnetic resonance elastography (MRE) and liver steatosis ≥10% by MRI proton density fat fraction (MRI‐PDFF). The primary endpoint was change from baseline to week 48 in liver stiffness assessed by MRE.
Results
Sixty‐seven subjects were randomised to once‐daily subcutaneous semaglutide 0.4 mg (n = 34) or placebo (n = 33). Change from baseline in liver stiffness was not significantly different between semaglutide and placebo at week 48 (estimated treatment ratio 0.96 (95% CI 0.89, 1.03; P = 0.2798); significant differences in liver stiffness were not observed at weeks 24 or 72. Reductions in liver steatosis were significantly greater with semaglutide (estimated treatment ratios: 0.70 [0.59, 0.84], P = 0.0002; 0.47 [0.36, 0.60], P < 0.0001; and 0.50 [0.39, 0.66], P < 0.0001) and more subjects achieved a ≥ 30% reduction in liver fat content with semaglutide at weeks 24, 48 and 72, (all P < 0.001). Decreases in liver enzymes, body weight and HbA1c were also observed with semaglutide.
Conclusions
The change in liver stiffness in subjects with NAFLD was not significantly different between semaglutide and placebo. However, semaglutide significantly reduced liver steatosis compared with placebo which, together with improvements in liver enzymes and metabolic parameters, suggests a positive impact on disease activity and metabolic profile.
ClinicalTrials.gov identifier: NCT03357380.
In a randomised, double‐blind trial, 67 subjects with NAFLD were randomised to semaglutide 0.4 mg (n = 34) once daily or placebo (n = 33) for 72 weeks. Change in liver stiffness (the primary endpoint) was not significantly different between semaglutide and placebo but liver steatosis, as well as liver enzymes and metabolic parameters, were significantly improved with semaglutide compared with placebo.
1. INTRODUCTION
NAFLD is a hepatic manifestation of the metabolic syndrome and is characterised by excessive hepatic fat accumulation associated with insulin resistance. 1 , 2 , 3 Liver biopsy remains the gold standard for the diagnosis and evaluation of treatment response, and is the only means to reliably differentiate non‐alcoholic steatohepatitis (NASH) from NAFLD. 2 However, the procedure is invasive with a risk of complications, such as bleeding, pain and infection. Biopsies can also be associated with high intra‐ and inter‐observer variability, and the heterogeneity of liver structures and fibrosis, with samples only representing 1/50 000 of the liver can also be an issue. 4 , 5 Imaging has emerged as an alternative to assess liver fat content and liver stiffness across the entire liver, with MRI‐proton density fat fraction (MRI‐PDFF) and MR elastography (MRE) regarded as the most accurate non‐invasive methods to assess hepatic steatosis and fibrosis (liver stiffness), respectively. 4 , 5 , 6 , 7 , 8 , 9 , 10 , 11 Both MRI‐PDFF and MRE have also been used to evaluate treatment response in patients with NAFLD 10 , 12 , 13 , 14 and results correlate with biopsy findings. 10 Lifestyle modification is currently the cornerstone of treatment for patients with NAFLD, with weight loss being the primary focus. 15 Currently available pharmacological options are limited 15 , 16 but there are emerging data regarding the beneficial effects of glucagon‐like peptide‐1 receptor agonists (GLP‐1RAs) among patients with NAFLD. 15 , 16 , 17 , 18 , 19 , 20 , 21 Subcutaneous semaglutide is a GLP‐1RA approved for the treatment of type 2 diabetes and obesity that has shown beneficial effects in reducing glycated haemoglobin (HbA1c) and body weight, as well as cardiovascular benefits in patients at high cardiovascular risk. 22 , 23 , 24 , 25 , 26 In patients with NASH, treatment with semaglutide resulted in a significantly higher percentage achieving NASH resolution with no worsening of fibrosis compared with placebo after 72 weeks of treatment in a phase 2 trial. 21 The current trial investigated the effects of subcutaneous semaglutide on liver stiffness, a surrogate marker of fibrosis, and liver fat in subjects with NAFLD, using non‐invasive MRI methods after 24, 48 and 72 weeks of treatment.
2. MATERIALS AND METHODS
2.1. Trial design
This was a randomised, double‐blind, placebo‐controlled, parallel‐group, two‐centre, phase 1 clinical pharmacology trial, conducted over 72 weeks, that investigated the effects of subcutaneous semaglutide vs placebo in subjects with NAFLD and increased liver stiffness (ClinicalTrials.gov identifier, NCT03357380).
The trial protocol was approved by relevant local independent ethics committees (Ärztekammer Nordrhein Ethikkommission, Düsseldorf and Ethik‐Kommission der Landesärztekammer Rheinland‐Pfalz, Mainz, both Germany) and was conducted in accordance with the Declaration of Helsinki and International Council for Harmonisation of Technical Requirements for Pharmaceuticals for Human Use. All subjects provided written informed consent before any trial‐related activities were initiated.
2.2. Subjects
Subjects aged 18‐75 years, with a BMI of 25‐40 kg/m2, liver stiffness of 2.50‐4.63 kPa measured by MRE and >4.0 kPa measured via vibration controlled transient elastography (VCTE) (FibroScan®, EchoSens, Paris, France), in order to include a trial population with a high likelihood of histological fibrosis, 9 liver steatosis ≥10 measured by MRI‐PDFF, and with or without T2D were included in the trial.
Key exclusion criteria included: documented causes of chronic liver disease other than NAFLD (including NASH); positive test for hepatitis B surface antigens or hepatitis C antibodies, HIV‐1/HIV‐2 antibodies or HIV‐1 antigen at screening; known or suspected increased consumption of alcohol (>12 g/day for women; >24 g/day for men) or drugs; treatment with vitamin E or pioglitazone and HbA1c >9.5%. In addition, subjects with a diagnosis of type 1 diabetes, those with a history or presence of pancreatitis (acute/chronic), and females who were pregnant or breastfeeding or of child‐bearing potential and not using highly effective contraceptive methods were excluded. Other exclusion criteria included prior surgery for obesity, current treatment with weight‐loss therapies, and recent treatment with other glucose‐lowering medications, including GLP‐1RAs, sodium‐glucose cotransporter‐2 inhibitors and insulin. Recent use of drugs with potential effects on steatosis, for example certain corticosteroids regimens, also led to exclusion.
2.3. Trial treatments
Eligible subjects were randomised 1:1 to subcutaneous semaglutide 0.4 mg once daily or placebo for 72 weeks. Randomisation was done using an IWRS and was stratified according to liver stiffness (<3.64–≥3.64 kPa). A cut‐off of 3.64 has been shown to have high diagnostic accuracy for discriminating advanced (stage 3‐4) from stage 0‐2 fibrosis. 27 Semaglutide was initiated at 0.05 mg/day (or corresponding volume of placebo) for the first 4 weeks of treatment and thereafter increased every 4 weeks (0.1, 0.2 and 0.3 mg/day) to reach a target dose of 0.4 mg/day by week 16 (Figure S1). Injections were administered at approximately the same time of day. Subjects not reaching the target dose were permitted to stay on a lower dose and remain in the trial. Temporary cessation of the trial product for up to 21 days was permitted; however, after ≥21 days of treatment cessation, subjects were withdrawn from the trial. Nutritional and physical activity counselling were allowed during the trial but subjects were not permitted to participate in any organised weight reduction programme.
2.4. Endpoints
The primary endpoint was change from baseline to week 48 in liver stiffness assessed by MRE. Key secondary endpoints included: change from baseline to weeks 24 and 72 in liver stiffness assessed by MRE; the proportion of subjects achieving a ≥ 15% reduction in liver stiffness (MRE) from baseline; liver steatosis evaluated by MRI‐PDFF; and the proportion of subjects achieving a ≥ 30% reduction in liver fat content from baseline (MRI‐PDFF). Other secondary endpoints were: change from baseline in total liver volume, liver fat volume, visceral adipose tissue and abdominal subcutaneous adipose tissue assessed by MRI; and changes from baseline in body weight, waist circumference and BMI.
Exploratory endpoints included: change from baseline in liver enzymes (alanine aminotransferase [ALT], aspartate aminotransferase [AST], gamma‐glutamyl transferase [GGT]); glucose metabolism parameters (HbA1c, fasting plasma glucose, fasting glucagon, homeostatic model assessment of insulin resistance [HOMA‐IR]) and cardiovascular risk factors (eg lipids, blood pressure and high‐sensitivity C‐reactive protein [hsCRP]). Exploratory blood biomarkers of liver fibrosis (serum enhanced liver fibrosis score, released N‐terminal pro‐peptide of type III collagen, neo‐epitope in C‐terminal of type VI collagen), apoptosis (cytokeratin 18 fragments), hepatotoxicity (microRNA 122), inflammation (interleukin‐1 receptor antagonist [IL‐1RA], monocyte chemoattractant protein) and metabolism (FGF‐21, adiponectin) were also assessed, as were imaging biomarkers (liver stiffness measured by VCTE and steatosis assessed by controlled attenuation parameter). Changes in FibroScan‐AST (FAST) score, which combines liver stiffness measured by VCTE, steatosis by controlled attenuation parameter and serum AST for the non‐invasive identification of patients with NASH and ≥F2 fibrosis, were assessed post hoc. 28
Vital signs (blood pressure, pulse), electrocardiogram and biochemical and haematological parameters were measured during the trial. Adverse events (AEs; defined as events that had an onset date during the on‐treatment period and coded using the Medical Dictionary for Regulatory Activities, version 22.1) and hypoglycaemic episodes (classified according to the American Diabetes Association) 29 were also reported.
2.5. Magnetic resonance imaging and elastography assessments
MRE and MRI‐PDFF assessments were performed at baseline and every 24 weeks after randomisation to evaluate liver stiffness and liver steatosis, respectively. MRI assessments were conducted as described previously. 30 MRI/MRE assessments were conducted using a Siemens 1.5T MRI scanner. MRI‐PDFF was performed using a 3D 6‐echo gradient echo sequence covering the entire liver, and quantitative PDFF maps were reconstructed. MRI‐PDFF was assessed using regions of interest covering the entire liver, excluding bile ducts and veins. A separate T1‐weighted scan was used to assess liver volume. MRE scans were obtained in four axial slices, and in accordance with the Quantitative Imaging Biomarkers Alliance guidelines. 31 In brief, the passive driver was placed over the right lower chest wall at the level of the xiphisternum in the midclavicular line. Regions of interest were drawn at least 1 cm inside the liver boundary, avoiding areas of incoherent waves, and contained a minimum of 500 pixels per slice.
Liver volume was determined by manual segmentation from 3D T1‐weighted MR images. Liver fat volume was calculated by multiplying the liver volume by the liver fat fraction measured with the MRI‐PDFF scan. The determination of visceral and abdominal subcutaneous adipose tissue volumes was undertaken using an automated algorithm for segmentation of visceral and abdominal subcutaneous adipose tissue from axial abdominal MRI data, which excluded intermuscular adipose tissue and bone marrow components. All MRI scans were performed following at least 4 hours of fasting.
2.6. Statistical analysis
The sample size was calculated to detect a 15% reduction in the treatment ratio of MRE between semaglutide and placebo at the 5% significance level. Assuming a treatment ratio of 0.85 and a coefficient of variation of 0.18, 54 subjects were required to complete 48 weeks of treatment (and MR assessments) for 90% power; with an assumed dropout rate of 18%, a total sample size of 66 subjects was needed.
Analysis of efficacy was based on the full analysis set, which included all randomised subjects (as randomised population); the safety analysis set was used for safety endpoints, which included all subjects receiving at least one dose of randomised treatment (as treated population). Statistical analyses (efficacy and safety) were based on the treatment period starting on the date of first administration of trial product and ending on the end‐of‐trial date.
The primary endpoint was analysed using mixed model for repeated measures with the log‐transformed value of liver stiffness (MRE) as the response, and treatment, baseline categorical liver stiffness (MRE ≥3.64 kPa, <3.64 kPa) as factors, and baseline body weight and the log‐transformed baseline liver stiffness as covariates, nested within weeks using an unstructured covariance matrix. From this model, the treatment ratio at week 48 was estimated for semaglutide vs placebo and the corresponding 95% confidence interval (CI) and the two‐sided P value were calculated, together with the estimated ratio to baseline for each treatment arm. Potential missing data at week 48 were assumed to be missing at random.
The same mixed model for repeated measures used for the primary analysis estimation was also performed for all secondary endpoints, comparing treatment groups after 24, 48 and 72 weeks of treatment. Exploratory endpoints, including liver enzymes, glucose metabolism parameters, cardiovascular factors and biomarkers, were summarised. There was no prespecified strategy adjusting for multiple testing.
3. RESULTS
3.1. Subject disposition and baseline demographics and characteristics
Of 266 subjects screened for inclusion in the trial, 67 were enrolled, 34 of whom were randomised to semaglutide 0.4 mg once daily and 33 to placebo (Figure S2). Of these, 27 subjects (79.4%) receiving semaglutide and 30 subjects (90.9%) receiving placebo completed the trial and had evaluable 48‐week MRE data. Seven subjects in the semaglutide arm (including one subject not exposed to treatment) and three in the placebo group were withdrawn from the trial. The most common reason for withdrawal was withdrawal of consent (n = 5 semaglutide; n = 3 placebo).
Baseline demographics and characteristics were generally well balanced with no major differences between the two groups (Table 1 and Table S1). The mean age was 60 years, and the majority of subjects were male (70%), had T2D (73%), and were classified as obese (BMI ≥30 kg/m2; 94%). Most subjects (85%) were in the low liver stiffness strata (only 10 subjects had a liver stiffness ≥3.64 kPa). The geometric means for liver stiffness (MRE) and liver steatosis (MRI‐PDFF) were 3.02 kPa and 17.7%, respectively.
TABLE 1.
Baseline demographics and clinical characteristics
| Semaglutide 0.4 mg (n = 34) | Placebo (n = 33) | Total (n = 67) | |
|---|---|---|---|
| Age (years), mean (SD) | 59.5 (10.1) | 60.5 (8.5) | 60.0 (9.3) |
| Male/female, n (%) | 23 (67.6) / 11 (32.4) | 24 (72.7) / 9 (27.3) | 47 (70.1)/20 (29.9) |
| Caucasian, n (%) | 34 (100) | 33 (100) | 67 (100) |
| Non‐Hispanic/Non‐Latino | 34 (100) | 33 (100) | 67 (100) |
| HbA1c (%), mean (SD) | |||
| Type 2 diabetes | 7.3 (0.9) | 7.4 (1.0) | 7.3 (1.0) |
| Non‐type 2 diabetes | 6.0 (0.5) | 5.9 (0.3) | 5.9 (0.4) |
| Body weight (kg), mean (SD) | 105.1 (15.3) | 102.3 (12.7) | 103.7 (14.0) |
| Body mass index (kg/m2), n (%) | |||
| ≥25‐<30 | 2 (5.9) | 2 (6.1) | 4 (6.0) |
| ≥30‐<35 | 15 (44.1) | 21 (63.6) | 36 (53.7) |
| ≥35 | 17 (50.0) | 10 (30.3) | 27 (40.3) |
| Liver stiffness strata by MRE, n (%) | |||
| Low (<3.64 kPa) | 28 (82.4) | 29 (87.9) | 57 (85.1) |
| High (≥3.64 kPa) | 6 (17.6) | 4 (12.1) | 10 (14.9) |
| MR scan, geometric mean (CV) | |||
| Liver stiffness by MRE (kPa) | 3.08 (39.6) | 2.95 (38.7) | 3.02 (39.3) |
| Liver steatosis by MRI‐PDFF (%) | 18.1 (70.3) | 17.3 (67.8) | 17.7 (68.9) |
| Liver stiffness (kPa) by VCTE, geometric mean (CV) | 8.9 (70.8) | 8.1 (80.1) | 8.5 (75.5) |
| Liver steatosis (dB/m) by controlled attenuation parameter, mean (SD) | 350 (31) | 332 (42) | 341 (38) |
| Liver enzymes, geometric mean (CV) | |||
| Alanine aminotransferase (U/L) | 40 (89.2) | 35 (78.1) | 37 (84.1) |
| Aspartate aminotransferase (U/L) | 31 (71.5) | 29 (62.8) | 30 (67.6) |
Abbreviation: CV, coefficient of variation; HbA1c, glycated haemoglobin; MRE, magnetic resonance elastography; MRI‐PDFF, magnetic resonance imaging‐proton density fat fraction; SD, standard deviation; VCTE, vibration controlled transient elastography.
3.2. Magnetic resonance imaging
3.2.1. Change in liver stiffness
The primary endpoint of change from baseline in liver stiffness as assessed by MRE was not significantly different between semaglutide and placebo at week 48 (Figure 1A). The estimated mean ratio to baseline at week 48 was 0.94 for semaglutide and 0.98 for placebo (P = .2798). No significant differences in liver stiffness were observed between semaglutide and placebo at week 24 (or week 72). Individual changes in liver stiffness are shown in Figure S3A.
FIGURE 1.
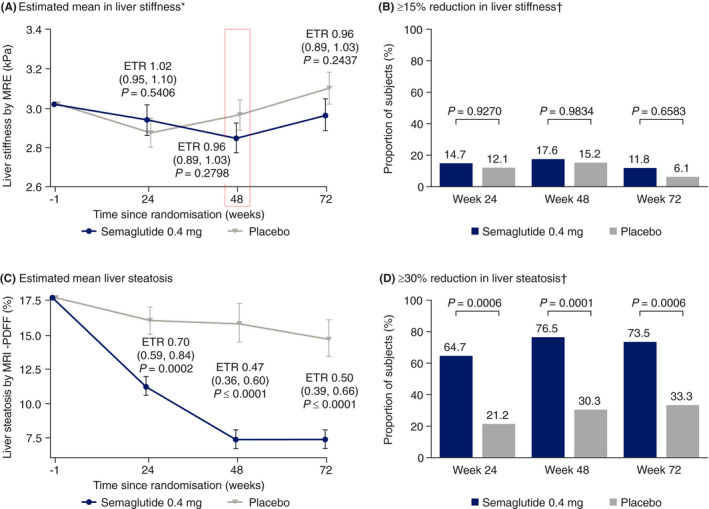
Changes from baseline in (A) liver stiffness by magnetic resonance elastography (MRE),* (B) proportion of subjects with a ≥ 15% reduction in liver stiffness by MRE,† (C) liver steatosis by magnetic resonance imaging‐proton density fat fraction (MRI‐PDFF) and (D) proportion of subjects with a ≥ 30% reduction in liver steatosis by MRI‐PDFF† at weeks 24, 48 and 72 with semaglutide 0.4 mg once daily and placebo. *Change from baseline to week 48 represents the primary endpoint. †Proportions of subjects are based on observed data with missing data imputed by mixed model for repeated measures predicted values. Two‐sided P value from logistic regression. Data (A and C) are estimated treatment ratios (95% confidence intervals). ETR, estimated treatment ratio
3.2.2. Liver stiffness responders
No difference between semaglutide and placebo was seen in the proportion of subjects who achieved a ≥ 15% reduction in liver stiffness at weeks 24, 48 and 72, as assessed by MRE (Figure 1B). Fewer subjects treated with semaglutide had a ≥ 15% increase in liver stiffness (MRE) compared with placebo at week 48 (0 vs 4 [13.3%] patients) and week 72 (1 [3.7%] vs 8 [27.6%] patients).
3.2.3. Change in liver steatosis
As assessed by MRI‐PDFF, liver fat content was reduced from baseline with semaglutide over the course of the trial (Figure 1C). The estimated mean ratio to baseline values for semaglutide vs placebo were significant at each timepoint (week 24: 0.64 vs 0.91 [P = .0002]; week 48: 0.42 vs 0.89 [P < .0001]; week 72: 0.42 vs 0.83 [P < .0001]). Individual changes in liver steatosis are shown in Figure S3B.
3.2.4. Liver steatosis responders
At all timepoints, a significantly greater proportion of subjects achieved a ≥ 30% reduction in liver fat content, as assessed by MRI‐PDFF, with semaglutide (P < .001 for each timepoint) (Figure 1D).
3.2.5. Changes in other liver assessments by MRI
Significant differences between semaglutide and placebo were seen at all timepoints assessed in changes from baseline (measured as ratio to baseline) in liver fat volume (0.33‐0.52 vs 0.80‐0.88), total liver volume (0.79‐0.82 vs 0.96‐0.97), visceral adipose tissue (0.75‐0.83 vs 1.00‐1.03) and abdominal subcutaneous adipose tissue (0.81‐0.87 vs 0.97‐1.00), assessed by MRI (all P < .0001 in favour of semaglutide at weeks 24, 48 and 72) (Figure 2).
FIGURE 2.
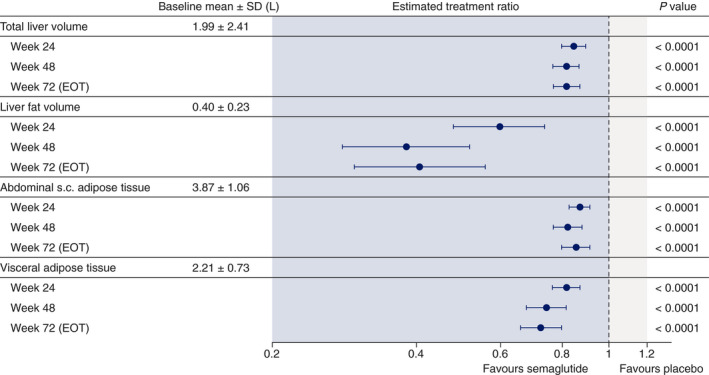
Changes from baseline (estimated treatment ratios and 95% confidence intervals) in total liver volume, liver fat volume, abdominal subcutaneous (s.c.) adipose tissue and visceral adipose tissue assessed by magnetic resonance imaging at weeks 24, 48 and 72 with semaglutide 0.4 mg once daily and placebo. Data from on‐treatment period. Estimates are from mixed model for repeated measures. EOT, end of treatment; SD, standard deviation
3.3. Vibration controlled transient elastography
Changes in liver stiffness assessed by VCTE were consistent with MRE assessments, with liver stiffness appearing to decrease with semaglutide and placebo at weeks 24 and 48, with no significant differences between treatments (Figure S3A). Also consistent with MRI‐PDFF, decreases in liver steatosis assessed by controlled attenuation parameter were significant in favour of semaglutide at weeks 48 and 72 (both P < .05) (Figure S3B).
3.4. Metabolic parameters
Semaglutide was associated with significant reductions in body weight from baseline compared with placebo at all timepoints, with an estimated treatment difference (ETD) of –9.68% (95% CI –12.58, –6.77; P < .0001) at week 72 (Table 2). Changes in BMI and waist circumference were consistent with body weight loss (data not shown). Furthermore, at week 72, there was a positive correlation between change in body weight and change in liver fat content by MRI‐PDFF in both the placebo and semaglutide groups, with a large overlap in subjects achieving weight loss and a decrease in liver fat content, and in subjects with weight gain and an increase in liver fat content within each treatment group (Figure S4A).
TABLE 2.
Changes from baseline in metabolic parameters
| Semaglutide 0.4 mg (n = 34) | Placebo (n = 33) | P value | ||
|---|---|---|---|---|
| Mean relative change from baseline in body weight (%) | ||||
| ETD (95% CI) | ||||
| Week 24 | –8.34 | –0.25 | –8.09 (–9.99, –6.20) | ≤ 0.0001 |
| Week 48 | –11.18 | –0.65 | –10.52 (–13.40, –7.65) | ≤ 0.0001 |
| Week 72 | –10.83 | –1.15 | –9.68 (–12.58, –6.77) | ≤ 0.0001 |
| Mean change from baseline in HbA1c (%‐points) – in subjects with T2D | ||||
| n = 28 | n = 21 | ETD (95% CI) | ||
| Week 24 | –1.03 | 0.05 | –1.08 (–1.44, –0.72) | ≤ 0.0001 |
| Week 48 | –1.01 | –0.05 | –0.97 (–1.34, –0.60) | ≤ 0.0001 |
| Week 72 | –1.03 | –0.03 | –1.00 (–1.38, –0.62) | ≤ 0.0001 |
| Mean change from baseline in fasting plasma glucose (mmol/L) – in subjects with T2D | ||||
| n = 27 | n = 21 | ETD (95% CI) | ||
| Week 24 | –1.97 | 0.04 | –2.01 (–3.03, –0.99) | 0.0003 |
| Week 48 | –1.34 | 0.04 | –1.38 (–2.57, –0.19) | 0.0242 |
| Week 72 | –1.74 | –0.28 | –1.47 (–2.70, –0.24) | 0.0208 |
| Mean ratio to baseline in fasting glucagon – in subjects with T2D | ||||
| ETR (95% CI) | ||||
| Week 24 | 0.69 | 1.00 | 0.69 (0.51, 0.92) | 0.0124 |
| Week 48 | 0.78 | 1.07 | 0.73 (0.55, 0.97) | 0.0291 |
| Week 72 | 0.63 | 0.91 | 0.69 (0.51, 0.93) | 0.0169 |
| Mean ratio to baseline in HOMA‐IR – in subjects with T2D | ||||
| ETR (95% CI) | ||||
| Week 24 | 0.91 | 0.92 | 0.99 (0.70, 1.39) | 0.9470 |
| Week 48 | 0.87 | 0.89 | 0.98 (0.67, 1.43) | 0.9065 |
| Week 72 | 0.84 | 0.89 | 0.94 (0.60, 1.48) | 0.7966 |
Abbreviations: CI, confidence interval; ETD, estimated treatment difference; ETR, estimated treatment ratio; HbA1c, glycated haemoglobin; HOMA‐IR, Homeostatic Model Assessment of Insulin Resistance; T2D, type 2 diabetes.
In subjects with T2D, mean reductions from baseline in HbA1c were significantly greater for those treated with semaglutide compared with placebo (P < .0001 at weeks 24, 48 and 72; Table 2). There was no correlation between change in HbA1c and change in liver fat by MRI‐PDFF at week 72 in subjects with T2D; numbers of evaluable subjects without T2D were too low for any meaningful interpretation (Figure S4B). Changes from baseline to weeks 24, 48 and 72 in fasting plasma glucose in subjects with T2D were also significantly greater with semaglutide vs placebo (P < .05), while changes from baseline to weeks 24, 48 and 72 for HOMA‐IR were not significantly different between semaglutide and placebo (Table 2). Changes in metabolic parameters for subjects without T2D are presented in Table S2.
3.5. Liver enzymes, blood pressure and exploratory biomarkers
An 18‐28% reduction in liver enzymes (ALT, AST and GGT) was seen with semaglutide compared with placebo at weeks 48 and 72 (P < .05; Figure 3A). There was a positive correlation between change in ALT and change in liver fat content by MRI‐PDFF in both placebo and semaglutide groups at week 72, although no correlation was observed with AST (Figure S4C,D).
FIGURE 3.
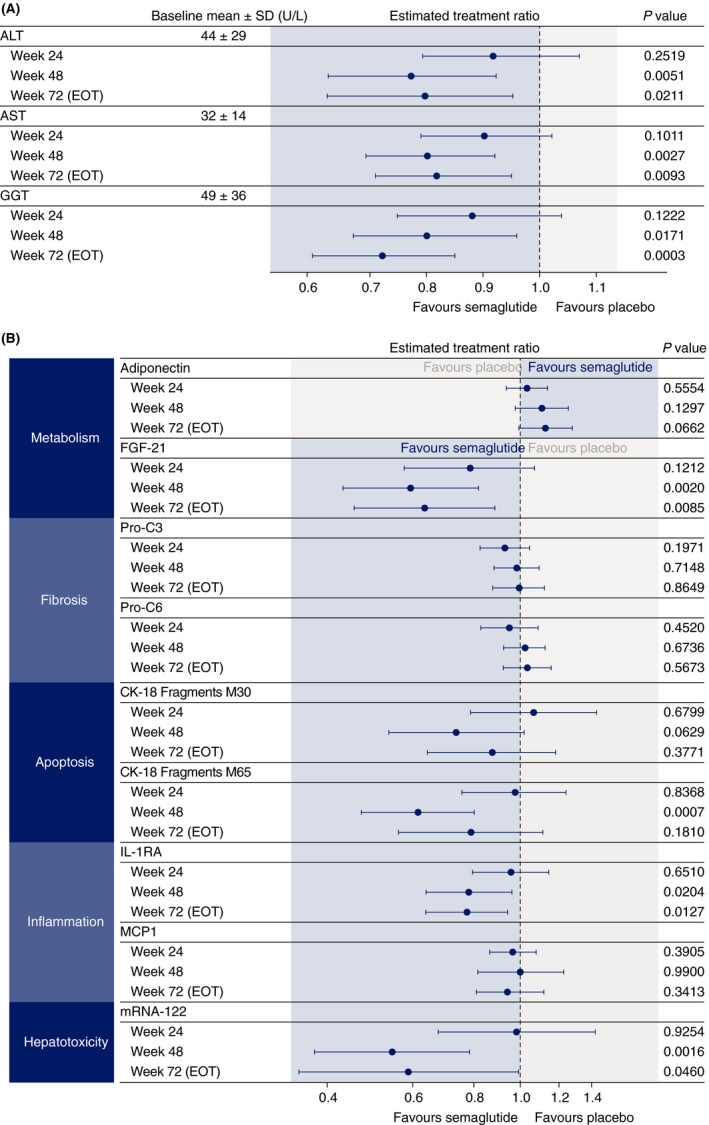
Changes from baseline (estimated treatment ratios and 95% confidence intervals) in (A) liver enzymes and (B) exploratory biomarkers at weeks 24, 48 and 72 with semaglutide 0.4 mg once daily and placebo. ALT, alanine aminotransferase; AST, aspartate aminotransferase; CK‐18, cytokeratin 18 fragments; EOT, end of treatment; FGF‐21, fibroblast growth factor 21; GGT, gamma‐glutamyl transferase, IL‐1RA, interleukin‐1 receptor antagonist; MCP1, monocyte chemoattractant protein‐1; mRNA, messenger RNA; Pro‐C3, released N‐terminal pro‐peptide of type III collagen; Pro‐C6, neo‐epitope in C‐terminal of type VI collagen; SD, standard deviation
Mean change from baseline in systolic blood pressure was significantly in favour of semaglutide vs placebo at weeks 24, 48 and 72. For diastolic blood pressure, ETDs between semaglutide and placebo were significant at weeks 24 and 48, but not at week 72 (Table S3).
Changes from baseline in exploratory biomarkers were variable; significant differences between treatments were observed at weeks 48 and 72 for IL‐1RA and FGF‐21 (Figure 3B). Serum enhanced liver fibrosis score decreased with semaglutide at week 24 and was significantly different compared with placebo: estimated mean change from baseline of –0.19 and 0.26, respectively (ETD [95% CI] –0.44 [–0.70, –0.19]; P = .0010) (Figure S5). No significant differences between semaglutide and placebo were observed at weeks 48 and 72. Reductions in FAST score were greater with semaglutide than placebo and this difference was significant at week 48 (Table S4).
Decreases in hsCRP were observed with estimated treatment ratios (ETRs) (95% CI) significantly in favour of semaglutide vs placebo at weeks 48 (0.54 [0.38, 0.78]; P = .0015) and 72 (0.59 [0.37, 0.92]; P = .0204). Triglycerides were also reduced at weeks 48 (ETR 0.79 [0.68, 0.93]; P = .0039) and 72 (ETR 0.77 [0.65, 0.92]; P = .0043), but there were no apparent effects on other lipids (Figure S6).
3.6. Safety and tolerability
The proportions of patients reporting overall AEs were similar in the semaglutide and placebo groups (93.9% vs 87.9%) (Table 3). Gastrointestinal AEs typically associated with GLP‐1RAs were reported by more patients in the semaglutide than placebo group, with diarrhoea (30.3% vs 24.2%) and nausea (30.3% vs 9.1%) the most frequent. Decreased appetite was also more frequent with semaglutide (42.4% vs 9.1%). Serious AEs were reported by 12.1% of patients in the semaglutide group (n = 4) and 9.1% in the placebo group (n = 3). No deaths occurred during the trial. In subjects with T2D, hypoglycaemic episodes occurred in 4 (14.8%) patients treated with semaglutide and 2 (9.5%) patients in the placebo group.
TABLE 3.
Adverse events overview (on‐treatment)
| Semaglutide 0.4 mg (n = 33) n (%) | Placebo (n = 33) n (%) | |
|---|---|---|
| All adverse events | 31 (93.9) | 29 (87.9) |
| Serious adverse events | 4 (12.1) | 3 (9.1) |
| Fatal events | 0 | 0 |
| Adverse events leading to premature trial product discontinuation | 1 (3.0) | 0 |
| Most frequent adverse events occurring in ≥10% patients | ||
| Decreased appetite | 14 (42.4) | 3 (9.1) |
| Diarrhoea | 10 (30.3) | 8 (24.2) |
| Nausea | 10 (30.3) | 3 (9.1) |
| Vomiting | 9 (27.3) | 0 |
| Nasopharyngitis | 8 (24.2) | 10 (30.3) |
| Constipation | 8 (24.2) | 2 (6.1) |
| Abdominal pain upper | 6 (18.2) | 2 (6.1) |
| Dizziness | 6 (18.2) | 2 (6.1) |
| Flatulence | 6 (18.2) | 2 (6.1) |
| Eructation | 5 (15.2) | 0 |
| Headache | 4 (12.1) | 5 (15.2) |
| Fatigue | 4 (12.1) | 3 (9.1) |
| Early satiety | 4 (12.1) | 0 |
n, number of subjects with event(s); %, proportion of subjects with event(s).
4. DISCUSSION
In this randomised, placebo‐controlled trial in subjects with NAFLD, we found no significant difference between semaglutide and placebo in respect of the primary endpoint of decreased liver stiffness assessed by MRE. However, substantial and significant reductions in favour of semaglutide were recorded for liver steatosis at all timepoints using MRI‐PDFF, with an ETR of 0.50 at week 72. Moreover, a ≥ 30% reduction in liver fat content, which is generally considered to be an MRI‐PDFF response that is associated with histological response and NASH resolution, 13 , 14 was achieved by significantly more patients receiving semaglutide compared with placebo, with around three‐quarters of subjects in the semaglutide group having a ≥ 30% relative decline in liver fat at weeks 48 and 72. Significant differences in favour of semaglutide at all timepoints were also observed for additional MRI assessments, including liver fat volume, total liver volume and abdominal subcutaneous and visceral adipose tissue, with ETRs in the range of 0.41‐0.86 at week 72.
Although more subjects receiving semaglutide compared with placebo achieved a ≥ 15% reduction in liver stiffness assessed by MRE, this difference was not significant. One possible reason why a significant difference was not observed is that MRE is not sufficiently sensitive to detect changes in fibrosis in patients with less advanced disease. 10 , 27 A limitation of our trial is that few subjects (15% overall) had advanced disease/a high degree of liver stiffness (≥3.64 kPa) at baseline, which may have made it difficult to detect a decrease in liver stiffness. The average MRE of 2.95‐3.08 kPa for the trial population at baseline corresponds to a borderline histological fibrosis of stage 1‐2, while the baseline PDFF values correspond to grade 2‐3 steatosis. 32 Another possible reason for the lack of significant reduction in liver stiffness in our trial is the timepoint of 48 weeks. Although 48 weeks was sufficient to show NASH resolution with liraglutide in a previous study, 18 in a recent study 21 semaglutide showed no improvement in liver stiffness after 72 weeks; this may indicate that a much longer timeframe is required to detect an improvement in liver stiffness. Consistent with the liver stiffness findings recorded via MRE, VCTE assessment showed no significant differences between semaglutide and placebo.
Given that hepatic lipotoxicity is a prominent driving force of fibrosis progression and that steatosis and NASH are both reversible conditions, 29 , 33 our results showing that semaglutide reduces fat content in hepatocytes suggest the potential to reverse steatosis and halt fibrosis progression. Indeed, fewer subjects treated with semaglutide had a ≥ 15% increase in liver stiffness (MRE) compared with placebo at weeks 48 and 72. A 15% increase in liver stiffness assessed by MRE may be associated with fibrosis progression, including transition from early to advanced fibrosis. 34
A significant difference in liver steatosis was demonstrated with semaglutide vs placebo, despite a high placebo response (73.5% of subjects in the semaglutide group vs 33.3% in the placebo group achieved a ≥ 30% reduction in liver steatosis). The reason for the high placebo response remains unknown; however, this has also been observed in other studies, including the recent 72‐week phase 2 trial of semaglutide in which 17% of placebo patients had resolution of NASH without fibrosis worsening as assessed by histology. 21 Furthermore, significant biochemical, histological and radiological responses were observed in patients given placebo in a meta‐analysis of randomised, controlled trials of pharmacotherapies for NASH. 35
The effects of semaglutide with respect to steatosis and liver fat volume were accompanied by reductions in body weight, which was not observed to the same extent with placebo. The prevalence of NAFLD is substantially increased in patients with obesity and excessive caloric intake contributes to triglyceride accumulation, which is exacerbated in NAFLD by impaired free fatty acid metabolism. 29 , 36 Thus, a reduction in body weight may be expected to be associated with decreased liver steatosis, and weight reduction is an established treatment for NAFLD. 37 While visceral fat has been identified as a strong predictor of NAFLD, 38 the relationship between subcutaneous adipose tissue levels and NAFLD remains to be determined. 39 Preclinical studies have suggested that the beneficial effect of GLP‐1RAs on hepatic lipotoxicity and inflammation may, at least in part, be independent of weight reduction. 40 , 41 However, it is not yet known to what extent the effect of semaglutide on steatosis may result from a direct metabolic effect or is mediated via weight loss.
Although comparisons between subjects with or without type 2 diabetes and with or without obesity are not robust due to the low numbers of non‐diabetic subjects and subjects with BMI <30 kg/m2, subgroup analyses did not suggest any differences between these subgroups with regard to changes in liver stiffness or steatosis (data not shown).
Liver disease, including NAFLD, is associated with elevated levels of liver enzyme levels. 20 , 36 As such, reductions in enzyme levels could suggest an improvement in liver function, although the clinical significance of a decrease in enzymes remains unknown. Consistent with our findings, decreased liver fat and adipose tissue volume with reductions in ALT and AST levels were reported in a study of patients with type 2 diabetes not assessed for NAFLD who received dapagliflozin plus saxagliptin on a background of metformin, but these observations were not seen in patients treated with glimepiride plus metformin. 42 Declines in ALT have been reported in patients with treatment‐related improvement or resolution of histological NASH 18 , 43 , 44 and appear to be associated with weight reduction. 21
Overall, our data align with other studies of GLP‐1RAs that have suggested a potential beneficial effect in NAFLD/NASH. In the recent phase 2 trial, subcutaneous semaglutide resulted in more patients achieving NASH resolution without worsening of fibrosis compared with placebo (59% with semaglutide 0.4 mg/day vs 17% with placebo; P < .001). 21 There was no significant difference in the proportion of patients with improvement in fibrosis between groups; however, fewer patients treated with semaglutide had fibrosis progression and improvements were observed in several biomarkers of fibrosis. In another phase 2 study in subjects with obesity without diabetes, semaglutide was associated with improvements in ALT levels, body weight and NAFLD Fibrosis Score. 20 , 45 Liraglutide has also been shown to significantly improve steatosis in patients with biopsy‐proven NASH, 18 and to reduce BMI, visceral fat, aminotransferase levels and glucose abnormalities in patients with biopsy‐confirmed NASH and glucose intolerance. 46 Furthermore, in a 6‐month study of patients with uncontrolled type 2 diabetes, liraglutide was associated with a 31% reduction in liver fat content, measured by proton magnetic resonance spectroscopy. 19 The safety profile was consistent with semaglutide trials in other disease areas 22 , 23 , 24 , 25 and with the GLP‐1 class.
Although semaglutide did not result in a significant improvement in the primary endpoint of liver stiffness compared with placebo, there was a significant reduction in liver steatosis. This, together with other findings, including weight loss, improved glycaemic control and reductions in liver enzymes may suggest that treatment with semaglutide has a potentially beneficial impact on disease activity and metabolic profile in a population with NAFLD.
AUTHORSHIP
Guarantor of article: AF.
Author contributions: AF: Conduct, analysis, interpretation. GA: Conduct, collection of data, interpretation. PH: Conduct, collection of data, interpretation. LJ: Analysis, interpretation. AM: Conduct, analysis, interpretation. MSP: Conduct, analysis, interpretation. TV: Conduct, collection of data, interpretation. RL: Design, interpretation. LP‐M: Conduct, collection of data, interpretation. All authors contributed to drafting and/or critical review of this manuscript and approved the final version.
Supporting information
Supplementary Material
ACKNOWLEDGMENTS
The authors thank Andy Bond and Paul Barlass of Axis, a division of Spirit Medical Communications Group Limited, for medical writing and editorial assistance (funded by Novo Nordisk A/S, Denmark).
Declaration of personal interests: Grit Andersen is an employee of Profil. Lars Johansson is an employee and shareholder in Antaros Medical. Paul Hockings is an employee of Antaros Medical. Leona Plum‐Mörschel is an employee of Profil and declares receiving speaker honoraria, travel grants, and fees from Novo Nordisk during the conduct of the trial and speaker honoraria and travel grants from Eli Lilly. Thomas Vogl has nothing to disclose. Rohit Loomba serves as a consultant for Amgen, Anylam/Regeneron, Arrowhead Pharmaceuticals, AstraZeneca, Bristol Myers Squibb, CohBar, Eli Lilly, Galmed, Gilead, Glympse bio, Inipharm, Intercept, Ionis, Janssen Inc, Madrigal, Metacrine, Inc, NGM Biopharmaceuticals, Novartis, Novo Nordisk, Pfizer, Sagimet, Viking Therapeutics and 89 bio. In addition, his institution has received grant support from Allergan, AstraZeneca, Boehringer Ingelheim, Bristol Myers Squibb, Eli Lilly, Galectin Therapeutics, Galmed Pharmaceuticals, Genfit, Gilead, Intercept, Inventiva, Janssen, Madrigal Pharmaceuticals, Merck, NGM Biopharmaceuticals, Pfizer and Siemens. He is also co‐founder of Liponexus, Inc. He also receives funding support from NIEHS (5P42ES010337), NCATS (5UL1TR001442), DOD PRCRP (W81XWH‐18‐2‐0026), NIDDK (U01DK061734, R01DK106419, R01DK121378, R01DK124318, P30DK120515), NHLBI (P01HL147835) and NIAAA (U01AA029019). Anne Flint, Anni Morsing and Mads Sundby Palle are employees of and report stocks from Novo Nordisk A/S.
Declaration of funding interests: This study was funded in full by Novo Nordisk A/S.
Flint A, Andersen G, Hockings P, et al. Randomised clinical trial: semaglutide versus placebo reduced liver steatosis but not liver stiffness in subjects with non‐alcoholic fatty liver disease assessed by magnetic resonance imaging. Aliment Pharmacol Ther. 2021;54:1150–1161. 10.1111/apt.16608
The Handling Editor for this article was Dr Stephen Ryder, and it was accepted for publication after full peer‐review.
Funding information
This study was funded by Novo Nordisk A/S, Denmark. The writing of this paper was funded by Novo Nordisk A/S, Denmark. Writing support was provided by Andy Bond and Paul Barlass of Axis, a division of Spirit Medical Communications Group Limited, and was funded by Novo Nordisk A/S, Denmark.
Data Availability Statement
Data will be shared with researchers who submit a research proposal approved by an independent review board. Access request proposals can be found at novonordisk‐trials.com. Data will be made available after research completion and approval of the product and product use in the EU and the USA. Individual participant data will be shared in datasets in a de‐identified and anonymised format. There will not be any limitations on how these data can be used.
REFERENCES
- 1. Younossi ZM, Koenig AB, Abdelatif D, Fazel Y, Henry L, Wymer M. Global epidemiology of nonalcoholic fatty liver disease – meta‐analytic assessment of prevalence, incidence, and outcomes. Hepatology. 2016;64:73‐84. [DOI] [PubMed] [Google Scholar]
- 2. EASL, EASD, EASO . EASL–EASD–EASO clinical practice guidelines for the management of non‐alcoholic fatty liver disease. J Hepatol. 2016;64:1388‐1402. [DOI] [PubMed] [Google Scholar]
- 3. Loomba R, Wong R, Fraysse J, et al. Nonalcoholic fatty liver disease progression rates to cirrhosis and progression of cirrhosis to decompensation and mortality: a real world analysis of Medicare data. Aliment Pharmacol Ther. 2020;51:1149‐1159. [DOI] [PubMed] [Google Scholar]
- 4. Hoodeshenas S, Yin M, Venkatesh SK. Magnetic resonance elastography of liver: current update. Top Magn Reson Imaging. 2018;27:319‐333. [DOI] [PMC free article] [PubMed] [Google Scholar]
- 5. Drescher HK, Weiskirchen S, Weiskirchen R. Current status in testing for nonalcoholic fatty liver disease (NAFLD) and nonalcoholic steatohepatitis (NASH). Cells. 2019;8:845. [DOI] [PMC free article] [PubMed] [Google Scholar]
- 6. Li Q, Dhyani M, Grajo JR, Sirlin C, Samir AE. Current status of imaging in nonalcoholic fatty liver disease. World J Hepatol. 2018;10:530‐542. [DOI] [PMC free article] [PubMed] [Google Scholar]
- 7. Caussy C, Reeder SB, Sirlin CB, Loomba R. Non‐invasive, quantitative assessment of liver fat by MRI‐PDFF as an endpoint in NASH trials. Hepatology. 2018;68:763‐772. [DOI] [PMC free article] [PubMed] [Google Scholar]
- 8. Chalasani N, Younossi Z, Lavine JE, et al. The diagnosis and management of nonalcoholic fatty liver disease: practice guidance from the American Association for the Study of Liver Diseases. Hepatology. 2018;67:328‐357. [DOI] [PubMed] [Google Scholar]
- 9. Dulai PS, Sirlin CB, Loomba R. MRI and MRE for non‐invasive quantitative assessment of hepatic steatosis and fibrosis in NAFLD and NASH: clinical trials to clinical practice. J Hepatol. 2016;65:1006‐1016. [DOI] [PMC free article] [PubMed] [Google Scholar]
- 10. Jayakumar S, Middleton MS, Lawitz EJ, et al. Longitudinal correlations between MRE, MRI‐PDFF, and liver histology in patients with non‐alcoholic steatohepatitis: analysis of data from a phase II trial of selonsertib. J Hepatol. 2019;70:133‐141. [DOI] [PubMed] [Google Scholar]
- 11. Singh S, Venkatesh SK, Loomba R, et al. Magnetic resonance elastography for staging liver fibrosis in non‐alcoholic fatty liver disease: a diagnostic accuracy systematic review and individual participant data pooled analysis. Eur Radiol. 2016;26:1431‐1440. [DOI] [PMC free article] [PubMed] [Google Scholar]
- 12. Loomba R, Kayali Z, Noureddin M, et al. GS‐0976 reduces hepatic steatosis and fibrosis markers in patients with nonalcoholic fatty liver disease. Gastroenterology. 2018;155:1463‐1473. [DOI] [PMC free article] [PubMed] [Google Scholar]
- 13. Stine JG, Munaganuru N, Barnard A, et al. Change in MRI‐PDFF and histologic response in patients with nonalcoholic steatohepatitis: a systematic review and meta‐analysis. Clin Gastroenterol Hepatol. 2020:S1542‐3565(20)31220‐9. ePub ahead of print. 10.1016/j.cgh.2020.08.061 [DOI] [PMC free article] [PubMed] [Google Scholar]
- 14. Loomba R. MRI‐proton density fat fraction treatment response criteria in nonalcoholic steatohepatitis. Hepatology. 2021;73:881–883. [DOI] [PMC free article] [PubMed] [Google Scholar]
- 15. Jung C‐H, Mok J‐O. The effects of hypoglycemic agents on non‐alcoholic fatty liver disease: focused on sodium‐glucose cotransporter 2 inhibitors and glucagon‐like peptide‐1 receptor agonists. J Obes Metab Syndr. 2019;28:18‐29. [DOI] [PMC free article] [PubMed] [Google Scholar]
- 16. Sumida Y, Yoneda M, Tokushige K, et al. Antidiabetic therapy in the treatment of nonalcoholic steatohepatitis. Int J Mol Sci. 2020;21:1907. [DOI] [PMC free article] [PubMed] [Google Scholar]
- 17. Seghieri M, Christensen AS, Andersen A, Solini A, Knop FK, Vilsbøll T. Future perspectives on GLP‐1 receptor agonists and GLP‐1/glucagon receptor co‐agonists in the treatment of NAFLD. Front Endocrinol. 2018;9:649. [DOI] [PMC free article] [PubMed] [Google Scholar]
- 18. Armstrong MJ, Gaunt P, Aithal GP, et al. Liraglutide safety and efficacy in patients with non‐alcoholic steatohepatitis (LEAN): a multicentre, double‐blind, randomised, placebo‐controlled phase 2 study. Lancet. 2016;387:679‐690. [DOI] [PubMed] [Google Scholar]
- 19. Petit J‐M, Cercueil J‐P, Loffroy R, et al. Effect of liraglutide therapy on liver fat content in patients with inadequately controlled type 2 diabetes: the Lira‐NAFLD study. Clin Endocrinol Metab. 2017;102:407‐415. [DOI] [PubMed] [Google Scholar]
- 20. Newsome P, Francque S, Harrison S, et al. Effect of semaglutide on liver enzymes and markers of inflammation in subjects with type 2 diabetes and/or obesity. Aliment Pharmacol Ther. 2019;50:193‐203. [DOI] [PMC free article] [PubMed] [Google Scholar]
- 21. Newsome PN, Buchholtz K, Cusi K, et al. A placebo‐controlled trial of subcutaneous semaglutide in nonalcoholic steatohepatitis. N Engl J Med. 2021;384:1113–1124. [DOI] [PubMed] [Google Scholar]
- 22. European Medicines Agency . Ozempic (semaglutide) Summary of product characteristics. Last updated April 7, 2020. Available at: https://www.ema.europa.eu/en/medicines/human/EPAR/ozempic Accessed June 1, 2020.
- 23. US Food & Drug Administration . Ozempic (semaglutide) Prescribing information. Revised December 2017. Available at: https://www.accessdata.fda.gov/drugsatfda_docs/label/2017/209637lbl.pdf Accessed June 1, 2020
- 24. Aroda VR, Ahmann A, Cariou B, et al. Comparative efficacy, safety, and cardiovascular outcomes with once‐weekly subcutaneous semaglutide in the treatment of type 2 diabetes: insights from the SUSTAIN 1–7 trials. Diabetes Metab. 2019;45:409‐418. [DOI] [PubMed] [Google Scholar]
- 25. Wilding JPH, Batterham RL, Calanna S, et al. Once‐weekly semaglutide in adults with overweight or obesity. N Engl J Med. 2021;384:989‐1002. [DOI] [PubMed] [Google Scholar]
- 26. Marso SP, Bain SC, Consoli A, et al. Semaglutide and cardiovascular outcomes in patients with type 2 diabetes. N Engl J Med. 2016;375:1834‐1844. [DOI] [PubMed] [Google Scholar]
- 27. Loomba R, Wolfson T, Ang B, et al. Magnetic resonance elastography predicts advanced fibrosis in patients with nonalcoholic fatty liver disease: a prospective study. Hepatology. 2014;60:1920‐1928. [DOI] [PMC free article] [PubMed] [Google Scholar]
- 28. Newsome PN, Sasso M, Deeks JJ, et al. FibroScan‐AST (FAST) score for the non‐invasive identification of patients with non‐alcoholic steatohepatitis with significant activity and fibrosis: a prospective derivation and global validation study. Lancet Gastroenterol Hepatol. 2020;5:362‐373. [DOI] [PMC free article] [PubMed] [Google Scholar]
- 29. Seaquist ER, Anderson J, Childs B, et al. Hypoglycemia and diabetes: a report of a workgroup of the American Diabetes Association and the Endocrine Society. Diabetes Care. 2013;36:1384‐1395. [DOI] [PMC free article] [PubMed] [Google Scholar]
- 30. Andersen G, Plum‐Mörschel L, Hockings PD, et al. Clinical characteristics of a non‐alcoholic fatty liver disease population across the fibrosis spectrum measured by magnetic resonance elastography: analysis of screening data. Adv Ther. 2020;37:4866‐4876. [DOI] [PMC free article] [PubMed] [Google Scholar]
- 31. QIBA . QIBA profile: magnetic resonance elastography of the liver. 2018. https://qibawiki.rsna.org/images/a/a5/MRE‐QIBAProfile‐2018‐05‐02‐CONSENSUS.pdf. Accessed April 3, 2020.
- 32. Middleton MS, Van Natta ML, Heba ER, et al. Diagnostic accuracy of magnetic resonance imaging hepatic proton density fat fraction in pediatric nonalcoholic fatty liver disease. Hepatology. 2018;67:858‐872. [DOI] [PMC free article] [PubMed] [Google Scholar]
- 33. Schuppan D, Surabattula R, Wang XY. Determinants of fibrosis progression and regression in NASH. J Hepatol. 2018;68:238‐250. [DOI] [PubMed] [Google Scholar]
- 34. Ajmera VH, Liu A, Singh S, et al. Clinical utility of an increase in magnetic resonance elastography in predicting fibrosis progression in nonalcoholic fatty liver disease. Hepatology. 2020;71:849‐860. [DOI] [PMC free article] [PubMed] [Google Scholar]
- 35. Han MAT, Altayar O, Hamdeh S, et al. Rates of and factors associated with placebo response in trials of pharmacotherapies for nonalcoholic steatohepatitis: systematic review and meta‐analysis. Clin Gastroenterol Hepatol. 2019;17:616‐629. [DOI] [PubMed] [Google Scholar]
- 36. Yki‐Järvinen H. Non‐alcoholic fatty liver disease as a cause and a consequence of metabolic syndrome. Lancet Diabetes Endocrinol. 2014;2:901‐910. [DOI] [PubMed] [Google Scholar]
- 37. Romero‐Gómez M, Zelber‐Sagi S, Trenell M. Treatment of NAFLD with diet, physical activity and exercise. J Hepatol. 2017;67:829‐846. [DOI] [PubMed] [Google Scholar]
- 38. Ko Y‐H, Wong T‐C, Hus Y‐Y, Kuo K‐L, Yang SH. The correlation between body fat, visceral fat, and nonalcoholic fatty liver disease. Metab Syndr Relat Disorder. 2017;15:304‐311. [DOI] [PubMed] [Google Scholar]
- 39. Jung C‐H, Rhee E‐J, Kwon H, Chang Y, Ryu S, Lee W‐Y. Visceral‐to‐subcutaneous abdominal fat ratio is associated with nonalcoholic fatty liver disease and liver fibrosis. Endocrinol Metab. 2020;35:165‐176. [DOI] [PMC free article] [PubMed] [Google Scholar]
- 40. Rakipovski G, Rolin B, Nøhr J, et al. The GLP‐1 analogs liraglutide and semaglutide reduce atherosclerosis in ApoE‐/‐ and LDLr‐/‐ mice by a mechanism that includes inflammatory pathways. JACC Basic Transl Sci. 2018;3:844‐857. [DOI] [PMC free article] [PubMed] [Google Scholar]
- 41. Somm E, Montandon SA, Loizides‐Mangold U, et al. The GLP‐1R agonist liraglutide limits hepatic lipotoxicity and inflammatory response in mice fed a methionine‐choline deficient diet. Transl Res. 2021;227:75‐88. [DOI] [PubMed] [Google Scholar]
- 42. Johansson L, Hockings PD, Johnsson E, et al. Dapagliflozin plus saxagliptin add‐on to metformin reduces liver fat and adipose tissue volume in patients with type 2 diabetes. Diabetes Obes Metab. 2020;22:1094‐1101. [DOI] [PMC free article] [PubMed] [Google Scholar]
- 43. Ratziu L, Harrison SA, Francque S, et al. Elafibranor, an agonist of the peroxisome proliferator‐activated receptor‐α and ‐δ, induces resolution of nonalcoholic steatohepatitis without fibrosis worsening. Gastroenterology. 2016;150:1147‐1159. [DOI] [PubMed] [Google Scholar]
- 44. Loomba R, Sanyal AJ, Kowdley KV, et al. Factors associated with histologic response in adult patients with nonalcoholic steatohepatitis. Gastroenterology. 2019;156:88‐95.e5. [DOI] [PMC free article] [PubMed] [Google Scholar]
- 45. Monk‐Hansen T, Van Gaal L, Harrison S, Rasmussen S, Newsome PN. The effect of semaglutide on liver enzymes in subjects with obesity and elevated alanine aminotransferase: data from a randomized phase 2 trial. Diabetologia. 2018;61:Abstract 1207. [Google Scholar]
- 46. Eguchi Y, Kitajima Y, Hyogo H, et al. Pilot study of liraglutide effects in non‐alcoholic steatohepatitis and non‐alcoholic fatty liver disease with glucose intolerance in Japanese patients (LEAN‐J). Hepatol Res. 2015;45:269‐278. [DOI] [PubMed] [Google Scholar]
Associated Data
This section collects any data citations, data availability statements, or supplementary materials included in this article.
Supplementary Materials
Supplementary Material
Data Availability Statement
Data will be shared with researchers who submit a research proposal approved by an independent review board. Access request proposals can be found at novonordisk‐trials.com. Data will be made available after research completion and approval of the product and product use in the EU and the USA. Individual participant data will be shared in datasets in a de‐identified and anonymised format. There will not be any limitations on how these data can be used.