

Abstract
Objectives
Agitation and aggression are common in dementia and pre‐dementia. The dementia risk syndrome mild behavioral impairment (MBI) includes these symptoms in the impulse dyscontrol domain. However, the neural circuitry associated with impulse dyscontrol in neurodegenerative disease is not well understood. The objective of this work was to investigate if regional micro‐ and macro‐structural brain properties were associated with impulse dyscontrol symptoms in older adults with normal cognition, mild cognitive impairment, and Alzheimer's disease (AD).
Methods
Clinical, neuropsychiatric, and T1‐weighted and diffusion‐tensor magnetic resonance imaging (DTI) data from 80 individuals with and 123 individuals without impulse dyscontrol were obtained from the AD Neuroimaging Initiative. Linear mixed effect models were used to assess if impulse dyscontrol was related to regional DTI and volumetric parameters.
Results
Impulse dyscontrol was present in 17% of participants with NC, 43% with MCI, and 66% with AD. Impulse dyscontrol was associated with: (1) lower fractional anisotropy (FA), and greater mean, axial, and radial diffusivity in the fornix; (2) lesser FA and greater radial diffusivity in the superior fronto‐occipital fasciculus; (3) greater axial diffusivity in the cingulum; (4) greater axial and radial diffusivity in the uncinate fasciculus; (5) gray matter atrophy, specifically, lower cortical thickness in the parahippocampal gyrus.
Conclusion
Our findings provide evidence that well‐established atrophy patterns of AD are prominent in the presence of impulse dyscontrol, even when disease status is controlled for, and possibly in advance of dementia. Our findings support the growing evidence for impulse dyscontrol symptoms as an early manifestation of AD.
Keywords: aggression, agitation, Alzheimer's disease, geriatric psychiatry, impulse dyscontrol, mild behavioral impairment
Key points
Impulse dyscontrol is a frequently endorsed domain of mild behavioral impairment (MBI), which is an at‐risk state for incident cognitive decline and dementia
Impulse dyscontrol is common in this sample of dementia and pre‐dementia participants at a frequency of 17% in normal cognition, 43% in mild cognitive impairment, and 66% in Alzheimer's disease
Impulse dyscontrol is associated with loss of white matter integrity in the cingulum, fornix, superior fronto‐occipital fasciculus, and uncinate fasciculus, as well as parahippocampal gyrus atrophy
This MBI domain may serve as a potential treatment target, even in advance of dementia
Abbreviations
- AD
Alzheimer's disease
- AxD
axial diffusivity
- DTI
diffusion tensor imaging
- FA
fractional anisotropy
- ICV
intracranial volume
- MBI
mild behavioral impairment
- MBI‐C
Mild Behavioral Impairment Checklist
- MD
mean diffusivity
- MRI
magnetic resonance imaging
- NC
Normal Cognition, NPI Neuropsychiatric Inventory
- NPI‐Q
Neuropsychiatric Inventory Questionnaire
- RD
radial diffusivity
- SCD
subjective cognitive decline
1. INTRODUCTION
Mild behavioral impairment (MBI) is a validated neurobehavioral syndrome that describes the later life emergence of persistent neuropsychiatric symptoms (NPSs) as an at‐risk state for incident cognitive decline and dementia. 1 These NPS have been suggested to be an index manifestation of dementia. 2 , 3 , 4 , 5 , 6 , 7 , 8 , 9 , 10 MBI captures preclinical and prodromal disease symptoms and is associated with known dementia biomarkers including amyloid‐β, 11 tau, 12 , 13 neurofilament light, 14 brain atrophy, 15 , 16 and Alzheimer's disease (AD) risk genes. 2 , 17 Impulse dyscontrol is one of the MBI domains and includes behavioral symptoms of agitation/aggression, irritability, and aberrant motor behavior amongst others.
The clinical manifestations of MBI impulse dyscontrol including agitation, aggression, and irritability are common in dementia and are associated with caregiver stress and poorer outcomes. 18 , 19 In a population‐based study of older adults ranging from normal cognition (NC) to mild cognitive impairment (MCI), cross‐sectional assessment of NPS using the neuropsychiatric inventory found impulse dyscontrol symptoms to be the most common domain with frequencies of 17.2% in NC and 33.8% in MCI. 20 A concurrent study in a cognitive neurology clinic sample assessed MBI domains in those with subjective cognitive decline (SCD) and MCI 21 and reported the frequency of impulse dyscontrol in both groups being greater than 50%. 21 Longitudinal analysis of the National Alzheimer Coordinating Center cohort described phases of NPS emergence in advance of dementia with symptoms of irritability/lability emerging in the first wave of pre‐dementia NPS, and agitation emerging in the second wave. 22 Subsequent analysis of the same population demonstrated that NPS emerged in advance of cognitive symptoms in 59% of dementia participants, including 30% of those who developed AD. For impulse dyscontrol symptoms, irritability emerged before dementia in 38% of cases (21% before MCI), agitation before dementia in 26% of cases (13% before MCI), and motor disturbance before dementia in 6% of cases (3% before MCI). 23 These symptoms of impulse dyscontrol are common in preclinical and prodromal disease, are associated with greater risk of incident cognitive decline and dementia and represent clinically significant symptoms often requiring pharmacological intervention. Further exploration of impulse dyscontrol is warranted.
Research has assessed neuroimaging correlates of agitation, aggression, and impulse dyscontrol in dementia but to a lesser extent in predementia groups. Agitation/aggression in MCI and AD has been associated with atrophy in fronto‐limbic regions, the right posterior cingulate, and left hippocampus. 24 Aberrant motor behavior symptoms have been associated with atrophy in the right basal nuclei and frontal cortex. 25 Furthermore, reduced fractional anisotropy (FA) in the anterior cingulum 26 has been associated with agitation and irritability.
This present study focused on identifying the neuroanatomical correlates of impulse dyscontrol in older adults, outside of diagnostic and nosological boundaries. Increasing knowledge of the neural correlates of impulse dyscontrol may improve diagnosis, aid in disease prognostication, and identify potential treatment targets. The objective of this study was to assess white matter and volumetric parameters in a priori selected brain regions in association with symptoms of impulse dyscontrol in individuals with NC, MCI, and AD. Based on our literature review, the large white matter tracts assessed include the cingulum, fornix, superior fronto‐occipital fasciculus, inferior fronto‐occipital fasciculus, and the uncinate fasciculus (Figure 1 27 ). Volumetric analysis included the hippocampus, caudal and rostral anterior cingulate, amygdala, parahippocampal gyrus, and the medial orbitofrontal cortex (Figure 2 28 ). We hypothesized that symptoms of impulse dyscontrol would be associated with decreased white matter integrity in the cingulum and with atrophy patterns in fronto‐limbic structures.
FIGURE 1.
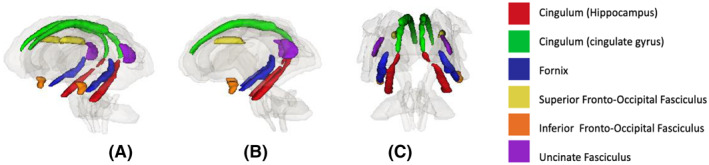
Visual representation of diffusion tensor imaging regions analyzed in association with impulse dyscontrol symptoms (A) profile view, (B) sagittal view, (C) coronal view
FIGURE 2.
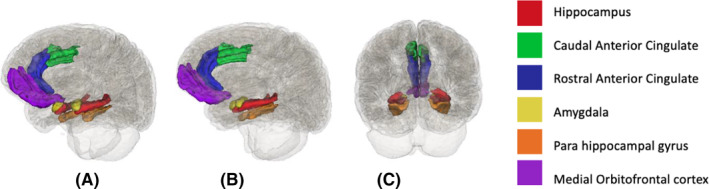
Visual representation of volumetric regions analyzed in association with impulse dyscontrol symptoms (A) profile view, (B) sagittal view, (C) coronal view
2. METHODS
2.1. Alzheimer's Disease Neuroimaging Initiative
Data was extracted from the Alzheimer's Disease Neuroimaging Initiative (ADNI) database (http://adni.loni.usc.edu/). ADNI is a large, multi‐center longitudinal study that aims to track the progression of AD. We focused on participants within the ADNI‐GO/2 cohort because they had processed diffusion tensor imaging (DTI) and volumetric magnetic resonance imaging (MRI) data available. Participants met the general ADNI eligibility, inclusion and exclusion criteria. ADNI grouped participants into multiple diagnostic categories based on their clinical assessments (For further detail see: http://adni.loni.usc.edu/).
2.2. Data extraction
Demographic, clinical, and quantified structural MRI and DTI data were used for the analysis. To quantify symptoms of impulse dyscontrol, NPI questionnaire (NPI‐Q) 29 scores were also extracted. All datasets were downloaded before January 25, 2019.
To evaluate both white and gray matter regions associated with impulse dyscontrol, we included all participants that had baseline quantified DTI, MRI, and NPI‐Q data available. Participants were excluded for: (1) missing baseline DTI data; (2) missing NPI‐Q scores (i.e., no impulse dyscontrol score); (3) quantitative MRI analysis classified as “Fail” or “Hippocampus only” by visual quality control by the UCSF core lab; or (4) missing cognitive composite scores. Figure 1 shows the step‐by‐step process of participants included/excluded from the analysis.
2.3. Participants
A total of 203 participants were included for the analysis: n = 70 NC; n = 95 MCI; and n = 38 AD‐dementia.
2.4. Measures
Clinical variables. Age, sex, education, baseline diagnostic status, psychotropic medication use, and composite scores for memory and executive function were included as clinical features to investigate the potential relationships with neural correlates associated with impulse dyscontrol scores. Psychotropic medications included antidepressants, benzodiazepines, and z‐drugs. The diagnostic status was determined by clinical assessments at the time of visit. The cognitive composite scores were standardized scores calculated by transforming data collected through the ADNI neuropsychological battery into memory and executive functioning domains. 30
Neuropsychiatric variables. Since ADNI uses the NPI‐Q to capture NPS, these data were transformed into MBI domains using a published algorithm. 21 NPI‐Q items were combined to form a composite MBI impulse domain score by adding NPI‐Q agitation/aggression, irritability, and aberrant motor behavior scores. The reference range for the NPI‐Q is 1 month, and thus the transformation algorithm generated an approximation for 1 month only. For the statistical analysis, impulse dyscontrol was classified as 0 or 1 to indicate the absence and presence of symptoms respectively.
Neuroimaging variables. Quantified neuroimaging data were downloaded from ADNI. The output from processed diffusion‐tensor MRI and T1‐weighted images was used in the analyses. University of California Los Angeles (UCLA) core lab processed the DTI datasets, computing average FA, mean diffusivity (MD), axial diffusivity (AxD), and radial diffusivity (RD) values within regions of interests from the John Hopkins University DTI atlas. MD measures the molecular diffusion rate, FA measures the directional preference of water, RD and AxD measure the rate of diffusion along the transverse and main axis, respectively. 31 In a neurodegenerative disease, the typical pattern of DTI parameters is a decrease in FA, and an increase in MD, AxD, and RD indicative of neuronal tissue damage. 32 Additional information about the UCLA DTI methods are described in more detail elsewhere. 33 For the T1‐weighted images, UCSF core lab used FreeSurfer version 5.1 for cortical reconstruction and volumetric segmentation. Outputs included cortical thickness, surface area, and volumetric measurements within regions labeled by the 2010 Desikan‐Killany and 2009 Destrieux atlas. Additional information on UCSF FreeSurfer methods is also available elsewhere. 34 In order to control for intracranial volume (ICV) differences, we computed a normalization factor by averaging ICV of the whole sample and dividing it by individual ICV. This ratio was multiplied with all cortical and subcortical volume variables. 35
Figures 1 and 2 show the a priori selected brain regions in association with symptoms of impulse dyscontrol. The regions were labeled on the JHU atlas Desikan‐Killany atlas respectively. For details on the atlas see: https://neurovault.org/images/1401/; https://dataverse.harvard.edu/dataset.xhtml?persistentId=doi:10.7910/DVN/XCCE9Q).
2.5. Statistical analysis
Sample characteristics are reported using means, standard deviations, and frequency distributions. Wilcoxon‐Mann‐Whitney tests were used to investigate univariate associations between patient characteristics and impulse dyscontrol symptoms. Linear mixed effect (LME) models were used to assess if impulse dyscontrol was associated with DTI parameters. White matter regions included in this analysis were the cingulum, cingulum (hippocampus), fornix, superior fronto‐occipital fasciculus, inferior fronto‐occipital fasciculus, and the uncinate fasciculus. Fixed effects included impulse dyscontrol, regions, impulse dyscontrol by regions, disease status, age, sex, psychotropic drug use, and education. Random effects included the hemisphere of the structure (left/right) and subjects. In the LME models, our primary predictors of interest were impulse dyscontrol, white matter regions, and impulse dyscontrol by regions. Similar analyses were conducted to test if impulse dyscontrol presence was related to volumetric measures, where regions included the hippocampus, caudal and rostral anterior cingulate, amygdala, parahippocampal gyrus, and the medial orbitofrontal cortex. Simple effect of MBI on the ROIs after LME modeling are reported. With seven different LME models in total (4 for DTI, 3 for volumetric measures), significance level was adjusted to 0.01 (instead of 0.05) to minimize inflation in type 1 error. The analyses were conducted in SAS v9.4.
3. RESULTS
Impulse dyscontrol (presence of any items in the impulse dyscontrol domain) was present in 17% of the individuals with NC, 43% with MCI, and 66% with AD. Table 1 shows the demographic characteristics and cognitive test scores in individuals with or without symptoms of impulse dyscontrol. Across the impulse dyscontrol groups, there were no significant differences with the exception of diagnostic status (p < 0.01), wherein worse cognitive diagnostic status was associated with the presence of impulse dyscontrol. Notably, there were more males with impulse dyscontrol symptoms than females. Additionally, there were more individuals with impulse dyscontrol symptoms that were using psychotropic medications.
TABLE 1.
Demographic characteristics and cognitive test scores across groups
| Total sample (n = 203) | Impulse dyscontrol symptoms absent (n = 123) | Impulse dyscontrol symptoms present (n = 80) | p‐value | |
|---|---|---|---|---|
| Age (M, SD) | 73.30 (6.67) | 73.30 (6.66) | 73.30 (6.75) | 0.59 |
| Education (M, SD) | 16.10 (2.71) | 16.10 (2.82) | 16.00 (2.56) | 0.74 |
| Female (n, %) | 92 (45.32) | 64 (69.60) | 28 (30.40) | 0.021 |
| Diagnostic status (n, %) | ||||
| NC | 70 (34.48) | 58 (82.86) | 12 (17.14) | <001 |
| MCI | 95 (46.80) | 52 (54.74) | 43 (45.26) | |
| AD | 38 (18.72) | 13 (34.21) | 25 (65.79) | |
| ADNI_MEM (M, SD) | ||||
| NC | 1.09 (0.62) | 1.03 (0.63) | 1.39 (0.45) | 0.04 |
| MCI | 0.22 (0.59) | 0.21 (0.57) | 0.24 (0.62) | 0.97 |
| AD | −0.82 (0.48) | −0.86 (0.47) | −0.80 (0.49) | 0.63 |
| ADNI_EF (M, SD) | ||||
| NC | 0.87 (0.74) | 0.83 (0.77) | 1.04 (0.58) | 0.42 |
| MCI | 0.17 (0.79) | 0.15 (0.74) | 0.18 (0.86) | 0.82 |
| AD | −0.87 (0.93) | −1.04 (1.05) | −0.79 (0.87) | 0.44 |
| Psychotropic medication use (n, %) | 52 (25.62) | 25 (20.33) | 27 (33.75) | 0.03 |
Abbreviations: AD, AD‐dementia; ADNI_EF, executive functioning composite score; ADNI_MEM, memory composite score; M, mean; MBI, mild behavioral impairment; MCI, mild cognitive impairment; NC, normal cognition; SD, standard deviation.
3.1. Linear mixed effect models
DTI variables: After controlling for age, sex, education, disease status, and psychotropic drug use, participants with impulse dyscontrol had lower FA in the fornix (βFA = −0.02 SE = 5.1 × 10⁻³ p = 0.001) and lower FA in superior fronto‐occipital fasciculus (βFA = −0.01; SE = 4.7 × 10⁻³; p = 0.007) compared to those without. Significantly higher MD, AxD, and RD values were observed in the fornix (βMD = 0.18 × 10⁻³ SE = 0.04 × 10⁻³ p < 0.0001; βAxD = 0.16 × 10⁻³ SE = 0.03×10⁻³ p < 0.0001; βRD = 0.19 × 10⁻³ SE = 0.04 × 10⁻³ p < 0.0001, respectively), and superior fronto‐occipital fasciculus (βMD = 0.11 × 10‐3 SE = 0.03 × 10⁻³ p = 0003; βAxD = 0.12 × 10⁻³ SE = 0.03 × 10⁻³ p < 0.0001; βRD = 0.13 × 10⁻³ SE = 0.03 × 10⁻³ p < 0.0001, respectively) for patients with impulse dyscontrol. See Table 2 for details.
TABLE 2.
Simple effect of MBI on regions of interest for DTI parameters from linear mixed‐effects regression analysis controlling for age, sex, education, psychotropic medication use, and disease diagnosis (MCI, AD, or NC)
| FA | MD | AxD | RD | |||||
|---|---|---|---|---|---|---|---|---|
| Estimate (SE)×10−3 | p | Estimate (SE) × 10−3 | p | Estimate (SE) × 10−3 | p | Estimate (SE) ×10−3 | p | |
| CGC MBI + versus MBI ‐ | −0.75 (3.45) | 0.83 | <0.01 (0.01) | 0.887 | <0.01 (0.01) | 0.854 | 0.01 (0.02) | 0.609 |
| CGH MBI + versus MBI ‐ | −0.09 (3.54) | 0.98 | 0.02 (0.02) | 0.178 | 0.03 (0.02) | 0.067 | 0.03 (0.02) | 0.153 |
| FX MBI + versus MBI ‐ | −16.48 (5.08) | 0.001 | 0.18 (0.04) | <0.0001 | 0.16 (0.03) | <0.0001 | 0.19 (0.04) | <0.0001 |
| IFO MBI + versus MBI ‐ | −0.64 (3.59) | 0.86 | <0.01 (0.02) | 0.794 | 0.01 (0.02) | 0.609 | 0.01 (0.02) | 0.480 |
| SFO MBI + versus MBI ‐ | −12.88 (4.73) | 0.007 | 0.11 (0.03) | 0.0003 | 0.12 (0.03) | <0.0001 | 0.13 (0.03) | <0.0001 |
| UNC MBI + versus MBI ‐ | 2.48 (4.66) | 0.60 | 0.04 (0.02) | 0.068 | 0.05 (0.02) | 0.018 | 0.04 (0.02) | 0.043 |
Abbreviations: AD, AD‐dementia; AxD, axial diffusivity; CGC, cingulum; CGH, cingulum (hippocampus); F, female; FA, fractional anisotropy; FX, fornix; IFO, inferior fronto‐occipital fasciculus; M, male; MCI, mild cognitive impairment; MD, mean diffusivity; MBI+, presence of impulse dyscontrol symptoms; NC, normal cognition; RD, radial diffusivity; SFO, superior fronto‐occipital fasciculus; SE, standard error; UNC, uncinate fasciculus.
Volumetric variables: After controlling for age, sex, education, disease status, and psychotropic drug use, impulse dyscontrol symptoms were associated with participants having smaller cortical thickness in the parahippocampal gyrus (β = −0.1 SE = 0.04 p = 0.008). None of the other a priori selected regions were associated with impulse dyscontrol. See Table 3 for details.
TABLE 3.
Simple effect of MBI on regions of interest for cortical thickness, surface area, and volume from linear mixed‐effects regression analysis controlling for age, sex, education, psychotropic medication use, and disease diagnosis (MCI, AD, or NC)
| Cortical Thickness (mm) | Surface Area (mm2) | Volume (mm3) | ||||
|---|---|---|---|---|---|---|
| Estimate (SE) | p | Estimate (SE) | p | Estimate (SE) | p | |
| Caudal anterior Cingulate MBI + versus MBI− | 0.05 (0.04) | 0.206 | −6.97 (13.90) | 0.616 | 30.92 (50.78) | 0.543 |
| Medial Orbitofrontal MBI + versus MBI− | 0.05 (0.02) | 0.031 | 15.96 (20.66) | 0.440 | 84.27 (56.39) | 0.135 |
| Parahippocampal gyrus MBI + versus MBI− | −0.10 (0.04) | 0.008 | 21.98 (12.42) | 0.077 | 43.86 (37.28) | 0.240 |
| Amygdala MBI + versus MBI− | ‐ | ‐ | −6.74 (28.97) | 0.816 | ||
| Hippocampus MBI + versus MBI− | ‐ | ‐ | −125.81 (52.53) | 0.017 | ||
| Rostral anterior cingulate MBI + versus MBI− | 0.03 (0.03) | 0.309 | −15.08 (14.74) | 0.306 | 0.91 (47.97) | 0.985 |
Abbreviations: MBI+, presence of MBI impulse dyscontrol symptoms; SE, standard error.
Additional results from the modeling are available in Table S1 to S4.
4. DISCUSSION
In this study, the relationship between structural neuroimaging markers and impulse dyscontrol symptoms was explored across cognitive categories. In those with NC, MCI, and AD, both white and gray matter differences were identified in individuals with impulse dyscontrol emphasizing the importance of these symptoms in neurodegenerative disease and supporting the notion of behavioral sequelae of brain structural changes across the cognitive spectrum.
In interpreting DTI parameters, reduced FA and increased MD, AxD, and RD are associated with impaired white matter integrity as an outcome of several factors including cell death and altered myelination, amongst others. 31 , 36 In this study, as shown by the altered DTI parameters, lower white matter integrity in tracts including the cingulum, fornix, superior fronto‐occipital fasciculus, and uncinate fasciculus was associated with impulse dyscontrol. To our knowledge, Tighe et al. 26 published the only DTI study to date that reported lower FA of the anterior cingulum to be associated with symptoms of agitation and irritability. While differences in the FA of the cingulum were not significant in our study, the cingulum was still implicated with greater AxD in individuals with impulse dyscontrol symptoms. The cingulum is an important tract that connects frontal, parietal, and medial temporal regions, including several limbic structures, and microstructural changes in this tract have been associated with MCI and AD. 37 Furthermore, a recent study identified altered DTI parameters in the cingulum in early‐stage AD. 38 In another ADNI study of participants with preclinical AD (amyloid and tau positive), irritability predicted hypometabolism in the posterior cingulate cortex 2 years later, supporting the role of irritability as a preclinical AD marker. 39 Our study extends the evidence base for the cingulum as a potential early neuroimaging marker, which can show changes in DTI parameters in individuals with impulse dyscontrol symptoms in advance of dementia.
With significant differences in all diffusion parameters, the fornix was another important tract that was associated with symptoms of impulse dyscontrol. The relationship of the fornix and NPSs in pre‐dementia and dementia populations is largely unexplored. However, there is evidence supporting neurodegeneration in the fornix predicting degree of memory impairment and the likelihood of progression to AD. 40 , 41 A reduced fornix FA is one of the earliest MRI abnormalities observed in individuals at risk of AD 42 and has been explored as a treatment target using deep brain stimulation for mild AD. 43 In a recent study, damaged white matter integrity of the fornix was also associated with reduced resting‐state functional connectivity of the hippocampus in individuals with MCI and AD. 44 Observing fornix impairment in association with impulse dyscontrol highlights NPSs as part of the early disease process. The cingulum, fornix, and fronto‐occipital fasciculus tracts are all important for connections between hippocampus to the hypothalamus and connecting orbitofrontal areas to the occipital regions. These white matter differences combined with gray matter atrophy in the parahippocampal gyrus provide evidence that the well‐established atrophy patterns in AD 45 , 46 are also prominent in the presence of behavioral symptoms, even after adjustment for disease status.
These findings also suggest that white matter damage is more prominent than gray matter atrophy, in line with past literature, which has determined that microstructural white matter changes precede gray matter atrophy. 47 With the goal to identify the neural correlates associated with the MBI impulse dyscontrol domain, the results suggest that the fronto‐striatal network plays a key role in regulating these behaviors. Rosenberg et al. 48 identified that the agitation circuit consists of the frontal cortex, anterior cingulate cortex, orbitofrontal cortex, amygdala, hippocampus, and insula. Since these regions associated with agitation mapped onto the salience network, the authors proposed that increased connectivity within this network could explain agitation in individuals. Similarly, we observed the cingulum, fronto‐occipital tracts, fornix, uncinate fasciculus, and parahippocampal gyrus as key regions associated with impulse dyscontrol. Some of the regions from this study also overlap with the agitation circuits previously identified 48 providing evidence of brain changes similar to core AD pathology, which can precede cognitive symptoms or dementia.
Beyond differences in neural correlates, we also observed group differences in the sex of the participants in our study. More men had symptoms of impulse dyscontrol present. There is some evidence that suggests males have greater impulse control behaviors, 49 however, other studies have identified NPS such as, disinhibition, verbal aggression, and irritability to be more common in females. 50 , 51 , 52 These differences across studies could be an outcome of variations based on recruitment strategy, study design, sample analyzed, diagnostic criteria, and the instruments used to measure NPS. The higher proportion of males with impulse dyscontrol symptoms adds to the evidence base. However, further research is required explore sex differences in association with NPS.
There are several strengths of this study. For example, this is one of the first studies to explore neural correlates of the MBI impulse dyscontrol domain in a majority of predementia participants. Being a relatively new syndrome, understanding the biological changes associated with MBI domains can help clinicians and researchers appreciate the neural underpinnings of later life behavioral changes, and link these to dementia risk. Additionally, our sample primarily consisted of individuals in the preclinical and prodromal stages of AD‐dementia—identifying patterns of micro/macro‐structural changes at earlier stages could support future prediction models and enable early patient identification.
There are some limitations of this study. MBI case detection was approximated using transformations of the NPI‐Q. Since NPI‐Q measures symptoms within 1‐month range, it is possible that we captured transient symptoms that may have resolved, thus decreasing diagnostic specificity. Studies have shown inflated MBI prevalence using transformed scores 21 , 53 in comparison to the use of the MBI checklist (MBI‐C), which is the validated a priori case ascertainment instrument developed for MBI. 54 The MBI‐C has demonstrated ability to serve as a proxy marker for older adults with subtle cognitive changes or early neurodegenerative disease. 3 , 55 Thus, diagnostic sensitivity of this approach may also be a limitation, as the whole breadth of MBI impulse dyscontrol, validated by network meta‐analysis 56 is not captured by the NPI‐Q. Future studies that use MBI‐C should further investigate the neural correlates associated with MBI impulse dyscontrol and other domains to verify our results. Additionally, ADNI excludes patients with psychiatric illness (some of which may actually be prodromal dementia symptoms) 10 or those with severe NPS. Thus, the sample included in this study might underappreciate the extent of NPS in the preclinical and prodromal population. Other datasets should be explored for further validation of our results.
5. CONCLUSIONS
To our knowledge, this is one of the first few studies that explores the neural correlates of impulse dyscontrol in predementia participants. We demonstrate typical AD structural changes in the brain associated with these behavioral symptoms, even in advance of dementia or cognitive decline, emphasizing the utility of assessing behavior. Understanding the neuropsychiatric manifestations of the neurodegenerative disease can help clinicians in predicting the progression of the disease.
CONFLICT OF INTEREST
Dr. Ismail reports consultation fees and honoraria from Janssen, Lundbeck, and Otsuka, outside the submitted work; Dr. Smith reports personal fees from Alnylman Pharmaceuticals and Biogen, outside the submitted work; no other authors have financial interests with commercial interests.
ETHICS STATEMENT
The ADNI study was approved by all the Institutional Ethical Review Boards of all participating centers. All participants signed written informed consent.
AUTHORS' CONTRIBUTIONS
SG analyzed and interpreted the data and contributed in writing the manuscript. PM, MW, DR, and TS were involved in the statistical analyses. FPM, EES, NDF, and ZI critically analyzed the results and made intellectual contributions to writing the manuscript. All authors read and approved the final manuscript.
Supporting information
Supplementary Material
ACKNOWLEDGEMENTS
Data collection and sharing for this project was funded by the Alzheimer's Disease Neuroimaging Initiative (ADNI) (National Institutes of Health Grant U01 AG024904) and DOD ADNI (Department of Defense award number W81XWH‐12‐2‐0012). ADNI is funded by the National Institute on Aging, the National Institute of Biomedical Imaging and Bioengineering, and through generous contributions from the following: AbbVie, Alzheimer's Association; Alzheimer's Drug Discovery Foundation; Araclon Biotech; BioClinica, Inc.; Biogen; Bristol‐Myers Squibb Company; CereSpir, Inc.; Cogstate; Eisai Inc.; Elan Pharmaceuticals, Inc.; Eli Lilly and Company; EuroImmun; F. Hoffmann‐La Roche Ltd and its affiliated company Genentech, Inc.; Fujirebio; GE Healthcare; IXICO Ltd.; Janssen Alzheimer Immunotherapy Research & Development, LLC.; Johnson & Johnson Pharmaceutical Research & Development LLC.; Lumosity; Lundbeck; Merck & Co., Inc.; Meso Scale Diagnostics, LLC.; NeuroRx Research; Neurotrack Technologies; Novartis Pharmaceuticals Corporation; Pfizer Inc.; Piramal Imaging; Servier; Takeda Pharmaceutical Company; and Transition Therapeutics. The Canadian Institutes of Health Research is providing funds to support ADNI clinical sites in Canada. Private sector contributions are facilitated by the Foundation for the National Institutes of Health (www.fnih.org). The grantee organization is the Northern California Institute for Research and Education, and the study is coordinated by the Alzheimer's Therapeutic Research Institute at the University of Southern California. ADNI data are disseminated by the Laboratory for Neuro Imaging at the University of Southern California. Alzheimer Society of Calgary via the Hotchkiss Brain Institute—University of Calgary.
Gill S, Wang M, Mouches P, et al. Neural correlates of the impulse dyscontrol domain of mild behavioral impairment Int J Geriatr Psychiatry. 2021;36(9):1398–1406. 10.1002/gps.5540
Data used in preparation of this article was obtained from the Alzheimer's disease Neuroimaging Initiative (ADNI) database (adni.loni.usc.edu). As such, the investigators within the ADNI contributed to the design and implementation of ADNI and/or provided data but did not participate in analysis or writing of this report. A complete listing of ADNI investigators can be found at: http://adni.loni.usc.edu/wpcontent/uploads/how_to_apply/ADNI_Acknowledgement_List.pdf.
DATA AVAILABILITY STATEMENT
The datasets used and/or analyzed during the current study are available through the open access ADNI database.
REFERENCES
- 1. Ismail Z, Smith EE, Geda Y, et al. Neuropsychiatric symptoms as early manifestations of emergent dementia: provisional diagnostic criteria for mild behavioral impairment. Alzheimer's Dementia. 2016;12(2):195‐202. [DOI] [PMC free article] [PubMed] [Google Scholar]
- 2. Creese B, Griffiths A, Brooker H, et al. Profile of mild behavioral impairment and factor structure of the mild behavioral impairment checklist in cognitively normal older adults. Int Psychogeriatr. 2020;32(6):705‐717. [DOI] [PubMed] [Google Scholar]
- 3. Creese B, Brooker H, Ismail Z, et al. Mild behavioral impairment as a marker of cognitive decline in cognitively normal older adults. Am J Geriatric Psychiatry. 2019;27(8):823‐834. [DOI] [PubMed] [Google Scholar]
- 4. Mallo SC, Ismail Z, Pereiro AX, et al. Assessing mild behavioral impairment with the mild behavioral impairment‐checklist in people with mild cognitive impairment. J Alzheimer's Dis. 2018;66(1):83‐95. [DOI] [PubMed] [Google Scholar]
- 5. Mallo SC, Ismail Z, Pereiro AX, et al. Assessing mild behavioral impairment with the mild behavioral impairment checklist in people with subjective cognitive decline. Int Psychogeriatr. 2018:1‐9. [DOI] [PubMed] [Google Scholar]
- 6. Matsuoka T, Ismail Z, Narumoto J. Prevalence of mild behavioral impairment and risk of dementia in a psychiatric outpatient clinic. J Alzheimer's Dis. 2019;70(2):505‐513. [DOI] [PMC free article] [PubMed] [Google Scholar]
- 7. Taragano FE, Allegri RF, Heisecke SL, et al. Risk of conversion to dementia in a mild behavioral impairment group compared to a psychiatric group and to a mild cognitive impairment group. J Alzheimer's Dis. 2018;62(1):227‐238. [DOI] [PubMed] [Google Scholar]
- 8. Gosselin PA, Ismail Z, Faris PD, et al. Effect of hearing ability and mild behavioural impairment on MoCA and memory index scores. Can Geri J. 2019;22(3):165. [DOI] [PMC free article] [PubMed] [Google Scholar]
- 9. Ismail Z, McGirr A, Gill S, Hu S, Forkert ND, Smith EE. Mild behavioral impairment and subjective cognitive decline predict cognitive and functional decline. J Alzheimers Dis. 2021. in press. 80(1):459–469. 10.3233/jad-201184 [DOI] [PMC free article] [PubMed] [Google Scholar]
- 10. Gill S, Mouches P, Hu S, et al. Using machine learning to predict dementia from neuropsychiatric symptom and neuroimaging data. J Alzheimer's Dis. 2020;75(1):277‐288. [DOI] [PMC free article] [PubMed] [Google Scholar]
- 11. Lussier FZ, Pascoal TA, Chamoun M, et al. Mild behavioral impairment is associated with β‐amyloid but not tau or neurodegeneration in cognitively intact elderly individuals. Alzheimer's Dementia. 2020;16:192‐199. [DOI] [PMC free article] [PubMed] [Google Scholar]
- 12. Johansson M, Stomrud E, Insel P, et al. Mild Behavioral Impairment and its relation to tau pathology in preclinical Alzheimer’s disease. Transl Psychiatry. 2021;11(76). [DOI] [PMC free article] [PubMed] [Google Scholar]
- 13. Lussier FZ, Pascoal TA, Therriault J, et al. Mild behavioral impairment is associated with beta‐amyloid and tau across the alzheimer's disease spectrum. J Cereb Blood Flow Metab. 2019;39:158‐159. [Google Scholar]
- 14. Naude JP, Gill S, Hu S, et al. Plasma neurofilament light: a marker of neurodegeneration in mild behavioral impairment. J Alzheimer's Dis. 2020;76(3):1017‐1027. [DOI] [PMC free article] [PubMed] [Google Scholar]
- 15. Matuskova V, Ismail Z, Nikolai T, et al. Mild behavioral impairment is associated with atrophy in Alzheimer's disease‐related regions in non‐demented older adults. Alzheimer's & Dementia. 2020;16:e044819. [Google Scholar]
- 16. Yoon EJ, Ismail Z, Hanganu A, et al. Mild behavioral impairment is linked to worse cognition and brain atrophy in Parkinson disease. Neurology. 2019;93(8):e766‐e777. [DOI] [PMC free article] [PubMed] [Google Scholar]
- 17. Andrews SJ, Ismail Z, Anstey KJ, Mortby M. Association of Alzheimer's genetic loci with mild behavioral impairment. Am J Med Genet. 2018;177(8):727‐735. [DOI] [PubMed] [Google Scholar]
- 18. Lanctôt KL, Amatniek J, Ancoli‐Israel S, et al. Neuropsychiatric signs and symptoms of Alzheimer's disease: new treatment paradigms. Alzheimers Dement (N Y). 2017;3:440‐449. [DOI] [PMC free article] [PubMed] [Google Scholar]
- 19. Fischer CE, Ismail Z, Schweizer TA. Impact of neuropsychiatric symptoms on caregiver burden in patients with Alzheimer's disease. Neurodegener Dis Manag. 2012;2(3):269‐277. [Google Scholar]
- 20. Mortby ME, Ismail Z, Anstey KJ. Prevalence estimates of mild behavioral impairment in a population‐based sample of pre‐dementia states and cognitively healthy older adults. Int Psychogeriatr. 2018;30(2):221‐232. [DOI] [PubMed] [Google Scholar]
- 21. Sheikh F, Ismail Z, Mortby ME, et al. Prevalence of mild behavioral impairment in mild cognitive impairment and subjective cognitive decline, and its association with caregiver burden. Int Psychogeriatr. 2018;30:233‐244. [DOI] [PubMed] [Google Scholar]
- 22. Masters MC, Morris JC, Roe CM. “Noncognitive” symptoms of early Alzheimer disease A longitudinal analysis. Neurology. 2015;84:1‐6. [DOI] [PMC free article] [PubMed] [Google Scholar]
- 23. Wise EA, Rosenberg PB, Lyketsos CG, Leoutsakos JM. Time course of neuropsychiatric symptoms and cognitive diagnosis in National Alzheimer's Coordinating Centers volunteers. Alzheimer's Dement Diag, Assess Dis Monit. 2019;11:333‐339. [DOI] [PMC free article] [PubMed] [Google Scholar]
- 24. Trzepacz PT, Yu P, Bhamidipati PK, et al. Frontolimbic atrophy is associated with agitation and aggression in mild cognitive impairment and Alzheimer's disease. Alzheimer's Dementia. 2013;9(5 Suppl):S95‐S104. [DOI] [PMC free article] [PubMed] [Google Scholar]
- 25. Hu X, Meiberth D, Newport B, Jessen F. Anatomical correlates of the neuropsychiatric symptoms in Alzheimer's disease. Curr Alzheimer Res. 2015;12(3):266‐277. [DOI] [PubMed] [Google Scholar]
- 26. Tighe SK, Oishi K, Mori S, et al. Diffusion tensor imaging of neuropsychiatric symptoms in mild cognitive impairment and Alzheimer's dementia. J Neuropsychiatry Clin Neurosci. 2012;24(4):484‐488. [DOI] [PMC free article] [PubMed] [Google Scholar]
- 27. Pievani M, Agosta F, Pagani E, et al. Assessment of white matter tract damage in mild cognitive impairment and Alzheimer's disease. Hum Brain Mapp. 2010;31(12):1862‐1875. [DOI] [PMC free article] [PubMed] [Google Scholar]
- 28. Bateman DR, Gill S, Hu S, et al. Agitation and impulsivity in mid and late life as possible risk markers for incident dementia. Alzheimer's Dementia Translational Research & Clinical Interventions. 2020;6(1):e12016. [DOI] [PMC free article] [PubMed] [Google Scholar]
- 29. Kaufer DI, Cummings JL, Ketchel P, et al. Validation of the NPI‐Q, a brief clinical form of the Neuropsychiatric Inventory. Jnp. 2000;12(2):233‐239. [DOI] [PubMed] [Google Scholar]
- 30. Gibbons LE, Carle AC, Mackin RS, Harvey D, Mukherjee S, Insel P, Curtis SM, Mungas D, Crane PK, et al. A composite score for executive functioning, validated in Alzheimer’s Disease Neuroimaging Initiative (ADNI) participants with baseline mild cognitive impairment. Brain imaging and behavior. 2012;6(4):517‐527. [DOI] [PMC free article] [PubMed] [Google Scholar]
- 31. Soares J, Marques P, Alves V, Sousa N. A hitchhiker's guide to diffusion tensor imaging. Front Neurosci. 2013;7:31. [DOI] [PMC free article] [PubMed] [Google Scholar]
- 32. Talai AS, Sedlacik J, Boelmans K, Forkert ND. Widespread diffusion changes differentiate Parkinson's disease and progressive supranuclear palsy. NeuroImage Clinic. 2018;20:1037‐1043. [DOI] [PMC free article] [PubMed] [Google Scholar]
- 33. Nir TM, Jahanshad N, Villalon‐Reina JE, et al. Effectiveness of regional DTI measures in distinguishing Alzheimer's disease, MCI, and normal aging. NeuroImage Clinic. 2013;3:180‐195. [DOI] [PMC free article] [PubMed] [Google Scholar]
- 34. Hartig M, Truran‐Sacrey D, Raptentsetsang S, Simonson A, Mezher A, Schuff N, Weiner M, et al. UCSF FreeSurfer Methods; San Francisco: ADNI Alzheimers Disease Neuroimaging Initiative; 2014. [Google Scholar]
- 35. Talai AS, Ismail Z, Sedlacik J, Boelmans K, Forkert ND. Improved automatic morphology‐based classification of Parkinson’s disease and progressive supranuclear palsy. Clin Neuroradiol. 2019;29(4):605‐614. 10.1007/s00062-018-0727-8. [DOI] [PubMed] [Google Scholar]
- 36. O’Donnell LJ, Westin C‐F. An introduction to diffusion tensor image analysis. Neurosurgery Clinics. 2011;22(2):185‐196. [DOI] [PMC free article] [PubMed] [Google Scholar]
- 37. Bubb EJ, Metzler‐Baddeley C, Aggleton JP. The cingulum bundle: anatomy, function, and dysfunction. Neurosci Biobehav Rev. 2018;92:104‐127. [DOI] [PMC free article] [PubMed] [Google Scholar]
- 38. Wen Q, Mustafi SM, Li J, et al. White matter alterations in early‐stage Alzheimer's disease: a tract‐specific study. Alzheimer's Dement Diag, Assess Dis Monit. 2019;11:576‐587. [DOI] [PMC free article] [PubMed] [Google Scholar]
- 39. Ng KP, Pascoal TA, Mathotaarachchi S, et al. Neuropsychiatric symptoms predict hypometabolism in preclinical Alzheimer disease. Neurology. 2017;88(19):1814‐1821. [DOI] [PMC free article] [PubMed] [Google Scholar]
- 40. Oishi K, Lyketsos CG. Alzheimer’s disease and the fornix. Front Aging Neurosci. 2014;6:241. [DOI] [PMC free article] [PubMed] [Google Scholar]
- 41. Mielke MM, Okonkwo OC, Oishi K, et al. Fornix integrity and hippocampal volume predict memory decline and progression to Alzheimer's disease. Alzheimer's Dementia. 2012;8(2):105‐113. [DOI] [PMC free article] [PubMed] [Google Scholar]
- 42. Kantarci K. Fractional anisotropy of the fornix and hippocampal atrophy in Alzheimer’s disease. Front Aging Neurosci. 2014;6:316. [DOI] [PMC free article] [PubMed] [Google Scholar]
- 43. Leoutsakos J‐MS, Yan H, Anderson WS, et al. Deep brain stimulation targeting the fornix for mild Alzheimer dementia (the ADvance trial): a two year follow‐up including results of delayed activation. J Alzheimer's Dis. 2018;64(2):597‐606. [DOI] [PMC free article] [PubMed] [Google Scholar]
- 44. Wang P, Zhou B, Yao H, et al. Aberrant hippocampal functional connectivity is associated with fornix white matter integrity in Alzheimer’s disease and mild cognitive impairment. J Alzheimer's Dis. 2020;(Preprint):75(4):1153‐1168. [DOI] [PubMed] [Google Scholar]
- 45. Ewers M, Sperling RA, Klunk WE, Weiner MW, Hampel H. Neuroimaging Markers for the Prediction and Early Diagnosis of Alzheimer's Disease Dementia. Trend in neurosciences. 2011;34(8):430‐432. [DOI] [PMC free article] [PubMed] [Google Scholar]
- 46. Mak E, Gabel S, Mirette H, et al. Structural neuroimaging in preclinical dementia: from microstructural deficits and grey matter atrophy to macroscale connectomic changes. Ageing Res Rev. 2017;35:250‐264. [DOI] [PubMed] [Google Scholar]
- 47. Zhuang L, Sachdev PS, Trollor JN, et al. Microstructural white matter changes, not hippocampal atrophy, detect early amnestic mild cognitive impairment. PLoS One. 2013;8:e58887. [DOI] [PMC free article] [PubMed] [Google Scholar]
- 48. Rosenberg PB, Nowrangi MA, Lyketsos CG. Neuropsychiatric symptoms in Alzheimer's disease: what might be associated brain circuits? Mol Aspects Med. 2015;43‐44:25‐37. [DOI] [PMC free article] [PubMed] [Google Scholar]
- 49. Apostolova LG, Di LJ, Duffy EL, et al. Risk factors for behavioral abnormalities in mild cognitive impairment and mild Alzheimer's disease. Dementia Geriatr Cogn Disord. 2014;37(5‐6):315‐326. [DOI] [PMC free article] [PubMed] [Google Scholar]
- 50. Ott BR, Tate CA, Gordon NM, Heindel WC. Gender differences in the behavioral manifestations of Alzheimer's disease. J Am Geriatr Soc. 1996;44(5):583‐587. [DOI] [PubMed] [Google Scholar]
- 51. Zuidema SU, de Jonghe JFM, Verhey FRJ, Koopmans RTCM. Predictors of neuropsychiatric symptoms in nursing home patients: influence of gender and dementia severity. Int J Geriatr Psychiatr. 2009;24(10):1079‐1086. [DOI] [PubMed] [Google Scholar]
- 52. Xing Y, Tang Y, Jia J. Sex differences in neuropsychiatric symptoms of Alzheimer’s disease: the modifying effect of apolipoprotein E ε4 status. Behav Neurol. 2015;2015. [DOI] [PMC free article] [PubMed] [Google Scholar]
- 53. Mortby ME, Black SE, Gauthier S, et al. Dementia clinical trial implications of mild behavioral impairment. Int Psychogeriatr. 2018;30(2):171‐175. [DOI] [PubMed] [Google Scholar]
- 54. Ismail Z, Agüera‐Ortiz L, Brodaty H, et al. The mild behavioral impairment checklist (MBI‐C): a rating Scale for neuropsychiatric symptoms in pre‐dementia populations. J Alzheimer's Dis. 2017;56(3):929‐938. [DOI] [PMC free article] [PubMed] [Google Scholar]
- 55. Kassam F, Chen HY, Nosheny RL, et al. Cognitive profile of mild behavioral impairment (MBI) in brain health registry participants. Alzheimer's Dementia. 2020;16:e047673. [DOI] [PMC free article] [PubMed] [Google Scholar]
- 56. Saari T., Smith EE., Ismail Z. Network analysis of impulse dyscontrol in mild cognitive impairment and subjective cognitive decline. International Psychogeriatrics. 2021;1–10. 10.1017/s1041610220004123 [DOI] [PubMed] [Google Scholar]
Associated Data
This section collects any data citations, data availability statements, or supplementary materials included in this article.
Supplementary Materials
Supplementary Material
Data Availability Statement
The datasets used and/or analyzed during the current study are available through the open access ADNI database.