

Abstract
Tendon injuries are among the most common ailments of the musculoskeletal system. Prolonged inflammation and persistent vasculature are common complications associated with poor healing. Damaged tendon, replaced with scar tissue, never completely regains the native structural or biomechanical properties. This study evaluated the effects of micronized dehydrated human amnion/chorion membrane (μdHACM) on the inflammatory environment and hypervascularity associated with tendinopathy. Stimulation of human tenocytes with interleukin‐1 beta (IL1β) induced the expression of inflammatory and catabolic markers, resulting in secretion of active MMPs and type 3 collagen that is associated with a degenerative phenotype. Treatment with μdHACM diminished the effects of IL1β, reducing the expression of inflammatory genes, proteases, and extracellular matrix components, and decreasing the presence of active MMP and type 3 collagen. Additionally, a co‐culture model was developed to evaluate the effects of μdHACM on angiogenesis associated with tendinopathy. Micronized dHACM differentially regulated angiogenesis depending upon the cellular environment in which it was placed. This phenomenon can be explained in part through the detection of both angiogenic protagonists and antagonists in μdHACM. Observations from this study identify a mechanism by which μdHACM regulates inflammatory processes and angiogenesis in vitro, two key pathways implicated in tendinopathic injuries.
Keywords: amniotic membrane, angiogenesis, inflammation, tendinopathy, tenocytes
1. INTRODUCTION
Tendon is dense fibrous connective tissue, made up of a collagenous matrix that contains few cells and is noticeably devoid of vasculature. The structure and composition of the tendon is designed to have high tensile strength, however, the constant strain on this tissue also makes it vulnerable to injury, with limited intrinsic capacity for regeneration. 1 , 2 In general, tendon repair follows the typical wound healing course orchestrated by signaling cues secreted from surrounding cells. The healing process is relatively slow and is often interrupted by repetitive injuries, trauma, aging, and/or degenerative pathology causing prolonged inflammation and persistent vascularization. 1
While inflammation is a necessary step during reparative processes, excessive inflammation is thought to significantly impair healing. 3 Modulators of inflammation, including interleukin‐β (IL1β), are found to be elevated in injured tendon tissue. 4 , 5 , 6 Increased production of these inflammatory cytokines can alter the phenotype of resident cells resulting in persistent changes to their secretome. 7 Additionally, IL1β can trigger the catabolic degradation of the extra cellular matrix (ECM) through the activation of matrix degrading enzymes such as matrix metalloproteinase (MMP). 8 , 9 , 10
In line with upregulated inflammatory processes, temporary vessels emerge in the typically avascular tendon to facilitate delivery of nutrients and cell signaling molecules to the injury site. 11 However, prolonged inflammation stimulates the release of inflammatory factors that act directly or indirectly on the tendon vasculature, as confirmed by the presence of vascularization and elevated levels of angiogenic stimuli in injured tendon tissue. 12 , 13 , 14 Although several molecules have been shown to be important in angiogenesis, vascular endothelial growth factor (VEGF) functions as a key regulator of physiologic as well as pathologic angiogenesis and is detectable at higher concentration in diseased tendon tissue. 14 , 15 , 16 , 17 A balanced management of the vascular response may be required to overcome the limited regenerative capacity in tendon pathologies.
Resolution of abnormal inflammatory and angiogenic pathways are promising targets for new drug development for the treatment of tendon injuries and augmenting their repair. Micronized dehydrated human amnion/chorion membrane (μdHACM; MiMedx Group, Inc., Marietta, GA) is PURION® processed amniotic membrane allograft available in an injectable format. Previous studies evaluating the membrane configuration have demonstrated this proprietary process retains well‐known regulatory proteins and preserves the bioactivity to stimulate cellular activities. 18 , 19 , 20 , 21 , 22 , 23 Clinical studies demonstrate efficacy in diseases with varying etiologies suggesting the complex nature of μdHACM may prove useful in a multitude of applications. 24 , 25 , 26 , 27 , 28 , 29
In this study, specific pathological processes from a chronic tendon injury were modeled in vitro. The inflammatory environment of a tendon injury was mimicked through IL1β stimulation of tenocytes followed by evaluation of the effect of μdHACM on the ensuing expression of inflammatory signals, proteases, collagen, as well the MMP activity. Additionally, a co‐culture system was developed to mimic hypervascularity and evaluate the effect of μdHACM on vascular network formation and disruption. It is hypothesized that the regulatory proteins, contained within μdHACM, facilitate regulation of the inflammatory and angiogenic processes.
2. MATERIALS AND METHODS
2.1. Micronized dehydrated human amnion/chorion membrane (μdHACM)
μdHACM (MiMedx, Marietta, GA) is a dehydrated human allograft comprised of laminated amnion and chorion membranes, derived from the amniotic sac. Birth tissue was donated under informed consent, following cesarean sections, in compliance with the Food and Drug Administration's (FDA) Good Tissue Practice and American Association of Tissue Banks (AATB) standards. All donors were tested and confirmed to be free of infectious diseases, including human immunodeficiency virus (HIV), human T‐lymphotropic virus (HTLV), hepatitis B and C, and syphilis. Amnion and chorion were separated from the placenta and processed in accordance with the proprietary PURION® process, in which the amnion and chorion layers are gently cleansed, laminated, and dehydrated under controlled conditions. The bi‐layer tissue is cryomilled and the resulting particles are collected. The final product is subjected to terminal sterilization to ensure a sterility assurance level of less than 10−6.
To prepare extracts of soluble molecules from μdHACM for cell culture experiments, individual donors of μdHACM were extracted overnight at 4°C with gentle agitation at 10 mg of tissue per milliliter of medium, as specified for each individual cell type/assay below. The tissue residue was removed by centrifugation at 3,000 rpm for 15 min at room temperature and the resultant fluid was passed through 0.22 μm filter (Millipore Sigma, St. Louis, MO). The filtrate was collected in a sterile container to serve as the extract treatment. Extracts were then diluted in the appropriate medium to the desired testing concentrations.
2.2. In vitro tenocyte inflammatory model
Cryopreserved human primary tendon cells (tenocytes) were purchased from ZenBio (Research Triangle Park, NC). Tenocytes from three individual donors were used in the experiments. Donor information is provided in Table 1. Tenocytes, at passage 3, were cultured in tenocyte growth medium (ZenBio, Research Triangle Park, NC) on collagen coated flasks (Corning, Corning, NY) at 37°C, 5% CO2 until 80% confluent. Cells were detached using TrypLE cell dissociation solution (Gibco, Thermo Fisher Scientific, Waltham, MA). Tenocytes were seeded at a density of 2,500 cells per well in a 96‐well plate and 75,000 cell per well in a six‐well plate and cultured in tenocyte growth media (ZenBio, Research Triangle Park, NC) containing 10% FBS for 72 hr. IL1β, a potent inflammatory cytokine, was used to induce cellular inflammation according to previous studies. 30 , 31 The cells were then stimulated with either basal medium or basal medium, containing 1 ng/ml of IL1β (Sigma, St. Louis, MO) for 48 hr. Basal medium is defined as Dulbecco's Modified Eagle's Medium (Thermo Fisher Scientific, Waltham, MA) containing 1% penicillin streptomycin (Fisher Scientific, Waltham, MA) and 1% sodium pyruvate (Thermo Fisher Scientific, Waltham, MA). Following stimulation, the medium was removed and fresh culture medium, supplemented with one of the following was added: Group #1 basal medium; Group #2 IL1β; Group #3 IL1β + 5 mg/ml μdHACM; Group #4 IL1β + 2.5 mg/ml μdHACM; Group #5 IL1β + 0.2 mg/ml μdHACM. μdHACM treatments were prepared as previously described in basal media (n = 3 μdHACM donors). Each treatment group was tested in triplicate in each of the three tenocyte donors. Treatment groups containing μdHACM tested individual μdHACM donors at the indicated concentrations. All treatment groups were tested with three technical replicates for gene expression. For MMP activity and western blot, each treatment group was tested individually.
TABLE 1.
Tenocyte donor demographic data
| Donor number | Donor ID | Age (years) | Gender | Ethnicity | Origin |
|---|---|---|---|---|---|
| 1 | TENM021617C | 72 | Male | Caucasian | Achilles tendon |
| 2 | TENM030817E | 96 | Male | Caucasian | Achilles tendon |
| 3 | TENM051619A | 63 | Female | Caucasian | Achilles tendon |
2.3. Quantitative polymerase chain reaction
RNA and complimentary DNA (cDNA) was prepared utilizing the Cells‐2‐Ct Kit (Thermo Fisher Scientific, Waltham, MA), per the manufacturer's protocol. Quantitative polymerase chain reaction (qPCR) amplification for each gene target was performed on a QuantStudio™ 7 Flex Real‐Time PCR System (Thermo Fisher Scientific, Waltham, MA) using predesigned TaqMan Gene Expression Assays for IL6 (Hs00174131_m1), MCP1 (Hs00234140_m1), MMP1 (Hs00899658_m1), MMP3 (Hs00968305_m1), COL1A1 (Hs00164004_m1), COL3A1 (Hs00943809_m1), and eukaryotic 18 s (4319413E) purchased from Thermo Fisher Scientific (Waltham, MA). The 2−ΔΔCt method was used to determine relative expression of μdHACM‐treated tenocytes compared to IL1β‐treated tenocytes with eukaryotic 18s as an endogenous control.
2.4. Western blotting
Proteins were isolated in radio immunoprecipitation assay buffer (Thermo Fisher Scientific, Waltham, MA) complemented with a cocktail of protease inhibitors (Millipore Sigma, Burlington, MA). Cell debris was pelleted by centrifugation at 14,000 rpm at 4°C for 10 min; supernatants were harvested and protein concentrations were determined with Pierce BCA protein assay (Thermo Fisher Scientific, Waltham, MA). Equal protein amounts were resolved by 4–12% gradient sodium dodecylsulfate poly‐acrylamide gel electrophoresis and transferred onto nitrocellulose membranes using iBlot2 device (Thermo Fisher Scientific, Waltham, MA). Membranes were blocked for 1 hr in 5% non‐fat dry milk 1× Tris buffered saline 0.05% Tween 20 and probed with antibodies against type 1 collagen (Abcam, Cambridge, MA) and type 3 collagen (Novus Biologicals, Centennial, CO) or β‐Actin (R&D Systems, Minneapolis, MN) overnight at 4°C. Membranes were washed in 1× Tris buffered saline 0.05% Tween 20 and incubated with anti‐mouse or anti‐rabbit IgG HRP‐conjugated secondary antibodies (Abcam, Cambridge, MA). Immunoreactive proteins were detected using chemi‐luminescence (Thermo Fisher Scientific, Waltham, MA) and imaged on the GE Healthcare Imager.
2.5. MMP activity assay
The SensoLyte 520 Generic MMP Assay (AnaSpec, Fremont, CA) was used to measure MMP activity in conditioned media (CM) according to manufacturer's instructions. In this assay, a quenched fluorescence resonance energy transfer (FRET) peptide is used as an MMP substrate. Upon cleavage of the intact peptide by an MMP, fluorescence is generated and can be measured by a plate reader. Relative fluorescent units (RFUs) are directly correlated to MMP activity. The peptide used in this assay is a generic substrate and can be cleaved by MMPs −1, −2, −3, −7, −8, −9, −10, −12, −13, and −14. CM was centrifuged at 500g for 5 min. Positive controls of Human MMP1 and Human MMP3 (AnaSpec, Fremont, CA) were activated with 1 mM 4‐aminophenylmercuric acetate (APMA) at 37°C for 3 hr. APMA was omitted from CM test samples to allow for measurement of endogenous MMP activity. Following addition of CM test samples, standards, and positive control, the quenched peptide substrate was incubated with the samples in a 96‐well format. RFUs were quantitated at excitation/emission wavelengths (490/520 nm) with the Synergy™ Mx Microplate Reader (BioTek). The fluorescence reference standard was used to convert the RFU at each time point to the concentration of the enzymatic reaction product. Enzymatic rate of activity per minute was calculated using the following formula: (concentration at 60 min—concentration at 0 min)/60 min, where activity is defined as the amount of product resulting from proteolytic cleavage of the substrate.
2.6. Network formation in vitro
Preliminary evaluation of network formation was performed using a co‐culture system of normal human dermal fibroblasts (NHDF) and human umbilical vein endothelial cells (HUVEC) provided in the Angiogenesis PrimeKit (Essen Biosciences, Ann Arbor, MI), according to the manufacturer's instructions. The effect of network formation specific to tendinopathy was further assessed by establishing a novel co‐culture model using normal human tenocytes (ZenBio Research Triangle Park, NC) and HUVEC provided in the Angiogenesis PrimeKit (Essen Biosciences, Ann Arbor, MI). Briefly, the HUVECs, which are tagged with green fluorescent protein to allow fluorescent visualization of the tubule formation, were plated on top of a tenocyte monolayer and allowed to form networks under different experimental models. Media and supplements were used from the Angiogenesis PrimeKit. In both culture systems, three models for assessing the effect of μdHACM of angiogenesis were evaluated (Figure 1): I. Angiogenesis or the ability to stimulate vascular networks, II. Anti‐angiogenesis or the ability to prevent the formation of vascular networks, III. Vascular disruption or the ability to interrupt established vascular networks. μdHACM extract was prepared, as previously described, in assay medium provided in the Angiogenesis PrimeKit. Three different tenocytes donors were tested is each model.
FIGURE 1.
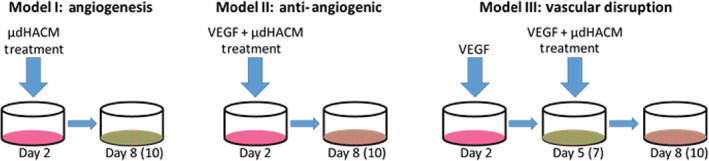
Angiogenesis models. A co‐culture, of NHDF or tenocytes and HUVEC, was used to test the effect of μdHACM on network formation. Three models were used for assessing the effect of μdHACM on angiogenesis; (Model I) to determine the angiogenic response; (Model II) the anti‐angiogenic potential of μdHACM; (Model III) to model vascular disruption. HUVEC, human umbilical vein endothelial cells; NHDF, normal human dermal fibroblasts; μdHACM, micronized dehydrated human amnion/chorion membrane
Model I: Treatments were added on Day 2 until Day 8 in culture. Treatment groups included: assay medium + 4 ng/ml VEGF (positive control), assay medium + 4 ng/ml VEGF +100 μM suramin (negative control), assay medium alone (vehicle control), or μdHACM extracts at 5, 2.5, and 0.2 mg/ml concentrations in assay medium (n = 3 μdHACM donors). Each treatment was performed in triplicate. Model II: The cells were cultured with treatment in the presence of 4 ng/ml of VEGF, including: assay medium + 4 ng/ml VEGF (negative control), assay medium + 4 ng/ml VEGF + 100 μM suramin (positive control), assay medium alone (vehicle control), or μdHACM extracts at 5, 2.5, and 0.2 mg/ml concentrations in assay medium containing 4 ng/ml VEGF (n = 3 μdHACM donors) from Day 2 until Day 8. Each treatment was performed in triplicate. Model III: Tubular networks in the co‐culture system were established by addition of 4 ng/ml VEGF from Day 2 until Day 5 of culture. On Day 5, the cells were treated with one of the following: assay medium + 4 ng/ml VEGF (negative control), assay medium + 4 ng/ml VEGF + 100 μM suramin (positive control), assay medium alone (vehicle control), or μdHACM extracts at 5, 2.5, and 0.2 mg/ml concentrations in assay medium (n = 3 μdHACM donors). Each treatment was performed in triplicate.
The culture plates were placed into the IncuCyte system (S3; Essen Biosciences, Ann Arbor, MI) and imaged every 12 hr for 8 days. Angiogenesis was assessed by quantifying network branch points, network length, and average network length. These measurements were calculated using the Angiogenesis module provided in the InCucyte system (Essen, version 2019B REV2), which performs quantitative scoring of network formation.
2.7. Evaluation of angiogenic antagonists in μdHACM extract
The presence of angiogenic antagonists was evaluated in μdHACM extract (n = 6 μdHACM donors). Extracts were prepared, at 5, 2.5, and 0.2 mg/ml, as previously described in assay medium provided in the Angiogenesis PrimeKit. High Performance Luminex Assays (R&D Systems, Minneapolis, MN) were used for quantification of VEGFR1/sFlt‐1, endostatin, VEGFR2/s‐Flk‐1, and thrombospondin‐2 in μdHACM extract. Assay was performed according to the manufacturer's instructions and each sample was tested in duplicate.
The ability of antagonists to bind or antagonize soluble VEGF was evaluated by incubating recombinant VEGF (4 ng/ml) with the treatment groups for 5 min at 37°C, followed by immediate quantification of the unbound VEGF by ELISA (DVE00; R&D Systems, Minneapolis, MN). The treatment groups were prepared as follows: assay medium only (negative control), assay medium + 4 ng/ml VEGF (positive control), μdHACM extracts at 5, 2.5, 0.2 mg/ml, or μdHACM extracts at 5, 2.5, and 0.2 mg/ml + 4 ng/ml VEGF (n = 6 μdHACM donors). ELISA assay was performed according to the manufacturer's instructions and each sample was tested in duplicate.
2.8. Statistical analysis
All values are reported as mean +/− SD and statistical analyses were performed using the GraphPad Prism software. For gene expression and MMP activity, values were compared within each tenocyte donor using a one‐way ANOVA. For angiogenesis models, Day 8 (tenocyte) or Day 10 (NHDF) values were compared using a one‐way ANOVA. For each ANOVA, pairwise comparisons were made using a Tukey test. Significant difference was assigned when p < .05.
3. RESULTS
3.1. Treatment with μdHACM reduces IL1β induced changes in vitro
Tenocytes from three different donors were individually stimulated with 1 ng/ml of IL1β to induce a state of cellular inflammation. The extent of the response to IL1β stimuli differed between donors, demonstrating expected variability; nevertheless, the general trends were identical across all donors. Comparison of control groups, from individual tenocyte donors, confirmed the intended inflammatory response to IL1β treatment as follows: in the positive control, IL1β treatment of tenocytes resulted in elevated gene expression of inflammatory mediators IL6, MCP1, MMP1, and MMP3 and the ECM component type 3 collagen compared to unstimulated control (basal) (Figure S1). No change was observed in type 1 collagen upon IL1β stimulation in Donor 1 and Donor 3. IL1β stimulation of cell Donor 2 decreased the expression of type 1 collagen (Figure S1).
The μdHACM treatment at 5 mg/ml and 2.5 mg/ml significantly down regulated the expression of inflammatory markers IL6 and MCP1 and ECM component COL3A1 (Figure 2a, b, and f). The effects of μdHACM treatment on the expression of IL6, MCP1, and COL3A1 were consistent between tenocyte donors. Changes in gene expression of MMP1, MMP3, and COL1A1 were dependent on μdHACM dose and tenocyte donor (Figure 2c–e). Reduced MMP3 expression was observed at both 5 mg/ml and 2.5 mg/ml in tenocyte Donors 1 and Donor 2. However, only 2.5 mg/ml μdHACM decreased the expression of MMP3 in Donor 3 (Figure 2d). Tenocyte Donors 1 and 3 demonstrated reduced expression of type 1 collagen at 5 mg/ml, while COL1A1 expression in tenocyte Donor 2 was not impacted by μdHACM treatment (Figure 2e). The effects on MMP1 were limited to treatment with 2.5 mg/ml of μdHACM, while 5 mg/ml only showed changes in gene expression in Donor 1 (Figure 2c). IL1β induced gene expression was not impacted by treatment with 0.2 mg/ml of μdHACM.
FIGURE 2.
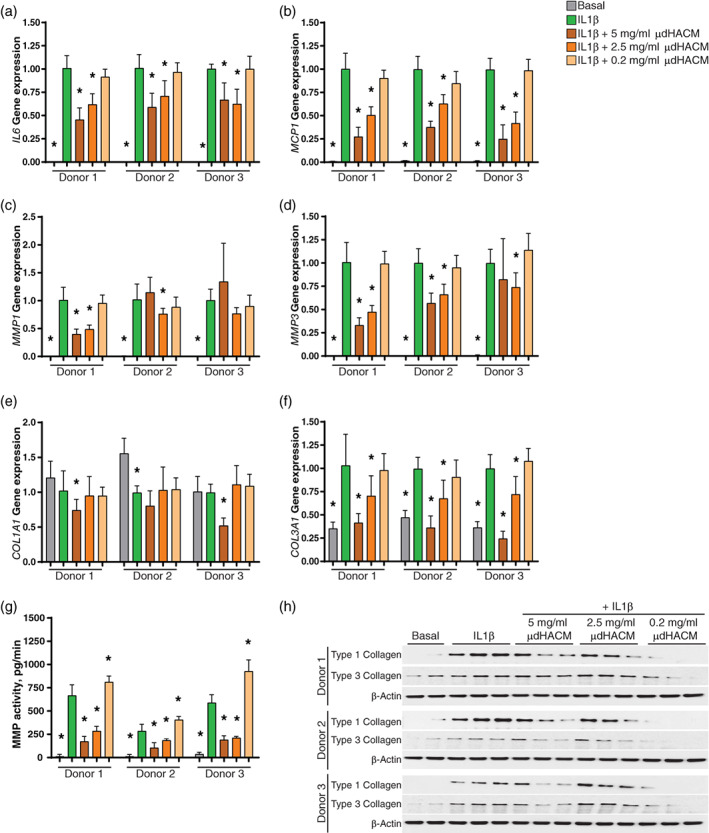
Effects of micronized dehydrated human amnion/chorion membrane (μdHACM) treatment on modulators of inflammation and ECM proteins. Fold change in gene expression in tenocytes following 48 hr stimulation with IL1β and 48 hr treatment with IL1β + μdHACM. (a) IL16; (b) MCP1; (c) MMP1; (d) MMP3; (e) COL1A1; (f) COL3A1. (g) MMP activity in the conditioned media from tenocytes stimulated with IL1β followed by treatment with IL1β + μdHACM. (h) Expression of type 1 collagen and type 3 collagen in tenocytes assessed by western blot analysis. Errors bars represent the SD. * p < .05 versus IL1β using one‐way ANOVA, n = 3 μdHACM donors
Additionally, the presence of active MMPs in the CM was analyzed using a quenched FRET peptide that can be cleaved by multiple MMPs to produce a fluorescence signal. IL1β increases the production the active MMPs in the CM in the three tenocyte donors. μdHACM treatment at 5 mg/ml and 2.5 mg/ml reduced the level of active MMPs secreted by tenocytes. Treatment with 0.2 mg/ml increased the amount of active MMPs in the CM (Figure 2g). Although the amount of active MMPs induced by IL1β varies between tenocyte donors, the reduction in active MMPs elicited by μdHACM treatment was consistent.
Consistent with gene expression, type 3 collagen protein level was increased by IL1β. Treatment with μdHACM decreases type 3 collagen in tenocytes stimulated with IL1β (Figure 2h). However, type 1 collagen was elevated by IL1β stimulation and μdHACM reduced the protein secretion of type 1 collagen induced by IL1β (Figure 2h).
3.2. Angiogenic effects of μdHACM
The effects of μdHACM on network formation were established using a co‐culture model of HUVECS and NHDF. Model I demonstrated that μdHACM enhances network formation at 2.5 mg/ml; whereas in Model II, network formation was inhibited with μdHACM treatment at 5 mg/ml (Figures S2 and S3). Additionally, disruption of an established vascular network was demonstrated at all concentrations of μdHACM tested (Figure S4). The established angiogenic models, with NHDF, demonstrated the applicability of these test systems to monitor the effect of μdHACM. Next, the use of tenocytes in the co‐culture system with HUVECS was examined to elucidate the impact tenocytes have in facilitating network formation and determine any alternations in treatment effects.
Network formation was enhanced by the addition of μdHACM to a co‐culture model of HUVECS and tenocytes in the absence of VEGF. The positive control of VEGF resulted in an increase in all measured parameters in the three tenocyte donors (Figure 3a–i; Table 2). μdHACM was tested at 5, 2.5, and 0.2 mg/ml, with the 2.5 mg/ml concentration showing statistically significant increases in network branch points, network length, and average network length in Donor 1 (Figure 3a, d, g; Table 2) and Donor 2 (Figure 3b, e, h; Table 2). μdHACM treatment at 0.2 mg/ml significantly increased the network branch points and network length in tenocyte Donor 3 (Figure 3c, f, i; Table 2).
FIGURE 3.
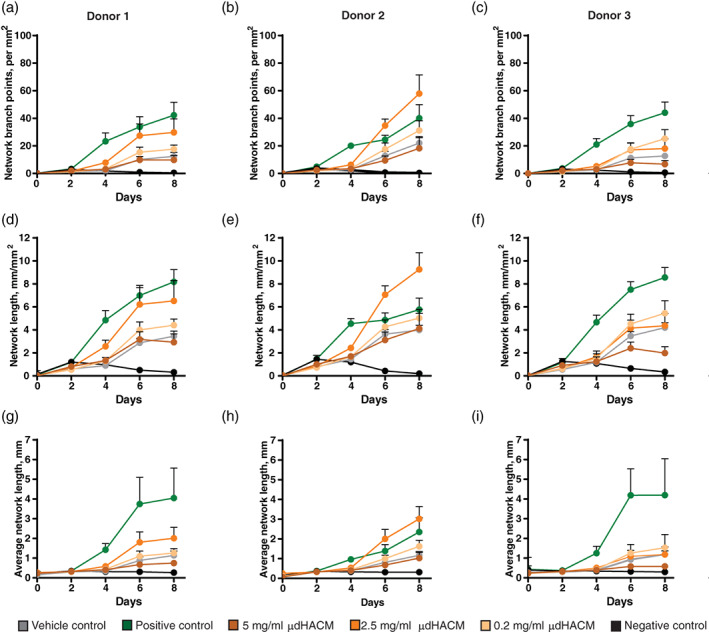
Pro‐angiogenic effects of μdHACM. On Day 2, treatments, including assay medium + 4 ng/ml VEGF (positive control), assay medium + 4 ng/ml VEGF + 100 μM suramin (negative control), assay medium alone (vehicle control), or μdHACM extracts at 5, 2.5, and 0.2 mg/ml concentrations in assay medium were added to the co‐cultures using each tenocyte donor. Time course image analysis was performed measuring (a–c) network branch points (per mm2), (d–f) network length (mm/mm2), and (g–i) average network length (mm) in response to μdHACM treatment. Error bars represent the SD from the mean values. n = 3 μdHACM donors. VEGF, vascular endothelial growth factor; μdHACM, micronized dehydrated human amnion/chorion membrane
TABLE 2.
Effect of μdHACM on vascular network formation
| Cell donor | Model I: Angiogenesis | Model II: Anti‐angiogenic | Model III: Vascular disruption | ||||||
|---|---|---|---|---|---|---|---|---|---|
| Network branch points a | Network length b | Average network length c | Network branch points a | Network length b | Average network length c | Network branch points a | Network length b | Average network length c | |
| 1 (Vehicle control) | 12.39 ± 2.97 | 3.45 ± 0.44 | 1.14 ± 0.21 | 12.39 ± 2.97# | 3.45 ± 0.44# | 1.14 ± 0.22# |
16.35 ± 2.84# |
3.86 ± 0.51# |
1.62 ± 0.20# |
| 1 (Positive control) | 42.22 ± 9.35* | 8.18 ± 1.07* | 4.05 ± 1.52* | 0.50 ± 0.32# | 0.32 ± 0.11# | 0.27 ± 0.03# | 3.19 ± 0.88# | 1.10 ± 0.23# | 0.49 ± 0.04# |
| 1 (Negative control) | 0.50 ± 0.32* | 0.32 ± 0.11* | 0.27 ± 0.03* | 42.22 ± 9.35 | 8.18 ± 1.07 | 4.05 ± 1.52 | 39.20 ± 7.05 | 6.86 ± 0.81 | 2.57 ± 1.12 |
| 1 (μdHACM, 5 mg/ml) | 9.76 ± 3.20 | 2.92 ± 0.73 | 0.75 ± 0.15 | 16.77 ± 4.11# | 4.13 ± 0.92# | 1.03 ± 0.23# | 24.47 ± 3.71# | 4.46 ± 0.55# | 1.52 ± 0.39 |
| 1 (μdHACM, 2.5 mg/ml) | 29.76 ± 9.79* | 6.52 ± 1.78* | 2.01 ± 0.55* | 40.13 ± 5.98 | 7.95 ± 0.73 | 3.06 ± 1.15 | 32.60 ± 6.33 | 5.93 ± 0.84 | 1.95 ± 0.66 |
| 1 (μdHACM, 0.2 mg/ml) | 17.64 ± 2.86 | 4.41 ± 0.54 | 1.26 ± 0.22 | 42.46 ± 6.94 | 8.08 ± 0.77 | 2.84 ± 0.81# | 38.71 ± 7.21 | 7.09 ± 0.86 | 2.75 ± 0.86 |
| 2 (Vehicle control) | 22.03 ± 4.73 | 3.99 ± 0.41 | 1.17 ± 0.19 | 22.03 ± 4.73# | 3.99 ± 0.41# | 1.17 ± 0.19# | 19.04 ± 2.54# | 3.65 ± 0.31# | 1.04 ± 0.11# |
| 2 (Positive control) | 40.05 ± 9.87* | 5.76 ± 1.00* | 2.35 ± 0.72* | 0.38 ± 0.32# | 0.20 ± 0.10# | 0.31 ± 0.06# | 3.05 ± 1.15# | 1.00 ± 0.15# | 0.43 ± 0.10# |
| 2 (Negative control) | 0.38 ± 0.32* | 0.20 ± 0.10* | 0.31 ± 0.06* | 40.05 ± 9.87 | 5.76 ± 1.00 | 2.35 ± 0.72 | 47.74 ± 8.45 | 6.93 ± 0.99 | 2.70 ± 0.58 |
| 2 (μdHACM, 5 mg/ml) | 18.22 ± 7.38 | 4.12 ± 1.32 | 1.02 ± 0.29 | 31.21 ± 6.42 | 5.60 ± 0.82 | 1.57 ± 0.41 | 30.19 ± 5.40# | 4.87 ± 0.68# | 1.58 ± 0.29# |
| 2 (μdHACM, 2.5 mg/ml) | 57.87 ± 13.58* | 9.26 ± 1.45* | 3.02 ± 0.63* | 66.82 ± 9.41# | 9.88 ± 0.84# | 4.04 ± 1.15# | 40.59 ± 7.84 | 6.05 ± 0.72 | 2.30 ± 0.55 |
| 2 (μdHACM, 0.2 mg/ml) | 31.13 ± 7.11 | 5.45 ± 1.09 | 1.62 ± 0.31 | 44.94 ± 7.42 | 6.72 ± 0.83 | 2.34 ± 0.61 | 38.29 ± 8.03 | 5.92 ± 0.72 | 1.95 ± 0.44# |
| 3 (Vehicle control) | 12.73 ± 2.15 | 4.20 ± 0.43 | 1.19 ± 0.17 | 12.73 ± 1.60# | 4.20 ± 0.43# | 1.19 ± 0.17# | 16.99 ± 2.57# | 4.59 ± 0.40# | 1.46 ± 0.24# |
| 3 (Positive control) | 44.05 ± 7.69* | 8.56 ± 0.86* | 4.20 ± 1.85* | 0.63 ± 0.37# | 0.34 ± 0.17# | 0.30 ± 0.04# | 2.69 ± 0.53# | 1.03 ± 0.08# | 0.43 ± 0.04# |
| 3 (Negative control) | 0.63 ± 0.37* | 0.34 ± 0.17* | 0.30 ± 0.04 | 44.05 ± 7.36 | 8.56 ± 0.86 | 4.20 ± 1.85 | 49.44 ± 2.62 | 8.47 ± 0.53 | 3.30 ± 0.71 |
| 3 (μdHACM, 5 mg/ml) | 6.74 ± 2.65 | 1.98 ± 0.56* | 0.59 ± 0.10 | 12.78 ± 3.48# | 3.35 ± 0.68# | 0.81 ± 0.15# | 16.97 ± 4.13# | 3.30 ± 0.60# | 1.05 ± 0.14# |
| 3 (μdHACM, 2.5 mg/ml) | 18.06 ± 6.99 | 4.37 ± 1.05 | 1.18 ± 0.39 | 36.62 ± 9.01# | 7.19 ± 1.29# | 2.40 ± 0.68# | 31.68 ± 4.43# | 5.56 ± 0.59# | 1.87 ± 0.39# |
| 3 (μdHACM, 0.2 mg/ml) | 25.22 ± 6.53* | 5.45 ± 1.09* | 1.53 ± 0.68 | 49.05 ± 6.15 | 9.48 ± 0.84 | 3.46 ± 0.94 | 43.79 ± 5.18 | 7.93 ± 0.51 | 2.25 ± 0.54# |
Note: * p < .05 versus the vehicle control; # p < .05 versus the negative control; all data represent the average ± the SD.
Indicates per mm2.
Indicates mm/mm2.
Indicates mm.
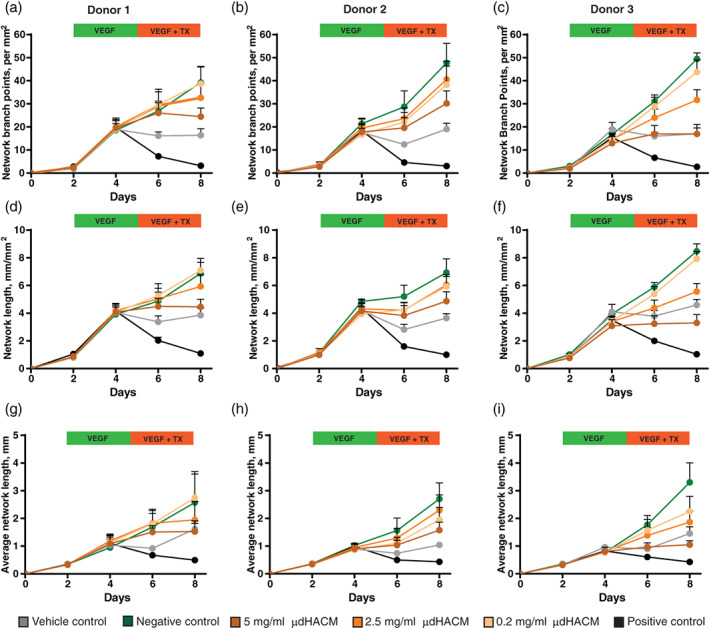
When μdHACM and VEGF were added simultaneously to the co‐culture model, the effect of treatment differed from that observed when μdHACM was added alone (Figure 4). Addition of 5 mg/ml μdHACM plus 4 ng/ml of VEGF inhibited network formation, in tenocyte Donors 1 and 3, resulting in a decrease in angiogenesis parameters, similar to the vehicle control supplemented with VEGF (Figure 4; Table 2). No observable inhibition was seen with tenocyte Donor 2; however, 2.5 mg/ml treatment increased the angiogenic parameters.
FIGURE 4.
Anti‐angiogenic response of μdHACM in the presence of VEGF. On Day 2 of co‐culture, μdHACM treatments were added in the presence of 4 ng/ml VEGF. Time course image analysis was performed in co‐culture with the three different tenocyte donors measuring (a–c) network branch points (per mm2), (d–f) network length (mm/mm2), and (g–i) average network length (mm) in response to μdHACM treatment. Error bars represent the SD from the mean values. n = 3 μdHACM donors. VEGF, vascular endothelial growth factor; μdHACM, micronized dehydrated human amnion/chorion membrane
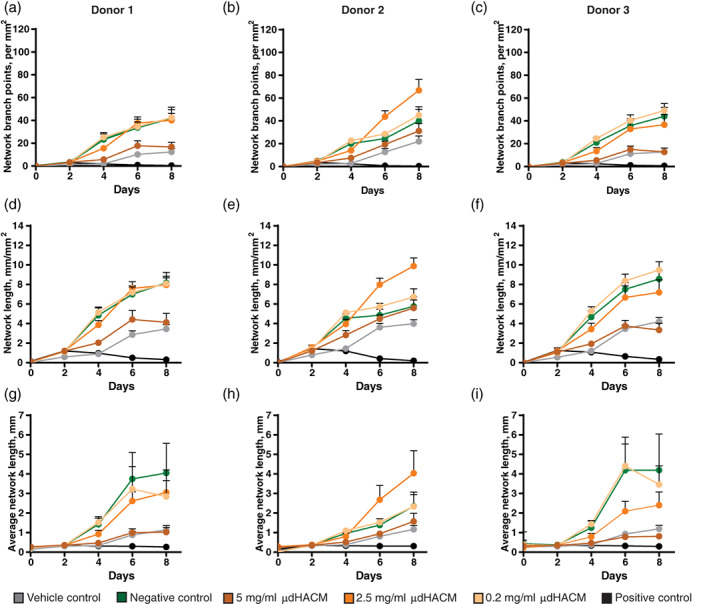
The effect of μdHACM on the disruption of an established vascular network was examined in the 8 day tenocyte and HUVEC co‐culture model (Figure 5). Over the first 5 days with VEGF treatment, all groups increased the angiogenic parameters. Variable results were observed with the addition of treatments on Day 5 through Day 8. The vehicle control group, assay media with no VEGF, resulted in a decrease in vascular network parameters. This result necessitated culturing treatment groups in the presence of VEGF to measure vascular disruption, as the network will gradually degrade without sustained VEGF administration. The negative control group, VEGF, maintained the established vascular network, while the positive control group, suramin + VEGF, resulted in a significant decrease in the number of angiogenic parameters within the first day (Figure 5; Table 2). These results were observed with the three tenocyte donors. The addition of μdHACM treatment in the presence of VEGF similarly decreased the angiogenic parameters. At Day 8, a significant reduction in the number of network branch points, network length and the average network length was observed in cells from all tenocyte donors treated with 5 mg/ml μdHACM compared to the negative control, while 2.5 mg/ml decreased all network parameters in tenocyte Donor 3 (Figure 5; Table 2).
FIGURE 5.
Vascular disruption potential of μdHACM. HUVECs formed networks in the presence of VEGF over 3 days followed by treatment with μdHACM + VEGF for 3 days. Time course image analysis was performed measuring (a–c) network branch points (per mm2), (d–f) network length (mm/mm2), and (g–i) average network length (mm) in response to μdHACM treatment. Error bars represent the SD from the mean values. n = 3 μdHACM donors. HUVEC, human umbilical vein endothelial cells; VEGF, vascular endothelial growth factor; μdHACM, micronized dehydrated human amnion/chorion membrane
3.3. Anti‐angiogenic effects of μdHACM
The presence of endogenous angiogenesis inhibitors in μdHACM extract was evaluated. Results show the presence of the angiogenic inhibitors endostatin, VEGFR1/Flt‐1, VEGFR2/KDR/Flk‐1, and thrombospondin‐2, are present in μdHACM extract (Table 3). Endostatin is the most abundant angiogenesis antagonist with an average of 6,225 ± 2,227 pg/ml, followed by VEGFR1/s‐Flt‐1 (1,760 ± 341 pg/ml), VEGFR2/KDR/Flk‐1 (770 ± 692 pg/ml), and thrombospondin‐2 (690 ± 201 pg/ml; Table 3).
TABLE 3.
Level of angiogenesis antagonists in μdHACM extract
| μdHACM concentration | Endostatin, pg/ml | VEGFR1/Flt‐1, pg/ml | VEGFR2/Flk‐1, pg/ml | Thrombospondin‐2, pg/ml |
|---|---|---|---|---|
| 5 mg/ml | 6,225 ± 2,227 | 1,760 ± 341 | 770 ± 692 | 690 ± 201 |
| 2.5 mg/ml | 3,002 ± 1,420 | 969 ± 188 | 699 ± 421 | 496 ± 48 |
| 0.2 mg/ml | 387 ± 18 | LLOQ | LLOQ | LLOQ |
Note: LLOQ, lower limit of quantitation; VEGF, vascular endothelial growth factor; μdHACM, micronized dehydrated human amnion/chorion membrane.
To investigate the ability of an antagonist to inhibit VEGF activity, μdHACM extract was incubated with and without VEGF for 5 min and the unbound VEGF was quantified. The level of available or unbound VEGF (4 ng/ml) was reduced by more than 50% when incubated with 5 mg/ml μdHACM extract and μdHACM extract at 2.5 mg/ml decreased the amount of VEGF by 30% (Figure 6), confirming a direct inhibition of VEGF as a contributing mechanism for vascular disruption.
FIGURE 6.
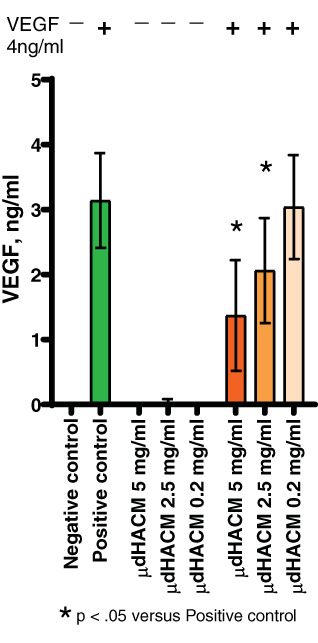
VEGF bioavailability. Soluble factors in μdHACM extract bind VEGF. Error bars represent the SD from the mean values. * p < .05 versus positive control, n = 6 μdHACM donors. VEGF, vascular endothelial growth factor; μdHACM, micronized dehydrated human amnion/chorion membrane
4. DISCUSSION
While persistent tendon injury may arise from various etiologies (i.e., overuse, diabetes, etc.), there are commonalities on a cellular level that can be extrapolated for the purposes of studying potential therapeutic pathways. The primary goal of this work was to better understand the potential role of μdHACM in regulating the various pathways known to contribute to tendon pathology. In this study, two in vitro models were developed with the intent of exploring tenocyte inflammation and hypervascularization, hallmarks of essentially all tendonopathies.
Aberrant inflammation in a tendon is attributed to an influx of invading inflammatory cells, secreting factors such as IL1β. Downstream of these inflammatory cues, tenocytes begin to degrade surrounding ECM and replace type I collagen for type III, weakening the overall structure of the tendon repair. 1 When μdHACM was added in an inflammatory tenocyte model, a significant decrease in inflammatory factors and proteases was observed. Gene expression of IL6, MCP1, MMP1, and MMP3 were effectively diminished. These inflammatory mediators, IL6 and MCP1, are implicated directly in tendinopathy‐related inflammation and angiogenesis; therefore, downregulation of these factors is desirable for offsetting the effects of injury. 4 , 5 , 6 MMP regulation is essential for establishing a balance between ECM synthesis and degradation and controlling degenerative changes associated with injury. 32 In vitro, IL1β‐treated tenocytes induced expression of MMP1 and MMP3, as well as increased the amount of active MMPs secreted into the CM; however, μdHACM treatment counteracted this effect. Additionally, μdHACM treatment reversed the increased proinflammatory‐induced expression of type 3 collagen, but did not impact type 1 collagen expression. At the protein level, μdHACM decreased both type 1 and type 3 collagen levels induced by IL1β, suggesting a potential regulation of type I collagen despite no observed impact on gene expression. The elevated expression of type 3 collagen is indicative of immature matrix formation and associated with weakened mechanical properties; therefore, μdHACM may facilitate a shift to a lower collagen type III composition in relation to collagen type I in the ECM. 1 μdHACM may not only influence the catabolic processes through MMP regulation, but also directly affect the extracellular matrix composition of a damaged tendon.
Normal tendon tissue is sparsely vascularized; whereas in tendon injury, a temporary increase in vascularization is essential for the healing process. 11 The maintenance of tendon avascularity involves a balance in the production of anti‐angiogenic factors and/or inhibitors of angiogenesis. Persistent vasculature is a hallmark of the chronic disease state and associated with disease progression. 14 The angiogenesis model used in this study allowed for testing the effects of μdHACM on a vascular network representative of both a normal and a diseased tendon. μdHACM not only promotes vessel formation, but can also effectively disrupt an established vascular network depending upon the environment in which it is placed. This novel and dynamic property was discovered through the addition of μdHACM treatment in the absence and presence of exogenous VEGF. Micronized dHACM treatment without additional VEGF, stimulated a low‐level of angiogenesis. Whereas, when VEGF is abundant, as in an injured tendon, μdHACM prevented or disrupted an established network. This in vitro mechanism suggests that μdHACM may function to maintain appropriate levels of angiogenesis when in an avascular tendon environment; but, decrease angiogenesis when in a hypervascular environment; ultimately, driving homeostasis.
This concept has been explored previously in studies identifying both pro and anti‐angiogenic factors in amniotic membranes; however, the mechanism by which μdHACM achieves this dichotomy has yet to be explored. 22 , 33 , 34 , 35 , 36 μdHACM contains quantifiable levels of several key angiogenic cytokines and Koob et al. further demonstrated that μdHACM supports the formation of blood vessels in an in vivo injury model. 22 However, in this study, a panel of factors associated with inhibition of angiogenesis/lymphangiogenesis were measured in μdHACM extract and confirmed the presence of endostatin, VEGFR1, VEGFR2, and thrombospondin. 37 , 38 , 39 , 40 To verify the proposed function of these factors in contributing to the observed in vitro vascular disruption, exogenous VEGF was incubated with μdHACM extract and the resultant bioavailability of VEGF was measured by ELISA. VEGF levels were significantly decreased with increasing concentrations of μdHACM. This result provides one possible mechanism by which μdHACM disrupts an existing vascular network.
These data demonstrate the role of μdHACM in regulating the inflammatory and angiogenic responses in models relevant to tendinopathy. In vitro neutralization of proinflammatory cytokines and proteases may facilitate the restoration of ECM components, giving rise to tissue with improved structural integrity. Additionally, reduction in vascularity may reduce the influx of inflammatory cells, further mitigating inflammation. The results of these studies are promising for the use of μdHACM in the treatment of tendinopathy; however, the limitations of in vitro studies necessitate further investigation. Pre‐clinical and clinical in vivo studies will be necessary to better understand these pathways and validate these effects in a clinical setting. This marks the first study highlighting the dynamic nature of μdHACM and its ability to elicit multiple biological changes required to effectively achieve tissue homeostasis.
CONFLICT OF INTEREST
All authors are employees of MiMedx Inc. All authors hold equity in MiMedx Inc.
AUTHOR CONTRIBUTIONS
Sarah E. Moreno, Michelle Massee: Drafting of manuscript. Sarah E. Moreno: Data collection. Sarah E. Moreno, Michelle Massee, Thomas J. Koob: Revision and approval of manuscript.
Supporting information
Figure S1 Effect of IL1β stimulation in different tenocyte donors. Fold change in gene expression of IL16, MCP, MMP1, MMP, COL1A1, COL3A1 in tenocytes following 48 hr stimulation and 48 hr treatment with basal media or IL1β. Errors bars represent the SD. * p < .05 versus Basal using one‐way ANOVA.
Figure S2 Pro‐angiogenic effects of μdHACM. On Day 2, treatments, including assay medium + 4 ng/ml VEGF (positive control), assay medium + 4 ng/ml VEGF + 100 μM suramin (negative control), assay medium alone (vehicle control), or μdHACM extracts at 5, 2.5, and 0.2 mg/ml concentrations in assay medium were added to the co‐culture. Time course image analysis was performed measuring (a) network branch points (per mm2), (c) network length (mm/mm2), and (e) average network length (mm) in response to μdHACM treatment. Statistical analysis was performed at the 10 day time point for all parameters (b, d, and f). Error bars represent the SD from the mean values. * p < .05 versus vehicle control, n = 3 μdHACM donors.
Figure S3 Anti‐angiogenic response of μdHACM in the presence of VEGF. On Day 2 of co‐culture, μdHACM treatments were added in the presence of 4 ng/ml VEGF. Time course image analysis was performed measuring (a) network branch points (per mm2), (c) network length (mm/mm2), and (e) average network length (mm) in response to μdHACM treatment. Statistical analysis was performed at the 10‐day time point for all parameters (b, d, and f). Error bars represent the SD from the mean values. * p < .05 versus negative control, n = 3 μdHACM donors.
Figure S4 Vascular disruption potential of μdHACM. HUVECs formed networks in the presence of VEGF over 5 days followed by treatment with μdHACM + VEGF for 3 days. Time course image analysis was performed measuring (a) network branch points (per mm2), (c) network length (mm/mm2), and (e) average network length (mm) in response to μdHACM treatment. Statistical analysis was performed at the 10‐day time point all parameters (b, d, and f). Error bars represent the SD from the mean values. * p < .05 versus negative control, n = 3 μdHACM donors.
ACKNOWLEDGMENTS
This study was sponsored and funded by MiMedx Group, Inc., Marietta.
Moreno SE, Massee M, Koob TJ. Dehydrated human amniotic membrane regulates tenocyte expression and angiogenesis in vitro: Implications for a therapeutic treatment of tendinopathy. J Biomed Mater Res. 2022;110(4):731-742. doi: 10.1002/jbm.b.34951
Funding information MiMedx Group, Inc.
DATA AVAILABILITY STATEMENT
Data available on request from the authors.
REFERENCES
- 1. Wu F, Nerlich M, Docheva D. Tendon injuries: basic science and new repair proposals. EFORT Open Rev. 2017;2(7):332‐342. [DOI] [PMC free article] [PubMed] [Google Scholar]
- 2. Bordoni B, Varacallo M. Anatomy, Tendons. [Updated 2020 Apr 24]. Treasure Island, FL: StatPearls Publishing; 2020. [PubMed] [Google Scholar]
- 3. Millar NL, Murrell GA, McInnes IB. Inflammatory mechanisms in tendinopathy—towards translation. Nat Rev Rheumatol. 2017;13(2):110‐122. [DOI] [PubMed] [Google Scholar]
- 4. Manning CN, Havlioglu N, Knutsen E, et al. The early inflammatory response after flexor tendon healing: a gene expression and histological analysis. J Orthop Res. 2014;32(5):645‐652. [DOI] [PMC free article] [PubMed] [Google Scholar]
- 5. Legerlotz K, Jones ER, Screen HR, Riley GP. Increased expression of IL‐6 family members in tendon pathology. Rheumatology (Oxford). 2012;51(7):1161‐1165. [DOI] [PMC free article] [PubMed] [Google Scholar]
- 6. Stalman A, Bring D, Ackermann PW. Chemokine expression of CCL2, CCL3, CCL5 and CXCL10 during early inflammatory tendon healing precedes nerve regeneration: an immunohistochemical study in the rat. Knee Surg Sports Traumatol Arthrosc. 2015;23(9):2682‐2689. [DOI] [PubMed] [Google Scholar]
- 7. Morita W, Dakin SG, Snelling SJB, Carr AJ. Cytokines in tendon disease: a systematic review. Bone Joint Res. 2017;6(12):656‐664. [DOI] [PMC free article] [PubMed] [Google Scholar]
- 8. Tsuzaki M, Guyton G, Garrett W, et al. IL‐1 beta induces COX2, MMP‐1, −3 and −13, ADAMTS‐4, IL‐1 beta and IL‐6 in human tendon cells. J Orthop Res. 2003;21(2):256‐264. [DOI] [PubMed] [Google Scholar]
- 9. Archambault J, Tsuzaki M, Herzog W, Banes AJ. Stretch and interleukin‐1beta induce matrix metalloproteinases in rabbit tendon cells in vitro. J Orthop Res. 2002;20(1):36‐39. [DOI] [PubMed] [Google Scholar]
- 10. Magra M, Maffulli N. Matrix metalloproteases: a role in overuse tendinopathies. Br J Sports Med. 2005;39(11):789‐791. [DOI] [PMC free article] [PubMed] [Google Scholar]
- 11. Fenwick SA, Hazleman BL, Riley GP. The vasculature and its role in the damaged and healing tendon. Arthritis Res. 2002;4(4):252‐260. [DOI] [PMC free article] [PubMed] [Google Scholar]
- 12. Costa C, Incio J, Soares R. Angiogenesis and chronic inflammation: cause or consequence? Angiogenesis. 2007;10(3):149‐166. [DOI] [PubMed] [Google Scholar]
- 13. Scott A, Danielson P. An emerging role for angiogenesis in Tendinopathy. Eur Musculoskelet Rev. 2009;4(1):75‐76. [PMC free article] [PubMed] [Google Scholar]
- 14. Tempfer H, Traweger A. Tendon vasculature in health and disease. Front Physiol. 2015;6:330. [DOI] [PMC free article] [PubMed] [Google Scholar]
- 15. Pufe T, Petersen W, Tillmann B, Mentlein R. The angiogenic peptide vascular endothelial growth factor is expressed in foetal and ruptured tendons. Virchows Arch. 2001;439(4):579‐585. [DOI] [PubMed] [Google Scholar]
- 16. Scott A, Lian O, Bahr R, Hart DA, Duronio V. VEGF expression in patellar tendinopathy: a preliminary study. Clin Orthop Relat Res. 2008;466(7):1598‐1604. [DOI] [PMC free article] [PubMed] [Google Scholar]
- 17. Thomas KA. Vascular endothelial growth factor, a potent and selective angiogenic agent. J Biol Chem. 1996;271(2):603‐606. [DOI] [PubMed] [Google Scholar]
- 18. Massee M, Chinn K, Lei J, Lim JJ, Young CS, Koob TJ. Dehydrated human amnion/chorion membrane regulates stem cell activity in vitro. J Biomed Mater Res B Appl Biomater. 2016;104(7):1495‐1503. [DOI] [PMC free article] [PubMed] [Google Scholar]
- 19. Koob TJ, Rennert R, Zabek N, et al. Biological properties of dehydrated human amnion/chorion composite graft: implications for chronic wound healing. Int Wound J. 2013;10(5):493‐500. [DOI] [PMC free article] [PubMed] [Google Scholar]
- 20. Koob TJ, Lim JJ, Massee M, Zabek N, Denoziere G. Properties of dehydrated human amnion/chorion composite grafts: implications for wound repair and soft tissue regeneration. J Biomed Mater Res B Appl Biomater. 2014;102(6):1353‐1362. [DOI] [PubMed] [Google Scholar]
- 21. Massee M, Chinn K, Lim JJ, Godwin L, Young CS, Koob TJ. Type I and II diabetic adipose‐derived stem cells respond in vitro to dehydrated human amnion/Chorion membrane allograft treatment by increasing proliferation, migration, and altering cytokine secretion. Adv Wound Care (New Rochelle). 2016;5(2):43‐54. [DOI] [PMC free article] [PubMed] [Google Scholar]
- 22. Koob TJ, Lim JJ, Massee M, et al. Angiogenic properties of dehydrated human amnion/chorion allografts: therapeutic potential for soft tissue repair and regeneration. Vasc Cell. 2014;6:10. [DOI] [PMC free article] [PubMed] [Google Scholar]
- 23. Lei J, Priddy LB, Lim JJ, Massee M, Koob TJ. Identification of extracellular matrix components and biological factors in micronized dehydrated human amnion/Chorion membrane. Adv Wound Care (New Rochelle). 2017;6(2):43‐53. [DOI] [PMC free article] [PubMed] [Google Scholar]
- 24. Price DT, Price TC. Robotic repair of a vesicovaginal fistula in an irradiated field using a dehydrated amniotic allograft as an interposition patch. J Robot Surg. 2016;10(1):77‐80. [DOI] [PMC free article] [PubMed] [Google Scholar]
- 25. Cazzell S, Stewart J, Agnew PS, et al. Randomized controlled trial of micronized dehydrated human amnion/Chorion membrane (dHACM) injection compared to placebo for the treatment of plantar fasciitis. Foot Ankle Int. 2018;39(10):1151‐1161. [DOI] [PubMed] [Google Scholar]
- 26. Fetterolf DE, Snyder RJ. Scientific and clinical support for the use of dehydrated amniotic membrane in wound management. Wounds. 2012;24(10):299‐307. [PubMed] [Google Scholar]
- 27. Patel VR, Samavedi S, Bates AS, et al. Dehydrated human amnion/Chorion membrane allograft nerve wrap around the prostatic neurovascular bundle accelerates early return to continence and potency following robot‐assisted radical prostatectomy: propensity score‐matched analysis. Eur Urol. 2015;67(6):977‐980. [DOI] [PubMed] [Google Scholar]
- 28. Serena TE, Carter MJ, Le LT, Sabo MJ, DiMarco DT, EpiFix VLUSG. A multicenter, randomized, controlled clinical trial evaluating the use of dehydrated human amnion/chorion membrane allografts and multilayer compression therapy vs. multilayer compression therapy alone in the treatment of venous leg ulcers. Wound Repair Regen. 2014;22(6):688‐693. [DOI] [PubMed] [Google Scholar]
- 29. Zelen CM, Serena TE, Denoziere G, Fetterolf DE. A prospective randomised comparative parallel study of amniotic membrane wound graft in the management of diabetic foot ulcers. Int Wound J. 2013;10(5):502‐507. [DOI] [PMC free article] [PubMed] [Google Scholar]
- 30. Andia I, Rubio‐Azpeitia E, Maffulli N. Platelet‐rich plasma modulates the secretion of inflammatory/angiogenic proteins by inflamed tenocytes. Clin Orthop Relat Res. 2015;473(5):1624‐1634. [DOI] [PMC free article] [PubMed] [Google Scholar]
- 31. Zhang J, Middleton KK, Fu FH, Im HJ, Wang JH. HGF mediates the anti‐inflammatory effects of PRP on injured tendons. PLoS One. 2013;8(6):e67303. [DOI] [PMC free article] [PubMed] [Google Scholar]
- 32. Walden G, Liao X, Donell S, Raxworthy MJ, Riley GP, Saeed A. A clinical, biological, and biomaterials perspective into tendon injuries and regeneration. Tissue Eng Part B Rev. 2017;23(1):44‐58. [DOI] [PMC free article] [PubMed] [Google Scholar]
- 33. Niknejad H, Paeini‐Vayghan G, Tehrani FA, Khayat‐Khoei M, Peirovi H. Side dependent effects of the human amnion on angiogenesis. Placenta. 2013;34(4):340‐345. [DOI] [PubMed] [Google Scholar]
- 34. Hao Y, Ma DH, Hwang DG, Kim WS, Zhang F. Identification of antiangiogenic and antiinflammatory proteins in human amniotic membrane. Cornea. 2000;19(3):348‐352. [DOI] [PubMed] [Google Scholar]
- 35. McQuilling JP, Burnette M, Kimmerling KA, Kammer M, Mowry KC. A mechanistic evaluation of the angiogenic properties of a dehydrated amnion chorion membrane in vitro and in vivo. Wound Repair Regen. 2019;27(6):609‐621. [DOI] [PMC free article] [PubMed] [Google Scholar]
- 36. Faraj LA, Stewart EA, Albert R, et al. In vitro anti‐angiogenic effects of cryo‐preserved amniotic membrane and the role of TIMP2 and thrombospondin. J EuCornea. 2018;1(1):3‐7. [Google Scholar]
- 37. Kim YM, Hwang S, Kim YM, et al. Endostatin blocks vascular endothelial growth factor‐mediated signaling via direct interaction with KDR/Flk‐1. J Biol Chem. 2002;277(31):27872‐27879. [DOI] [PubMed] [Google Scholar]
- 38. Kendall RL, Wang G, Thomas KA. Identification of a natural soluble form of the vascular endothelial growth factor receptor, FLT‐1, and its heterodimerization with KDR. Biochem Biophys Res Commun. 1996;226(2):324‐328. [DOI] [PubMed] [Google Scholar]
- 39. Gupta K, Gupta P, Wild R, Ramakrishnan S, Hebbel RP. Binding and displacement of vascular endothelial growth factor (VEGF) by thrombospondin: effect on human microvascular endothelial cell proliferation and angiogenesis. Angiogenesis. 1999;3(2):147‐158. [DOI] [PubMed] [Google Scholar]
- 40. Pavlakovic H, Becker J, Albuquerque R, Wilting J, Ambati J. Soluble VEGFR‐2: an antilymphangiogenic variant of VEGF receptors. Ann N Y Acad Sci. 2010;1207(suppl 1):E7‐E15. [DOI] [PMC free article] [PubMed] [Google Scholar]
Associated Data
This section collects any data citations, data availability statements, or supplementary materials included in this article.
Supplementary Materials
Figure S1 Effect of IL1β stimulation in different tenocyte donors. Fold change in gene expression of IL16, MCP, MMP1, MMP, COL1A1, COL3A1 in tenocytes following 48 hr stimulation and 48 hr treatment with basal media or IL1β. Errors bars represent the SD. * p < .05 versus Basal using one‐way ANOVA.
Figure S2 Pro‐angiogenic effects of μdHACM. On Day 2, treatments, including assay medium + 4 ng/ml VEGF (positive control), assay medium + 4 ng/ml VEGF + 100 μM suramin (negative control), assay medium alone (vehicle control), or μdHACM extracts at 5, 2.5, and 0.2 mg/ml concentrations in assay medium were added to the co‐culture. Time course image analysis was performed measuring (a) network branch points (per mm2), (c) network length (mm/mm2), and (e) average network length (mm) in response to μdHACM treatment. Statistical analysis was performed at the 10 day time point for all parameters (b, d, and f). Error bars represent the SD from the mean values. * p < .05 versus vehicle control, n = 3 μdHACM donors.
Figure S3 Anti‐angiogenic response of μdHACM in the presence of VEGF. On Day 2 of co‐culture, μdHACM treatments were added in the presence of 4 ng/ml VEGF. Time course image analysis was performed measuring (a) network branch points (per mm2), (c) network length (mm/mm2), and (e) average network length (mm) in response to μdHACM treatment. Statistical analysis was performed at the 10‐day time point for all parameters (b, d, and f). Error bars represent the SD from the mean values. * p < .05 versus negative control, n = 3 μdHACM donors.
Figure S4 Vascular disruption potential of μdHACM. HUVECs formed networks in the presence of VEGF over 5 days followed by treatment with μdHACM + VEGF for 3 days. Time course image analysis was performed measuring (a) network branch points (per mm2), (c) network length (mm/mm2), and (e) average network length (mm) in response to μdHACM treatment. Statistical analysis was performed at the 10‐day time point all parameters (b, d, and f). Error bars represent the SD from the mean values. * p < .05 versus negative control, n = 3 μdHACM donors.
Data Availability Statement
Data available on request from the authors.