

Abstract
Introduction
Drug checking services for harm reduction and overdose prevention have been implemented in many jurisdictions as a public health intervention in response to the opioid overdose crisis. This study demonstrates the first on‐site use of paper spray mass spectrometry for quantitative drug checking to address the limitations of current on‐site drug testing technologies.
Methods
Paper spray mass spectrometry was used to provide on‐site drug checking services at a supervised consumption site in the Downtown Eastside of Vancouver, British Columbia, Canada during a 2‐day pilot test in August 2019. The method included the targeted quantitative measurement of 49 drugs and an untargeted full scan to assist in identifying unknown/unexpected components.
Results
During the pilot, 113 samples were submitted for analysis, with 88 (78%) containing the client expected substance. Fentanyl was detected in 45 of 59 expected fentanyl samples, and in 50 (44%) samples overall at a median concentration of 3.6% (w/w%). The synthetic precursor of fentanyl, 4‐anilino‐N‐phenethyl‐piperidine (4‐ANPP), was found in 74.0% of all fentanyl samples at a median concentration of 2.2%, suggesting widespread poor manufacturing practices. Etizolam was detected in 10 submitted samples anticipated to be fentanyl at a median concentration of 2.5%. No clients submitting these samples expected etizolam or a benzodiazepine in their sample. In three instances, it was co‐measured with fentanyl, and in seven cases it was detected alone.
Discussion and Conclusions
The quantitative capabilities and low detection limits demonstrated by paper spray mass spectrometry offer distinct benefits over existing on‐site drug checking methods and harm reduction services.
Keywords: drug checking, harm reduction, paper spray mass spectrometry (PS‐MS), fentanyl, etizolam
Introduction
Opioid overdoses have led to an unprecedented number of overdose deaths worldwide, particularly in recent years. According to the United Nations, there were 46 802 fatal opioid overdoses in the USA in 2018, with 67% attributed to fentanyls (includes fentanyl and related analogs, e.g. carfentanil, acetyl fentanyl and so on). Similarly, in Canada, opioid overdose deaths increased 50% from 2016 to 2018 with 4398 deaths in 2018, 80% of which involved fentanyls [1]. The ongoing COVID‐19 pandemic has further exacerbated the opioid crisis [2], leading to the highest number of fatal illicit drug overdoses ever recorded per annum in British Columbia, Canada: 1724 in 2020 compared to 984 in 2019 [3].
Government responses have sought alternatives to the traditional methods of prohibition and legal enforcement [4, 5, 6]. Drug checking is one approach that has gained considerable interest and demonstrated efficacy [7]. It allows people who use drugs (PWUD) to submit samples for chemical analysis and receive evidence‐based information about the substance they intend to use. These services have demonstrated that providing drug test results can positively impact PWUD behaviour, including dose reduction/discard [8]. Drug checking technologies must be able to provide rapid results from small amounts (e.g. <10 mg) of sample to encourage participation in drug checking services. They should be selective enough to differentiate closely related substances with different toxicities (e.g. fentanyl and acetyl fentanyl), sensitive enough to detect trace levels of highly toxic substances (e.g. carfentanil), deployable for use in situ, highly adaptable to measure changes in the drug supply, operationally simple for a variety of end‐users and, importantly, provide quantitative information.
Current on‐site drug checking methods include colourimetric tests [9, 10], ion mobility spectroscopy, liquid chromatography‐mass spectrometry, gas chromatography‐mass spectrometry, immunoassay test strips, Fourier‐transform infrared spectroscopy (FTIR) and Raman spectroscopy [11]. However, these methods may suffer from one or more of the following issues: insufficient sensitivity for trace compound levels, poor differentiation of closely related compounds, inability to provide timely results and/or may not be able to quickly adapt to changes in the illicit drug supply [11, 12]. A technique that is currently untested in this space but is proving capable of addressing these challenges is paper spray mass spectrometry (PS‐MS) [13, 14].
Paper spray is an ambient ionization technique for mass spectrometry first demonstrated in 2010 [15]. In a typical measurement, a small amount (≤10 μL) of sample is applied to a triangular piece of filter paper, and small amounts of solvent are applied. As the solvent wicks to the tip, it passes through the dried sample and mobilises analytes to the tip. A high voltage is applied to the paper, causing ionization akin to electrospray [16]. PS‐MS has previously been used for the quantitative detection of drugs of abuse in blood [17, 18], urine [19, 20], saliva [21], slurries [22] and simulated drug samples [23], but has never been implemented in drug checking. Our group published a perspectives article investigating the potential of PS‐MS for drug checking [14] and has recently used fentanyl analog slurries and pharmaceutical tablets as a proxy for drug checking measurements with PS‐MS [13].
The presented study took place at a federally sanctioned supervised consumption site (SCS), the Powell Street Getaway, located in the Downtown Eastside of Vancouver, British Columbia, Canada, a recognised epicentre of the opioid overdose crisis [24]. The implementation of drug checking services in Vancouver has revealed the consistent detection of fentanyl in the drug supply in recent years [8, 25]. In addition to the routine detection of fentanyl in the Vancouver street drug supply, the direct synthetic precursor, 4‐anilino‐N‐phenethyl‐piperidine (4‐ANPP) has been detected [26] and found in kilogram amounts in clandestine criminal laboratory drug raids in Vancouver [27]. Although 4‐ANPP is reported to be a metabolite of fentanyl and related analogs [28, 29], the presence of 4‐ANPP in street drug samples indicates poor synthetic processes and/or lack of purification [30, 31]. Another worrying trend in the Vancouver street drug supply that began in 2019 is the detection of etizolam in opioid drug samples [26]. Etizolam is a thienodiazepine sedative that structurally resembles benzodiazepines and acts as an agonist for the GABA receptor [32]. Etizolam threatens the efficacy of naloxone distribution programs that have been effectively used to reverse and prevent fatal opioid overdose events because it does not act on the μ‐opioid receptor [33]. The rapidly changing drug supply and introduction of novel psychoactive substances (NPS) in many areas, especially in Vancouver [31, 34], has proven to be challenging for established on‐site drug checking methods (most often FTIR or immunoassay test strips) because of their lack of sensitivity and/or selectivity [11], and their ability to adapt quickly and economically to these changes. While synthetic cannabinoids and designer cathinones have historically been the most popular, novel synthetic opioids have recently overshadowed these compound classes [35]. The introduction of synthetic opioids has introduced another challenge to current drug checking methods: many of these compounds are physiologically relevant and/or toxic at extremely low concentrations [36], necessitating lower detection limits, the likes of which FTIR and Raman spectroscopy are unable to attain [11], yet are achievable using PS‐MS. This study presents the results from a 2‐day pilot study of PS‐MS for drug checking services offered at an SCS in the Downtown Eastside, Vancouver, British Columbia, Canada in August of 2019.
Methods
Location and approvals
The study was conducted on 15–16 August 2019 at the Powell Street Getaway Resource Centre in the Downtown Eastside of Vancouver, BC, Canada. The Powell Street Getaway has functioned as a community resource centre since 1993 and was designated as a federally sanctioned SCS in 2017. Federal exemptions under Section 56C of the Controlled Drug and Substances Act [37] allow it to legally provide services such as supervised drug consumption and checking. An amendment to this exemption was approved by Health Canada that allowed the presented study to be conducted on‐site as part of their Drug Checking Technology Challenge. The goals of the Drug Checking Technology Challenge were aimed at demonstrating technologies that could provide rapid, sensitive and quantitative detection of a wide range of drugs. Our role in this study was to pilot the use of PS‐MS on‐site and to provide quantitative drug test results for actual street drugs, demonstrating the efficacy of the technology. This SCS has a well‐staffed harm reduction team, including medical professionals, made available to assist this study and counsel PWUD regarding drug test results. SCS clients were offered an opportunity to have their drugs checked as part of the pilot test, and all interactions with PWUD were performed by the on‐site harm reduction team. Personal data regarding the PWUD and their reactions to the test results could not be collected under our exemption amendment. Client expectations for submitted drug samples were verbally relayed to the PS‐MS analyst by the harm reduction workers (HRW). After testing, the HRW rapidly relayed information back to the waiting PWUD about expected and unexpected drug components, and about the relative potency of the sample based on the quantitative results.
Analytical method
All analyses were performed by PS‐MS using a TSQ Fortis triple quadrupole mass spectrometer and a VeriSpray paper spray ion source (Thermo Fisher Scientific, San Jose, CA, USA). Specific details regarding PS‐MS method development and operation are given in the Supporting Information (Tables S1–S6). Samples were collected, prepared, analysed and reported according to the workflow in Figure 1. This was completed in approximately 5 min, consisting of approximately 1.5 min for sample collection and recording, approximately 2 min for sample preparation and approximately 1.5 min instrument analysis time (0.7 min solvent deposition, 0.8 min analysis and reporting). An example report provided to the HRW to relay to the client is given in Figure 2.
Figure 1.
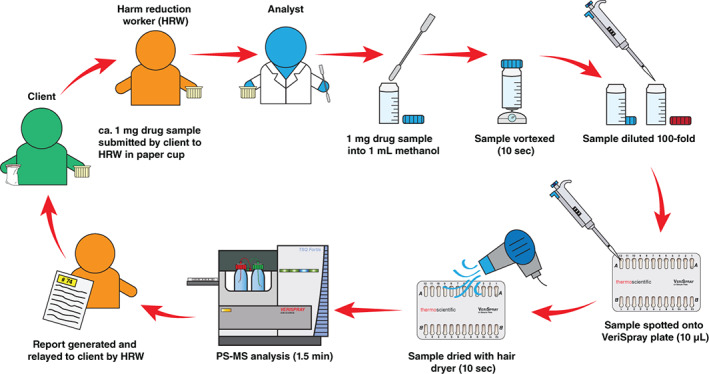
Sampling workflow and reporting of results for samples submitted by clients. PS‐MS, paper spray mass spectrometry.
Figure 2.
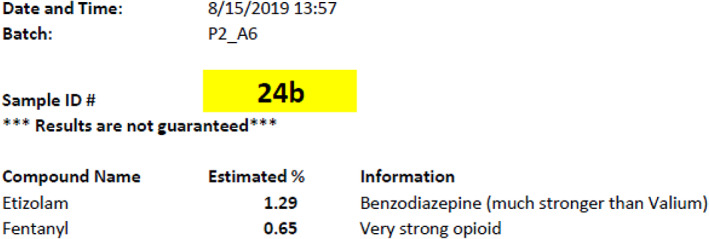
Example of the automatically generated report printout given to harm reduction workers to relay to client.
Sample collection
PWUD provided HRWs with a small amount (approximately 1 mg) of their drug and verbally provided their expectation of what the substance was. Specific details regarding sample collection and destruction are available in the Supporting Information. All PWUD participants were given a 5‐dollar gift certificate for a local coffee shop to acknowledge and promote their participation in the study.
Sample preparation
Approximately 1 mg of drug sample was added to 1.00 mL of methanol in a 2‐mL glass vial by the PS‐MS analyst and vortexed for approximately 5 s. Visual estimates (instead of weighing samples) were utilised to reduce workflow complexity and shorten testing times. In advance of the study, visual estimates were evaluated using an analytical balance and a surrogate powder, with an estimated uncertainty of ±0.2 mg, limiting the quantitation accuracy to ±20%. Accuracy could easily be improved with an analytical balance. One hundred‐fold dilution of this drug solution into 1.00 mL of methanol was carried out to create the ‘working sample’ and to lower analyte concentrations into the calibration range. A 10‐μL aliquot of the working sample was spotted onto the VeriSpray PS‐MS sample plate, dried for approximately 5 s using a conventional hair dryer and immediately analysed by PS‐MS.
Quantitation
Calibration models (1–1000 ng/mL; Table S8) for all 49 target compounds were achieved in the laboratory prior to deployment to the SCS location. The 1–1000 ng/mL correlates to mass concentrations of 0.01–10% w/w in the submitted solid drug sample. To quantify mass concentration (w/w%) of targeted compounds in prepared drug samples, 10 μL of an isotopically labelled internal standard cocktail (100 ng/mL each) was pre‐deposited onto the PS‐MS sample strips, and 10 μL of the prepared drug sample was spotted onto the paper strip on‐site. The ratio of analyte signal to internal standard signal was used for direct quantitation. The upper limit of quantitation (ULOQ) correlated to 10% w/w in the original drug sample, measurements above this were reported as >10% w/w.
Data reporting
Drug test reports were automatically generated (printed within 10 s) following PS‐MS analysis using TraceFinder software (version 4.1 SP5, Thermo Fisher Scientific). Reports were given to the HRW, who relayed information directly to clients. Data reporting was simplified to only provide three pieces of information: the detected substance(s), percentage composition in the original sample and a short substance description. A limit of reporting was used to eliminate reporting of compounds below their lower limits of quantification or relevancy. Table S9 provides the limits of detection, lower limits of quantification and limits of reporting for all target compounds.
Results
Concordance of client expectations with PS‐MS results
During the 2‐day pilot test, 186 PWUD visited the Powell Street Getaway SCS and 113 samples were submitted for drug checking by PS‐MS, representing a 61% client uptake. Figure 3 shows expected drugs by sample class, as well as how concordance between client expectation and PS‐MS results varied by substance. For the 111 samples where clients provided an expectation, 85 samples (77%) matched expectations, although often present with other unexpected substances. Conversely, in 26 of the 111 samples (23%), the expected substance was not detected. Fifty‐nine clients (53%) expected their substance to contain fentanyl, and PS‐MS detected fentanyl in 45 (76%) of these samples. Clients expected methamphetamine in 29 samples, and PS‐MS detected methamphetamine in 25 (86%) of these. One hundred percent concordance between client expectations and PS‐MS results was attained for the 11 expected cocaine samples, the three expected ketamine samples and the three expected MDMA samples. Conversely, 0% concordance was observed for the four expected heroin samples. The ‘other’ category included an expected amphetamine sample (found to contain methamphetamine), an expected benzodiazepine (no substance detected), a sample found as a discarded drug bag on the ground (fentanyl detected) and one case where the expectation was not recorded (fentanyl detected). Fentanyl was only detected in substances that were expected to be either fentanyl or heroin (and in two cases where no expectation was given).
Figure 3.
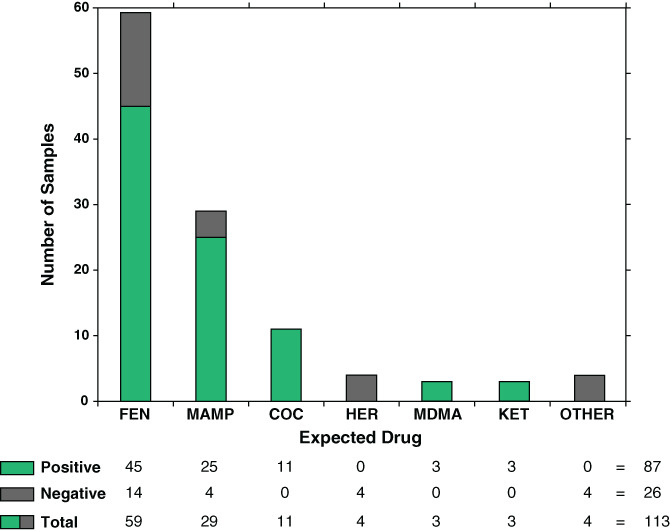
Concordance of client expectation with PS‐MS results for drug identity by expected drug category. COC, cocaine; FEN, fentanyl; HER, heroin; KET, ketamine; MAMP, methamphetamine; MDMA, 3,4‐methylenedioxymethamphetamine; PS‐MS, paper spray mass spectrometry.
Discordant results and unexpected substances
While 78% of tested samples contained the expected substance, many tests revealed the presence of unexpected adulterants or contaminants. The most adulterated/contaminated class of drugs was the opioids; only 5 (8.5%) of the 59 expected fentanyl samples did not contain any other substances in the targeted list. The most found unexpected substance in opioid samples was 4‐aminophenyl‐1‐phenethylpiperidine (4‐ANPP). 4‐ANPP was exclusively detected in samples containing fentanyl, and in the 50 samples found to contain fentanyl, 37 (74%) also contained 4‐ANPP, indicating the poor quality of the Vancouver drug supply [34].
The second most detected substance in expected fentanyl samples was etizolam. Etizolam was detected in 10 samples (9% of all samples and 17% of expected opioid samples). PS‐MS analysis revealed that in three cases, etizolam was detected alongside fentanyl, and in the other seven cases it was the only target compound detected. Heroin was detected alongside fentanyl in three expected fentanyl samples. In the four expected heroin samples, no heroin was detected and instead, fentanyl was detected in three of these samples.
In the 29 expected methamphetamine samples, three contained MDMA only and two contained cocaine only. No discordance or unexpected substances were found in the expected cocaine, MDMA or ketamine samples tested.
Quantitative results
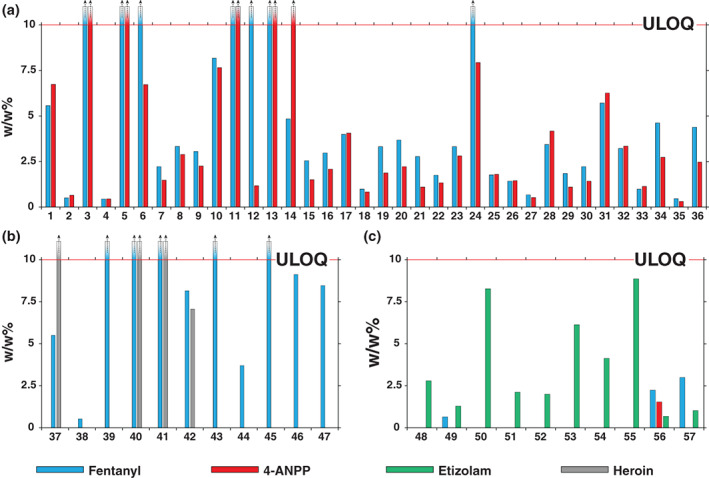
Figure 4 illustrates quantitative results from 57 of 65 samples expected to be fentanyl, heroin or samples where no expected substance was provided. The remaining eight samples in this category were not found to contain fentanyl, 4‐ANPP, etizolam or heroin. Figure 4a shows the 36 samples containing both fentanyl and 4‐ANPP. Fentanyl was measured above the ULOQ (10% w/w) in seven of these samples, and 4‐ANPP was above the ULOQ in five samples. In general, 4‐ANPP concentrations were lower or roughly equal to the concentration of fentanyl measured in this sample set. Fentanyl concentrations in this sample set ranged from 0.4% to above ULOQ (median concentration 3.3%) and 4‐ANPP concentrations ranged from 0.3% to above ULOQ (median concentration 2.2%). Figure 4b shows samples from this category where fentanyl was detected alone or alongside heroin. Heroin was measured above the ULOQ in three of the four cases, and at 7.1% in the fourth case. All heroin samples contained fentanyl. Fentanyl was measured above the ULOQ in five of the 11 samples in this category. Figure 4c shows samples from this category where etizolam was detected. Etizolam concentrations (n = 10) ranged from 0.68% to 8.27% (median 2.5% w/w). In three of these samples, fentanyl co‐occurred at concentrations of 0.6%, 2.2% and 3.0%, with one sample also containing 4‐ANPP at 1.5%. Quantitative results for all 113 samples are given in Table S10.
Figure 4.
Calculated amounts (w/w%) of fentanyl ( ), 4‐anilino‐N‐phenethyl‐piperidine (4‐ANPP) (
 ), etizolam (
 ) and heroin (
 ) in expected opioid samples and unknown samples. (a) Expected opioid samples containing exclusively fentanyl and 4‐ANPP; (b) expected opioid samples containing heroin and/or fentanyl; and (c) expected opioid samples where etizolam was detected. The upper limit of quantitation (ULOQ) was 10% w/w.
Discussion
Discordant results and unexpected substances
In most cases, PWUD are aware of the substance they intend to use, evidenced by concordance rates in this study (78%) and in similar studies [25, 38]. While confirmation of an expected substance is beneficial information, alerting clients to substances in their drugs that they are not aware of, and quantifying unexpectedly potent or ‘pure’ samples offers more benefit and potential to affect behaviour modification. For example, detecting etizolam in opioid samples can allow HRWs to inform clients that naloxone may not be completely effective in reversing an overdose. In addition, an opioid sample may be assumed to be fentanyl, but the detection of a significantly more potent trace adulterant such as carfentanil (not detected at the time of this study) would substantially alter the messaging supplied to clients by HRWs. Anecdotally, the HRWs and PWUD expressed satisfaction with the rapidity of the testing and the quality of the test results. Furthermore, several samples (especially those with detected etizolam) were returned to the PS‐MS test room by the PWUD via the HRWs for destruction, suggesting positive behaviour modifications.
One of the most effective ways that community health organisations have been able to mitigate the severity of opioid overdoses is through naloxone distribution; a systematic review found that community access to naloxone distribution programs has significantly reduced fatal opioid overdoses [33]. Naloxone binds to the μ‐opioid receptor with a strong affinity and blocks the effects of opioids on the central or peripheral nervous system [39]. Naloxone is only effective when administered for opioid overdoses, and the detection of etizolam in 9% of all samples and 16% of expected opioid samples is therefore of potential concern and salient to harm reduction messaging. Furthermore, benzodiazepine immunoassay test strips cannot differentiate between benzodiazepine analogs, and the low levels of etizolam detected by PS‐MS (median concentration 2.5%) would likely be missed by FTIR analysis.
The emergence of potent NPS that are often present at levels below the limits of detection of currently used on‐site drug checking technologies necessitates the use of techniques that are both sensitive and selective. For example, fentanyl was quantified at <1% in four samples; these levels likely would not be detected by FTIR or Raman spectroscopy. While immunoassay test strips are sensitive, and can detect trace levels of fentanyl, they lack the selectivity to differentiate between related compounds with extremely different toxicities, provide only qualitative ‘yes/no’ identification, and can only detect a single analyte class at a time.
Furthermore, as NPS enter the drug supply in the future, technologies must be able to adapt and detect them. This would require development of new immunoassays for novel drug classes, or the constant updating of spectroscopic libraries in the case of FTIR and Raman spectroscopy, limited by the availability of reference standards. PS‐MS however, is capable of rapidly adapting to the introduction of NPS without reference standards, or updated libraries, through non‐targeted scan functions, high‐resolution accurate mass and/or structural characterisation with tandem mass spectrometry. The PS‐MS method utilised in this study included an interlaced full scan to allow for the potential identification of unknowns. Mass spectrometry has a long history of using scan functions or data‐independent analysis for the identification of NPS [40]. Palaty et al. demonstrated the use of precursor ion scans with high‐resolution mass spectrometry for clinical urine samples to detect an unknown fentanyl analog(s) that had entered the Vancouver street drug supply: cyclopropylfentanyl/crotonylfentanyl [41]. The non‐targeted methods employed in other areas of mass spectrometry are applicable to and easily implemented in PS‐MS methods given sufficient hardware (e.g. high‐resolution mass spectrometer). Given the rapidly changing illicit drug market and introduction of NPS on a regular basis, the adaptability of drug checking technologies must be considered, and the ability of a technique to detect increasingly potent NPS is critical to the effectiveness of drug checking technologies. The sensitivity, selectivity and/or adaptability issues faced by established drug checking technologies highlights some of the unique strengths that PS‐MS offers to drug checking services since it is both highly sensitive and selective.
Quantitative results
One of the greatest strengths for PS‐MS as a drug checking technique, is the ease with which quantitative results can be obtained. Given the varying concentrations of substances found in illicit drugs, valuable harm reduction messaging can be gleaned from quantifying active components. An HRW may change their messaging and be more able to provide meaningful harm reduction advice depending on whether the sample is 0.1%, 1% or 10% fentanyl (or greater). Data from quantitative PS‐MS results in this study provided HRWs with valuable information and changed the information they would have relayed to the client in several instances. In the 10 instances where etizolam was detected, clients were informed that naloxone may not be able to reverse an overdose and that they should avoid using alone and contact emergency services in the event of an overdose. Clients were also alerted that their drugs may be much stronger than expected when high levels of fentanyl were measured with PS‐MS.
Sample preparation steps and the calibration models used in this pilot study were specifically designed for the detection and quantitation of lower‐level components from 0.01% to 10% w/w. This decision was made to detect and quantify the very low‐level components (e.g. carfentanil) that may be incredibly dangerous at trace levels (<1%) and are not able to be identified/detected by other on‐site testing methods. By simply adjusting the dilution factors and/or calibration range, the range of the PS‐MS calibration model may be tailored on a compound‐specific basis if desired (e.g. from 0.1% to 100%).
Practical considerations
We have presented a summary of the feasibility of PS‐MS for on‐site drug checking in this manuscript. It is important to consider that at the time of the study there were legal, ethical and temporal restrictions that did not allow for the collection of demographic data, collection and dissemination of the client response or any behaviour modification made based upon the information they received from the HRW (aside from anecdotal information from the HRWs), or detailed information on the client experience with the technology. Since the time of the study, we have worked to overcome these restrictions and improve upon some of the limitations including quantitation to 100%. We have presented many of the unique strengths of PS‐MS for drug checking above. Implementation of PS‐MS for drug checking beyond this first demonstration should consider the up‐front cost of the equipment (a few $100 000 USD, depending upon the desired instrument configuration), the expertise required in developing the methodology and maintaining the instrumental performance, and the on‐site power/electrical requirements.
Conclusion
The work presented demonstrates the first use of PS‐MS for on‐site, quantitative drug checking at an SCS. This pilot study was conducted over 2 days in August 2019 in the Downtown Eastside of Vancouver, British Columbia, Canada, during which time 113 samples were submitted for analysis. Many existing drug checking technologies currently in use (on‐site or otherwise) have limitations with regards to selectivity, sensitivity, adaptability and/or lengthy analysis times. PS‐MS allows for rapid, selective, sensitive and highly adaptable methods for quantitative drug checking. All existing drug checking technologies use small amounts of sample (e.g. 1 mg), and some are even non‐destructive, suggesting that there is opportunity for many of these techniques to be used in tandem with PS‐MS to develop extremely comprehensive drug testing. Future drug checking services using PS‐MS will implement automated, non‐targeted scan functions to potentially identify new drugs not in the targeted list. PS‐MS is adaptable to portable mass spectrometer systems, for in situ, street level or roadside analysis. The need for drug checking technologies and services is likely to increase in the future as governments consider policy shifts such as drug decriminalisation. PS‐MS has demonstrated utility in the arsenal of drug checking technologies that could be used to help prevent overdoses, and mitigate the social, economic and personal harms that have been amplified in the wake of the ongoing opioid overdose crisis.
Conflict of Interest
The authors have no conflicts of interest.
Supporting information
Table S1. Paper spray mass spectrometry global parameters.
Table S2. Analyte dependant tandem mass spectrometry (MS/MS) ion transition parameters. MS/MS transitions optimized in the lab using direct infusion electrospray ionization.
Table S3. Paper spray mass spectrometry solvent dispense conditions.
Table S4. Mass spectrometry time‐dependent voltage parameters.
Table S5. Tandem mass spectrometry (MS/MS) method settings.
Table S6. Mass spectrometry full scan (Q3) method settings.
Table S7. Medicinal and non‐medicinal ingredients of the over the counter (OTC) composite mixture.
Table S8. Calibration models for the targeted drug list based on target ion MS/MS (1–1000 ng/mL, nine levels, six replicates, internal standard concentration at 100 ng/mL).
Table S9. Limits of detection (LOD), lower limits of quantitation (LLOQ), and limits of reporting (LOR) for targeted drugs.
Table S10. Quantitative results (w/w%) and expected substance for all drug samples tested.
Acknowledgements
This work was supported by the Natural Science and Engineering Research Council of Canada Discovery Grant Program funding (RGPIN‐2016‐05380), Vancouver Island University and the Health Canada Drug Checking Technology Challenge. The authors acknowledge the University of Victoria and Vancouver Island University for their ongoing support of our research and students. Special thanks are extended to Thermo Fisher Scientific for ongoing technical guidance and for providing the instrumentation used for this study. We acknowledge and thank the efforts of the numerous harm reduction workers, staff and PWUD at the Powell Street Getaway who made this study possible. We thank Nicole Esligar and Sam Tobias from the British Columbia Centre on Substance Use and Dr Paul Hasselback (Medical Health Officer, Vancouver Island Health), and the many contributors at Vancouver Coastal Health.
Scott A. Borden BSc, PhD Candidate, Armin Saatchi BSc, MSc Candidate, Gregory W. Vandergrift, PhD Candidate, Jan Palaty PhD, FCACB, Clinical Biochemist, Mark Lysyshyn MD, MPH, FRCPC, Clinical Assistant Professor and Medical Health Officer, Chris G. Gill PhD, PChem, Professor and Co‐Director.
References
- 1. United Nations Office on Drugs and Crime . World Drug Report 2020: Drug Use and Health Consequences. Vienna, Austria: United Nations Publication, Sales No. E.20.XI.6, Vienna, 2020:1–52. [Google Scholar]
- 2. Sun Y, Bao Y, Kosten T, Strang J, Shi J, Lu L. Challenges to opioid use disorders during COVID‐19. Am J Addict 2020;29:174–5. [DOI] [PMC free article] [PubMed] [Google Scholar]
- 3. B.C. Coroners Service , 2021. Illicit drug toxicity deaths in BC January 1, 2010–January 31, 2021, in: Service, B.C. (Ed.). pp. 1–6.
- 4. Longhurst A, McCann E. Political struggles on a frontier of harm reduction drug policy: geographies of constrained policy mobility. Space Polity 2016;20:109–23. [Google Scholar]
- 5. Nadelmann E, LaSalle L. Two steps forward, one step back: current harm reduction policy and politics in the United States. Harm Reduct J 2017;14:37. [DOI] [PMC free article] [PubMed] [Google Scholar]
- 6. O'Keefe D, Ritter A, Stoove M, Hughes C, Dietze P. Harm reduction programs and policy in Australia: barriers and enablers to effective implementation. Sucht 2020;66:33–43. [Google Scholar]
- 7. Sherman S, Green T. Fentanyl overdose reduction checking analysis study (FORECAST). Bloomberg American Health Initiative: Baltimore, 2018. Available at: https://americanhealth.jhu.edu/sites/default/files/inline-files/Fentanyl_Executive_Summary_032018.pdf. [Google Scholar]
- 8. Karamouzian M, Dohoo C, Forsting S, McNeil R, Kerr T, Lysyshyn M. Evaluation of a fentanyl drug checking service for clients of a supervised injection facility, Vancouver, Canada. Harm Reduct J 2018;15:46. [DOI] [PMC free article] [PubMed] [Google Scholar]
- 9. Elkins KM, Weghorst AC, Quinn AA, Acharya S. Colour quantitation for chemical spot tests for a controlled substances presumptive test database. Drug Test Anal 2017;9:306–10. [DOI] [PubMed] [Google Scholar]
- 10. O'Neal CL, Crouch DJ, Fatah AA. Validation of twelve chemical spot tests for the detection of drugs of abuse. Forensic Sci Int 2000;109:189–201. [DOI] [PubMed] [Google Scholar]
- 11. Green TC, Park JN, Gilbert M et al. An assessment of the limits of detection, sensitivity and specificity of three devices for public health‐based drug checking of fentanyl in street‐acquired samples. Int J Drug Policy 2020;77:102661. [DOI] [PubMed] [Google Scholar]
- 12. Harper L, Powell J, Pijl EM. An overview of forensic drug testing methods and their suitability for harm reduction point‐of‐care services. Harm Reduct J 2017;14:52. [DOI] [PMC free article] [PubMed] [Google Scholar]
- 13. Borden SA, Saatchi A, Krogh ET, Gill CG. Rapid and quantitative determination of fentanyls and pharmaceuticals from powdered drug samples by paper spray mass spectrometry. Anal Sci Adv 2020;1:97–108. [DOI] [PMC free article] [PubMed] [Google Scholar]
- 14. Vandergrift GW, Gill CG. Paper spray mass spectrometry: a new drug checking tool for harm reduction in the opioid overdose crisis. J Mass Spectrom 2019;54:729–37. [DOI] [PubMed] [Google Scholar]
- 15. Liu J, Wang H, Manicke NE, Lin J‐M, Cooks RG, Ouyang Z. Development, characterization, and application of paper spray ionization. Anal Chem 2010;82:2463–71. [DOI] [PubMed] [Google Scholar]
- 16. Espy RD, Muliadi AR, Ouyang Z, Cooks RG. Spray mechanism in paper spray ionization. Int J Mass Spectrom 2012;325:167–71. [Google Scholar]
- 17. Espy RD, Teunissen SF, Manicke NE et al. Paper spray and extraction spray mass spectrometry for the direct and simultaneous quantification of eight drugs of abuse in whole blood. Anal Chem 2014;86:7712–8. [DOI] [PubMed] [Google Scholar]
- 18. Teunissen SF, Fedick PW, Berendsen BJ et al. Novel selectivity‐based forensic toxicological validation of a paper spray mass spectrometry method for the quantitative determination of eight amphetamines in whole blood. J Am Soc Mass Spectrom 2017;28:2665–76. [DOI] [PubMed] [Google Scholar]
- 19. Kennedy JH, Palaty J, Gill CG, Wiseman JM. Rapid analysis of fentanyls and other novel psychoactive substances (NPS) in substance use disorder patient urine using paper spray mass spectrometry. Rapid Commun Mass Spectrom 2018;32:1280–6. [DOI] [PubMed] [Google Scholar]
- 20. Michely JA, Meyer MR, Maurer HH. Paper spray ionization coupled to high resolution tandem mass spectrometry for comprehensive urine drug testing in comparison to liquid chromatography‐coupled techniques after urine precipitation or dried urine spot workup. Anal Chem 2017;89:11779–86. [DOI] [PubMed] [Google Scholar]
- 21. Jhang CS, Lee H, He YS, Liu JT, Lin CH. Rapid screening and determination of 4‐chloroamphetamine in saliva by paper spray‐mass spectrometry and capillary electrophoresis‐mass spectrometry. Electrophoresis 2012;33:3073–8. [DOI] [PubMed] [Google Scholar]
- 22. Vandergrift GW, Hessels AJ, Palaty J, Krogh ET, Gill CG. Paper spray mass spectrometry for the direct, semi‐quantitative measurement of fentanyl and norfentanyl in complex matrices. Clin Biochem 2018;54:106–11. [DOI] [PubMed] [Google Scholar]
- 23. de Paula CCA, Lordeiro RA, Piccin E, Augusti R. Paper spray mass spectrometry applied to the detection of cocaine in simulated samples. Anal Methods 2015;7:9145–9. [Google Scholar]
- 24. Tyndall M. Perspectives on the drug overdose crisis in BC. Vancouver, British Columbia: British Columbia Medical Association, 2017. Available at: https://bcmj.org/bccdc/perspectives-drug-overdose-crisis-bc. [Google Scholar]
- 25. Tupper KW, McCrae K, Garber I, Lysyshyn M, Wood E. Initial results of a drug checking pilot program to detect fentanyl adulteration in a Canadian setting. Drug Alcohol Depend 2018;190:242–5. [DOI] [PubMed] [Google Scholar]
- 26. Payer D, Young M, Maloney‐Hall B, Mill C, Leclerc P, Buxton J. Adulterants, contaminants and co‐occurring substances in drugs on the illegal market in Canada: an analysis of data from drug seizures, drug checking and urine toxicology. The Canadian community epidemiology network on drug use, & the National Drug Checking Working Group. Canadian Centre on Substance Use and Addiction: Ottawa, Ontario, 2020. [Google Scholar]
- 27. Saltman J. ‘Staggering amount of fentanyl’ drug bust lands Richmond man in prison Vancouver: Vancouver Sun; Vancouver, British Columbia: The Pacific Newspaper Group; 2019. Available at: https://vancouversun.com/news/local-news/staggering-amount-of-fentanyl-drug-bust-lands-richmond-man-in-prison. [Google Scholar]
- 28. Goggin MM, Nguyen A, Janis GC. Identification of unique metabolites of the designer opioid furanyl fentanyl. J Anal Toxicol 2017;41:367–75. [DOI] [PubMed] [Google Scholar]
- 29. Martucci HF, Ingle EA, Hunter MD, Rodda LN. Distribution of furanyl fentanyl and 4‐ANPP in an accidental acute death: a case report. Forensic Sci Int 2018;283:e13–e7. [DOI] [PubMed] [Google Scholar]
- 30. Casale JF, Hays PA, Toske SG, Mallette JR. Unique bipiperidinyl impurities produced from the “one‐pot” synthesis of fentanyl. Forensic Chem 2020;17:100203. [Google Scholar]
- 31. Schueler HE. Emerging synthetic fentanyl analogs. Acad Forensic Pathol 2017;7:36–40. [DOI] [PMC free article] [PubMed] [Google Scholar]
- 32. Nielsen S, McAuley A. Etizolam: a rapid review on pharmacology, non‐medical use and harms. Drug Alcohol Rev 2020;39:330–6. [DOI] [PubMed] [Google Scholar]
- 33. Clark AK, Wilder CM, Winstanley EL. A systematic review of community opioid overdose prevention and naloxone distribution programs. J Addict Med 2014;8:153–63. [DOI] [PubMed] [Google Scholar]
- 34. Brar R, Grant C, DeBeck K et al. Changes in drug use behaviors coinciding with the emergence of illicit fentanyl among people who use drugs in Vancouver, Canada. Am J Drug Alcohol Abuse 2020;46:625–31. [DOI] [PMC free article] [PubMed] [Google Scholar]
- 35. Zawilska JB. An expanding world of novel psychoactive substances: opioids. Front Psych 2017;8:110. [DOI] [PMC free article] [PubMed] [Google Scholar]
- 36. Burns SM, Cunningham CW, Mercer SL. DARK classics in chemical neuroscience: fentanyl. ACS Chem Nerosci 2018;9:2428–37. [DOI] [PubMed] [Google Scholar]
- 37. Government of Canada . Controlled Drugs and Substances Act, S.C. 1996, c. 19.
- 38. Daniulaityte R, Carlson RR, Juhascik MP, Strayer KE, Sizemore IE. Street fentanyl use: experiences, preferences, and concordance between self‐reports and urine toxicology. Int J Drug Policy 2019;71:3–9. [DOI] [PMC free article] [PubMed] [Google Scholar]
- 39. Kim HK, Nelson LS. Reducing the harm of opioid overdose with the safe use of naloxone: a pharmacologic review. Expert Opin Drug Saf 2015;14:1137–46. [DOI] [PubMed] [Google Scholar]
- 40. Borden SA, Palaty J, Termopoli V et al. Mass spectrometry analysis of drugs of abuse: challenges and emerging strategies. Mass Spectrom Rev 2020;5:703–44. [DOI] [PubMed] [Google Scholar]
- 41. Palaty J, Konforte D, Karakosta T, Wong E, Stefan C. Rapid identification of cyclopropyl fentanyl/crotonyl fentanyl in clinical urine specimens: a case study of clinical laboratory collaboration in Canada. Clin Biochem 2018;53:164–7. [DOI] [PubMed] [Google Scholar]
Associated Data
This section collects any data citations, data availability statements, or supplementary materials included in this article.
Supplementary Materials
Table S1. Paper spray mass spectrometry global parameters.
Table S2. Analyte dependant tandem mass spectrometry (MS/MS) ion transition parameters. MS/MS transitions optimized in the lab using direct infusion electrospray ionization.
Table S3. Paper spray mass spectrometry solvent dispense conditions.
Table S4. Mass spectrometry time‐dependent voltage parameters.
Table S5. Tandem mass spectrometry (MS/MS) method settings.
Table S6. Mass spectrometry full scan (Q3) method settings.
Table S7. Medicinal and non‐medicinal ingredients of the over the counter (OTC) composite mixture.
Table S8. Calibration models for the targeted drug list based on target ion MS/MS (1–1000 ng/mL, nine levels, six replicates, internal standard concentration at 100 ng/mL).
Table S9. Limits of detection (LOD), lower limits of quantitation (LLOQ), and limits of reporting (LOR) for targeted drugs.
Table S10. Quantitative results (w/w%) and expected substance for all drug samples tested.