

Abstract
When performing a systematic review, researchers screen the articles retrieved after a broad search strategy one by one, which is time‐consuming. Computerised support of this screening process has been applied with varying success. This is partly due to the dependency on large amounts of data to develop models that predict inclusion. In this paper, we present an approach to choose which data to use in model training and compare it with established approaches. We used a dataset of 50 Cochrane diagnostic test accuracy reviews, and each was used as a target review. From the remaining 49 reviews, we selected those that most closely resembled the target review's clinical topic using the cosine similarity metric. Included and excluded studies from these selected reviews were then used to develop our prediction models. The performance of models trained on the selected reviews was compared against models trained on studies from all available reviews. The prediction models performed best with a larger number of reviews in the training set and on target reviews that had a research subject similar to other reviews in the dataset. Our approach using cosine similarity may reduce computational costs for model training and the duration of the screening process.
Keywords: cosine similarity, computerised support, machine learning, screening automation, training sample selection
1. INTRODUCTION
Even for an experienced review team a single systematic review can take between 6 months and several years. 1 , 2 Approximately half of this time is spent on developing the research protocol, performing the search, and assessing the results. 3 Therefore, reducing the time spent on these tasks has a big impact on the efficiency of the review process. 2
Within the medical field, diagnostic test accuracy (DTA) studies often do not follow a standard design and are generally poorly reported. 4 Therefore, search strategies cannot depend on design descriptors or commonly reported terminology. Complex and broad literature searches are needed, resulting in a high number of documents needing screening to find relevant studies. This leads to a relatively large part of the review‐time being spent on screening and selection. 5 , 6
Machine learning methods can aid the screening process through ranking or classification of relevant documents. 7 Generally, there are two types of machine learning; supervised and unsupervised. Supervised methods use data that have been manually labelled as being relevant or not. Unsupervised methods learn from trends in unlabelled data. Both types have been applied before in systematic reviews with varying levels of success (see, e.g., Cohen et al. 8 , 9 , 10 ). In this study, we focus on a supervised method that needs a training set of labelled data. This method can only be applied under the assumption that the labelled training data share ‘transferable knowledge’ with the unlabelled data on which it is tested. 11 In the case of systematic reviews, transferable knowledge may refer to, for example, the clinical topic or patient population being similar in the relevant studies in the training set and in the relevant studies that the model aims to select.
Typically, as much data as possible is used when building machine learning models, because more examples used during training will usually yield a more robust* model. However, because systematic reviews focus on a specific research question, the question arises whether using all available training data indeed results in optimal model robustness. After all, when considering which data to use for a review about Alzheimer, another review about Alzheimer might provide a better training set than a review about cancer. Therefore, excluding the review about cancer from the training data might improve the model's robustness because the remaining training data is less diluted.
In this study, we use a set of 50 DTA reviews and simulated the screening process for each of those reviews as a target review (i.e., the review for which a model is built). The remaining 49 reviews were used to build the model using three different approaches to select the training data. The first and novel approach used a similarity metric to select a subset of reviews similar to the target review. The second approach used all 49 reviews as a training set. The third approach randomly selected a training set. The models trained with these three approaches were tested on each target review and the resulting performance was compared. We hypothesise that creating a training set specifically for the target review will yield a better prediction performance, because the transferable knowledge is not diluted by non‐relevant training data.
2. DATA PREPARATION
In this study, we used the dataset provided by the 2017 CLEF eHealth Lab ‘Technologically Assisted Reviews in Empirical Medicine Overview’. 12 This dataset consisted of 50 DTA reviews published in the Cochrane Library and contained the following information about each review: its unique identifier (in the form of CD0XXXXX), review title, the search query, and the search results (PubMed IDs of all found documents). Also, for each search result there were two labels indicating whether: (1) it was included in the systematic review after screening the title and abstract of the document, and (2) it was included after reading the full text of the document. We used the latter because they represent the inclusions that need to be found after the review process is completed.
Data gathering. The dataset was cleaned by the organisers of the lab, and limited to search results available through the PubMed search engine. The Entrez Programming Utilities API 13 was used to retrieve data about the search results based on their PubMed ID. In total, we retrieved 266,966 documents using the efetch function of the Entrez API. We used all documents regardless of whether they were inclusions or not. For each document, if available, we stored the following data in a local database: review identifier, document title, document abstract, publication date, publication type, DOI, journal, journal ISSN, journal ISO, inclusion label, and PubMed ID.
Text preprocessing. The title and abstract of all in‐ and excluded studies were used to build the prediction models. We cleaned the text so that it contained only unaccented alphabetical letters. We removed: HTML tags,† special characters (e.g., &, %), and numbers. Stopwords (e.g., the, what, was) were removed using the english list from the NLTK Python library. 14 Lastly, the documents were split into separate words and any short ( characters) or long ( characters) words were removed, as they were unlikely to be real words, or words that distinguish the topic of a review. The Python code implementation is available at van Altena. 15
The characteristics of our dataset after preprocessing are shown in Table 1. Reviews had an average of 5339 documents with on average 93 inclusions. The smallest review had 64 documents and the largest 43,363. The review with the fewest inclusions contained two inclusions, while the largest number of inclusions was 619. This resulted in a mean inclusion rate of 4% with a minimum of 0.015% (2 on a total of 12,705) and a maximum of 20% (23 on a total of 114). For an overview of all the metadata collected per review, see van Altena. 16
TABLE 1.
Document characteristics after cleaning
| Number of DTA reviews | 50 |
| Total number of documents | 266,966 |
| Included documents | 4661 |
| # Words per document a | 922 [0–9795] |
| # Unique words per document a | 70 [9–529] |
| Per review | |
| # Documents a | 5339 [64–43,363] |
| # Included documents a | 93 [2–619] |
| % Included documents a | 4% [%‐20%] |
| Missing abstracts | |
| # All documents | 45,033 (17%) |
| # Included documents | 359 (7%) |
Mean [minimum‐maximum].
Abstracts were missing for 45,033 documents (17%). Table 2 shows the characteristics of these documents. They were kept in the dataset nevertheless, because 359 of them were inclusions.
TABLE 2.
Reasons for missing abstract
| All | Inclusions | |
|---|---|---|
| Foreign language | 16,075 | 81 |
| Before 1975 | 14,721 | 24 |
| Not journal article | 23,368 | 142 |
Note: Three major characteristics were found: (1) the document was written in a foreign language and not available in English, (2) the document was published before (approximately) 1975 and was not digitally available, and (3) the document was not a primary research publication (e.g., comment, case report, etc.). Note that there was overlap between the characteristics, as an document might both be written in a foreign language and be published before 1975.
Review metadata enrichment. DTA review questions are usually constructed according to three elements, describing the people suspected of the disease (Patients, P); the diagnostic tests that were evaluated in the review (Index test(s), I); and a definition of the disease (Target condition, T). 17 Of these elements, the target condition (T) can be mapped to a standardised system and was therefore added to the review dataset. In preparation, one of the authors (A.J.V.A.) read the abstracts of the 50 reviews and identified the International Classification of Diseases, 10th revision, (ICD‐10) code for the target condition using the ICD‐10 browser. 18 Each review was assigned the best fitting code suggested by the auto‐complete function of the ICD‐10 browser. If more than one code was available, both codes were assigned. Together with another author (M.M.G.L.) the codes were reviewed. Codes were adjusted if both authors agreed that the resulting code would better reflect the research topic of the review at hand.
We categorised diseases into disease groups using the first letter of the ICD‐10 code. Twelve reviews could not be grouped based on disease codes, so we created a catch‐all group coined ‘other’. A total of eight groups were identified, with Alzheimer (G) and dementia (F) combined as one group (see Table 3). Table 4 shows the metadata collected for each review, including the disease group of the review question.
TABLE 3.
Review groups according to disease (target condition)
| Group | # Reviews | ICD‐10 | Disease |
|---|---|---|---|
| 1 | 2 | A | Tuberculosis |
| 2 | 4 | B | Parasitic |
| 3 | 8 | C | Cancer |
| 4 | 12 | G and F | Dementia and Alzheimer |
| 5 | 4 | K | Liver |
| 6 | 5 | M | Musculoskeletal system |
| 7 | 3 | Q | Down syndrome |
| 8 (other) | 12 | ‐ | Various |
TABLE 4.
Metadata collected for each review [Colour table can be viewed at wileyonlinelibrary.com]
| Identifier | # docs. | # incl. | ICD‐10 | Secondary ICD‐10 | Disease group |
|---|---|---|---|---|---|
| CD007394 | 2545 | 95 | B44.0 | 2 | |
| CD007427 | 1521 | 123 | M75.4 | 6 | |
| CD007431 | 2074 | 24 | M54.3 | M54.5 | 6 |
| CD008054 | 3217 | 274 | N87.9 | Other | |
| CD008081 | 970 | 26 | H35.81 | E14.3 | Other |
| CD008643 | 15083 | 11 | S32.001A | M54.5 | 6 |
| CD008686 | 3966 | 7 | M53.9 | M54.5 | 6 |
| CD008691 | 1316 | 73 | I25.10 | Z94 | Other |
| CD008760 | 64 | 12 | I85 | Other | |
| CD008782 | 10507 | 45 | G30 | F06.7 | 4 |
| CD008803 | 5220 | 99 | H44.51 | Other | |
| CD009020 | 1584 | 162 | M75.101 | M25.5 | 6 |
| CD009135 | 791 | 77 | B55.0 | 2 | |
| CD009185 | 1615 | 92 | N10 | Other | |
| CD009323 | 3881 | 122 | C25.9 | C24.1 | 3 |
| CD009372 | 2248 | 25 | I61.9 | Other | |
| CD009519 | 5971 | 104 | C34.90 | C80 | 3 |
| CD009551 | 1911 | 46 | B44.0 | 2 | |
| CD009579 | 6455 | 138 | B65 | 2 | |
| CD009591 | 7991 | 144 | N80 | Other | |
| CD009593 | 14922 | 78 | A15.3 | U84.9 | 1 |
| CD009647 | 2785 | 56 | E86 | Other | |
| CD009786 | 2065 | 10 | C56 | C80 | 3 |
| CD009925 | 6531 | 460 | Q90.2 | 7 | |
| CD009944 | 1181 | 117 | C16.9 | C80 | 3 |
| CD010023 | 981 | 52 | S92.2 | Other | |
| CD010173 | 5495 | 23 | C06.9 | C80 | 3 |
| CD010276 | 5495 | 54 | C06.9 | C80 | 3 |
| CD010339 | 12807 | 114 | K80 | 5 | |
| CD010386 | 625 | 2 | F03 | F06.7 | 4 |
| CD010409 | 43363 | 76 | C51 | C77.4 | 3 |
| CD010438 | 3250 | 39 | D68.9 | T14.9 | Other |
| CD010542 | 348 | 20 | K70 | 5 | |
| CD010632 | 1504 | 32 | F03 | F06.7 | 4 |
| CD010633 | 1573 | 4 | G31.8 | F02.8 | 4 |
| CD010653 | 8002 | 45 | F20 | 4 | |
| CD010705 | 114 | 23 | A15.3 | U84.9 | 1 |
| CD010771 | 322 | 48 | F03 | 4 | |
| CD010772 | 316 | 47 | F03 | 4 | |
| CD010775 | 241 | 11 | G30 | F03 | 4 |
| CD010783 | 10905 | 30 | G30 | F03 | 4 |
| CD010860 | 94 | 7 | G30 | F03 | 4 |
| CD010896 | 169 | 6 | G31.0 | F03 | 4 |
| CD011134 | 1953 | 215 | C18 | C80 | 3 |
| CD011145 | 10872 | 202 | F03 | 4 | |
| CD011548 | 12708 | 113 | K80 | 5 | |
| CD011549 | 12705 | 2 | K80 | 5 | |
| CD011975 | 8201 | 619 | Q90.2 | 7 | |
| CD011984 | 8192 | 454 | Q90.2 | 7 | |
| CD012019 | 10317 | 3 | N80 | Other |
Note: Colours are added to highlight disease groups.
3. METHODS
3.1. Prediction models
A plethora of feature extraction and classification methods was available. We selected representatives of approaches often used in related literature. 7 , 12
Feature extraction. The input that a prediction model is trained on is called the features. To extract these features from the gathered data, we chose the term frequency (TF) because of its simplicity. Document frequency weighting was added to the term frequency matrix (TF‐IDF) to adjust for words that generally occur more frequently in texts.
Classifiers. We chose a Random Forest classifier because it is relatively simple and is much used in systematic review prediction applications. 12 The classifier was implemented using the RandomForestClassifier method from the scikit‐learn library. 19
Each classifier method has a set of parameters that need to be determined before training on a dataset. The Random Forest classifier has parameters for the shape of the trees that will be generated, for example, the maximum depth of one branch on the tree. Parameters have a different optimum for each dataset. To find these optimal values we used grid search, a technique where a range of values is tested with a small portion of the training set. Performance of the resulting models is measured and the parameter settings of the best model are retained to train the model on the complete training set.
First, only a subset of all possible value combinations is tried in a random search. The ranges for the parameters are very wide to find the specific value range where the prediction model approaches its optimal state. Results of the random search were inspected and a smaller set of parameter values was chosen for the full grid search. In the full search, all parameter values are tested and only the model with the highest performance is retained. Final prediction models were trained using a full grid search for each systematic review. A detailed description of the selection process can be found in Appendix S2.
3.2. Model performance metric
Using the predict_proba function from the sklearn library, the predicted probability of being an inclusion was retrieved for each document in the target review. The reading order of documents was determined by sorting the predicted probability from highest to lowest. Models were judged on their ability of ordering the documents such that inclusions would be encountered earlier during the screening process. This reduced the number of documents needed to be read during the screening process, thus saving work and time.
This concept of performance is captured in the metric ‘Work Saved over Sampling’ (WSS), introduced by Cohen et al.. 8 For a specified level of recall,‡ WSS measures the fraction of documents that a review author does not need to read as a result of the ranking, as compared to a random ordering. WSS is calculated as follows:
| (1) |
where TN and FN are the number of true and false negatives respectively, is the total number of documents, and is the level of recall. Recall is defined as:
| (2) |
where TP is the number of true positives.
We adopted the commonly used WSS at a recall level of 95% (WSS@95), which is defined as follows by 8 , 12 :
| (3) |
WSS@95 ranges between 0.95 and −0.05. Respectively, indicating a perfect classification or a poor classification where all documents have been labelled as inclusion and .
3.3. Similarity metric
The similarity between the potential training data and the target review was measured using titles and abstracts. In our study, the documents were mathematically represented as a vector from the TF‐IDF matrix, so we adopted the cosine similarity metric, 20 which is designed for vectorial representations of documents.
Cosine similarity measures the cosine of the angle between two vectors of an inner product space, 21 being defined as follows by Huang et al. 20 :
| (4) |
where is a vector representation of a text document (i.e., a single row of the TF‐IDF matrix). The inner product space is calculated as:
| (5) |
where is the length of the document vectors. Similarity ranges from 0 (not similar, vectors are at an angle of ) to 1 (perfectly similar, vectors are at an angle of ). Because the word counts of the TF‐IDF matrix cannot be negative, similarity cannot be negative either. Note that Equation (4) may look similar to bivariate correlations such as the Pearson correlation.
We were interested in the similarity between reviews, and not between individual documents in these reviews. We therefore calculated the similarity based on the mean feature vector for all documents in each review :
| (6) |
where is the feature vector for document from review , and is the number of documents in review . The similarity between all pairs of reviews is then defined as:
| (7) |
where and are the mean review vectors for, respectively, reviews and . Cosine similarity was calculated between all pairs of reviews ( in total).
3.4. Workflow
We refer to the approaches used in this study as SIMILAR, ALL, and RANDOM. The SIMILAR approach used a similarity metric to select documents for the training set. Training sets were constructed by using the documents from the reviews most similar to the target review.§ The ALL approach used all of the remaining 49 reviews as the training set. And lastly, the RANDOM approach selected random reviews.
The SIMILAR approach was compared with the ALL and RANDOM approaches. ALL was chosen because it is the standard in machine learning, following the rule of thumb that more data equals better models. RANDOM was added as a control.
As described above, prediction models were trained using a Random Forest classifier and the features from the TF‐IDF matrix. The models were used to rank the test set (i.e., the documents from the target review) and the WSS@95 was calculated. We repeated this process five times to account for model training variability. For all three approaches, each of the 50 DTA reviews were used as test set once. This would train 1000 models each for the SIMILAR and RANDOM approaches (i.e., 50 reviews × 4 training set sizes × 5 repeats = 1000), and 250 models for the ALL approach (i.e., ). The workflow is shown in Figure 1.
FIGURE 1.
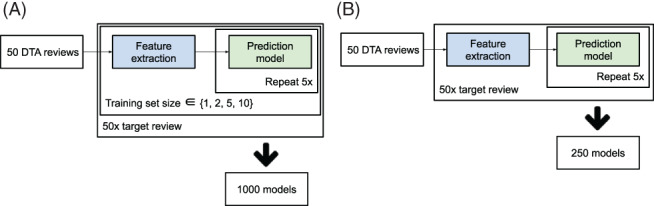
Overview of workflow for the approaches using different training data: (a) similar data (SIMILAR) and random data (RANDOM), and (b) all data (ALL). Feature extraction was implemented using TF‐IDF (term frequency inverse document frequency). The prediction model was implemented using the Random Forest classifier [Colour figure can be viewed at wileyonlinelibrary.com]
Analysis. Performance of the SIMILAR, ALL, and RANDOM approaches were analysed using boxplots. Statistical significance of the results was analysed using a Wilcoxon rank sum test. The Wilcoxon test was executed for each pair of training set sizes. Resulting P‐values were adjusted for multiple testing using the Bonferroni method. The significance tests were implemented using the stats.ranksums function from the SciPy package 22 and the stats.multitest.multipletests function from the statsmodels package, 23 respectively. Additionally, the same analysis was applied to the performance results after stratification into disease groups: 1–7 and ‘other’.
Lastly, we analysed the correlation between model performance and cosine similarity. To determine the correlation, we first retrieved the mean WSS@95 and mean cosine similarity per review for each training set size used in the SIMILAR approach (). Then, the corr function of the Pandas package was used to calculate the correlation. 24
4. RESULTS
Approach comparison. The overall prediction performance results obtained in the SIMILAR, ALL, and RANDOM approaches are shown in Figure 2. The SIMILAR and ALL results indicate that on average the best performance is obtained when all training data are used. The ALL significantly outperforms SIMILAR for all training set sizes. Furthermore, the median performance in the SIMILAR approach is higher for larger training sets (Table 5).
FIGURE 2.
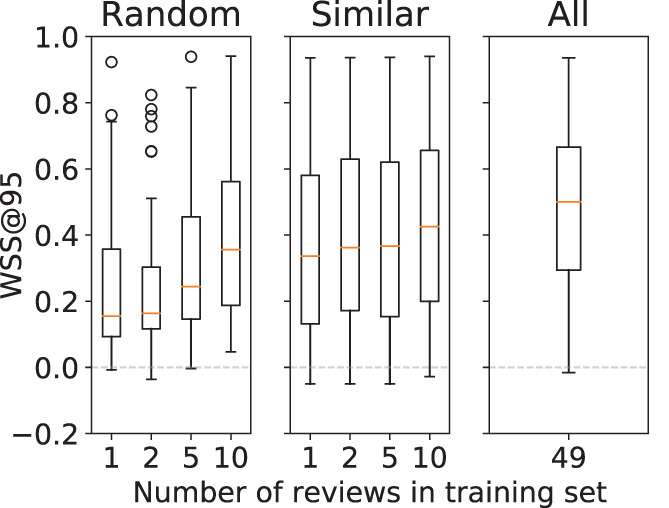
Boxplot of model performance stratified by the training set size. Performance is shown separately for the RANDOM, SIMILAR, and ALL approaches [Colour figure can be viewed at wileyonlinelibrary.com]
TABLE 5.
P‐values for SIMILAR versus ALL performance and SIMILAR versus RANDOM performance
| SIMILAR | ALL | RAND | |||
|---|---|---|---|---|---|
| 49 () | 1 () | 2 () | 5 () | 10 () | |
| 1 () | <0.001* | 0.03* | |||
| 2 () | <0.001* | <0.01* | |||
| 5 () | <0.001* | 0.66 | |||
| 10 () | 0.05* | 1.00 | |||
Note: SIMILAR is stratified by the training set size. is the median WSS@95 performance over all models.
P‐value is significant.
With smaller training sets () the models from the SIMILAR approach outperform those from the RANDOM approach. However, the difference in performance for the training sets with size 5 and 10 is not statistically significant, see Table 5.
Influence of the ‘other’ disease group on performance. Figure 3 presents the overall performance results obtained for all training set sizes () stratified by disease group. The stratified results show that in general the prediction performance is higher for reviews that belong to a disease group, as opposed to those that do not. The difference in performance is significant over all training set sizes as seen in Table 6.
FIGURE 3.
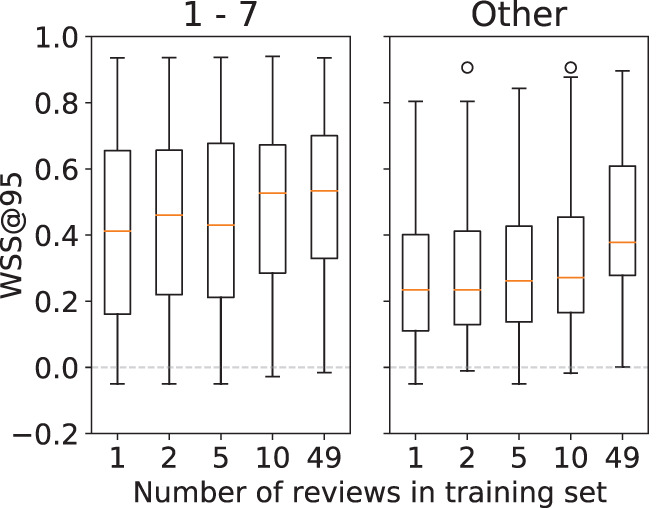
Boxplot of SIMILAR performance stratified by the training set size. The results are shown for groups 1–7 and other [Colour figure can be viewed at wileyonlinelibrary.com]
TABLE 6.
P‐values for other versus disease groups 1–7 performance, both are stratified by the training set size
| Groups 1–7 | Other | ||||
|---|---|---|---|---|---|
| 1 () | 2 () | 5 () | 10 () | 49 () | |
| 1 () | 0.009 | ||||
| 2 () | <0.001 | ||||
| 5 () | 0.005 | ||||
| 10 () | 0.002 | ||||
| 49 () | 0.038 | ||||
Note: All P‐values are significant. is the median WSS@95 performance over all models.
Correlation between cosine similarity and performance. Results for the correlation analysis are shown in Table 7. The values in the diagonal show that a moderate correlation (0.32–0.47) exists between the performance of a review and its similarity to the training set.
TABLE 7.
Pearson correlation between the performance and cosine similarity for each training set size in the SIMILAR approach
| Performance | Similarity | |||
|---|---|---|---|---|
| 1 | 2 | 5 | 10 | |
| 1 | 0.40 | |||
| 2 | 0.47 | |||
| 5 | 0.36 | |||
| 10 | 0.32 | |||
5. DISCUSSION
In this study, we investigated whether computerised support of the systematic review screening process could be improved. Our hypothesis was that a smaller, but more focused training set would improve performance. We assessed the use of cosine similarity for selecting data for the training set and compared the classification performance of this approach to approaches using all available data and randomly selected data.
Approach comparison. Analysis of the SIMILAR and ALL approaches shows that, when considering all 50 reviews in our dataset, the best performance is obtained when all training data are used. This rejects our hypothesis that a more targeted training set is beneficial for prediction. However, when reviews in the ‘other’ group are considered separately from those in disease groups 1–7, we observe that they perform significantly worse at any training set size or approach. This indicates that a training set with topically similar reviews is crucial for prediction model performance.
When review authors start a new systematic review, they may not have a large training set with many previously undertaken systematic reviews at hand. Our findings indicate that, in these situations, it may be worthwhile to gather a training set based on a few systematic reviews on a similar topic. Reviewers who develop many systematic reviews, for example within a guideline committee or a review‐developing enterprise, may want to invest into creating a repository of past reviews to use as a training set. The extra investment to select related reviews for a training set can thus be prevented.
The size of the training set is a major factor in the computational cost of a machine learning method (see Appendix S5 for a comparison between two training set sizes). Building a prediction model is much faster for smaller training sets. However, a comparison of the SIMILAR and RANDOM approaches shows that careful selection is important for classification performance. Note that the median performance of the SIMILAR approach is higher than the RANDOM performance, especially when smaller training sets were used. Furthermore, a moderate correlation was found between performance and cosine similarity. A greater correlation between performance and similarity means that similarity is selecting useful samples from the dataset for training. From this, we conclude that, given a target review, cosine similarity can indeed identify transferable knowledge in the available data. For computerised support developers the proposed SIMILAR approach may be useful to reduce the training set size in settings where plenty of data is available and training on all data is infeasible.
The models always performed well for some reviews, regardless of the size of the training set, while for other reviews the models always performed poorly. Note that this is the reason that the performance boxplots (shown in Figure 3) cover nearly the whole possible range for the WSS@95 metric. Although other researchers hypothesised that this may be due to the number of included studies in a review, our additional analysis (Appendix S4) did not reveal a clear explanation for this effect.
Reproducibility. Reproducibility of methods is often problematic in systematic review automation literature because the proposed methods are difficult to reproduce and compare. 7 , 25 We attempted to mitigate this problem by using relatively simple methods and a publicly available dataset. The dataset was provided in the 2017 CLEF eHealth Lab 12 and is curated such that it was available through PubMed using automated methods. We also provide the complete repository of code that was used to train the models and analyse the results in van Altena. 15
Limitations. Because the dataset has a relatively small number of inclusions, a missing abstract on an inclusion has a relatively large influence on the model's performance (data shown in Appendix S4). Most are not available at all and cannot be added manually. On the other hand, using the dataset ‘as is’ enabled us to consider all 50 reviews in the CLEF dataset.
Another limitation of our study is that we only had titles and abstracts available for the similarity metric. We assume that most of the relevant information of each document is represented in their title and abstract, but it is possible that complex concepts were only expressed in the full text. Unfortunately, full‐text data for all documents in the CLEF dataset are not available through PubMed in an automated way. The techniques that would enable collection of full‐text documents and analysis of the influence of full‐text documents on prediction performance are issues for further research.
The disease group is not the only potentially transferable knowledge among DTA reviews, as it refers only to the ‘Target condition’ aspect of the PIT. The ‘Patients’ and ‘Index test’ aspects remain unexplored in this study. Further analysis of these aspects might therefore identify a different set of reviews in the ‘other’ group. Nevertheless, because cosine similarity takes all words in the documents into account, we hypothesise that it also captures the P and I aspects. Further research is needed to test this hypothesis and to adapt or extend the similarity metric to further increase its ability to detect transferable knowledge.
5.1. Other approaches
Although our approach for selecting training samples is novel, training sample selection itself is not a new idea in machine learning. There are numerous examples that attempt to enrich, balance, or create datasets in other domains. The techniques proposed in these papers often stem from the same type of problems: there is little to no data to train or the available data are noisy or unbalanced. Below we compare our approach with some of these other training sample selection approaches.
Cohen et al. 26 conclude that a topically similar training set almost always outperforms a set that is not. However, they also note that finding topically similar data for training is impractical. Our work, however, offers a practical approach to identify relevant training data through cosine similarity.
An example of enriching a training set for natural language models is shown by Moore et al.. 27 They showed that curating the data and selecting only those samples that improve the classifier increases the performance of the final language model. This approach is similar to ours, as we used cosine similarity to select only those reviews that are similar to the target review. In both approaches, less training data are used to improve the classifier performance.
Imbalanced datasets, where the negative examples in the dataset massively outweigh the positive examples or vice versa, are often challenging in machine learning. Unlike, for example, the Random Forest classifier used in this study, there are many classifiers that cannot handle unbalanced datasets and yield a bad prediction. Nowadays there are many techniques that address unbalanced datasets. An example is shown in Kubat et al.. 28 They present a simple technique that only removes negative examples while preserving all the positive examples in the dataset. This preservation is important for systematic reviews because generally they have very few positive documents (i.e., inclusions). In this paper, we did not apply such a sample selection technique, however for further research it might be interesting to combine the proposed training set selection based on cosine similarity with a technique that tackles dataset imbalance.
Lastly, instead of selection of samples we could also choose to make a sub‐selection of the features that are extracted. The data used as input to the machine learning method are represented as a matrix with one sample per row and one column per feature. In the case of systematic reviews, we have documents with words. The feature matrix therefore has one row per document and one word per column, and each cell contains the occurrence of a word in a document. The sample selection techniques discussed above will remove rows from this matrix whereas feature selection removes columns. As discussed in Adeva et al., 29 feature selection reduces the training set size and condenses the important features which has a beneficial effect on the prediction model. Even though feature selection might have increased the overall performance of the prediction models, we chose not to apply it, which made it possible to focus on training set selection.
6. CONCLUSION
We have shown that cosine similarity can be used to select a training set that is relatively similar to the articles one aims to screen for. We have also shown that using all available data outperforms a dataset containing data selected using cosine similarity. Nevertheless, in cases where reviews on a similar topic are available, good prediction performance can be achieved with significantly smaller training sets.
For systematic reviewers it might be worthwhile to gather a few previously undertaken systematic reviews on a similar topic when applying computerised support to the screening of a new systematic review. However, when a large set of systematic reviews is available the extra investment to make a selection can be avoided.
The approach proposed in this work is meant to improve future tools that provide computerised support for systematic reviewers. Further research may investigate the benefits of our approach in a practical setting.
CONFLICT OF INTEREST
The author reported no conflict of interest.
AUTHOR CONTRIBUTIONS
A.J. van Altena and S.D. Olabarriaga conceived of the presented idea. The experiments were developed by all authors. A.J. van Altena carried out the experiments. A.J. van Altena wrote the manuscript with support from M.M.G. Leeflang, R. Spijker, and S.D. Olabarriaga. S.D. Olabarriaga supervised the project.
Supporting information
Appendix S1: Supporting information
ACKNOWLEDGEMENTS
This work was carried out on the High Performance Computing Cloud resources of the Dutch national e‐infrastructure with the support of the SURF Foundation. We like to thank A. H. Zwinderman and P. D. Moerland for their support designing the methodology, and B. D. Yang and M. Borgers for proofreading the manuscript.
van Altena AJ, Spijker R, Leeflang MMG, Olabarriaga SD. Training sample selection: Impact on screening automation in diagnostic test accuracy reviews. Res Syn Meth. 2021;12(6):831‐841. doi: 10.1002/jrsm.1518
Endnotes
A model performs better when it is robust, that is, it is able to accurately label most, if not all, cases that it has not seen before.
PubMed data may contain the following tags: <i>, <u>, <b>, <sup>, and <sub>.
That is, the fraction of correctly identified inclusions, in statistics the term ‘sensitivity’ is used.
A maximum of 10 similar reviews was chosen after analysing preliminary data on cosine similarity scores. We observed that reviews are mostly similar to just a few other reviews. Similarity rapidly drops and at the review similarity is mostly equal. Data are shown in Appendix S3.
DATA AVAILABILITY STATEMENT
Data sharing is not applicable to this article as no new data were created or analyzed in this study.
REFERENCES
- 1. The Cochrane Collaboration: Cochrane Handbook for Systematic Reviews of Interventions. 51st edition; 2011. http://www.cochrane.org/training/cochrane-handbook
- 2. Tsafnat G, Glasziou P, Choong MK, Dunn A, Galgani F, Coiera E. Systematic review automation technologies. Syst Rev. 2014;3(1):74. 10.1186/2046-4053-3-74 [DOI] [PMC free article] [PubMed] [Google Scholar]
- 3. Allen IE, Olkin I. Estimating time to conduct a Meta‐analysis from number of citations retrieved. JAMA. 1999;282(7):634‐635. 10.1001/jama.282.7.634 [DOI] [PubMed] [Google Scholar]
- 4. Korevaar DA, van Enst WA, Spijker R, Bossuyt PMM, Hooft L. Reporting quality of diagnostic accuracy studies: a systematic review and meta‐analysis of investigations on adherence to STARD. BMJ Evidence‐Based Med. 2014;19(2):47‐54. 10.1136/eb-2013-101637 [DOI] [PubMed] [Google Scholar]
- 5. Diagnostic Test Accuracy Working Group Handbook for DTA reviews; 2013. http://srdta.cochrane.org/handbook-dta-reviews. Visited November 3, 2019.
- 6. Petersen H, Poon J, Poon SK, Loy C. Increased workload for systematic review literature searches of diagnostic tests compared with treatments: challenges and opportunities. JMIR Med Inform. 2014;2(1):e11. [DOI] [PMC free article] [PubMed] [Google Scholar]
- 7. O'Mara‐Eves A, Thomas J, McNaught J, Miwa M, Ananiadou S. Using text mining for study identification in systematic reviews: a systematic review of current approaches. Syst Rev. 2015;4(1):5. [DOI] [PMC free article] [PubMed] [Google Scholar]
- 8. Cohen AM, Hersh WR, Peterson K, Yen P‐Y. Reducing workload in systematic review preparation using automated citation classification. J Am Med Inform Assoc. 2006;13(2):206‐219. [DOI] [PMC free article] [PubMed] [Google Scholar]
- 9. Liu J, Timsina P, El‐Gayar O. A comparative analysis of semi‐supervised learning: the case of article selection for medical systematic reviews. Inform Syst Front. 2018;20(2):195‐207. [Google Scholar]
- 10. Miwa M, Thomas J, O'Mara‐Eves A, Ananiadou S. Reducing systematic review workload through certainty‐based screening. J Biomed Inform. 2014;51:242‐253. [DOI] [PMC free article] [PubMed] [Google Scholar]
- 11. Weiss K, Khoshgoftaar TM, Wang D. A survey on transfer learning. J Big Data. 2016;3(1). 10.1186/s40537-016-0043-6 [DOI] [Google Scholar]
- 12. Kanoulas E, Li D, Azzopardi L, Spijker R. CLEF 2017 technologically assisted reviews in empirical medicine overview. CEUR Workshop Proceedings. Vol 1866; 2017:1‐29. [Google Scholar]
- 13. Entrez Programming Utilities Help. Bethesda, MD: National Center for Biotechnology Information (US); 2010. https://www.ncbi.nlm.nih.gov/books/NBK25501/. Accessed May 18, 2018.
- 14. Bird S, Klein E, Loper E. Natural Language Processing with Python: Analyzing Text with the Natural Language Toolkit. Sebastopol, CA: O'Reilly Media, Inc.; 2009. [Google Scholar]
- 15. van Altena AJ. AMCeScience/Feature‐Miner; 2020. https://github.com/AMCeScience/feature-miner-pub/
- 16. van Altena A. J.. Review metadata; 2019. https://figshare.com/articles/dataset/Review_metadata/7804094/1
- 17. McInnes MDF, Moher D, Thombs BD, et al. Preferred reporting items for a systematic review and meta‐analysis of diagnostic test accuracy studies: the PRISMA‐DTA statement. JAMA. 2018;319(4):388‐396. 10.1001/jama.2017.19163 [DOI] [PubMed] [Google Scholar]
- 18. https://icd.who.int/browse10/2010/en. Visited December 3, 2018.
- 19. Pedregosa F, Varoquaux G, Gramfort A, et al. Scikit‐learn: machine learning in Python. J Mach Learn Res. 2011;12:2825‐2830. [Google Scholar]
- 20. Huang A. Similarity measures for text document clustering. In: Proceedings of the Sixth New Zealand Computer Science Research Student Conference (NZC‐SRSC2008), Christchurch, New Zealand; 2008:49‐56.
- 21. Gomaa WH, Fahmy AA. A survey of text similarity approaches. Int J Comput Appl. 2013;68(13):13‐18. [Google Scholar]
- 22. Virtanen P, Gommers R, et al. SciPy 1.0–fundamental algorithms for scientific computing in Python. In: arXiv e‐prints, arXiv:1907.10121; 2019.
- 23. Seabold S, Perktold J. Statsmodels: econometric and statistical modeling with python’. In: 9th Python in Science Conference; 2010.
- 24. McKinney W. Pandas: A foundational Python library for data analysis and statistics.
- 25. Olorisade BK, Brereton P, Andras P. Reproducibility of studies on text mining for citation screening in systematic reviews: evaluation and checklist. J Biomed Inform. 2017;73:1‐13. [DOI] [PubMed] [Google Scholar]
- 26. Cohen AM. Optimizing feature representation for automated systematic review work prioritization. AMIA Annual Symposium Proceedings, Vol. 2008. Bethesda, MD: American Medical Informatics Association; 2008:121. [PMC free article] [PubMed] [Google Scholar]
- 27. Moore RC, Lewis W. Intelligent selection of language model training data. In: Proceedings of the ACL 2010 Conference Short Papers. ACLShort '10. Uppsala, Sweden: Association for Computational Linguistics, 2010:220‐224.
- 28. Kubat M, Matwin S. Addressing the Curse of Imbalanced Training Sets: One‐sided Selection, Vol. 97. Nashville: ICML; 1997:179‐186. [Google Scholar]
- 29. Adeva JG, Atxa JP, Carrillo MU, Zengotitabengoa EA. Automatic text classification to support systematic reviews in medicine. Exp Syst Appl. 2014;41:1498‐1508. 10.1016/j.eswa.2013.08.047 [DOI] [Google Scholar]
Associated Data
This section collects any data citations, data availability statements, or supplementary materials included in this article.
Supplementary Materials
Appendix S1: Supporting information
Data Availability Statement
Data sharing is not applicable to this article as no new data were created or analyzed in this study.