

Abstract
The major histocompatibility complex (MHC) plays a critical role in the vertebrate immune system. Accurate MHC typing is critical to understanding not only host fitness and disease susceptibility, but also the mechanisms underlying host‐pathogen co‐evolution. However, due to the high degree of gene duplication and diversification of MHC genes, it is often technically challenging to accurately characterise MHC genetic diversity in non‐model species. Here we conducted a systematic review to identify common issues associated with current widely used MHC typing approaches. Then to overcome these challenges, we developed a long‐read based MHC typing method along with a new analysis pipeline. Our approach enables the sequencing of fully phased MHC alleles spanning all key functional domains and the separation of highly similar alleles as well as the removal of technical artefacts such as PCR heteroduplexes and chimeras. Using this approach, we performed population‐scale MHC typing in the Tasmanian devil (Sarcophilus harrisii), revealing previously undiscovered MHC functional diversity in this endangered species. Our new method provides a better solution for addressing research questions that require high MHC typing accuracy. Since the method is not limited by species or the number of genes analysed, it will be applicable for studying not only the MHC but also other complex gene families.
Keywords: amplicon analysis, major histocompatibility complex, MHC genetic diversity, MHC genotyping, PacBio sequencing
1. INTRODUCTION
The major histocompatibility complex (MHC) is a gene cluster found in the genomes of all jawed vertebrate species. MHC genes play critical roles in host immune defence against diseases and exhibit extraordinarily high degrees of genetic diversity (i.e., both high heterozygosity and high sequence variability/dissimilarity among alleles), making them a key gene family for investigating important ecological, evolutionary, and conservation questions ranging from functional diversity and adaptive evolution to gene‐disease association and species/population fitness. However, due to a range of technical challenges, the study of MHC genes, particularly in non‐model species, is often impeded by the lack of a reliable MHC typing method that provides high accuracy and is applicable to population‐scale research.
The two main classes of MHC genes, MHC class I (MHC‐I) and class II (MHC‐II), which encode cell surface proteins that are responsible for the presentation of self‐antigens as well as antigens derived from pathogens or foreign or abnormal cells to T cells (Cresswell et al., 2005; Pieters, 2000), are known to exhibit exceptionally high levels of genetic diversity. MHC‐I genes, specifically the classical MHC‐I genes which encode a glycoprotein chain that is involved in antigen presentation on the surface of most somatic cells, have been found to contain the greatest intraspecies diversity ever detected among vertebrate genes to date, with more than 21,000 alleles having been found at the three classical MHC‐I genes in humans (6766 alleles at HLA‐A, 7967 at HLA‐B, and 6621 at HLA‐C as of May 2021 according to the IPD‐IMGT/HLA Database; Robinson et al., 2015). Such a uniquely high degree of genetic diversity has rendered the MHC an important model system for understanding the dynamics of selection‐driven gene evolution (Hughes, 1999; Trowsdale, 2011; Trowsdale & Parham, 2004). The maintenance of high MHC diversity is largely attributed to balancing selection posed on the host immune system due to its co‐evolution with pathogenic microbes. MHC genes evolve rapidly through gene duplication and diversification (i.e., accumulation of mutations) to cope with a wide range of pathogens that constantly develop new ways to avoid host immune detection or elimination. Having a high level of genetic diversity allows a species to have a large repertoire of MHC molecules with different peptide‐binding regions, the regions that interact directly with antigens and are rich with variable amino acid sites. These MHC molecules can possess distinct peptide‐binding properties, which allow them to each present a different range of antigens and thus collectively provide a species with immunity against a broad spectrum of pathogens (Falk et al., 1991; Sidney et al., 2008). Therefore, the level of MHC diversity of a species/breed/population is often considered an important indicator of the immunological fitness of the species/breed/population and its potential to adapt to environmental changes, such as the emergence or encounter of new diseases (Edwards & Potts, 1996; O'Brien & Evermann, 1988; Sommer, 2005).
The high degree of gene duplication, diversification, conversion, and recombination of MHC genes is a double‐edged sword, being a contributor to both the aforementioned biological processes of interest, but also many technical challenges to accurately genotype these genes, particularly in non‐model organisms (Babik, 2010). Unlike in model species, where the latest technologies have been applied in the field of MHC research for several years (Ambardar & Gowda, 2018; Chang et al., 2014), there is usually no well‐developed genotyping assay available for studying MHC genes in non‐model organisms. In addition, software designed based on model species (e.g., human, model rodents) may not be compatible with non‐model organisms due to the lack of existing MHC allelic databases and more complex features within the gene families. Even when MHC genes are well characterised, in certain species it can still be difficult to develop a reliable and cost‐effective method to genotype individuals at these genes (Lane et al., 2012; Perrin et al., 2021; Setchell et al., 2016). In this study, we firstly carried out a systematic review with a focus on the advantages and limitations of current analysis methodologies that are widely used for MHC typing in non‐model organisms. The most commonly used sequencing methods are Sanger sequencing and next‐generation sequencing, which are discussed in detail in the systematic review results. We demonstrate that there is a clear need for a more reliable approach that can be easily applied to any species. To achieve this, we developed a Pacific Biosciences (PacBio) long read based MHC typing method along with a new clustering‐free analysis pipeline.
The species that we used for methodology development in this study is the Tasmanian devil (Sarcophilus harrisii), an endangered marsupial threatened by a fatal contagious cancer disease, known as devil facial tumour disease (DFTD) (Murchison et al., 2010; Pearse & Swift, 2006; Pye, Pemberton, et al., 2016). The Tasmanian devil represents a typical example of the common challenges in MHC typing. First, the three classical MHC‐I gene paralogues of the species share high sequence similarities (>97%) (Cheng, Stuart, et al., 2012), making it practically impossible to design gene‐specific PCR primers for these genes. Second, certain Tasmanian devil MHC‐I alleles differ from one another by as few as 1 bp (Lane et al., 2012) and therefore require a genotyping approach with exceptionally high resolution to segregate. Thirdly, the Tasmanian devil MHC genomic region contains structural variants leading to copy number variations in MHC‐I genes (Cheng, Stuart, et al., 2012), which makes the number of alleles per individual highly variable and less predictable. For these reasons, the Tasmanian devil provides a good system for testing whether the new approach can successfully overcome the common issues that other existing methods struggle to address. Additionally, the significant amount of work performed previously on the Tasmanian devil MHC has provided us with important ground truth data that are necessary for reliable method development and validation.
Here, we demonstrate that our new MHC typing method produces fully phased MHC alleles spanning multiple functional domains and allows the separation of highly similar MHC alleles and the segregation between real sequence variants and PCR artefacts. Using this new approach, we for the first time performed high‐resolution population‐scale MHC typing in the Tasmanian devil, which enabled us to identify novel allelic variants, assign supertypes, infer haplotypes, and reveal fresh insights into MHC functional diversity among populations in this endangered species.
2. MATERIALS AND METHODS
2.1. Systematic review
A systematic review was carried out to identify challenges in current approaches to MHC typing in non‐model organisms. The literature search was performed via Web of Science for research articles published within the time span of 2016–2020, with the search criteria of TOPIC: (MHC OR "major histocompatibility") AND TOPIC: (diversity OR variability OR genotyp* OR polymorphi*) NOT ALL FIELDS: (person OR people OR patient) NOT TITLE: (human OR humans OR HLA). The search resulted in 1116 articles (as of 2 December 2020), which were imported into EndNote X9. Initial manual curation based on the title and abstract was carried out to filter out articles focused on humans or mice or rats and other articles of low relevance with the topic of study not related to the MHC or the field of genetics. Full text pdf was downloaded for 460 articles that passed the initial screening. Further review of the full text found 64 of these articles as low relevance, for reasons such as no MHC typing was done in the study, or only previously published data was used, or being a review article (Data S1). In the end, 396 articles were used in the systematic review. Information including the species of interest, context of the study, targeted MHC gene(s)/region(s), and genotyping methods were extracted to a spreadsheet, with specific attention paid to the mentioning of strengths and/or challenges associated with the methodology used.
2.2. Sampling of Tasmanian devils
Ear biopsies were collected by Save the Tasmanian Devil Programme (STDP) staff under the STDP’s Standard Operating Procedure: Trapping and handling Wild Tasmanian Devils, and shared with the University of Sydney. Samples used in this study were collected between 2015 and 2018 during annual monitoring trips carried out by the STDP. Genomic DNA was extracted in previous works from ear biopsies using the MagAttract HMW DNA Kit (Qiagen).
2.3. Sequencing of MHC genes
An overview of the amplicon sequencing workflow is provided in Figure 1a.
FIGURE 1.
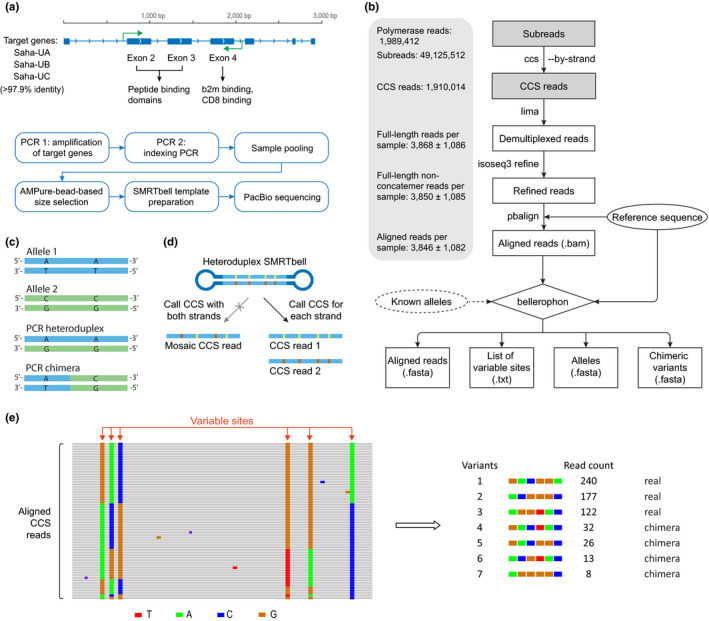
Analysis pipeline of PacBio‐based MHC typing. (a) Experimental workflow. (b) The complete data analysis workflow, with the numbers of sequences (sum or mean ±standard deviation) obtained in this study shown in the left panel and optional data indicated by dashed lines; The initial two steps (grey) of the analysis are performed on the entire data set, while the remaining steps are carried out on an individual sample basis. (c) Common PCR artefacts ‐ heteroduplex and chimera. (d) Circular consensus sequence (CCS) calling by strand eliminates mosaic CCS reads resulting from heteroduplexes. (e) Schematic diagrams explaining concepts behind the allele calling method
A pair of universal primers were designed within conserved regions of three target MHC‐I genes that have been characterised previously (Cheng, Stuart, et al., 2012). The forward primer (5′‐GTGTCCCCCCCTCCGTCTCAG‐3′) is located inside intron 1 of the genes and the reverse primer (5′‐CCTAACTCCCCCTGCTCCTTCTG‐3′) in intron 4. Both primers are tagged with a PacBio universal adaptor on the 5′ end, with the forward adaptor being /5AmMC6/gcagtcgaacatgtagctgactcaggtcac and the reverse adaptor /5AmMC6/tggatcacttgtgcaagcatcacatcgtag. The 5′ modification was made to prevent amplicons without barcodes forming SMRTbell templates during library construction. Three high‐fidelity long‐range PCR kits, including (1) Phusion Hot Start II High Fidelity PCR Master Mix (Thermo Scientific), (2) Platinum SuperFi II PCR Master Mix (Invitrogen), and (3) Platinum Taq DNA Polymerase High Fidelity (Invitrogen), were tested for their amplification performance on target genes. Kit#2 showed the highest amplification efficiency and consistency on Tasmanian devil MHC‐I genes, whereas kit#1 and kit#3 failed to amplify in certain DNA samples. Four individuals that have been genotyped before (Tovar et al., 2017) were used for primer and PCR result verification through amplicon cloning and Sanger sequencing using protocols described previously (Tovar et al., 2017). The final PCR amplifications were carried out using kit#2 with primer final concentrations of 0.5 μM each. PCR conditions were as follows: 98°C initial incubation for 30 s; 20 cycles of 98°C for 15 s, 60°C for 15 s, and 72°C for 2 min; and a final extension at 72°C for 5 min.
A second round of PCR was carried out using Barcoded Universal F/R Primers Plate‐96v2 (Pacific Biosciences, 2020) following the recommended protocol (Pacific Biosciences, 2020). After barcoding PCR, up to 96 samples were pooled and amplicons were purified using AMPure PB magnetic beads (Pacific Biosciences). The expected size of amplicons was ~1.4 kb. During the purification step, a bead‐based size selection was carried out by performing 0.6× bead clean‐up once for removing primers and small fragments, followed by 0.4× bead clean‐up once for removing molecules larger than expected (target size fraction in supernatant). This size selection is optional but helps to remove artefacts that are of incorrect sizes.
SMRTbell template preparation was carried out using the SMRTbell Template Prep Kit 1.0 (Pacific Biosciences) with ~500 ng of purified amplicon DNA as input material. Sequencing was performed by the Ramaciotti Centre for Genomics (University of New South Wales, Australia) on a PacBio Sequel platform using Sequel Sequencing Chemistry 3.0, Sequencing primer v4, and circular consensus sequence (CCS) sequencing mode on four SMRT Cells 1 M over two separate runs. A total of 1,989,412 polymerase reads and 49,125,512 subreads were obtained (not all samples sequenced on these runs were for the purpose of this work), with an average polymerase read length of 35.9 kb and average subread length of 1.4 kb.
2.4. MHC sequence data processing and allele calling
The complete data analysis workflow is outlined in Figure 1b. The raw data set is initially processed as a whole, and then after read demultiplexing, the analysis is performed on an individual sample basis. Starting from bam files containing raw subreads, CCS calling was performed using the program ccs v4.0.0 in ‐‐by‐strand mode, requiring a minimum of five full sequencing passes and a minimum quality score of 0.995 for each resulting CCS read (‐‐min‐passes 5 ‐‐min‐rq 0.995). This step generates two CCS reads for each polymerase read, one for each strand, and thereby eliminates potential noise in data that can be caused by PCR heteroduplexes (Figure 1c,d). Demultiplexing of CCS reads was carried out using program lima v1.10.0, and partial or concatemer reads were further removed using program isoseq3 refine v3.2.2. Refined reads were aligned to a reference sequence, which was the genomic sequence from the devil MHC‐I gene Saha‐UA, using program pbalign v0.4.1. These four programs mentioned above are available from software suite SMRTLink release 8.0.0 (Pacific Biosciences).
Allele calling was carried out for each sample using a program written in python 3.8. The design of the program, named as “bellerophon”, is further discussed in the Section 3. The program requires two input files, including the bam file containing aligned reads, generated from the previous step, and a fasta file containing the same reference sequence used for producing the alignments. The program first identifies putative variable sites within the aligned CCS reads based on variant frequency among all reads. To check the accuracy and sensitivity of our program in variable site calling, we compared our results with ones generated using the PacBio program juliet v1.11.0, which is designed for rare variable site detection (without chimera filtering); the two sets of results were consistent. Then the program calls putative alleles and chimeric sequences, which are written in two separate output files with read counts and read evidence information (with ‐‐evidence option) provided in case further investigation is needed. Additional sequence variant filtering based on the relative read abundance can be applied with ‐‐min_read_perc parameter (e.g., 0.05 if a variant must be supported by at least 5% of the reads to be considered a candidate). If an optional input file containing sequences of known alleles for the species of interest is provided for the ‐‐db argument, the identified alleles will be compared to known alleles and assigned allele names if matches are found. This tool along with toy data is available at https://github.com/yuanyuan929/bellerophon.
Apart from CCS calling, most of the programs above had short runtime (minutes) and low CPU and memory requirements (run with 1 CPU and 5 GB of memory per job in this work).
2.5. Tasmanian devil MHC‐I allele analysis
Twenty individuals that have been previously genotyped at α1 and/or α2 domains via cloning and Sanger sequencing (Lane et al., 2012; Tovar et al., 2017) were reanalysed for the verification of genotyping results. The new method outperformed the former approach, identifying previously identified alleles as well as recovering gene dropouts (Lane et al., 2012). The majority of identified MHC alleles were found in multiple Tasmanian devils. In the case of highly rare nonchimeric alleles that were only observed in a single individual, the alleles were confirmed by rerunning of the samples.
MHC‐I alleles were grouped into supertypes based on the biochemical properties of variable peptide‐binding residues in the encoded proteins. Parameters used for supertype grouping included steric parameter (Charton, 1981), polarity (Radzicka & Wolfenden, 1988), and hydropathy index (Kyte & Doolittle, 1982). Clustering was performed using R function Mclust() with model selection based on the Bayesian information criterion in package mclust (Scrucca et al., 2016). MHC‐I haplotype reconstruction was performed using phase v2.1.1 (Stephens & Scheet, 2005; Stephens et al., 2001). All predictions had phase probabilities great than 0.99. Gene assignment for alleles were based on the results of haplotype inference as well as alleles with known gene assignment (Cheng, Stuart, et al., 2012). The nomenclature of alleles was adapted from HLA nomenclature, with four numbers following the gene name indicating the supertype (or allele group), specific protein, synonymous nucleotide substitution(s) within the coding region, and substitution(s) within a non‐coding region. Functionally significant residues within devil MHC‐I proteins were predicted based on homology to HLA‐A, ‐B and ‐C proteins (Bjorkman & Parham, 1990). Similarly, 3D structure of devil MHC‐I was predicted by protein homology detection using program Phyre2 (Söding, 2005). Testing for evidence of individual residues under positive or negative selection were performed on datamonkey webserver (Delport et al., 2010) using mixed effects model evolution (MEME) (Murrell et al., 2012), fixed effects likelihood (FEL) (Kosakovsky Pond & Frost, 2005), random effects likelihood (REL) (Kosakovsky Pond & Frost, 2005), and evolutionary fingerprinting (Kosakovsky Pond et al., 2009) methods. Principal component analysis plots were made using R function fviz_pca_ind() in package factoextra.
3. RESULTS
3.1. Challenges in current approaches to MHC typing – a systematic review
To identify challenges in MHC typing in non‐model species, we conducted a literature search for research articles published in the last five years (2016–2020 inclusive) that involved the study of MHC genetic diversity in species other than human and model rodents. Our final data set comprised 396 articles, for which we recorded the species, context of study, targeted MHC gene and region, and methodology used for MHC typing of the study (Figure 2; Data S1). Approximately 32% of the reviewed articles comprised studies of domesticated animals that are economically significant (e.g., cattle, sheep, pig, horse, chicken, farmed fishes, etc.). Among wild species, mammals (29% of articles) and birds (19%) have been better studied than fishes (10%), amphibians (6%), and reptiles (3%), which is probably a reflection of the availability of high‐quality genome assembly data for these categories, and/or the inherent biases towards cute and cuddly critters for conservation biology/molecular ecology. Most of the reviewed articles (60%) investigated MHC diversity in the context of molecular evolution, population genetics, and/or conservation biology, while others focused on the association of MHC with diseases (19%) or mate choice (9%). A large variety of methods have been adopted in MHC typing (Figure 2c), with the most widely used ones including cloning and Sanger sequencing, next‐generation sequencing (i.e., Illumina, 454, and Ion Torrent sequencing), microsatellite markers, and banding pattern or fragment size based methods. A comparison of the advantages and limitations of these commonly used methods is summarised in Table 1.
FIGURE 2.
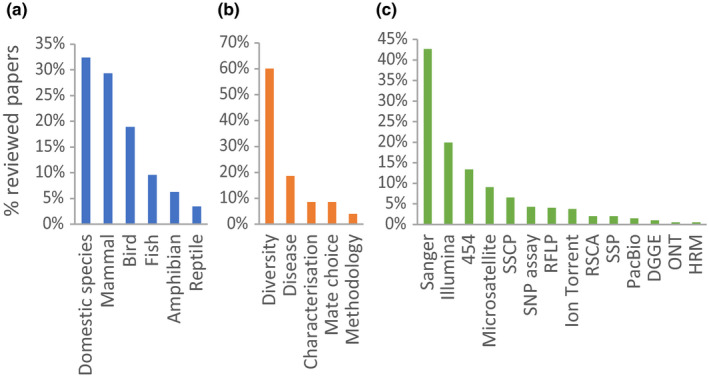
Summary of the literature reviewed in terms of (a) species studied, (b) main context of the study, and (c) methodology used for MHC typing. Since some studies used multiple methods, percentages in (c) do not add up to 1. Abbreviations: SSCP, single‐strand conformation polymorphism; RFLP, restriction fragment length polymorphism; RSCA, reference strand‐mediated conformational analysis; SSP, sequence‐specific primer method; DGGE, denaturing gradient gel electrophoresis; ONT, Oxford Nanopore Technologies; HRM, high‐resolution melting curves
TABLE 1.
Comparison of commonly used MHC typing methods
| Method (% of studies) | Simplicity of laboratory work | Throughput a | Sequence completeness | Genotyping accuracy | Affected by heteroduplexes | Affected by chimeras | Examples |
|---|---|---|---|---|---|---|---|
| Cloning and Sanger sequencing (43%) | Labour intensive, long process | Low | Amplicon size limited by cloning vectors (the larger the amplicon, the harder the ligation) | High specificity, low sensitivity (allelic dropout is a common issue) | Yes | Yes; sequences usually manually removed by researcher | Otting et al. (2007), Siddle et al. (2007) |
| NGS‐based amplicon sequencing (37%) b | Easy | High | Low: Usually target a single exon, or multiple exons separately | High sensitivity, though requires additional phase prediction when typing multiple exons | Yes | Yes; sequences removed using bioinformatic software | Biedrzycka et al. (2017), Sommer et al. (2013) |
| Banding pattern or fragment size based methods (14%) c | Certain methods are laborious | Mid | Compatible with short amplicons | Limited resolution | Yes | Yes | Castro‐Prieto et al. (2011), Promerova et al. (2012) |
| Microsatellite (9%) | Easy | High | NA | Limited resolution | NA | NA | Aguilar et al. (2004), Doxiadis et al. (2007) |
| Long read sequencing (PacBio, Nanopore; 3%) | Easy | High | High: Provide full‐length sequences spanning multiple functional domains | High: Provide fully phased sequences; high accuracy (with PacBio CCS) | Yes; addressed in this work (with CCS calling by strand) | Yes; addressed in this work (bellerophon) | Fuselli et al. (2018), Maibach et al. (2017) |
Loosely defined by the number of samples that can be pooled or analysed in each run/gel/batch. High, hundreds; Mid, tens; Low, samples are processed individually in small batches.
Sequencing methods include Illumina, Roche 454, and Ion Torrent sequencing platforms.
Methods mainly include single‐strand conformation polymorphism (SSCP), restriction fragment length polymorphism (RFLP), reference strand‐mediated conformational analysis (RSCA), sequence‐specific primer (SSP), and denaturing gradient gel electrophoresis (DGGE).
Despite the recent expansion in next‐generation sequencing methods, Sanger sequencing (cycle sequencing) remains the most commonly used MHC typing method (43% of studies in our review), probably due to the high base‐wise accuracy of raw sequences generated by the sequencing method. However, due to the high degree of polymorphism (i.e., large numbers of variable nucleotide positions within the genes) found in MHC genes, in order to resolve the phase of single nucleotide variants among alleles, it is often necessary to clone PCR amplicons prior to Sanger sequencing. Furthermore, while a locus‐specific approach is possible for human HLA (Bunce et al., 1995), it is difficult or even impossible to develop in many non‐model species (Marmesat et al., 2016; Perrin et al., 2021; Setchell et al., 2016). A multilocus PCR approach comes with issues such as unequal amplification efficiencies among genes/alleles and PCR artefacts (Marmesat et al., 2016; Sommer et al., 2013), which require high sequencing coverage to resolve. Depending on the number of genes coamplified, the number of clones that needs to be screened or sequenced to achieve high confidence in allele coverage can be high. For instance, if three genes are coamplified, and assuming that all alleles are PCR‐amplified and cloned with a uniform efficiency, and that PCR artefact formation is negligible, the minimum number of clones that need to be sequenced per individual (N) in order to identify all potential alleles can be calculated using equation N = ln(1 − P)/ln(1 − 1/2*3) as adapted from the Clarke and Carbon formula (Clarke & Carbon, 1976). This calculation suggests that in the best scenario, at least 17 and 26 clones need to be sequenced to achieve 95% and 99% confidence that all alleles are identified in an individual (P), respectively. In practice, uneven PCR amplification efficiencies among genes or alleles will often cause missing alleles (allelic dropout) in the results (Lane et al., 2012). Therefore, apart from the laborious and lengthy process, low sequencing depth is a main limitation of this approach.
The second most popular approach to MHC typing uses next‐generation sequencing (NGS) based amplicon analysis (37% of studies in our review). Compared to Sanger sequencing, NGS provides much higher read coverage for amplicons and therefore ensures high sensitivity in allele detection, while also providing high data throughput for large‐scale studies. However, due to the relatively short read lengths of NGS platforms, this approach lacks the ability to provide complete information on MHC genes without involving read assembly, which can potentially introduce assembly errors. NGS‐based MHC typing is therefore often used to analyse only a single exon of the target genes. This limitation makes NGS‐based MHC typing less suitable for studying MHC‐I genes, as MHC‐I genes have two exons (exon 2 and exon 3) that contain hypervariable peptide‐binding regions ‐ the regions that interact directly with antigens and are rich with variable amino acid sites (Bjorkman & Parham, 1990). In fact, out of 49 studies reviewed that performed MHC‐I typing using NGS‐based methods, 86% only examined one of the two peptide‐binding domains, 8% sequenced the two domains separately, 4% amplified partial exon 2 and exon 3 using cDNA instead of genomic DNA, and only one study (2%) sequenced and assembled complete exon 2 and exon 3 of MHC‐I alleles with the assistance of sequence‐specific primers (Data S1). Furthermore, it is well known that NGS‐based amplicon analysis is heavily affected by sequencing noise caused by technical artefacts, such as base‐call errors or chimeras (Ferrandiz‐Rovira et al., 2016; Grogan et al., 2016; Rekdal et al., 2018). Several bioinformatic methods have been developed to account for these issues (Biedrzycka et al., 2017; Grogan et al., 2016; Karl et al., 2014; Rekdal et al., 2018; Santos et al., 2017; Schwensow et al., 2019; Sommer et al., 2013; Vasoya et al., 2016), though sometimes extensive manual curation of sequence variants or sample replication between sequencing runs or even platforms are still necessary (Grogan et al., 2016). One thing to note is that certain programs that were developed for analysing microbial 16S rRNA gene amplicons, such as QIIME (Caporaso et al., 2010) and UCHIME (Edgar, 2016), have been used for NGS‐based MHC amplicon analyses. One limitation of using such microbial amplicon analysis software on MHC amplicons is that different from MHC typing, microbiome analysis usually allows for certain level of tolerance towards sequence mismatches, with pipelines often built for dealing with sequences that would undergo similarity‐based clustering, whereas in MHC genes, a small number of mutations can cause differences in the property and function of encoded protein and potentially affect the host susceptibility to certain diseases (Matzaraki et al., 2017; Wang et al., 2019). This difference in the requirements for resolution makes the use of certain microbiome analysis programmes suboptimal for analysing MHC amplicons. This also highlights the need for developing tools that are specifically tailored for MHC typing.
MHC‐linked microsatellites and gel‐based banding pattern analysis, such as single‐strand conformation polymorphism (SSCP) and restriction fragment length polymorphism (RFLP), were used in 9%, 7%, and 4% of studies reviewed, respectively. Strengths of both types of methodologies include having a relatively simple experimental and data analysis process and low costs, though both suffer the limitation of lower genotyping accuracy. MHC‐linked microsatellites, which are markers located within the same linkage groups as adjacent MHC genes, can be used as a proxy for inferring MHC haplotypes. However, even well‐established markers, such as the chicken LEI0258, which was used in 48% of 25 studies performed in the chicken in our review, do not provide a perfect inference, as different MHC haplotypes can share the same microsatellite allele while different microsatellite alleles can be found associated with the same MHC haplotype (Iglesias et al., 2019). Similarly, gel‐based analysis methods also offer limited resolution. For example, for Tasmanian devil MHC‐I typing, although SSCP provided high consistency with different banding patterns always indicating different MHC types, the method was inefficient at discerning differences among certain MHC alleles (see Data S2). Therefore, for studies that require high MHC typing accuracy, these methods are less favourable than sequencing‐based approaches.
Two common technical artefacts universally affect all MHC analyses that involve PCR: heteroduplexes (Liu et al., 2014; Thompson et al., 2002) and chimeras (Gonzalez et al., 2004; Haas et al., 2011; Qiu et al., 2001). PCR heteroduplexes are amplicons that are formed by the hybridisation of two different single‐stranded DNA molecules (i.e., the forward and reverse strands of the amplicon belong to two different alleles), while chimeras are hybrids of usually two different parent molecules (i.e., different segments of the amplicon belong to different alleles). Both artefacts can be severe in mixed‐template or multitarget amplifications; common in MHC typing (to provide a few examples, mammals:Robbins et al., 2020; Yi et al., 2020); birds: (Lan et al., 2019; Pineaux et al., 2020); reptiles: (Dudek et al., 2019; Pearson et al., 2016); amphibians: (Kosch et al., 2019; Talarico et al., 2019); fishes: (Faulks & Ostman, 2016; Phillips et al., 2018). Heteroduplex and chimera formation increase with PCR cycle number, template concentration, and target diversity, and total elimination is difficult without extensive PCR optimisations and additional selective purification steps (Qiu et al., 2001; Thompson et al., 2002).
To overcome these issues, we present here a new typing approach utilising PacBio sequencing, which was chosen for (1) its long read lengths, which enable the analysis of long and complex PCR amplicons without the need for computational read assembly; and (2) high consensus sequence quality without the need for raw read clustering, which increases genotype resolution.
3.2. A new MHC typing pipeline
There are three major goals that a new MHC typing assay needs to achieve: (1) generate fully‐phased MHC sequences spanning multiple functional domains, (2) remove artefacts caused by PCR heteroduplexes and chimeras, and (3) provide high resolution that can differentiate highly similar MHC alleles.
Amplification and sequencing: For the amplification of Tasmanian devil MHC‐I genes, we designed a pair of multi‐locus primers to amplify all three target genes, with the amplicon region spanning three key functional domains, including the α1 and α2 peptide‐binding domains and the a3 domain involved in b2m and CD8 binding (Figure 1a). To optimise PCR conditions and reduce the chance of artefact formation, we evaluated three high‐fidelity long‐range PCR kits, and used the minimum number of PCR cycles necessary for generating enough amplicons for library construction and sequencing.
Data processing: The complete workflow for data processing with programs used is summarised in Figure 1b and described with full details in the Methods section. Briefly, CCS reads were generated, demultiplexed, trimmed, filtered, and aligned; the aligned reads were then used for allele calling. For each individual genotyped, 3846 ± 1082 final reads were obtained after filtering (Figure 1b; Data S3).
The issue of PCR heteroduplexes is addressed at the first step of data processing. CCS reads were called from raw subreads using the PacBio CCS calling program in the ‐‐by‐strand mode, which performs consensus calling for each DNA strand separately and results in two CCS reads for each template molecule (Figure 1d). We observed that consensus calling using subreads from both directions can result in mosaic artefact sequences, which constitute a source of noise in the data set. In fact, by sampling 15,000 random CCS reads, we found that 26.8% of the templates were heteroduplexes, with 16% resulting in mosaic sequences when a consensus was called using all subreads together. Unlike other sequencing technologies which rely on frequency‐based variant filtering to remove potential mosaic sequences, this type of noise is avoidable with PacBio sequencing due to the way it sequences both strands of the amplicons repeatedly around the circular template molecules.
Variant calling: The high quality of PacBio CCS reads provides a good basis for achieving high allelic resolution. However, although CCS reads can have high base accuracy, they are not error free, and because the aim is to separate highly similar alleles (some alleles in the devil differ from one another by as few as 1bp), it is not feasible to rely on clustering‐based methods to further polish the CCS reads. To deal with this challenge, we present a new allele calling program “bellerophon” (named after the Greek hero who slayed the chimera) that improves allele calling accuracy (Figure 1e). The first thing bellerophon (available from https://github.com/yuanyuan929/bellerophon) does is to identify polymorphic sites within the aligned reads. Given the high quality of CCS reads, it is not difficult to distinguish between errors and putative variations, which are defined by having a frequency among all reads that is higher than a given cutoff value set by ‐‐min_var_freq (default 0.05; should be adjusted based on the number of genes coamplified: the more genes coamplified, the lower the value). In the example shown in Figure 1e, there are six putative variable sites in the aligned CCS reads. Only these putative variable sites are then used for allele or sequence variant identification. In order to identify putative alleles and remove potential PCR chimeras, which seem prevalent in Tasmanian devil MHC amplicons possibly due to extended stretches of regions with high GC content (over 80%) in the target genes (Data S4), bellerophon ranks all the combinations of nucleotides at the variable sites according to read counts. The top two most abundant variants are first assigned as real (according to our testing, if only one real allele exists in a sample, no detectable chimera forms). Bellerophon then screens through the ranked list of variants and examines if each variant can be formed by combining any pair of variants before it. This stringent chimera filtering strategy was used because it has been observed in bacterial 16S rRNA gene amplicons that chimeras can reproducibly form among independent PCR amplifications (Haas et al., 2011). One commonly used strategy for filtering MHC chimeric sequences from Sanger or NGS data is based on the assumption that it is unlikely that the same chimera can form in multiple PCR amplifications (Sommer et al., 2013). However, our investigation demonstrated that, similar to bacterial 16S rRNA amplicons, certain MHC PCR chimeras can arise repeatedly even when different PCR kits are used (Data S4), indicating that finding a sequence variant in multiple samples or PCR amplifications is not always a sufficient criterion for MHC real allele calling.
Using this pipeline, we identified a total of 61 Tasmanian devil MHC‐I alleles, 19 pairs of which contain minor differences (as low as 1 bp), which is not unexpected since it has been observed previously that Tasmanian devil MHC genes have low sequence variability (Cheng, Stuart, et al., 2012; Lane et al., 2012). Further analysis suggested that these alleles with minor variations are probably real, as they are either found in more than two individuals or were confirmed by rerunning PCR and sequencing for the same individuals (random single nucleotide PCR errors are less likely to occur repeatedly than certain chimeric formations). Interestingly, we also found two real MHC alleles that are hybrids of two other real alleles and therefore look like PCR chimeras, but which have probably been formed by actual gene recombination events. Bellerophon identified these as real alleles as they had relatively high read abundance and did not co‐exist with both parent alleles in the same individuals.
3.3. Typing of Tasmanian devil MHC‐I genes – new findings
Using our new approach, we genotyped 214 Tasmanian devils belonging to nine different subpopulations (or geographical sites) across Tasmania (sequence data available from NCBI SRA with accession number PRJNA715496). In addition, 25 and 20 individuals that have been previously genotyped using SSCP and Sanger sequencing methods, respectively, were also reanalysed for comparison of methods and verification of genotyping results. While most of the previous MHC‐I typing in the Tasmanian devil was carried out on a single exon (exon 2) (Lane et al., 2012; Siddle et al., 2010), using our new pipeline we were able to obtain full allelic sequences encoding all three extracellular domains of the MHC‐I proteins. The new approach is more powerful at detecting MHC diversity. Within 14 previously genotyped devils (Lane et al., 2012), traditional cloning and sequencing identified three, five, and two alleles at gene Saha‐UA, ‐UB, and ‐UC, respectively, whereas the new method identified five, ten, and five unique alleles.
A total of 61 alleles were identified, of which 37 are new alleles that have not been described before (Data S5). Pair‐wise sequence similarities among alleles range between 96.9% and 99.9%, making it extremely difficult to resolve the evolutionary relationships among genes and alleles (Data S6). For the first time, we were able to perform a comprehensive analysis of polymorphic sites within devil MHC‐I proteins (Figure 3). Among 1280 sequenced nucleotide sites, 47 sites were found polymorphic, with 30 nonsynonymous substitution sites corresponding to 28 variable amino acid residues in encoded protein sequences (Figure 3b). Twenty‐seven of these variable amino acid sites are located inside the peptide‐binding groove and one is in the a3 domain at a putative site involved in CD8 interaction (Figure 3c). In the peptide‐binding domains, evidence of positive selection was detected at six residues, while interestingly, one residue showed strong evidence of negative selection (Figure 3b; Data S7), which was unexpected for a site involved in antigen interaction. Based on the biochemical properties of amino acids found at the variable residues, 13 distinct supertypes of MHC‐I molecules were identified, which may possess different antigen binding preferences and represent functionally divergent variants (Schwensow et al., 2019; Sidney et al., 2008) (Figure 3a,b). The number of alleles per individual ranged between one and six due to genomic copy number variations (Cheng, Stuart, et al., 2012) (Data S8 shows copy number variations of MHC‐I genes among different haplotypes found in this study), and the number of supertypes per individual also ranged between one and six.
FIGURE 3.
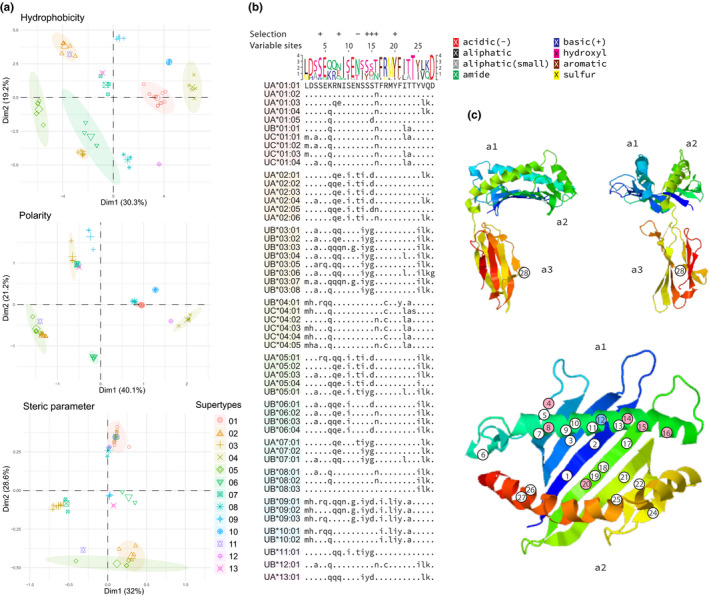
Sequence analysis of Tasmanian devil MHC‐I alleles. (a) Supertype identification. (b) Sequence alignment at variable amino acid sites (invariable sites are not shown). (c) Predicted 3D structure of extracellular domains of Tasmanian devil MHC‐I protein, with variable residues shown; residues with evidence of selection are colour‐coded: red, positive selection; blue, negative selection
Also for the first time, we were able to infer full Tasmanian devil MHC‐I haplotypes, detecting 50 haplotypes with phase prediction confidence >0.99 (Data S8). This was not previously possible due to allelic dropout caused by limitations of older MHC typing methods (Lane et al., 2012). Based on comparisons at the haplotype level, six of the nine subpopulations examined form a cluster, representing the formerly defined eastern Tasmanian devil population (Siddle et al., 2010), whereas the north‐western and south‐western devils exhibit distinct haplotype frequency distributions (Figure 4; Data S9). The Maria Island population showed a mixed signature of eastern and north‐western populations at the haplotype level, which is consistent with the establishment and supplementation of this island site using individuals sourced from the insurance metapopulation (Wise et al., 2019). At the allele and supertype levels, however, differences between north‐western and eastern populations become less prominent, with the southwest population as the only group that stands out from all the other populations. As can be seen in Figure 4a, the southwest population has a predominant MHC‐I haplotype, suggesting that this devil population has a particularly low MHC diversity, which could have been caused by a recent selective event or inbreeding due to geographic isolation from other devil populations (divided by mountain ranges). Further investigation on the neutral or genome‐wide genetic diversity of this population will be needed to tease apart these possible causes.
FIGURE 4.
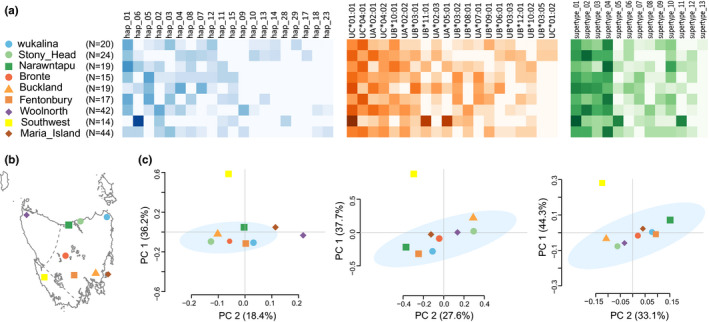
Comparison of nine Tasmanian devil subpopulations based on MHC‐I types. (a) From left to right, MHC‐I haplotype, allele, and supertype frequencies (only top 20 most abundant haplotypes and alleles are shown), with darker heatmap colours indicating higher frequencies. (b) Map of Tasmania showing locations of sampling sites; the dashed lines indicate the rough boundary between the eastern, north‐western and southwestern populations. (c) From left to right, PCA analyses of the nine surveyed subpopulations based on haplotype, allele, and supertype frequencies
4. DISCUSSION
The lack of a suitable MHC typing method that has high accuracy and can be easily applied to population‐scale studies is a major obstacle that impedes the understanding of host immunity and adaptive evolution in non‐model organisms, especially in threatened species such as the Tasmanian devil. This work sheds light on the significance of accurate MHC typing in non‐model species and provides an amplicon analysis method that can be widely adopted for the use on any vertebrate species and gene family targets.
4.1. Importance of accurate MHC typing in non‐model species
Accurate quantification of MHC diversity relies heavily on the sensitivity, resolution, and throughput of the methodology used for MHC typing. Although Tasmanian devil MHC genes have been well described previously (Cheng & Belov, 2014; Cheng et al., 2012; Cheng, Stuart, et al., 2012; Siddle et al., 2010), routine MHC typing of devils, particularly at MHC‐I genes, has remained a technical challenge for many years. This work is the first population‐scale study in the devil that employs an MHC typing method that provides high sensitivity and high resolution. One of the most important findings from this study is that there is no significant population differentiation across Tasmania in the MHC‐I allelic and supertype diversity, except for the geographically isolated south‐western population. This contradicts with our finding in a previous study based on SSCP‐based MHC‐I typing which found different signatures of MHC‐I diversity between eastern and north‐western subpopulations (Siddle et al., 2010). This discrepancy is probably due to technical limitations of the previous MHC‐typing method (see also Table 1 and Data S2). The new observation that eastern and north‐western devil subpopulations share similar MHC supertype profiles, despite showing differentiation at neutral SNP loci (Miller et al., 2011), may indicate that devils in those subpopulations are under similar pathogen‐driven selective pressure, which has shaped convergence on MHC‐I functional diversity (Schwensow et al., 2019; Sidney et al., 2008). These findings will shift the way we investigate the role of MHC in the transmissible cancer. For example, based on our results suggesting that the number of supertypes that an individual possesses varies markedly from one to six, it warrants further research to investigate whether supertype inferred functional diversity plays a role in the observed variation (Pye, Hamede, et al., 2016) in host immune response against DFTD.
Our findings demonstrate that the use of traditional genotyping methods with limited resolution and throughput on MHC genes may lead to underestimation or miscalculation of MHC diversity. Another well‐known similar example is the cheetah (Acinonyx jubatus), which was originally estimated to have extremely low MHC‐I diversity but more recently found to possess higher allelic and functional diversity than initially thought using more accurate MHC typing methods (Castro‐Prieto et al., 2011; O'Brien et al., 1985; Schwensow et al., 2019). Having a reliable high‐throughput MHC typing method will greatly improve the accuracy of results, providing a solid foundation for addressing important evolutionary, ecological and conservation questions.
4.2. Key considerations when applying the new genotyping pipeline
Since bellerophon is not limited by species or gene targets, it should be applicable for analysing any low‐complexity amplicon data (as opposed to high‐complexity data such as whole‐microbiome 16S rRNA amplicons) generated with PacBio sequencing in any species. When using this pipeline for genotyping, there are several key factors to take into consideration.
Data resources needed for PCR primer design: The design of appropriate PCR primers for studying complex genes can be difficult when there is no reference‐quality genome assembly available for the species of interest. However, long‐read sequencing technologies and the improving performance of commercially available long‐range PCR kits have provided new opportunities for studying genetic diversity in such genes without a reference genome. For example, MHC genes comprise hypervariable regions (exon 2 and exon 3 for MHC‐I, exon 2 for MHC‐II) and other more conserved regions. A potential strategy for performing MHC typing in a species without any genomic resource is to first identify the less polymorphic regions (e.g., through transcriptome sequencing) and design long‐range PCR primers for gene amplification in those exons. The reference sequence needed in the bellerophon pipeline (Figure 1b) does not have to be a genomic sequence from a reference genome and can be either genomic sequence or mRNA sequence, depending on the type of samples used in PCR.
Amplicon size: Since this MHC typing method is based on PCR amplification of genes, certain genes that contain long introns may require multiple pairs of primers to be designed in order to obtain the full‐length sequences. While MHC‐I genes are usually relatively small, with the sizes of genes commonly shorter than 5 kb (e.g., in the human, mouse, Tasmanian devil), certain MHC‐II genes can contain long introns (e.g., mouse E2‐Eb1, total length 10.8 kb). Although many commercially available long‐range polymerase kits have the capacity to amplify up to 20 kb or even longer fragments, it is advisable to limit the sizes of PCR amplicons. This helps ensure that enough subreads can be obtained to generate high quality CCS reads, and also helps reduce PCR artefact formation.
Minimise PCR artefacts: Although our data analysis pipeline has been specifically designed for dealing with data containing potentially high proportions of artefactual sequence variants, it is still advisable to reduce the chances of PCR artefact formation during amplicon preparation. One factor that has the most significant impact on the prevalence of PCR artefacts is the number of PCR cycles used (which affects primer:template ratio in the reaction) during the 2‐step PCR amplifications (Liu et al., 2014; Qiu et al., 2001). The numbers of PCR cycles for both PCR steps should be kept to the minimum number that is needed to generate enough DNA for sequencing library preparation. As detailed in the Methods section, we tested three high‐fidelity long‐range PCR kits and selected the one that provided the highest amplification efficiency; this was also to ensure that as few as possible PCR cycles were used. Another effective way to minimise PCR artefacts is to reduce the number of genes coamplified per reaction, for example, by using gene‐specific primers. However, as mentioned previously, this is often not possible for MHC genes in many non‐model species.
Long homopolymers: Homopolymers, or long stretches of a single type of nucleotides, represent a major technical challenge to most of the existing sequencing technologies, with the error rate positively correlated with the length of homopolymer (Ivády et al., 2018; Weirather et al., 2017). If the target genes contain regions comprising long homopolymers (e.g., longer than 7 bp), these regions may need to be blocked due to high rates of indel errors caused during PCR and sequencing, which can interfere with the accuracy of allele calling. Usually these segments are more likely to occur in noncoding regions (e.g., introns) than in coding regions (Piazza & Liò, 2005). We have included an option for blocking homopolymeric regions from allele calling in bellerophon (‐‐blacklist).
Sequencing technology, base calling accuracy, and sequencing depth: The base calling accuracy of the sequencing technology used (in CCS reads with PacBio, raw reads with other technologies) plays an important part in determining how many homologous genes can be coanalysed using our genotyping pipeline due to the clustering‐free variant calling approach. The higher the error rate, the fewer genes can be coanalysed. For example, if the reads have an error rate of 0.05 for deletion errors, no more than 10 genes (up to 20 different alleles) can be coanalysed in order to call deletion variants, assuming equal PCR amplification efficiency among alleles. Similarly, the sequencing depth required for confident allele calling also positively correlates with per base error rates and is positively associated with the number of polymorphic sites within the target genes as well. Our future work will involve testing our pipeline on amplicon data generated on Oxford Nanopore Technologies platforms, which have the advantages of being more scalable and accessible, though the current basecalling accuracy in ONT raw reads (though improving) may still be a limiting factor in compatibility.
5. CONCLUSION
Here, we show that the current MHC studies in non‐model species are dominated by methodologies with technical limitations, and these technical limitations may cause incorrect inferences about MHC diversity and species’ biology. We have presented a new method and analysis pipeline that overcomes the most common issues. This new method has allowed us to resolve MHC functional diversity in Tasmanian devil populations for the first time, solving the long‐standing problem of lacking a simple and accurate MHC typing assay for Tasmanian devil conservation. Our new approach provides a better solution to addressing research questions that require high MHC typing accuracy, such as MHC‐associated disease resistance/susceptibility and host‐pathogen adaptive co‐evolution. This approach is applicable to other complex gene families in non‐model species.
Benefit‐Sharing Statement
Benefits Generated: A research collaboration exists between the Tasmanian Government Save the Tasmanian Devil Program (STDP; the conservation managers for the species) who provide operational and logistic support, including access to information and genetic samples to undertake this study. The results of the research have been shared with the STDP and the broader scientific community (see data availability statement), and the research addresses a priority concern, in this case the conservation of the Tasmanian devil.
AUTHOR CONTRIBUTIONS
Yuanyuan Cheng, Catherine Grueber, Carolyn J Hogg, and Katherine Belov contributed to project design. Yuanyuan Cheng carried out the laboratory work, pipeline development, data analysis, and manuscript writing. All authors read and provided feedback on drafts of the manuscript.
Supporting information
Data S1
Data S2–S9
ACKNOWLEDGEMENTS
Thank you to the staff members of the STDP annual monitoring teams who collected the samples, in particular S. Fox, C. Lawrence, J. Elmer, B. Brown, D. Lee, P. Wise and B. Lazenby. Thank you also to the Toledo Zoo and Aquarium for their support of the SW Tasmania trapping trip, and the STDP annual monitoring programme. This work was funded by Australian Research Council Linkage Project LP180100244 in collaboration with the Tasmanian Department of Primary Industries, Parks, Water and Environment and San Diego Zoo Wildlife Alliance.
Cheng, Y. , Grueber, C. , Hogg, C. J. , & Belov, K. (2022). Improved high‐throughput MHC typing for non‐model species using long‐read sequencing. Molecular Ecology Resources, 22, 862–876. 10.1111/1755-0998.13511
Contributor Information
Yuanyuan Cheng, Email: yuanyuan.cheng@sydney.edu.au.
Katherine Belov, Email: kathy.belov@sydney.edu.au.
DATA AVAILABILITY STATEMENT
Sequence data generated during this work is available from NCBI Sequence Read Archive with accession number PRJNA715496. Data analysis tool presented in this work along with test data is available at https://github.com/yuanyuan929/bellerophon.
REFERENCES
- Aguilar, A. , Roemer, G. , Debenham, S. , Binns, M. , Garcelon, D. , & Wayne, R. K. (2004). High MHC diversity maintained by balancing selection in an otherwise genetically monomorphic mammal. Proceedings of the National Academy of Sciences, 101, 3490–3494. 10.1073/pnas.0306582101 [DOI] [PMC free article] [PubMed] [Google Scholar]
- Ambardar, S. , & Gowda, M. (2018). High‐Resolution Full‐Length HLA Typing Method Using Third Generation (Pac‐Bio SMRT) Sequencing Technology. In Boegel S. (Ed.), HLA Typing: Methods and Protocols (pp. 135–153). New York, NY, Springer, New. [DOI] [PubMed] [Google Scholar]
- Babik, W. (2010). Methods for MHC genotyping in non‐model vertebrates. Molecular Ecology Resources, 10(2), 237–251. 10.1111/j.1755-0998.2009.02788.x [DOI] [PubMed] [Google Scholar]
- Biedrzycka, A. , Sebastian, A. , Migalska, M. , Westerdahl, H. , & Radwan, J. (2017). Testing genotyping strategies for ultra‐deep sequencing of a co‐amplifying gene family: MHC class I in a passerine bird. Molecular Ecology Resources, 17(4), 642–655. 10.1111/1755-0998.12612 [DOI] [PubMed] [Google Scholar]
- Bjorkman, P. J. , & Parham, P. (1990). Structure, function, and diversity of class I major histocompatibility complex molecules. Annual Review of Biochemistry, 59, 253–288. 10.1146/annurev.bi.59.070190.001345 [DOI] [PubMed] [Google Scholar]
- Bunce, M. , O'Neill, C. M. , Barnardo, M. C. N. M. , Krausa, P. , Browning, M. J. , Morris, P. J. , & Welsh, K. I. (1995). Phototyping: comprehensive DNA typing for HLA‐A, B, C, DRB1, DRB3, DRB4, DRB5 & DQB1 by PCR with 144 primer mixes utilizing sequence‐specific primers (PCR‐SSP). Tissue Antigens 46(5), 355–367. [DOI] [PubMed] [Google Scholar]
- Caporaso, J. G. , Kuczynski, J. , Stombaugh, J. , Bittinger, K. , Bushman, F. D. , Costello, E. K. , Fierer, N. , Peña, A. G. , Goodrich, J. K. , Gordon, J. I. , Huttley, G. A. , Kelley, S. T. , Knights, D. , Koenig, J. E. , Ley, R. E. , Lozupone, C. A. , McDonald, D. , Muegge, B. D. , Pirrung, M. , … Knight, R. (2010). QIIME allows analysis of high‐throughput community sequencing data. Nature Methods, 7. 10.1038/nmeth.f.303 [DOI] [PMC free article] [PubMed] [Google Scholar]
- Castro‐Prieto, A. , Wachter, B. , & Sommer, S. (2011). Cheetah paradigm revisited: MHC diversity in the world's largest free‐ranging population. Molecular Biology and Evolution, 28, 1455–1468. 10.1093/molbev/msq330 [DOI] [PMC free article] [PubMed] [Google Scholar]
- Chang, C.‐J. , Chen, P.‐L. , Yang, W.‐S. , & Chao, K.‐M. (2014). A fault‐tolerant method for HLA typing with PacBio data. BMC Bioinformatics, 15(1), 296. 10.1186/1471-2105-15-296 [DOI] [PMC free article] [PubMed] [Google Scholar]
- Charton, M. (1981). Protein folding and the genetic code: An alternative quantitative model. Journal of Theoretical Biology, 91(1), 115–123. 10.1016/0022-5193(81)90377-5 [DOI] [PubMed] [Google Scholar]
- Cheng, Y. , & Belov, K. (2014). Characterisation of non‐classical MHC class I genes in the Tasmanian devil (Sarcophilus harrisii). Immunogenetics, 66(12), 727–735. 10.1007/s00251-014-0804-3 [DOI] [PubMed] [Google Scholar]
- Cheng, Y. , Sanderson, C. , Jones, M. , & Belov, K. (2012). Low MHC class II diversity in the Tasmanian devil (Sarcophilus harrisii). Immunogenetics, 64(7), 525–533. 10.1007/s00251-012-0614-4 [DOI] [PubMed] [Google Scholar]
- Cheng, Y. , Stuart, A. , Morris, K. , Taylor, R. , Siddle, H. , Deakin, J. , Jones, M. , Amemiya, C. , & Belov, K. (2012). Antigen‐presenting genes and genomic copy number variations in the Tasmanian devil MHC. BMC Genomics, 13(1), 87. 10.1186/1471-2164-13-87 [DOI] [PMC free article] [PubMed] [Google Scholar]
- Clarke, L. , & Carbon, J. (1976). A colony bank containing synthetic CoI EI hybrid plasmids representative of the entire E. coli genome. Cell, 9(1), 91–99. 10.1016/0092-8674(76)90055-6 [DOI] [PubMed] [Google Scholar]
- Cresswell, P. , Ackerman, A. L. , Giodini, A. , Peaper, D. R. , & Wearsch, P. A. (2005). Mechanisms of MHC class I‐restricted antigen processing and cross‐presentation. Immunological Reviews, 207, 145–157. 10.1111/j.0105-2896.2005.00316.x [DOI] [PubMed] [Google Scholar]
- Delport, W. , Poon, A. F. Y. , Frost, S. D. W. , & Kosakovsky Pond, S. L. (2010). Datamonkey 2010: a suite of phylogenetic analysis tools for evolutionary biology. Bioinformatics, 26(19), 2455–2457. 10.1093/bioinformatics/btq429 [DOI] [PMC free article] [PubMed] [Google Scholar]
- Doxiadis, G. G. M. , de Groot, N. , Claas, F. H. J. , Doxiadis, I. I. N. , van Rood, J. J. , & Bontrop, R. E. (2007). A highly divergent microsatellite facilitating fast and accurate DRB haplotyping in humans and rhesus macaques. Proceedings of the National Academy of Sciences, 104, 8907–8912. 10.1073/pnas.0702964104 [DOI] [PMC free article] [PubMed] [Google Scholar]
- Dudek, K. , Gaczorek, T. S. , Zielinski, P. , & Babik, W. (2019). Massive introgression of major histocompatibility complex (MHC) genes in newt hybrid zones. Molecular Ecology, 28(21), 4798–4810. 10.1111/mec.15254 [DOI] [PubMed] [Google Scholar]
- Edgar, R. C. (2016). UCHIME2: improved chimera prediction for amplicon sequencing. 074252.
- Edwards, S. V. , & Potts, W. K. (1996). Polymorphism of genes in the major histocompatibility complex: implications for conservation genetics of vertebrates. In Smith T. B., & Wayne R. K. (Eds.), Molecular genetic approaches in conservation. Oxford University Press. [Google Scholar]
- Falk, K. , Rötzschke, O. , Stevanovié, S. , Jung, G. , & Rammensee, H.‐G. (1991). Allele‐specific motifs revealed by sequencing of self‐peptides eluted from MHC molecules. Nature, 351(6324), 290–296. [DOI] [PubMed] [Google Scholar]
- Faulks, L. K. , & Ostman, O. (2016). Adaptive major histocompatibility complex (MHC) and neutral genetic variation in two native Baltic Sea fishes (perch Perca fluviatilis and zander Sander lucioperca) with comparisons to an introduced and disease susceptible population in Australia (P‐fluviatilis): assessing the risk of disease epidemics. Journal of Fish Biology, 88(4), 1564–1583. 10.1111/jfb.12930 [DOI] [PubMed] [Google Scholar]
- Ferrandiz‐Rovira, M. , Allaine, D. , Callait‐Cardinal, M. P. , & Cohas, A. (2016). Mate choice for neutral and MHC genetic characteristics in Alpine marmots: different targets in different contexts? Ecology and Evolution, 6(13), 4243–4257. 10.1002/ece3.2189 [DOI] [PMC free article] [PubMed] [Google Scholar]
- Fuselli, S. , Baptista, R. P. , Panziera, A. , Magi, A. , Guglielmi, S. , Tonin, R. , Benazzo, A. , Bauzer, L. G. , Mazzoni, C. J. , & Bertorelle, G. (2018). A new hybrid approach for MHC genotyping: high‐throughput NGS and long read MinION nanopore sequencing, with application to the non‐model vertebrate Alpine chamois (Rupicapra rupicapra). Heredity, 121(4), 293–303. 10.1038/s41437-018-0070-5 [DOI] [PMC free article] [PubMed] [Google Scholar]
- Gonzalez, J. M. , Zimmermann, J. , & Saiz‐Jimenez, C. (2004). Evaluating putative chimeric sequences from PCR‐amplified products. Bioinformatics, 21(3), 333–337. 10.1093/bioinformatics/bti008 [DOI] [PubMed] [Google Scholar]
- Grogan, K. E. , McGinnis, G. J. , Sauther, M. L. , Cuozzo, F. P. , & Drea, C. M. (2016). Next‐generation genotyping of hypervariable loci in many individuals of a non‐model species: technical and theoretical implications. BMC Genomics, 17. 10.1186/s12864-016-2503-y [DOI] [PMC free article] [PubMed] [Google Scholar]
- Haas, B. J. , Gevers, D. , Earl, A. M. , Feldgarden, M. , Ward, D. V. , Giannoukos, G. , Ciulla, D. , Tabbaa, D. , Highlander, S. K. , Sodergren, E. , Methe, B. , DeSantis, T. Z. , Petrosino, J. F. , Knight, R. , & Birren, B. W. (2011). Chimeric 16S rRNA sequence formation and detection in Sanger and 454‐pyrosequenced PCR amplicons. Genome Research, 21(3), 494–504. 10.1101/gr.112730.110 [DOI] [PMC free article] [PubMed] [Google Scholar]
- Hughes, A. L. (1999). Adaptive evolution of genes and genomes. Oxford University Press. [Google Scholar]
- Iglesias, G. M. , Canet, Z. E. , Cantaro, H. , Miquel, M. C. , Melo, J. E. , Miller, M. M. , Berres, M. E. , & Fulton, J. E. (2019). Mhc‐B haplotypes in "Campero‐Inta" chicken synthetic line. Poultry Science, 98(11), 5281–5286. 10.3382/ps/pez431 [DOI] [PubMed] [Google Scholar]
- Ivády, G. , Madar, L. , Dzsudzsák, E. , Koczok, K. , Kappelmayer, J. , Krulisova, V. , Macek, M. Jr , Horváth, A. , & Balogh, I. (2018). Analytical parameters and validation of homopolymer detection in a pyrosequencing‐based next generation sequencing system. BMC Genomics, 19(1), 158. 10.1186/s12864-018-4544-x [DOI] [PMC free article] [PubMed] [Google Scholar]
- Karl, J. A. , Heimbruch, K. E. , Vriezen, C. E. , Mironczuk, C. J. , Dudley, D. M. , Wiseman, R. W. , & O’Connor, D. H. (2014). Survey of major histocompatibility complex class II diversity in pig‐tailed macaques. Immunogenetics, 66(11), 613–623. 10.1007/s00251-014-0797-y [DOI] [PMC free article] [PubMed] [Google Scholar]
- Kosakovsky Pond, S. L. , & Frost, S. D. W. (2005). Not so different after all: A comparison of methods for detecting amino acid sites under selection. Molecular Biology and Evolution, 22(5), 1208–1222. 10.1093/molbev/msi105 [DOI] [PubMed] [Google Scholar]
- Kosakovsky Pond, S. L. , Scheffler, K. , Gravenor, M. B. , Poon, A. F. , & Frost, S. D. (2009). Evolutionary fingerprinting of genes. Molecular Biology and Evolution, 27(3), 520–536. 10.1093/molbev/msp260 [DOI] [PMC free article] [PubMed] [Google Scholar]
- Kosch, T. A. , Silva, C. N. S. , Brannelly, L. A. , Roberts, A. A. , Lau, Q. , Marantelli, G. , Berger, L. , & Skerratt, L. F. (2019). Genetic potential for disease resistance in critically endangered amphibians decimated by chytridiomycosis. Animal Conservation, 22(3), 238–250. 10.1111/acv.12459 [DOI] [Google Scholar]
- Kyte, J. , & Doolittle, R. F. (1982). A simple method for displaying the hydropathic character of a protein. Journal of Molecular Biology, 157(1), 105–132. 10.1016/0022-2836(82)90515-0 [DOI] [PubMed] [Google Scholar]
- Lan, H. , Zhou, T. , Wan, Q. H. , & Fang, S. G. (2019). Genetic Diversity And Differentiation At Structurally Varying MHC haplotypes and microsatellites in bottlenecked populations of endangered crested ibis. Cells, 8(4), 377. 10.3390/cells8040377 [DOI] [PMC free article] [PubMed] [Google Scholar]
- Lane, A. , Cheng, Y. , Wright, B. , Hamede, R. , Levan, L. , Jones, M. , Ujvari, B. , & Belov, K. (2012). New insights into the role of MHC diversity in devil facial tumour disease. PLoS One, 7(6), e36955. 10.1371/journal.pone.0036955 [DOI] [PMC free article] [PubMed] [Google Scholar]
- Liu, J. , Song, H. , Liu, D. , Zuo, T. , Lu, F. , Zhuang, H. , & Gao, F. (2014). Extensive recombination due to heteroduplexes generates large amounts of artificial gene fragments during PCR. PLoS One, 9(9), e106658. 10.1371/journal.pone.0106658 [DOI] [PMC free article] [PubMed] [Google Scholar]
- Maibach, V. , Hans, J. B. , Hvilsom, C. , Marques‐Bonet, T. , & Vigilant, L. (2017). MHC class I diversity in chimpanzees and bonobos. Immunogenetics, 69(10), 661–676. 10.1007/s00251-017-0990-x [DOI] [PMC free article] [PubMed] [Google Scholar]
- Marmesat, E. , Soriano, L. , Mazzoni, C. J. , Sommer, S. , & Godoy, J. A. (2016). PCR strategies for complete allele calling in multigene families using high‐throughput sequencing approaches. PLoS One, 11(6), e0157402. 10.1371/journal.pone.0157402 [DOI] [PMC free article] [PubMed] [Google Scholar]
- Matzaraki, V. , Kumar, V. , Wijmenga, C. , & Zhernakova, A. (2017). The MHC locus and genetic susceptibility to autoimmune and infectious diseases. Genome Biology, 18(1), 76. 10.1186/s13059-017-1207-1 [DOI] [PMC free article] [PubMed] [Google Scholar]
- Miller, W. , Hayes, V. M. , Ratan, A. , Petersen, D. C. , Wittekindt, N. E. , Miller, J. , Walenz, B. , Knight, J. , Qi, J. , Zhao, F. , Wang, Q. , Bedoya‐Reina, O. C. , Katiyar, N. , Tomsho, L. P. , Kasson, L. M. , Hardie, R.‐A. , Woodbridge, P. , Tindall, E. A. , Bertelsen, M. F. , … Schuster, S. C. (2011). Genetic diversity and population structure of the endangered marsupial Sarcophilus harrisii (Tasmanian devil). Proceedings of the National Academy of Sciences, 108(30), 12348–12353. 10.1073/pnas.1102838108 [DOI] [PMC free article] [PubMed] [Google Scholar]
- Murchison, E. P. , Tovar, C. , Hsu, A. , Bender, H. S. , Kheradpour, P. , Rebbeck, C. A. , Obendorf, D. , Conlan, C. , Bahlo, M. , Blizzard, C. A. , Pyecroft, S. , Kreiss, A. , Kellis, M. , Stark, A. , Harkins, T. T. , Graves, J. A. M. , Woods, G. M. , Hannon, G. J. , & Papenfuss, A. T. (2010). The Tasmanian devil transcriptome reveals Schwann cell origins of a clonally transmissible cancer. Science, 327(5961), 84–87. [DOI] [PMC free article] [PubMed] [Google Scholar]
- Murrell, B. , Wertheim, J. O. , Moola, S. , Weighill, T. , Scheffler, K. , & Kosakovsky Pond, S. L. (2012). Detecting individual sites subject to episodic diversifying selection. PLoS Genetics, 8(7), e1002764. 10.1371/journal.pgen.1002764 [DOI] [PMC free article] [PubMed] [Google Scholar]
- O'Brien, S. , & Evermann, J. (1988). Interactive influence of infectious disease and genetic diversity in natural populations. Trends in Ecology & Evolution, 3, 254–259. 10.1016/0169-5347(88)90058-4 [DOI] [PMC free article] [PubMed] [Google Scholar]
- O'Brien, S. J. , Roelke, M. E. , Marker, L. , Newman, A. , Winkler, C. A. , Meltzer, D. , Colly, L. , Evermann, J. F. , Bush, M. , & Wildt, D. E. (1985). Genetic basis for species vulnerability in the cheetah. Science, 227, 1428–1434. 10.1126/science.2983425 [DOI] [PubMed] [Google Scholar]
- Otting, N. , de Vos‐Rouweler, A. J. M. , Heijmans, C. M. C. , de Groot, N. G. , Doxiadis, G. G. M. , & Bontrop, R. E. (2007). MHC class I A region diversity and polymorphism in macaque species. Immunogenetics, 59(5), 367–375. 10.1007/s00251-007-0201-2 [DOI] [PMC free article] [PubMed] [Google Scholar]
- Pacific Biosciences (2020) Procedure & Checklist ‐ Preparing SMRTbell Libraries using PacBio Barcoded Universal Primers for Multiplexing Amplicons.
- Pearse, A. M. , & Swift, K. (2006). Allograft theory: transmission of devil facial‐tumour disease. Nature, 439, 549. [DOI] [PubMed] [Google Scholar]
- Pearson, S. K. , Bradford, T. M. , Ansari, T. H. , Bull, C. M. , & Gardner, M. G. (2016). MHC genotyping from next‐generation sequencing: detailed methodology for the gidgee skink, Egernia stokesii. Transactions of the Royal Society of South Australia, 140(2), 244–262. [Google Scholar]
- Perrin, A. , Khimoun, A. , Faivre, B. , Ollivier, A. , de Pracontal, N. , Theron, F. , Loubon, M. , Leblond, G. , Duron, O. , & Garnier, S. (2021). Habitat fragmentation differentially shapes neutral and immune gene variation in a tropical bird species. Heredity, 126(1), 148–162. 10.1038/s41437-020-00366-w [DOI] [PMC free article] [PubMed] [Google Scholar]
- Phillips, K. P. , Cable, J. , Mohammed, R. S. , Herdegen‐Radwan, M. , Raubic, J. , Przesmycka, K. J. , van Oosterhout, C. , & Radwan, J. (2018). Immunogenetic novelty confers a selective advantage in host‐pathogen coevolution. Proceedings of the National Academy of Sciences of USA, 115(7), 1552–1557. 10.1073/pnas.1708597115 [DOI] [PMC free article] [PubMed] [Google Scholar]
- Piazza, F. , & Liò, P. (2005). Statistical analysis of simple repeats in the human genome. Physica A: Statistical Mechanics and Its Applications, 347, 472–488. 10.1016/j.physa.2004.08.038 [DOI] [Google Scholar]
- Pieters, J. (2000). MHC class II‐restricted antigen processing and presentation. Advances in Immunology, 75, 159–208. [DOI] [PubMed] [Google Scholar]
- Pineaux, M. , Merkling, T. , Danchin, E. , Hatch, S. , Duneau, D. , Blanchard, P. , & Leclaire, S. (2020). Sex and hatching order modulate the association between MHC‐II diversity and fitness in early‐life stages of a wild seabird. Molecular Ecology, 29(17), 3316–3329. 10.1111/mec.15551 [DOI] [PubMed] [Google Scholar]
- Promerova, M. , Babik, W. , Bryja, J. , Albrecht, T. , Stuglik, M. , & Radwan, J. (2012). Evaluation of two approaches to genotyping major histocompatibility complex class I in a passerine—CE‐SSCP and 454 pyrosequencing. Molecular Ecology Resources, 12(2), 285–292. 10.1111/j.1755-0998.2011.03082.x [DOI] [PubMed] [Google Scholar]
- Pye, R. , Hamede, R. , Siddle, H. V. , Caldwell, A. , Knowles, G. W. , Swift, K. , Kreiss, A. , Jones, M. E. , Lyons, A. B. , & Woods, G. M. (2016). Demonstration of immune responses against devil facial tumour disease in wild Tasmanian devils. Biology Letters, 12(10). 10.1098/rsbl.2016.0553 [DOI] [PMC free article] [PubMed] [Google Scholar]
- Pye, R. J. , Pemberton, D. , Tovar, C. , Tubio, J. M. C. , Dun, K. A. , Fox, S. , Darby, J. , Hayes, D. , Knowles, G. W. , Kreiss, A. , Siddle, H. V. T. , Swift, K. , Lyons, A. B. , Murchison, E. P. , & Woods, G. M. (2016). A second transmissible cancer in Tasmanian devils. Proceedings of the National Academy of Sciences, 113(2), 374–379. 10.1073/pnas.1519691113 [DOI] [PMC free article] [PubMed] [Google Scholar]
- Qiu, X. , Wu, L. , Huang, H. , McDonel, P. E. , Palumbo, A. V. , Tiedje, J. M. , & Zhou, J. (2001). Evaluation of PCR‐Generated Chimeras, Mutations, and Heteroduplexes with 16S rRNA Gene‐Based. Cloning, 67(2), 880–887. 10.1128/AEM.67.2.880-887.2001 [DOI] [PMC free article] [PubMed] [Google Scholar]
- Radzicka, A. , & Wolfenden, R. (1988). Comparing the polarities of the amino acids: side‐chain distribution coefficients between the vapor phase, cyclohexane, 1‐octanol, and neutral aqueous solution. Biochemistry, 27(5), 1664–1670. 10.1021/bi00405a042 [DOI] [Google Scholar]
- Rekdal, S. L. , Anmarkrud, J. A. , Johnsen, A. , & Lifjeld, J. T. (2018). Genotyping strategy matters when analyzing hypervariable major histocompatibility complex‐Experience from a passerine bird. Ecology and Evolution, 8(3), 1680–1692. 10.1002/ece3.3757 [DOI] [PMC free article] [PubMed] [Google Scholar]
- Robbins, A. , Hanger, J. , Jelocnik, M. , Quigley, B. L. , & Timms, P. (2020). Koala immunogenetics and chlamydial strain type are more directly involved in chlamydial disease progression in koalas from two south east Queensland koala populations than koala retrovirus subtypes. Scientific Reports, 10(1). 10.1038/s41598-020-72050-2 [DOI] [PMC free article] [PubMed] [Google Scholar]
- Robinson, J. , Halliwell, J. A. , Hayhurst, J. D. , Flicek, P. , Parham, P. , & Marsh, S. G. E. (2015). The IPD and IMGT/HLA database: allele variant databases. Nucleic Acids Research, 43(Database issue), D423–D431. 10.1093/nar/gku1161 [DOI] [PMC free article] [PubMed] [Google Scholar]
- Santos, P. S. C. , Michler, F. U. , & Sommer, S. (2017). Can MHC‐assortative partner choice promote offspring diversity? A new combination of MHC‐dependent behaviours among sexes in a highly successful invasive mammal. Molecular Ecology, 26(8), 2392–2404. 10.1111/mec.14035 [DOI] [PubMed] [Google Scholar]
- Schwensow, N. , Castro‐Prieto, A. , Wachter, B. , & Sommer, S. (2019). Immunological MHC supertypes and allelic expression: how low is the functional MHC diversity in free‐ranging Namibian cheetahs? Conservation Genetics, 20(1), 65–80. 10.1007/s10592-019-01143-x [DOI] [Google Scholar]
- Scrucca, L. , Fop, M. , Murphy, T. B. , & Raftery, A. E. (2016). mclust 5: Clustering, classification and density estimation using Gaussian finite mixture models. The R Journal, 8(1), 289–317. 10.32614/RJ-2016-021 [DOI] [PMC free article] [PubMed] [Google Scholar]
- Setchell, J. M. , Richards, S. A. , Abbott, K. M. , & Knappe, L. A. (2016). Mate‐guarding by male mandrills (Mandrillus sphinx) is associated with female MHC genotype. Behavioral Ecology, 27(6), 1756–1766. [Google Scholar]
- Siddle, H. V. , Kreiss, A. , Eldridge, M. D. B. , Noonan, E. , Clarke, C. J. , Pyecroft, S. , Woods, G. M. , & Belov, K. (2007). Transmission of a fatal clonal tumor by biting occurs due to depleted MHC diversity in a threatened carnivorous marsupial. Proceedings of the National Academy of Sciences, 104, 16221–16226. 10.1073/pnas.0704580104 [DOI] [PMC free article] [PubMed] [Google Scholar]
- Siddle, H. V. , Marzec, J. , Cheng, Y. , Jones, M. , & Belov, K. (2010). MHC gene copy number variation in Tasmanian devils: implications for the spread of a contagious cancer. Proceedings of the Royal Society B: Biological Sciences, 277(1690), 2001–2006. [DOI] [PMC free article] [PubMed] [Google Scholar]
- Sidney, J. , Peters, B. , Frahm, N. , Brander, C. , & Sette, A. (2008). HLA class I supertypes: A revised and updated classification. BMC Immunology, 9(1), 1. 10.1186/1471-2172-9-1 [DOI] [PMC free article] [PubMed] [Google Scholar]
- Söding, J. (2005). Protein homology detection by HMM‐HMM comparison. Bioinformatics, 21(7), 951–960. 10.1093/bioinformatics/bti125 [DOI] [PubMed] [Google Scholar]
- Sommer, S. (2005). The importance of immune gene variability (MHC) in evolutionary ecology and conservation. Frontiers in Zoology, 2, 16. 10.1186/1742-9994-2-16 [DOI] [PMC free article] [PubMed] [Google Scholar]
- Sommer, S. , Courtiol, A. , & Mazzoni, C. J. (2013). MHC genotyping of non‐model organisms using next‐generation sequencing: a new methodology to deal with artefacts and allelic dropout. BMC Genomics, 14(1), 542. 10.1186/1471-2164-14-542 [DOI] [PMC free article] [PubMed] [Google Scholar]
- Stephens, M. , & Scheet, P. (2005). Accounting for decay of linkage disequilibrium in haplotype inference and missing‐data imputation. American Journal of Human Genetics, 76(3), 449–462. 10.1086/428594 [DOI] [PMC free article] [PubMed] [Google Scholar]
- Stephens, M. , Smith, N. J. , & Donnelly, P. (2001). A new statistical method for haplotype reconstruction from population data. The American Journal of Human Genetics, 68(4), 978–989. 10.1086/319501 [DOI] [PMC free article] [PubMed] [Google Scholar]
- Talarico, L. , Babik, W. , Marta, S. , & Mattoccia, M. (2019). Genetic drift shaped MHC IIB diversity of an endangered anuran species within the Italian glacial refugium. Journal of Zoology, 307(1), 61–70. 10.1111/jzo.12617 [DOI] [Google Scholar]
- Thompson, J. R. , Marcelino, L. A. , & Polz, M. F. (2002). Heteroduplexes in mixed‐template amplifications: formation, consequence and elimination by ‘reconditioning PCR'. Nucleic Acids Research, 30(9), 2083–2088. 10.1093/nar/30.9.2083 [DOI] [PMC free article] [PubMed] [Google Scholar]
- Tovar, C. , Pye, R. J. , Kreiss, A. , Cheng, Y. , Brown, G. K. , Darby, J. , Malley, R. C. , Siddle, H. V. T. , Skjødt, K. , Kaufman, J. , Silva, A. , Baz, M. A. , Papenfuss, A. T. , Corcoran, L. M. , Murphy, J. M. , Pearse, M. J. , Belov, K. , Lyons, A. B. , & Woods, G. M. (2017). Regression of devil facial tumour disease following immunotherapy in immunised Tasmanian devils. Scientific Reports, 7, 43827. 10.1038/srep43827 [DOI] [PMC free article] [PubMed] [Google Scholar]
- Trowsdale, J. (2011). The MHC, disease and selection. Immunology Letters, 137(1–2), 1–8. 10.1016/j.imlet.2011.01.002 [DOI] [PubMed] [Google Scholar]
- Trowsdale, J. , & Parham, P. (2004). Mini‐review: Defense strategies and immunity‐related genes. European Journal of Immunology, 34, 7–17. 10.1002/eji.200324693 [DOI] [PubMed] [Google Scholar]
- Vasoya, D. , Law, A. , Motta, P. , Yu, M. Y. , Muwonge, A. , Cook, E. , Li, X. Y. , Bryson, K. , MacCallam, A. , Sitt, T. , Toye, P. , Bronsvoort, B. , Watson, M. , Morrison, W. I. , & Connelley, T. (2016). Rapid identification of bovine MHCI haplotypes in genetically divergent cattle populations using next‐generation sequencing. Immunogenetics, 68(10), 765–781. 10.1007/s00251-016-0945-7 [DOI] [PMC free article] [PubMed] [Google Scholar]
- Wang, Q. , Wang, F. , Liu, L. , Li, Q. H. , Liu, R. R. , Zheng, M. Q. , Cui, H. X. , Wen, J. , & Zhao, G. P. (2019). Genetic Mutation Analysis of High and Low IgY Chickens by Capture Sequencing. Animals, 9(5), 272. 10.3390/ani9050272 [DOI] [PMC free article] [PubMed] [Google Scholar]
- Weirather, J. , de Cesare, M. , Wang, Y. , Piazza, P. , Sebastiano, V. , Wang, X. , Buck, D. , & Au, K. (2017). Comprehensive comparison of Pacific Biosciences and Oxford Nanopore Technologies and their applications to transcriptome analysis [version 2; peer review: 2 approved]. 6(100). [DOI] [PMC free article] [PubMed]
- Wise, P. , Peck, S. , Clarke, J. , & Hogg, C. J. (2019). Conservation introduction of Tasmanian devils to Maria Island: a managed response to DFTD. In Hogg C. J., Fox S., Pemberton D., & Belov K. (Eds.), Saving the Tasmanian devil: recovery through science based management (pp. 223–236). CSIRO Publishing. [Google Scholar]
- Yi, X. L. , Donner, D. M. , Marquardt, P. E. , Palmer, J. M. , Jusino, M. A. , Frair, J. , Lindner, D. L. , & Latch, E. K. (2020). Major histocompatibility complex variation is similar in little brown bats before and after white‐nose syndrome outbreak. Ecology and Evolution, 10(18), 10031–10043. 10.1002/ece3.6662 [DOI] [PMC free article] [PubMed] [Google Scholar]
Associated Data
This section collects any data citations, data availability statements, or supplementary materials included in this article.
Supplementary Materials
Data S1
Data S2–S9
Data Availability Statement
Sequence data generated during this work is available from NCBI Sequence Read Archive with accession number PRJNA715496. Data analysis tool presented in this work along with test data is available at https://github.com/yuanyuan929/bellerophon.