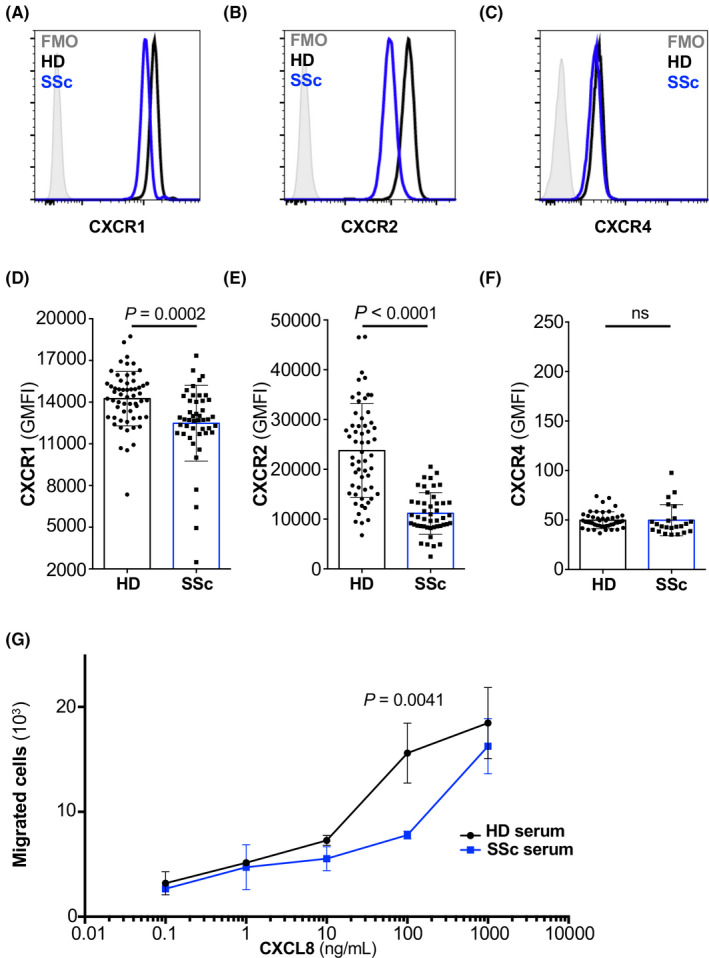
FIGURE 3.

Systemic sclerosis neutrophils lack CXCR1 and CXCR2. (A–C) Representative histogram of the expression of CXCR1 (A), CXCR2 (B), and CXCR4 (C) on freshly isolated neutrophils of HDs (black line) and SSc (blue line). (D–F) Bar histogram of the geometric mean fluorescence (GMFI) of CXCR1 (D), CXCR2 (E), and CXCR4 (F) on freshly isolated neutrophils of HDs (n = 58 for CXCR1 and CXCR2, and n = 45 for CXCR4) and SSc (n = 46 for CXCR1 and CXCR2, and n = 23 for CXCR4). Data are shown as mean ± standard deviation (SD) of several donors. Each dot represents an independent and unrelated donor. (G) Chemotaxis of HD neutrophils toward titrated concentrations of CXCL8 (in ng/ml) following stimulation for 2 h with HD serum (10% in RPMI 1640; black line) or SSc serum (10% in RPMI 1640; blue line). Significance of differences between groups was calculated using Student's t‐test (A–F) or two‐way ANOVA (G); ns, not significant
