

Abstract
Objective
We evaluated the efficacy and safety of pomalidomide, bortezomib, and dexamethasone (PVd) vs bortezomib and dexamethasone (Vd) by age, renal function, and high‐risk cytogenetic abnormalities in lenalidomide‐pretreated patients with multiple myeloma at first relapse.
Methods
OPTIMISMM was a phase 3, multicenter, open‐label, randomized study (NCT01734928; N = 559). The primary endpoint was progression‐free survival (PFS).
Results
Overall, 226 patients had received one prior line of therapy. PVd significantly prolonged PFS vs Vd in patients aged ≤65 years (median, 22.0 vs 13.1 months; P = .0258) and >65 years (median, 17.6 vs 9.9 months; P = .0369). Median PFS in patients with renal impairment (RI; creatinine clearance <60 mL/min) was 15.1 months with PVd vs 9.5 months with Vd (hazard ratio [HR], 0.67 [95% CI, 0.34‐1.34]). In patients without RI, median PFS was 22.0 vs 13.1 months (HR, 0.45 [95% CI, 0.27‐0.76]). In patients with high‐risk cytogenetics, median PFS was 14.7 vs 9.9 months (HR, 0.39 [95% CI, 0.13‐1.17]). PVd significantly improved overall response rate vs Vd in all subgroups. The safety profile of PVd was consistent with previous reports.
Conclusions
These findings confirmed the benefits of PVd at first relapse, including in patients with poor prognostic factors.
Keywords: aged, chromosome aberrations, multiple myeloma, pomalidomide, renal insufficiency
1. INTRODUCTION
Patients with multiple myeloma (MM) have experienced improved outcomes in recent years with the introduction of novel agents and combinations, yet the disease remains incurable, and treatment of patients with clinically relevant prognostic factors requires careful consideration. 1 , 2 Patients with MM are predominantly older adults (median age at diagnosis, 66 years), and advanced age is associated with a lower survival rate, in part due to comorbidities and frailty, which can greatly impact the ability to tolerate current therapies. 3 , 4 , 5 Renal impairment (RI) is also a common characteristic of patients with MM that confers a worse prognosis. 6 The incidence of RI is 20% to 30% at MM diagnosis and increases throughout the disease course. 7 Patients with RI have a higher disease burden and poorer outcomes than patients with normal renal function. 6 , 8 Furthermore, patients with high‐risk cytogenetic abnormalities, such as del(17p), t(4;14), or t(14;16), have shorter survival than those with standard‐risk cytogenetic profiles. 9 , 10 , 11
For patients with newly diagnosed MM, lenalidomide‐based therapy until disease progression is a standard treatment. 12 , 13 Accordingly, patients for whom the benefits of lenalidomide have been exhausted early in the course of treatment are in need of proven options for subsequent therapy. 13 Pomalidomide, an oral immunomodulatory agent, has demonstrated antimyeloma activity in the context of lenalidomide resistance and is the only agent that has been extensively studied in patients previously treated with lenalidomide, including those who received pomalidomide immediately after lenalidomide. 14 , 15 , 16 , 17 Pomalidomide has also demonstrated antimyeloma activity synergistic with multiple agents, supporting its integration into novel triplet regimens. 16 , 18 , 19 , 20 , 21 , 22 , 23 The combination of pomalidomide, bortezomib, and dexamethasone (PVd) was approved in the European Union and other countries on the basis of the findings of the registrational phase 3 OPTIMISMM study in lenalidomide‐pretreated patients (70% with lenalidomide‐refractory disease) with relapsed or refractory MM (RRMM) in early lines of therapy (median of two prior lines of therapy). 17 , 24 , 25 Progression‐free survival (PFS) was significantly improved with PVd vs bortezomib and dexamethasone (Vd) alone (median, 11.2 vs 7.1 months; hazard ratio [HR], 0.61 [95% CI, 0.49‐0.77]; P < .0001). 17 A subanalysis of OPTIMISMM demonstrated the benefit of PVd at first relapse (median PFS, 20.7 vs 11.6 months with Vd; HR, 0.54 [95% CI, 0.36‐0.82]; P = .0027), including immediately after frontline lenalidomide treatment failure and other common first‐line interventions. 17 , 26
The importance of prognostic factors in determining optimal antimyeloma therapy was considered when we performed a post hoc subanalysis of the OPTIMISMM trial to investigate the efficacy and safety of PVd vs Vd at first relapse (ie, after only one prior line of therapy) by age (≤65 vs >65 years), baseline renal function (creatinine clearance [CrCl] <60 vs ≥60 mL/min), and high‐risk cytogenetic abnormalities.
2. METHODS
2.1. Study design and patients
The randomized, open‐label, controlled, phase 3 OPTIMISMM trial was conducted at 133 hospitals and research centers in 21 countries. 17 Details of participants, study treatments, and procedures have been reported previously. 17 Patients aged ≥18 years who had a diagnosis of MM, measurable disease, Eastern Cooperative Oncology Group performance status of ≤2, one to three prior regimens (including at least two cycles of lenalidomide therapy), and investigator‐determined progressive disease were enrolled. Patients with disease refractory to lenalidomide (including those who received lenalidomide in their last prior regimen) or bortezomib (defined as bortezomib‐treated patients with disease that had progressed on or within 60 days of bortezomib administration on a once‐weekly schedule or at a dose of <1.3 mg/m2 of body surface area) were eligible. Patients exposed to bortezomib were ineligible if they had progressive disease during treatment or within 60 days of the last dose of a bortezomib‐containing regimen administered at 1.3 mg/m2 of body surface area twice weekly. Other key exclusion criteria were CrCl <30 mL/min requiring dialysis, grade ≥3 peripheral neuropathy, or grade 2 peripheral neuropathy with pain. All patients provided written informed consent. The study protocol was approved by the institutional review board or central or local ethics committee at each participating site. The study conformed to the principles of Good Clinical Practice according to the International Council for Harmonisation requirements and the Declaration of Helsinki. The trial is registered with ClinicalTrials.gov (NCT01734928).
As previously reported, patients were randomized 1:1 to receive PVd or Vd using a validated interactive response technology system. 17 Randomization was stratified based on age (≤75 vs >75 years), number of previous regimens (one vs more than one), and concentration of β2‐microglobulin at screening (<3.5 vs 3.5‐5.5 vs >5.5 mg/L). Treatment assignments were not masked.
2.2. Treatments
Treatment was administered in 21‐day cycles until disease progression or unacceptable toxicity. Patients in the PVd group received pomalidomide 4 mg/day orally on days 1 to 14. All patients received bortezomib 1.3 mg/m2 intravenously until protocol amendment 1 (March 27, 2014); then patients received either intravenous or subcutaneous bortezomib on days 1, 4, 8, and 11 of cycles 1 through 8 and on days 1 and 8 of cycles 9 and beyond. Dexamethasone was given orally (20 mg for patients aged ≤75 years; otherwise, 10 mg) on the days of and after bortezomib administration.
Bone marrow samples for qualitative cytogenetic assessment by fluorescence in situ hybridization were collected at screening and complete response. High‐risk cytogenetics were defined as the detection of at least one of the following abnormalities: del(17p), t(4;14), or t(14;16).
2.3. Outcomes and assessments
The primary endpoint was PFS in the intention‐to‐treat population as assessed by an independent review committee. Prespecified secondary endpoints were overall survival, overall response rate (ORR) as assessed by International Myeloma Working Group criteria, duration of response, and safety. Data for overall survival were not mature at the planned interim analysis (data cutoff, October 26, 2017). Time to response (TTR) was an exploratory endpoint. Adverse events were graded according to the National Cancer Institute Common Terminology Criteria for Adverse Events (version 4.0 or higher) and were summarized by system organ class and preferred term.
2.4. Statistical analysis
Primary, secondary, and exploratory analyses were conducted in the intention‐to‐treat population, which comprised all randomized patients. Safety analyses were conducted in the safety population, consisting of all patients who received at least one dose of study medication. Efficacy analyses in the subgroups were not adjusted by stratification factors. PFS was estimated using the Kaplan‐Meier method. The treatment effect (measured by HR and 95% CI) was compared using a Cox proportional hazards model and a log‐rank test with a two‐sided P value. Fisher's exact test was used to compare responses. SAS software (version 9.2; SAS Institute Inc, Cary, NC, USA) was used for statistical analysis.
3. RESULTS
3.1. Patients
Results from the intention‐to‐treat population of OPTIMISMM, consisting of 559 patients, have been previously published. 17 A total of 226 patients who had received only one prior line of therapy were included in this subgroup analysis (Table 1). Of these, 100 patients (44.2%) were aged ≤65 years (49 in the PVd group and 51 in the Vd group), and 126 (55.8%) were aged >65 years (62 in the PVd group and 64 in the Vd group). CrCl <60 mL/min at baseline was reported in 63 patients (27.9%; 35 in the PVd group and 28 in the Vd group), and CrCl ≥60 mL/min was reported in 163 patients (72.1%; 76 in the PVd group and 87 in the Vd group). High‐risk cytogenetic abnormalities were detected in 32 patients (14.2%; 18 in the PVd group and 14 in the Vd group). Within each subgroup, baseline characteristics were generally well balanced between treatment arms. Patients with RI (CrCl <60 mL/min) were older, more likely to have International Staging System stage III disease at study entry, and less likely to have undergone prior autologous stem cell transplant than those with normal renal function (CrCl ≥60 mL/min) at baseline. Among patients with high‐risk cytogenetic abnormalities, patients in the PVd group were younger than those in the Vd group (median age, 59.5 vs 65.5 years) and less likely to be male (44.4% vs 57.1%).
TABLE 1.
Baseline characteristics of patients who received one prior line of therapy by age, renal function, and high‐risk cytogenetic abnormalities
| Characteristic | Aged ≤65 y | Aged >65 y | CrCl <60 mL/min | CrCl ≥60 mL/min | High‐risk cytogenetics | |||||
|---|---|---|---|---|---|---|---|---|---|---|
| PVd (n = 49) | Vd (n = 51) | PVd (n = 62) | Vd (n = 64) | PVd (n = 35) | Vd (n = 28) | PVd (n = 76) | Vd (n = 87) | PVd (n = 18) | Vd (n = 14) | |
| Age, median (range), y | 58 (29‐65) | 59 (27‐65) | 73 (66‐87) | 71.5 (66‐89) | 74 (57‐82) | 73 (57‐89) | 62 (29‐87) | 64 (27‐81) | 59.5 (38‐77) | 65.5 (55‐84) |
| >65 y, n (%) | 0 | 0 | 62 (100) | 64 (100) | 32 (91.4) | 24 (85.7) | 30 (39.5) | 40 (46.0) | 6 (33.3) | 7 (50.0) |
| >75 years, n (%) | 0 | 0 | 16 (25.8) | 18 (28.1) | 14 (40.0) | 11 (39.3) | 2 (2.6) | 7 (8.0) | 1 (5.6) | 1 (7.1) |
| Male, n (%) | 31 (63.3) | 24 (47.1) | 36 (58.1) | 33 (51.6) | 15 (42.9) | 9 (32.1) | 52 (68.4) | 48 (55.2) | 8 (44.4) | 8 (57.1) |
| ECOG PS, n (%) | ||||||||||
| 0 | 35 (71.4) | 35 (68.6) | 32 (51.6) | 24 (37.5) | 18 (51.4) | 11 (39.3) | 49 (64.5) | 48 (55.2) | 13 (72.2) | 9 (64.3) |
| 1 | 14 (28.6) | 14 (27.5) | 27 (43.5) | 35 (54.7) | 16 (45.7) | 14 (50.0) | 23 (32.9) | 35 (40.2) | 5 (27.8) | 5 (35.7) |
| 2 | 0 | 2 (3.9) | 3 (4.8) | 5 (7.8) | 1 (2.9) | 3 (10.7) | 2 (2.6) | 4 (4.6) | 0 | 0 |
| ISS stage, n (%) a | ||||||||||
| I | 32 (65.3) | 38 (74.5) | 33 (53.2) | 31 (48.4) | 16 (45.7) | 8 (28.6) | 49 (64.5) | 61 (70.1) | 10 (55.6) | 5 (35.7) |
| II | 12 (24.5) | 9 (17.6) | 21 (33.9) | 18 (28.1) | 11 (31.4) | 8 (28.6) | 22 (28.9) | 19 (21.8) | 7 (38.9) | 4 (28.6) |
| III | 5 (10.2) | 4 (7.8) | 8 (12.9) | 15 (23.4) | 8 (22.9) | 12 (42.9) | 5 (6.6) | 7 (8.0) | 1 (5.6) | 5 (35.7) |
| Time since MM diagnosis, median (range), y | 3.0 (1.0‐8.5) | 3.4 (0.6‐12.8) | 3.0 (0.2‐10.8) | 3.1 (0.4‐11.1) | 2.6 (0.6‐10.8) | 3.0 (0.6‐12.8) | 3.1 (0.2‐9.0) | 3.1 (0.4‐11.1) | 2.3 (0.2‐9.0) | 3.2 (1.5‐6.5) |
| CrCl <60 mL/min, n (%) | 3 (6.1) | 4 (7.8) | 32 (51.6) | 24 (37.5) | 35 (100) | 28 (100) | 0 | 0 | 4 (22.2) | 3 (21.4) |
| Cytogenetics, n (%) a | ||||||||||
| Non‐high risk b | 23 (46.9) | 23 (45.1) | 35 (56.5) | 33 (51.6) | 19 (54.3) | 14 (50.0) | 39 (51.3) | 42 (48.3) | 0 | 0 |
| High risk b | 12 (24.5) | 7 (13.7) | 6 (9.7) | 7 (10.9) | 4 (11.4) | 3 (10.7) | 14 (18.4) | 11 (12.6) | 18 (100) | 14 (100) |
| Missing or NE | 14 (28.6) | 21 (41.2) | 21 (33.9) | 24 (37.5) | 12 (34.3) | 11 (39.3) | 23 (30.3) | 34 (39.1) | 0 | 0 |
| Previous treatment, n (%) | ||||||||||
| LEN | 49 (100) | 51 (100) | 62 (100) | 64 (100) | 35 (100) | 28 (100) | 76 (100) | 87 (100) | 18 (100) | 14 (100) |
| BORT | 41 (83.7) | 37 (72.5) | 26 (41.9) | 30 (46.9) | 12 (34.3) | 17 (60.7) | 55 (72.4) | 50 (57.5) | 11 (61.1) | 11 (78.6) |
| SCT | 43 (87.8) | 33 (64.7) | 13 (21.0) | 21 (32.8) | 4 (11.4) | 8 (28.6) | 52 (68.4) | 46 (52.9) | 11 (61.1) | 8 (57.1) |
| Refractory disease, n (%) | ||||||||||
| LEN refractory | 27 (55.1) | 26 (51.0) | 37 (59.7) | 39 (60.9) | 24 (68.6) | 16 (57.1) | 40 (52.6) | 49 (56.3) | 13 (72.2) | 8 (57.1) |
| BORT refractory | 6 (12.2) | 4 (7.8) | 5 (8.1) | 3 (4.7) | 2 (5.7) | 2 (7.1) | 9 (11.8) | 5 (5.7) | 3 (16.7) | 1 (7.1) |
Abbreviations: BORT, bortezomib; CrCl, creatinine clearance; ECOG PS, Eastern Cooperative Oncology Group performance status; ISS, International Staging System; LEN, lenalidomide; MM, multiple myeloma; NE, not evaluable; PVd, pomalidomide, bortezomib, and dexamethasone; SCT, stem cell transplant; Vd, bortezomib and dexamethasone.
At study entry.
High risk was defined as the presence of del(17p), t(4;14), and/or t(14;16). Non‐high risk was defined as the absence of high‐risk cytogenetic abnormalities.
3.2. Patient disposition and treatment exposure
At data cutoff (October 26, 2017), treatment was ongoing in 34 and 39 patients aged ≤65 and >65 years, respectively, with most patients receiving PVd (Table 2). Patients who received PVd had a longer treatment duration and more treatment cycles than those who received Vd, with patients aged ≤65 years having more treatment exposure than patients aged >65 years. A similar patient disposition was noted in the renal function subgroups, with treatment ongoing in 21 and 52 patients with baseline CrCl <60 and ≥60 mL/min, respectively (Table 2). Both treatment duration and number of cycles with PVd were greater than with Vd, regardless of renal function. However, patients with normal renal function tended to have greater exposure to PVd than those with RI, whereas exposure to Vd was generally similar between the two renal function subgroups. Among patients with high‐risk cytogenetic abnormalities, seven and three patients were still receiving PVd and Vd, respectively. Similar to the other patient subgroups, median treatment duration in this subgroup was longer and the median number of cycles received was higher with PVd than with Vd (Table 2).
TABLE 2.
Patient disposition and treatment exposure in patients who received one prior line of therapy by age, renal function, and high‐risk cytogenetic abnormalities
| Parameter | Aged ≤65 y | Aged >65 y | CrCl <60 mL/min | CrCl ≥60 mL/min | High‐risk cytogenetics | |||||
|---|---|---|---|---|---|---|---|---|---|---|
| PVd (n = 49) | Vd (n = 51) | PVd (n = 62) | Vd (n = 64) | PVd (n = 35) | Vd (n = 28) | PVd (n = 76) | Vd (n = 87) | PVd (n = 18) | Vd (n = 14) | |
| Ongoing treatment, n (%) | 23 (46.9) | 11 (21.6) | 24 (38.7) | 15 (23.4) | 13 (37.1) | 8 (28.6) | 34 (44.7) | 18 (20.7) | 7 (38.9) | 3 (21.4) |
| Discontinued treatment, n (%) | 26 (53.1) | 37 (72.5) | 38 (61.3) | 47 (73.4) | 22 (62.9) | 20 (71.4) | 42 (55.3) | 64 (73.6) | 11 (61.1) | 11 (78.6) |
| Progressive disease | 15 (30.6) | 20 (39.2) | 19 (30.6) | 31 (48.4) | 12 (34.3) | 12 (42.9) | 22 (28.9) | 39 (44.8) | 9 (50.0) | 7 (50.0) |
| Adverse event | 3 (6.1) | 7 (13.7) | 7 (11.3) | 13 (20.3) | 3 (8.6) | 6 (21.4) | 7 (9.2) | 14 (16.1) | 1 (5.6) | 3 (21.4) |
| Consent withdrawal | 5 (10.2) | 4 (7.8) | 5 (8.1) | 2 (3.1) | 3 (8.6) | 1 (3.6) | 7 (9.2) | 5 (5.7) | 0 | 0 |
| Death | 1 (2.0) | 1 (2.0) | 5 (8.1) | 0 | 4 (11.4) | 0 | 2 (2.6) | 1 (1.1) | 0 | 1 (7.1) |
| Other | 2 (4.1) | 4 (7.8) | 2 (3.2) | 1 (1.6) | 0 | 1 (3.6) | 4 (5.3) | 4 (4.6) | 1 (5.6) | 0 |
| Pregnancy | 0 | 1 (2.0) | 0 | 0 | 0 | 0 | 0 | 1 (1.1) | 0 | 0 |
| No treatment received, n (%) | 0 | 3 (5.9) | 0 | 2 (3.1) | 0 | 0 | 0 | 5 (5.7) | 0 | 0 |
| Duration of treatment, median (range), mo | 12.2 (2.7‐32.9) | 7.0 (0.7‐29.0) | 9.7 (1.1‐33.8) | 5.6 (0.1‐37.3) | 9.3 (1.1‐33.8) | 6.5 (0.1‐21.3) | 11.5 (1.4‐32.9) | 6.2 (0.3‐37.3) | 9.3 (3.1‐33.8) | 5.2 (0.7‐15.2) |
| No. of treatment cycles, median (range) | 17.0 (4‐46) | 10.0 (1‐42) | 13.5 (2‐45) | 8.0 (1‐53) | 12.0 (2‐45) | 9.5 (1‐29) | 15.0 (2‐46) | 9.0 (1‐53) | 11.5 (5‐45) | 7.0 (1‐20) |
Abbreviations: CrCl, creatinine clearance; PVd, pomalidomide, bortezomib, and dexamethasone; Vd, bortezomib and dexamethasone.
Across all subgroups, progressive disease was the most common reason for treatment discontinuation (Table 2). Other common reasons for discontinuation (>10% in any subgroup or treatment arm) included adverse events, withdrawal of consent, and death.
3.3. Efficacy in age groups
Median PFS and ORR were significantly higher with PVd vs Vd at first relapse, irrespective of age. Median PFS was 22.0 months with PVd vs 13.1 months with Vd in patients aged ≤65 years (HR, 0.49 [95% CI, 0.26‐0.93]; P =.0258) and 17.6 vs 9.9 months in patients aged >65 years (HR, 0.57 [95% CI, 0.34‐0.97]; P =.0369) (Figure 1A).
FIGURE 1.
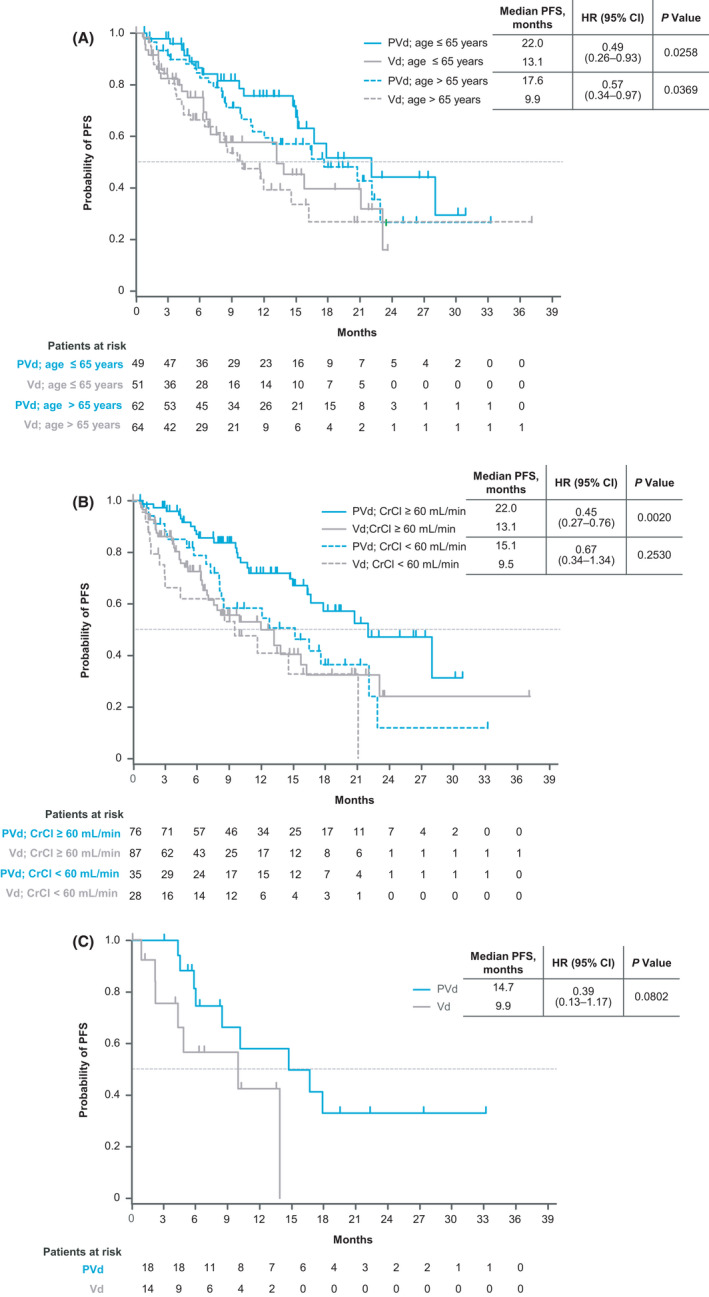
Kaplan‐Meier estimates of PFS in subgroups of patients with only one prior line of therapy (A) by age, (B) by renal function at baseline, and (C) by high‐risk cytogenetic abnormalities. CrCl, creatinine clearance; HR, hazard ratio; PFS, progression‐free survival; PVd, pomalidomide, bortezomib, and dexamethasone; Vd, bortezomib and dexamethasone
The ORR was 89.8% vs 54.9% with PVd vs Vd (P <.001) in patients aged ≤65 years and 90.3% vs 54.7% (P <.001) in patients aged >65 years (Table 3). PVd led to deeper responses than Vd, with higher rates of very good partial response (VGPR) or better in patients aged ≤65 years (65.3% vs 17.6%) and >65 years (58.1% vs 26.6%). The median TTR was 1.0 month with PVd vs 1.4 months with Vd in the ≤65 years subgroup (P =.042) and 1.0 vs 0.9 month in the >65 years subgroup (P =.524). PVd also led to more durable responses than Vd, but the differences were not significant (Table 3).
TABLE 3.
Response in patients who received one prior line of therapy by age, renal function, and high‐risk cytogenetic abnormalities
| Response rates | Aged ≤65 y | Aged >65 y | CrCl <60 mL/min | CrCl ≥60 mL/min | High‐risk cytogenetics | |||||||
|---|---|---|---|---|---|---|---|---|---|---|---|---|
| PVd (n = 49) | Vd (n = 51) | PVd (n = 62) | Vd (n = 64) | PVd (n = 35) | Vd (n = 28) | PVd (n = 76) | Vd (n = 87) | PVd (n = 18) | Vd (n = 14) | |||
| Overall response rate, n (%) | 44 (89.8) | 28 (54.9) | 56 (90.3) | 35 (54.7) | 32 (91.4) | 15 (53.6) | 68 (89.5) | 48 (55.2) | 17 (94.4) | 8 (57.1) | ||
| P value a | <.001 | <.001 | <.001 | <.001 | .027 | |||||||
| sCR, n (%) | 4 (8.2) | 0 | 2 (3.2) | 2 (3.1) | 1 (2.9) | 1 (3.6) | 5 (6.6) | 1 (1.1) | 2 (11.1) | 0 | ||
| CR, n (%) | 6 (12.2) | 2 (3.9) | 8 (12.9) | 3 (4.7) | 4 (11.4) | 3 (10.7) | 10 (13.2) | 2 (2.3) | 5 (27.8) | 1 (7.1) | ||
| VGPR, n (%) | 22 (42.9) | 7 (13.7) | 26 (41.9) | 12 (18.8) | 14 (40.0) | 2 (7.1) | 34 (44.7) | 17 (19.5) | 6 (33.3) | 4 (28.6) | ||
| VGPR or better, n (%) | 32 (65.3) | 9 (17.6) | 36 (58.1) | 17 (26.6) | 19 (54.3) | 6 (21.4) | 49 (64.5) | 20 (23.0) | 13 (72.2) | 5 (35.7) | ||
| PR, n (%) | 12 (24.5) | 19 (37.3) | 20 (32.3) | 18 (28.1) | 13 (37.1) | 9 (32.1) | 19 (25.0) | 28 (32.2) | 4 (22.2) | 3 (21.4) | ||
| SD, n (%) | 4 (8.2) | 16 (31.4) | 6 (9.7) | 24 (37.5) | 2 (5.7) | 10 (35.7) | 8 (10.5) | 30 (34.5) | 1 (5.6) | 4 (28.6) | ||
| PD, n (%) | 1 (2.0) | 3 (5.9) | 0 | 1 (1.6) | 1 (2.9) | 1 (3.6) | 0 | 3 (3.4) | 0 | 1 (7.1) | ||
| NE, n (%) | 0 | 4 (7.8) | 0 | 4 (6.3) | 0 | 2 (7.1) | 0 | 6 (6.9) | 0 | 1 (7.1) | ||
| Time to response, median (range), mo | 1.0 (0.7‐5.4) | 1.4 (0.7‐6.2) | 1.0 (0.7‐4.2) | 0.9 (0.7‐2.8) | 1.2 (0.7‐3.2) | 0.8 (0.7‐1.7) | 1.0 (0.7‐5.4) | 1.4 (0.7‐6.2) | 0.9 (0.7‐5.4) | 0.8 (0.7‐2.1) | ||
| P value b | .042 | .524 | .007 | .024 | .355 | |||||||
| Duration of response, median (range), mo c | 21.4 (13.7‐NE) | 14.8 (6.5‐NE) | 20.0 (10.6‐NE) | 14.8 (8.7‐NE) | 15.1 (7.6‐22.0) | 13.8 (2.4‐NE) | 21.4 (14.3‐NE) | 14.8 (11.1‐NE) | 12.5 (5.2‐NE) | 13.1 (2.9‐13.1) | ||
| HR (95% CI) | 0.62 (0.29‐1.35) | 0.93 (0.46‐1.87) | 0.97 (0.39‐2.39) | 0.67 (0.36‐1.27) | 0.69 (0.20‐2.39) | |||||||
| P value d | .227 | .834 | .946 | .219 | .558 | |||||||
Abbreviations: CrCl, creatinine clearance; CR, complete response; HR, hazard ratio; NE, not estimable; PD, progressive disease; PR, partial response; PVd, pomalidomide, bortezomib, and dexamethasone; sCR, stringent complete response; SD, stable disease; Vd, bortezomib and dexamethasone; VGPR, very good partial response.
Based on Fisher's exact test.
Based on Wilcoxon rank sum test.
Based on Kaplan‐Meier estimate.
Based on unstratified log‐rank test.
3.4. Efficacy in renal function groups
PVd given at first relapse improved median PFS vs Vd in patients with RI at baseline, but the difference was not statistically significant (15.1 vs 9.5 months with Vd; HR, 0.67 [95% CI, 0.34‐1.34]; P = .2530). A significant improvement in PFS was observed with PVd vs Vd in patients with normal renal function at baseline, with a median of 22.0 vs 13.1 months (HR, 0.45 [95% CI, 0.27‐0.76]; P = .0020) (Figure 1B).
Furthermore, PVd significantly improved the ORR vs Vd, regardless of renal function status. Patients with CrCl <60 mL/min achieved an ORR of 91.4% with PVd vs 53.6% with Vd (P < .001; Table 3). The ORR was 89.5% with PVd vs 55.2% with Vd in patients with CrCl ≥60 mL/min (P < .001). Rates of VGPR or better (with PVd vs Vd) were 54.3% vs 21.4% in patients with CrCl <60 mL/min and 64.5% vs 23.0% in those with CrCl ≥60 mL/min at baseline. The median TTR was 1.2 months with PVd vs 0.8 month with Vd in patients with CrCl <60 mL/min (P =.007) and 1.0 vs 1.4 months in patients with CrCl ≥60 mL/min (P = .024). The duration of response with PVd and Vd was not significantly different in either renal function subgroup.
3.5. Efficacy in patients with high‐risk cytogenetic abnormalities
In patients with high‐risk cytogenetic abnormalities treated at first relapse, median PFS was 14.7 months with PVd vs 9.9 months with Vd (HR, 0.39 [95% CI, 0.13‐1.17]; P = .0802) (Figure 1C).
The ORR was significantly improved with PVd vs Vd, with a rate of 94.4% vs 57.1% (P = .027). VGPR or better was achieved by 72.2% of patients who received PVd vs 35.7% of patients who received Vd (Table 3). The TTR and duration of response were not significantly different with PVd vs Vd in this patient subgroup.
3.6. Safety
In all subgroups and treatment arms, the most common grade 3/4 hematologic treatment‐emergent adverse events (TEAEs) were neutropenia, thrombocytopenia, and anemia (Table 4). The most common grade 3/4 non‐hematologic TEAEs were infections, including pneumonia. In patients aged >65 years, infections, neutropenia, and thrombocytopenia were the most frequent grade 3/4 TEAEs with PVd; in patients with RI, infections, neutropenia, and anemia were the most common. The most common grade 3/4 TEAEs with Vd were thrombocytopenia and infections, irrespective of age and renal function status. In patients with high‐risk cytogenetic abnormalities, the most common grade 3/4 TEAEs with PVd were neutropenia and infections.
TABLE 4.
Grade 3/4 TEAEs in patients who received one prior line of therapy by age, renal function, and high‐risk cytogenetic abnormalities
| Grade 3/4 TEAEs, n (%) a | Aged ≤65 y | Aged >65 y | CrCl <60 mL/min | CrCl ≥60 mL/min | High‐risk cytogenetics | |||||
|---|---|---|---|---|---|---|---|---|---|---|
| PVd (n = 49) | Vd (n = 48) | PVd (n = 62) | Vd (n = 62) | PVd (n = 35) | Vd (n = 28) | PVd (n = 76) | Vd (n = 82) | PVd (n = 18) | Vd (n = 14) | |
| Hematologic | ||||||||||
| Neutropenia | 24 (49.0) | 3 (6.3) | 16 (25.8) | 8 (12.9) | 8 (22.9) | 3 (10.7) | 32 (42.1) | 8 (9.8) | 10 (55.6) | 2 (14.3) |
| Febrile neutropenia | 2 (4.1) | 0 | 1 (1.6) | 0 | 1 (2.9) | 0 | 2 (2.6) | 0 | 0 | 0 |
| Thrombocytopenia | 13 (26.5) | 9 (18.8) | 9 (14.5) | 14 (22.6) | 4 (11.4) | 6 (21.4) | 18 (23.7) | 17 (20.7) | 2 (11.1) | 6 (42.9) |
| Anemia | 7 (14.3) | 6 (12.5) | 5 (8.1) | 1 (1.6) | 5 (14.3) | 2 (7.1) | 7 (9.2) | 5 (6.1) | 2 (11.1) | 2 (14.3) |
| Non‐hematologic | ||||||||||
| Infections b | 15 (30.6) | 7 (14.6) | 17 (27.4) | 10 (16.1) | 10 (28.6) | 5 (17.9) | 22 (28.9) | 12 (14.6) | 6 (33.3) | 2 (14.3) |
| Pneumonia | 6 (12.2) | 3 (6.3) | 4 (6.5) | 3 (4.8) | 6 (17.1) | 2 (7.1) | 4 (5.3) | 4 (4.9) | 3 (16.7) | 2 (14.3) |
| Peripheral sensory neuropathy | 7 (14.3) | 1 (2.1) | 3 (4.8) | 3 (4.8) | 2 (5.7) | 1 (3.6) | 8 (10.5) | 3 (3.7) | 1 (5.6) | 0 |
| Hypokalemia | 6 (12.2) | 1 (2.1) | 0 | 2 (3.2) | 1 (2.9) | 1 (3.6) | 5 (6.6) | 2 (2.4) | 3 (16.7) | 0 |
| Hyperglycemia | 5 (10.2) | 4 (8.3) | 4 (6.5) | 5 (8.1) | 1 (2.9) | 0 | 8 (10.5) | 9 (11.0) | 1 (5.6) | 1 (7.1) |
| Fatigue | 5 (10.2) | 1 (2.1) | 4 (6.5) | 2 (3.2) | 2 (5.7) | 2 (7.1) | 7 (9.2) | 1 (1.2) | 0 | 1 (7.1) |
| Pulmonary embolism | 4 (8.2) | 0 | 2 (3.2) | 0 | 2 (5.7) | 0 | 4 (5.3) | 0 | 2 (11.1) | 0 |
| Non‐cardiac chest pain | 3 (6.1) | 1 (2.1) | 1 (1.6) | 0 | 0 | 0 | 4 (5.3) | 1 (1.2) | 2 (11.1) | 1 (7.1) |
| Congestive heart failure | 2 (4.1) | 2 (4.2) | 0 | 0 | 0 | 0 | 2 (2.6) | 2 (2.4) | 2 (11.1) | 0 |
| Diarrhea | 2 (4.1) | 2 (4.2) | 6 (9.7) | 4 (6.5) | 3 (8.6) | 3 (10.7) | 5 (6.6) | 3 (3.7) | 1 (5.6) | 1 (7.1) |
| Acute kidney injury | 2 (4.1) | 1 (2.1) | 4 (6.5) | 0 | 4 (11.4) | 1 (3.6) | 2 (2.6) | 0 | 1 (5.6) | 0 |
Abbreviations: CrCl, creatinine clearance; PVd, pomalidomide, bortezomib, and dexamethasone; TEAE, treatment‐emergent adverse event; Vd, bortezomib and dexamethasone.
Reported as preferred terms in ≥10% of patients in any arm of any subgroup, except for febrile neutropenia.
Infections reported as system organ class.
4. Discussion
The results of this post hoc subanalysis of OPTIMISMM demonstrated improved efficacy with PVd vs Vd treatment at first relapse, including in patients with clinically relevant prognostic factors such as older age, RI, and high‐risk cytogenetic abnormalities. In patients aged >65 years, treatment with PVd significantly reduced the risk of disease progression or death by 43% compared with Vd alone (P = .0369). Trends toward longer PFS with PVd were noted in patients who had CrCl <60 mL/min at baseline (33% risk reduction) and in those with high‐risk cytogenetics (nearly 5 months of improvement and 61% risk reduction). However, treatment differences were not statistically significant likely because of the small sample sizes in both of these subgroups. Importantly, the ORR was significantly improved with PVd vs Vd in all subgroups reported here. Furthermore, patients with an elevated risk for poor outcomes achieved deep responses with PVd; the rate of VGPR or better was more than double the rate with Vd.
The safety profile of PVd was consistent with that seen in previous reports of OPTIMISMM, with neutropenia, thrombocytopenia, and infections (mainly pneumonia) noted as the most common grade 3/4 TEAEs, regardless of age, renal function, and high‐risk cytogenetics. The safety of PVd was encouraging in patients aged >65 years, who are typically considered frail and less likely to tolerate novel antimyeloma regimens. 5 Importantly, the safety profile was consistent with early‐phase studies of PVd in which the proportion of younger patients was higher. 27
To our knowledge, this subanalysis of OPTIMISMM is the first report to describe efficacy and safety outcomes at first relapse in the context of prior lenalidomide exposure and clinically relevant prognostic factors in a large phase 3 trial. Early‐line data in this setting were recently reported from the phase 2 MM‐014 (NCT01946477) trial of pomalidomide, dexamethasone, and daratumumab given after one or two prior treatment lines containing lenalidomide (75% of patients had lenalidomide‐refractory MM). 28 The ORR was 74.2% in patients aged >65 years (n = 62). Response rates were also promising regardless of baseline renal status, with an ORR of 85.7%, 90.9%, and 74.7% in patients with CrCl ≥30 to <45 (n = 7), ≥45 to <60 (n = 11), and ≥60 mL/min (n = 79), respectively. Furthermore, a small subgroup of 20 patients with high‐risk cytogenetic abnormalities, del(17p), t(4;14), and/or t(14;16), achieved an ORR of 55.0%.
The post hoc results of OPTIMISMM reported here build on recent evidence from patient subgroups with poor prognostic factors treated with US Food and Drug Administration–approved pomalidomide‐based regimens, albeit in later lines of therapy. 18 , 19 The randomized phase 3 ICARIA‐MM (NCT02990338) trial investigated isatuximab, pomalidomide, and dexamethasone (Isa‐Pd) vs Pd in lenalidomide‐pretreated patients (median of three prior lines of therapy; 93% had lenalidomide‐refractory disease) 29 ). Compared with Pd, Isa‐Pd demonstrated longer PFS in patients aged ≥65 years, patients with RI, and patients with high‐risk cytogenetic abnormalities, that is, del(17p), t(4;14), or t(14;16). Isa‐Pd also demonstrated improved ORRs and deeper responses vs Pd in these poor prognostic patient subgroups. 30 , 31 , 32 Grade ≥3 TEAEs with Isa‐Pd were more common in older patients than in younger patients. 32 In the phase 2 ELOQUENT‐3 (NCT02654132) trial that led to approval of elotuzumab, pomalidomide, and dexamethasone in RRMM, 99% of patients were previously treated with lenalidomide (median of three prior lines of therapy) and 87% had disease refractory to lenalidomide. 33 A PFS analysis in predefined subgroups demonstrated a benefit with elotuzumab, pomalidomide, and dexamethasone over Pd in patients aged ≥65 years and those with high‐risk cytogenetic abnormalities, that is, del(17p), t(4;14), or t(14;16) 33 .
Other phase 3 trials investigating addition of a third agent to Vd in early‐line treatment include CASTOR (daratumumab plus Vd; NCT02136134), 34 , 35 BOSTON (selinexor plus Vd; NCT03110562), 36 and BELLINI (venetoclax plus Vd; NCT02755597). 37 However, these studies had small proportions of lenalidomide‐pretreated patients (42% in CASTOR, 38% in BOSTON, and not specified in BELLINI) or patients who received only one prior line of therapy (20% in CASTOR, 49% in BOSTON, and 46% in BELLINI) and did not include subgroup analyses at first relapse in patients who were exposed to lenalidomide. 35 , 36 , 37
The current subanalysis may be limited by the small sample size of each subgroup, particularly for the RI and high‐risk cytogenetics subgroups, and lack of power to provide definitive statistical evidence. 38 Additionally, the frailty of older patients was not assessed because OPTIMISMM began patient enrollment 3 years before the publication of the International Myeloma Working Group frailty score system 39 ; however, the reproducibility of the results across age groups and in each subanalysis support the translation of these findings to real‐world clinical practice. 40
In conclusion, the results of this subanalysis of OPTIMISMM demonstrated that the benefit of PVd at first relapse in lenalidomide‐pretreated patients is independent of important clinical characteristics that impact treatment choices. Moreover, these data continue to show the effectiveness of pomalidomide after relapse from or resistance to lenalidomide, indicating the benefit of maintaining continuous immunomodulation. The findings of this analysis add to the growing body of data supporting the use of pomalidomide immediately after lenalidomide failure in early treatment lines and can help clinicians make informed treatment decisions for patients with RRMM and poor prognostic factors.
CONFLICT OF INTEREST
PGR reports serving on a board of directors or advisory committee for Karyopharm, Oncopeptides, Bristol Myers Squibb, Takeda, Amgen, and Jazz Pharmaceuticals; FS reports paid lecturer or advisory board fees from Amgen, Bristol Myers Squibb, Takeda, AbbVie, Janssen, Bayer, and Adaptive Biotechnologies; KW reports honoraria from Amgen, Bristol Myers Squibb, Janssen, and Takeda and consultancy for or serving on a board of directors or advisory committee for Amgen, Bristol Myers Squibb, Janssen, Juno, Sanofi, and Takeda; PM reports honoraria from serving on a board of directors or advisory committee for Amgen, Bristol Myers Squibb, Janssen, Takeda, and AbbVie; LDA reports serving on a speakers bureau for Bristol Myers Squibb, Amgen, and Takeda; DW reports honoraria from serving on a board of directors or advisory committee for Amgen, Bristol Myers Squibb, Janssen, and Takeda; PR‐O reports honoraria from and consultancy for Bristol Myers Squibb and Janssen, serving on a speakers bureau for Bristol Myers Squibb, and consultancy for Kite Pharma and Takeda; PS reports honoraria and research funding from Amgen, Bristol Myers Squibb, Janssen, and Karyopharm; ME, AML, MY, FV, ASK, and AC have nothing to disclose; MJ reports consultancy for and honoraria from serving on a board of directors, advisory committee, and speakers bureau for Novartis, Janssen, Takeda, Amgen, and Bristol Myers Squibb, travel support and research funding from Janssen and Amgen, honoraria from serving on a board of directors or advisory committee for Chugai, and research funding from Takeda and Bristol Myers Squibb; JD reports honoraria from Janssen, Bristol Myers Squibb, and Roche, consultancy for Janssen, and serving on a speakers bureau for Roche; MP reports consultancy for and honoraria from serving on a board of directors or advisory committee and research funding from Bristol Myers Squibb, Novartis, AstraZeneca, Roche, Takeda, and Janssen; MS reports consultancy for Janssen; MB reports advisory board fees from Janssen‐Cilag, Amgen, Takeda, and Sanofi and speakers bureau fees from Janssen‐Cilag, Bristol Myers Squibb, Takeda, and Amgen; AO reports advisory board fees from Bristol Myers Squibb, Janssen, and Amgen; JL reports commercial sponsorship and personal fees from Bristol Myers Squibb and non‐financial support from Bristol Myers Squibb, Takeda, and Amgen; MG reports honoraria from Bristol Myers Squibb, Janssen, and Leadiant (formerly Sigma‐Tau Pharmaceuticals); PR reports research funding from Bristol Myers Squibb; AL reports honoraria, advisory board, and personal fees from Bristol Myers Squibb and Janssen, honoraria and personal fees from Amgen, and serving on an advisory board for Takeda; RJ and TP report employment with and equity ownership in Bristol Myers Squibb; LG reports employment with Bristol Myers Squibb; MD reports honoraria from Janssen, Takeda, Amgen, and Bristol Myers Squibb.
AUTHOR CONTRIBUTIONS
All authors have contributed to the acquisition, analysis, or interpretation of data for this article, contributed to drafts of the article, revised the manuscript critically for important intellectual content, approved the final version to be published, and agreed to be accountable for all aspects of the article.
ACKNOWLEDGEMENTS
This study was sponsored by Celgene, a Bristol‐Myers Squibb Company. The authors would like to thank Eva Casal, PhD, of Bristol Myers Squibb, for clinical insights and contributions and Mihaela Marina, PhD, of MediTech Media, Ltd, for medical writing assistance in the preparation of this manuscript, which was sponsored by Bristol Myers Squibb.
Richardson PG, Schjesvold F, Weisel K, et al. Pomalidomide, bortezomib, and dexamethasone at first relapse in lenalidomide‐pretreated myeloma: A subanalysis of OPTIMISMM by clinical characteristics. Eur J Haematol. 2022;108:73–83. 10.1111/ejh.13706
Novelty statements:
-
1. What is the new aspect of your work?
-
•Outcomes of PVd at first relapse have not been reported in patients with mutliple myeloma and poor prognostic characteristics who were previously treated with lenalidomide, a clinically relevant patient population with a high unmet need.
-
•
-
2. What is the central finding of your work?
-
•The benefit of PVd at first relapse in lenalidomide‐pretreated patients was independent of the following poor prognostic factors: advanced age, renal impairment, and high‐risk cytogenetic abnormalities.
-
•
-
3. What is (or could be) the specific clinical relevance of your work?
-
•The findings of this analysis continue to support the use of pomalidomide immediately after lenalidomide failure in early treatment lines and will help inform treatment decisions for patients with poor prognostic factors.
-
•
DATA AVAILABILITY STATEMENT
BMS policy on data sharing may be found at https://www.bms.com/researchers‐and‐partners/independent‐research/data‐sharing‐request‐process.html.
REFERENCES
- 1. Sonneveld P, Broijl A. Treatment of relapsed and refractory multiple myeloma. Haematologica. 2016;101:396‐406. [DOI] [PMC free article] [PubMed] [Google Scholar]
- 2. Kumar SK. New treatment options for the management of multiple myeloma. J Natl Compr Canc Netw. 2017;15:709‐712. [DOI] [PubMed] [Google Scholar]
- 3. Manapuram S, Hashmi H. Treatment of multiple myeloma in elderly patients: a review of literature and practice guidelines. Cureus. 2018;10:e3669. [DOI] [PMC free article] [PubMed] [Google Scholar]
- 4. Chretien ML, Hebraud B, Cances‐Lauwers V, et al. Age is a prognostic factor even among patients with multiple myeloma younger than 66 years treated with high‐dose melphalan: the IFM experience on 2316 patients. Haematologica. 2014;99:1236‐1238. [DOI] [PMC free article] [PubMed] [Google Scholar]
- 5. Willan J, Eyre TA, Sharpley F, Watson C, King AJ, Ramasamy K. Multiple myeloma in the very elderly patient: challenges and solutions. Clin Interv Aging. 2016;11:423‐435. [DOI] [PMC free article] [PubMed] [Google Scholar]
- 6. Knudsen LM, Hjorth M, Hippe E. Renal failure in multiple myeloma: reversibility and impact on the prognosis. Nordic Myeloma Study Group. Eur J Haematol. 2000;65:175‐181. [DOI] [PubMed] [Google Scholar]
- 7. Dimopoulos M, Weisel K, van de Donk N, et al. Pomalidomide plus low‐dose dexamethasone in patients with relapsed/refractory multiple myeloma and renal impairment: results from a phase II trial. J Clin Oncol. 2018;36:2035‐2043. [DOI] [PubMed] [Google Scholar]
- 8. Derman BA, Reiser J, Basu S, Paner A. Renal dysfunction and recovery following initial treatment of newly diagnosed multiple myeloma. Int J Nephrol. 2018;2018:4654717. [DOI] [PMC free article] [PubMed] [Google Scholar]
- 9. Sonneveld P, Avet‐Loiseau H, Lonial S, et al. Treatment of multiple myeloma with high‐risk cytogenetics: a consensus of the International Myeloma Working Group. Blood. 2016;127:2955‐2962. [DOI] [PMC free article] [PubMed] [Google Scholar]
- 10. Fonseca R, Bergsagel PL, Drach J, et al. International Myeloma Working Group molecular classification of multiple myeloma: spotlight review. Leukemia. 2009;23:2210‐2221. [DOI] [PMC free article] [PubMed] [Google Scholar]
- 11. Avet‐Loiseau H, Facon T. Front‐line therapies for elderly patients with transplant‐ineligible multiple myeloma and high‐risk cytogenetics in the era of novel agents. Leukemia. 2018;32:1267‐1276. [DOI] [PMC free article] [PubMed] [Google Scholar]
- 12. Holstein SA, Suman VJ, McCarthy PL. Update on the role of lenalidomide in patients with multiple myeloma. Ther Adv Hematol. 2018;9:175‐190. [DOI] [PMC free article] [PubMed] [Google Scholar]
- 13. Moreau P, Zamagni E, Mateos MV. Treatment of patients with multiple myeloma progressing on frontline‐therapy with lenalidomide. Blood Cancer J. 2019;9:38. [DOI] [PMC free article] [PubMed] [Google Scholar]
- 14. Lopez‐Girona A, Mendy D, Ito T, et al. Cereblon is a direct protein target for immunomodulatory and antiproliferative activities of lenalidomide and pomalidomide. Leukemia. 2012;26:2326‐2335. [DOI] [PMC free article] [PubMed] [Google Scholar]
- 15. Ocio EM, Fernandez‐Lazaro D, San‐Segundo L, et al. In vivo murine model of acquired resistance in myeloma reveals differential mechanisms for lenalidomide and pomalidomide in combination with dexamethasone. Leukemia. 2015;29:705‐714. [DOI] [PubMed] [Google Scholar]
- 16. Rychak E, Mendy D, Shi T, et al. Pomalidomide in combination with dexamethasone results in synergistic anti‐tumour responses in pre‐clinical models of lenalidomide‐resistant multiple myeloma. Br J Haematol. 2016;172:889‐901. [DOI] [PubMed] [Google Scholar]
- 17. Richardson PG, Oriol A, Beksac M, et al. Pomalidomide, bortezomib, and dexamethasone for patients with relapsed or refractory multiple myeloma previously treated with lenalidomide (OPTIMISMM): a randomised, open‐label, phase 3 trial. Lancet Oncol. 2019;20:781‐794. [DOI] [PubMed] [Google Scholar]
- 18. Empliciti (elotuzumab) [package insert]. Bristol‐Myers Squibb Company, Princeton, NJ; 2019.
- 19. Sarclisa (isatuximab‐irfc) [package insert]. Sanofi‐Aventis US LLC, Bridgewater, NJ; 2020.
- 20. Darzalex (daratumumab) [package insert]. Janssen Biotech, Inc, Horsham, PA; 2020.
- 21. Chen C, Kotb R, Sebag M, et al. Selinexor shows synergy in combination with pomalidomide and low dose dexamethasone in patients with relapsed/refractory multiple myeloma. Blood. 2016;128:Abstract 3330. [Google Scholar]
- 22. Das DS, Ray A, Song Y, et al. Synergistic anti‐myeloma activity of the proteasome inhibitor marizomib and the IMiD immunomodulatory drug pomalidomide. Br J Haematol. 2015;171:798‐812. [DOI] [PMC free article] [PubMed] [Google Scholar]
- 23. Katz M, Bjorklund CC, Thakurta A, Serbina N. Mechanistic insights of pomalidomide activity in combination with bortezomib and dexamethasine in multiple myeloma and immune cells. Blood. 2018;132(Suppl 1):Abstract 1934. [Google Scholar]
- 24. Pomalyst (pomalidomide) [package insert] [in Japanese]. Celgene KK, Tokyo, Japan; 2019.
- 25. Imnovid (previously pomalidomide Celgene) [summary of product characteristics]. Celgene Distribution BV, Utrecht, Netherlands; 2020.
- 26. Dimopoulos M, Weisel K, Moreau P, et al. Pomalidomide, bortezomib, and dexamethasone for multiple myeloma previously treated with lenalidomide (OPTIMISMM): outcomes by prior treatment at first relapse. Leukemia. 2021;35(6):1722‐1731. [DOI] [PMC free article] [PubMed] [Google Scholar]
- 27. Richardson PG, Hofmeister CC, Raje NS, et al. Pomalidomide, bortezomib and low‐dose dexamethasone in lenalidomide‐refractory and proteasome inhibitor‐exposed myeloma. Leukemia. 2017;31:2695‐2701. [DOI] [PMC free article] [PubMed] [Google Scholar]
- 28. Siegel DS, Schiller GJ, Samaras C, et al. Pomalidomide, dexamethasone, and daratumumab in relapsed refractory multiple myeloma after lenalidomide treatment. Leukemia. 2020;34:3286‐3297. [DOI] [PMC free article] [PubMed] [Google Scholar]
- 29. Attal M, Richardson PG, Rajkumar SV, et al. Isatuximab plus pomalidomide and low‐dose dexamethasone versus pomalidomide and low‐dose dexamethasone in patients with relapsed and refractory multiple myeloma (ICARIA‐MM): a randomised, multicentre, open‐label, phase 3 study. Lancet. 2019;394:2096‐2107. [DOI] [PubMed] [Google Scholar]
- 30. Dimopoulos MA, Leleu X, Moreau P, et al. Isatuximab plus pomalidomide and dexamethasone in relapsed/refractory multiple myeloma patients with renal impairment: ICARIA‐MM subgroup analysis. Leukemia. 2021;35:562‐572. [DOI] [PMC free article] [PubMed] [Google Scholar]
- 31. Harrison SJ, Richardson PG, Alegre A, et al. Efficacy of isatuximab/pomalidomide/dexamethasone in relapsed/refractory multiple myeloma: ICARIA‐MM high‐risk cytogenetics subgroup analysis. 17th International Myeloma Workshop. Clin Lymphom Myelom Leukem. 2019;19(10 suppl):e33. [Google Scholar]
- 32. Schjesvold FH, Richardson PG, Facon T, et al. Isatuximab plus pomalidomide and dexamethasone in elderly patients with relapsed/refractory multiple myeloma: ICARIA‐MM subgroup analysis. Haematologica. 2021;106:1182‐1187. [DOI] [PMC free article] [PubMed] [Google Scholar]
- 33. Dimopoulos MA, Dytfeld D, Grosicki S, et al. Elotuzumab plus pomalidomide and dexamethasone for multiple myeloma. N Engl J Med. 2018;379:1811‐1822. [DOI] [PubMed] [Google Scholar]
- 34. Palumbo A, Chanan‐Khan A, Weisel K, et al. Daratumumab, Bortezomib, and Dexamethasone for multiple myeloma. N Engl J Med. 2016;375:754‐766. [DOI] [PubMed] [Google Scholar]
- 35. Mateos MV, Sonneveld P, Hungria V, et al. Daratumumab, Bortezomib, and Dexamethasone versus Bortezomib and Dexamethasone in patients with previously treated multiple myeloma: three‐year follow‐up of CASTOR. Clin Lymphoma Myeloma Leuk. 2020;20:509‐518. [DOI] [PubMed] [Google Scholar]
- 36. Grosicki S, Simonova M, Spicka I, et al. Once‐per‐week selinexor, bortezomib, and dexamethasone versus twice‐per‐week bortezomib and dexamethasone in patients with multiple myeloma (BOSTON): a randomised, open‐label, phase 3 trial. Lancet. 2020;396:1563‐1573. [DOI] [PubMed] [Google Scholar]
- 37. Kumar SK, Harrison SJ, Cavo M, et al. Venetoclax or placebo in combination with bortezomib and dexamethasone in patients with relapsed or refractory multiple myeloma (BELLINI): a randomised, double‐blind, multicentre, phase 3 trial. Lancet Oncol. 2020;21:1630‐1642. [DOI] [PubMed] [Google Scholar]
- 38. Lancman G, Tremblay D, Barley K, et al. The effect of novel therapies in high‐molecular‐risk multiple myeloma. Clin Adv Hematol Oncol. 2017;15:870‐879. [PMC free article] [PubMed] [Google Scholar]
- 39. Palumbo A, Bringhen S, Mateos MV, et al. Geriatric assessment predicts survival and toxicities in elderly myeloma patients: an International Myeloma Working Group report. Blood. 2015;125:2068‐2074. 10.1182/blood-2014-12-615187 [DOI] [PMC free article] [PubMed] [Google Scholar]
- 40. Richardson PG, San Miguel JF, Moreau P, et al. Interpreting clinical trial data in multiple myeloma: translating findings to the real‐world setting. Blood Cancer J. 2018;8:109. [DOI] [PMC free article] [PubMed] [Google Scholar]
Associated Data
This section collects any data citations, data availability statements, or supplementary materials included in this article.
Data Availability Statement
BMS policy on data sharing may be found at https://www.bms.com/researchers‐and‐partners/independent‐research/data‐sharing‐request‐process.html.