

Abstract
Pleistocene glacial cycles influenced the diversification of high‐latitude wildlife species through recurrent periods of range contraction, isolation, divergence, and expansion from refugia and subsequent admixture of refugial populations. We investigate population size changes and the introgressive history of caribou (Rangifer tarandus) in western Canada using 33 whole genome sequences coupled with larger‐scale mitochondrial data. We found that a major population expansion of caribou occurred starting around 110,000 years ago (kya), the start of the last glacial period. Additionally, we found effective population sizes of some caribou reaching ~700,000 to 1,000,000 individuals, one of the highest recorded historical effective population sizes for any mammal species thus far. Mitochondrial analyses dated introgression events prior to the LGM dating to 20–30 kya and even more ancient at 60 kya, coinciding with colder periods with extensive ice coverage, further demonstrating the importance of glacial cycles and events prior to the LGM in shaping demographic history. Reconstructing the origins and differential introgressive history has implications for predictions on species responses under climate change. Our results have implications for other whole genome analyses using pairwise sequentially Markovian coalescent (PSMC) analyses, as well as highlighting the need to investigate pre‐LGM demographic patterns to fully reconstruct the origin of species diversity, especially for high‐latitude species.
Keywords: climate change, demographic history, diversification, Pleistocene, Rangifer tarandus, whole genome sequences
1. INTRODUCTION
The evolution of terrestrial flora and fauna was strongly impacted by glacial fluctuations during the Pleistocene (Hewitt, 2004; Shafer et al., 2010; Soltis et al., 2006) that caused repeated range shifts and restricted populations to ice‐free refugia with viable habitat (Hewitt, 2004; Shafer et al., 2010; Soltis et al., 2006). Glacial cycles have had major biogeographical consequences and have contributed to the diversification of biodiversity by partitioning genetic variation across the landscape through bottlenecks, genetic drift, and mutations that result in genetic differentiation and local adaptations in geographically separated refugia (Hewitt, 2004).
Previous studies have suggested that genetic diversity in western North American wildlife populations is the result of recurrent cycles of range shifts caused by expansion and contraction, isolation, and potential introgression that, in combination with habitat heterogeneity, potentially explains the observed intraspecific diversity and local adaption (Campbell et al., 2015; Galbreath et al., 2011; Shafer et al., 2010). There have been many genetic and genomic studies which have reconstructed the evolutionary history of wildlife in relation to glacial cycles in North America, particularly from the last glacial maximum (LGM; 26.5,000–19,000 years ago [kya]; Clark et al., 2009), and events since then. For example, studies of demographic expansion in downy woodpeckers (Picoides pubescens; Pulgarín‐R & Burg, 2012), dispersal routes and bison phylogeography (Bison sp.; Heintzman et al., 2016), and subspecies and genetic diversity of tree species in western North America (Roberts & Hamann, 2015) all provided valuable information on how the LGM shaped phylogeography. However, the advent of whole genome sequencing has advanced our ability to reconstruct demographic history and population sizes throughout the Quaternary, which have been shown to fluctuate considerably, such as in a demographic reconstruction of 38 avian species (Nadachowska‐Brzyska et al., 2015), and of 11 bat species (Chattopadhyay et al., 2019), among others (Kozma et al., 2016; Lucena‐Perez et al., 2020; Miller et al., 2012). Multiple cycles of population increase and decline, and associated range shifts, are likely to have influenced the processes of adaptation and diversification. Further studies of temporal dynamics during different glacial cycles will help us to understand the impact of climate change on biodiversity (Kozma et al., 2016; Nadachowska‐Brzyska et al., 2015).
In this study, we applied 33 whole genome sequences, coupled with ~1800 mitochondrial control region sequences, to investigate patterns of introgression and population size changes of caribou (Rangifer tarandus) in western North America throughout the Quaternary. In western North America, caribou (Rangifer tarandus) comprise two mitochondrial genetic lineages which are thought to have evolved around 120 kya (Banfield, 1961; Polfus et al., 2017; Yannic et al., 2013), and were in separate refugia during the LGM: the Beringian‐Eurasian lineage (BEL) in the Beringian refugium, and the North American lineage (NAL) were south of the ice sheets (Klütsch et al., 2012; McDevitt et al., 2009; Weckworth et al., 2012; Yannic et al., 2013). The two lineages recolonized the ice‐free landscape after the LGM and experienced admixture upon secondary contact (Klütsch et al., 2016), which has been referred to as a “hybrid swarm” (McDevitt et al., 2009).
Western North American caribou comprise several contemporary subspecies and Designatable Units (Figure 1; Banfield, 1961; COSEWIC, 2011). The three subspecies found in the region are Grant's caribou (Rangifer tarandus granti), barren‐ground caribou (R. t. groenlandicus), and woodland caribou (R. t. caribou). Grant's caribou and barren‐ground caribou are found in Alaska and northern Canada and are proposed to be of Beringian origin (BEL) whereas most woodland caribou ecotypes are proposed to have evolved south of the ice sheets (NAL) and are distributed throughout the boreal forest as well as the mountain regions (Banfield, 1961; COSEWIC, 2011). However, in caribou, subspecific designations are insufficient to characterize the morphological, behavioural, and ecological variation observed across the species range, and so the Committee on the Status of Endangered Wildlife in Canada (COSEWIC, 2011) introduced designatable units (DUs) to help with conservation of Canadian species. COSEWIC has identified and assessed five caribou DUs in western Canada based on differences in life history: barren‐ground, boreal, northern mountain, southern mountain, and central mountain (Table 1; Figure 1; COSEWIC, 2011).
FIGURE 1.
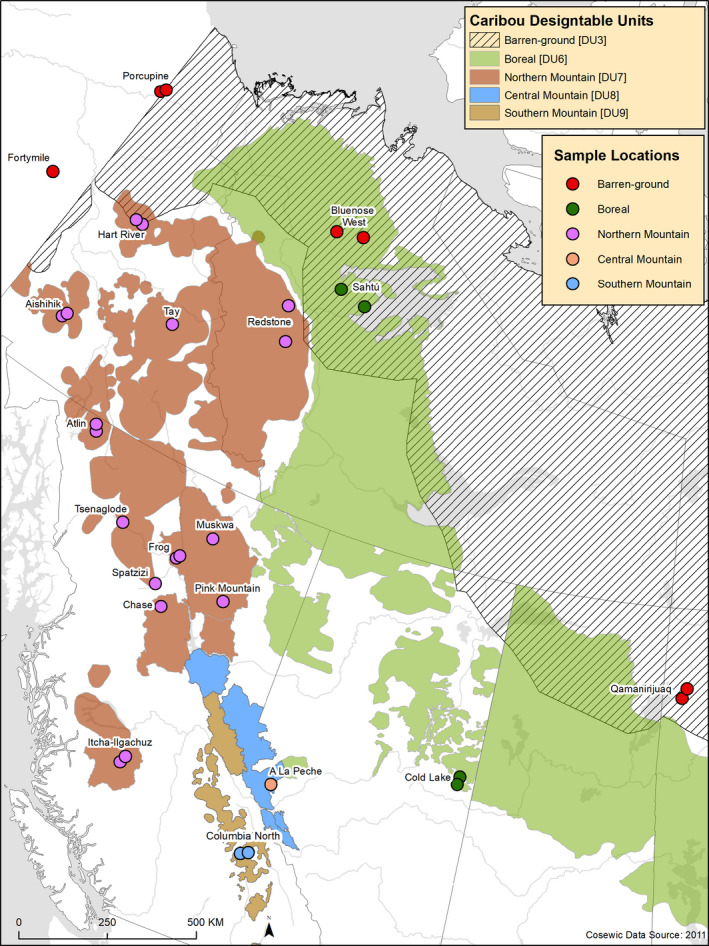
Map of sampling locations of the caribou whole‐genome sequences in north western North America. Background colours show the ranges of the Canadian designatable units (DUs) and points show the sample locations for the whole genome sequences and are coloured by DU
TABLE 1.
Caribou designatable units (DUs) in western North America, their subspecies, distribution, information on ecotype and whether they calve in groups, and population size estimates. Information from COSEWIC (2011, 2014a, 2014b, 2016)
| Designatable Unit | Subspecies | Distribution | Ecotype/calving strategy | Population size estimate |
|---|---|---|---|---|
| Barren‐ground (DU3) | Barren‐ground (R. t. groenlandicus), Grant's (R. t. granti) | Alaska, Yukon, Northwest Territories, Nunavut, Alberta, Saskatchewan, Manitoba | Migratory/aggregated | 800,000 |
| Boreal (DU6) | Woodland (R. t. caribou) | Northwest Territories, British Columbia, Alberta, Saskatchewan, Manitoba, Ontario, Quebec, Newfoundland | Sedentary/dispersed | 33,000–34,000 mature individuals plus unknown number of calves |
| Northern mountain (DU7) | Woodland (R. t. caribou) | Yukon, Northwest Territories, British Columbia | Montane/dispersed | 43,000–48,000 mature individuals |
| Central mountain (DU8) | Woodland (R. t. caribou) | British Columbia, Alberta | Montane/dispersed | 469 mature individuals |
| Southern mountain (DU9) | Woodland (R. t. caribou) | British Columbia | Montane/dispersed | 1,356 mature individuals |
Many genetic studies have focussed on the impacts of the LGM and events since then, on caribou ecotype demographic history, and contemporary genetic diversity, and have added valuable knowledge to our understanding of caribou evolutionary history (Klütsch et al., 2012, 2016; McDevitt et al., 2009; Weckworth et al., 2012; Yannic et al., 2013). However, not as much is known about the demographic history of caribou, in terms of population sizes and patterns of admixture, before the LGM. Lorenzen et al. (2011) investigated demographic responses of caribou (among other species) to climate and human activities back to ~50 kya using mitochondrial DNA and found climate to be an important driver of population changes. Polfus et al. (2016) used mitochondrial DNA and microsatellites to reconstruct dates of divergence between DUs in western North America using approximate Bayesian computation (ABC), finding the boreal ecotype to have evolved in parallel in the two mitochondrial linages.
Here, we aim to provide an improved demographic history reconstruction using 33 whole‐genomes and over 1800 mitochondrial control region sequences from the five western caribou DUs (Table 1) to (1) investigate effective population size changes and historical introgression events both between and within caribou ecotypes to further our understanding of the effects of different glacial periods on caribou diversity. (2) We also aim to assess whether there is genetic substructuring and differences in demographic history within the northern mountain caribou DU which is an area of particular interest since it was only partially glaciated over and probably presents an area of greater climate stability (Yannic et al., 2013). We also assess methodological nuances of whole genome analysis with the pairwise sequentially Markovian coalescent (PSMC; Li & Durbin, 2011) method, commonly used for demographic reconstruction in similar studies.
2. MATERIALS AND METHODS
2.1. Sample collection and DNA extraction
Caribou tissue and faecal samples were collected by the Government of British Columbia, the Government of Alberta, the Government of the Northwest Territories, communities of the Sahtú region of the Northwest Territories, Parks Canada, Environment and Climate Change Canada, and the Northern Contaminants Programme between 1999 and 2018 (complemented by GenBank sequences; Klütsch et al., 2012, 2017; McDevitt et al., 2009; Polfus et al., 2017; Roffler et al., 2012; Weckworth et al., 2012).
For whole genome analysis, we used 18 genomes sequenced for a previous study (Taylor, Manseau, Horn, et al., 2020). We combined these with 15 new whole genome sequences, 12 of which were from tissue samples and three of which were from faecal samples (Figure 1; Table 2). Two of the tissue and the three faecal genomes were used for a methods paper describing the success of reconstructing genomes using noninvasive samples (Taylor et al., 2020). Tissue samples were extracted using a Qiagen DNAeasy tissue extraction kit following the manufacturer's instructions (Qiagen). Samples were run on a Qubit fluorometer (Thermo Fisher Scientific) using the High Sensitivity Assay Kit and normalized to 20 ng/µl at a final volume of 50 µl. The laboratory protocol for faecal samples is described in detail in Taylor, Manseau, Redquest, et al. (2020). The DNA was shipped to The Centre for Applied Genomics (TCAG) at the Hospital for Sick Children (Toronto, Ontario) for library preparation and sequencing. The 15 samples, alongside one additional sample not included here, were run on eight lanes of an Illumina HiSeq X (Illumina). Raw reads from Taylor, Manseau, Horn, et al. (2020) are available on the National Centre for Biotechnology (NCBI) under BioProject accession number PRJNA634908 and those from Taylor, Manseau, Horn, et al. (2020) are available under BioProject accession number PRJNA694662. Raw reads from new genomes added in this study (Table 2) are available under BioProject accession number PRJNA754521.
TABLE 2.
Information for each caribou genome including sampling location and individual ID, designatable unit (DU), subspecies, collection year and tissue type, whether the sample is new for this manuscript, mean depth of coverage in the VCF file, and individual inbreeding coefficients
| Location and individual | DU | Subspecies | Collection year | Type | New for this study | Mean depth (VCF file) | Inbreeding co‐efficient, F |
|---|---|---|---|---|---|---|---|
|
Redstone, Northwest Territories, 15460 |
Northern mountain | Woodland | 2013 | Muscle | No | 39.482 | 0.000 |
|
Sahtú, Northwest Territories 17825 |
Boreal | Woodland | 2013 | Muscle | No | 38.174 | 0.006 |
|
Redstone, Northwest Territories 17896 |
Northern mountain | Woodland | 2014 | Muscle | No | 36.657 | 0.000 |
|
Qamanirijuaq, Manitoba 21332 |
Barren‐ground | Barren‐ground | 2008 | Hide | No | 36.344 | 0.000 |
|
Qamanirijuaq, Manitoba 21350 |
Barren‐ground | Barren‐ground | 2008 | Hide | No | 35.883 | 0.000 |
|
Cold Lake, Alberta 24461 |
Boreal | Woodland | 2014 | Faecal | No | 8.299 | 0.000 |
|
Cold Lake, Alberta 24476 |
Boreal | Woodland | 2014 | Faecal | No | 14.163 | 0.045 |
|
Bluenose West, Northwest Territories 27177 |
Barren‐ground | Barren‐ground | 2013 | Muscle | No | 39.243 | 0.000 |
|
Bluenose West, Northwest Territories 27186 |
Barren‐ground | Barren‐ground | 2013 | Muscle | No | 37.067 | 0.000 |
|
Aishihik, Yukon 27601 |
Northern mountain | Woodland | 2002 | Muscle | Yes | 17.104 | 0.098 |
|
Aishihik, Yukon 27602 |
Northern mountain | Woodland | 2002 | Muscle | Yes | 15.656 | 0.095 |
|
Fortymile, Yukon/Alaska 27673 |
Barren‐ground | Grant's | 1994 | Muscle | No | 17.798 | 0.000 |
|
Hart River, Yukon 27703 |
Northern mountain | Woodland | 2000 | Muscle | Yes | 15.871 | 0.000 |
|
Hart River, Yukon 27706 |
Northern mountain | Woodland | 1999 | Muscle | Yes | 16.921 | 0.000 |
|
Porcupine, Yukon 27737 |
Barren‐ground | Grant's | 2001 | Muscle | No | 37.870 | 0.000 |
|
Porcupine, Yukon 27738 |
Barren‐ground | Grant's | 2001 | Muscle | No | 38.195 | 0.000 |
|
Tay, Yukon 27772 |
Northern mountain | Woodland | 2005 | Muscle | Yes | 18.586 | 0.000 |
|
Tay, Yukon 27773 |
Northern mountain | Woodland | 2002 | Muscle | No | 22.778 | 0.000 |
|
Muskwa, British Columbia 28320 |
Northern mountain | Woodland | 2006 | Hide | Yes | 25.515 | 0.000 |
|
Frog, British Columbia 28327 |
Northern mountain | Woodland | 2002 | Hide | No | 34.055 | 0.000 |
|
Pink Mountain, British Columbia 28330 |
Northern mountain | Woodland | 2004 | Hide | Yes | 14.839 | 0.000 |
|
Spatzizi, British Columbia 28332 |
Northern mountain | Woodland | 2003 | Hide | Yes | 22.191 | 0.000 |
|
Chase, British Columbia 28336 |
Northern mountain | Woodland | 2004 | Hide | Yes | 18.829 | 0.000 |
|
Frog, British Columbia 28337 |
Northern mountain | Woodland | 2003 | Hide | No | 36.423 | 0.001 |
|
Tsenaglode British Columbia 28348 |
Northern mountain | Woodland | 2006 | Hide | Yes | 23.465 | 0.000 |
|
Itcha‐Ilgachuz, British Columbia 28395 |
Northern mountain | Woodland | 2006 | Hide | No | 31.516 | 0.162 |
|
Itcha‐Ilgachuz, British Columbia 28402 |
Northern mountain | Woodland | 2006 | Hide | No | 34.269 | 0.148 |
|
Atlin, British Columbia 28575 |
Northern mountain | Woodland | 2006 | Hide | No | 34.576 | 0.000 |
|
Atlin, British Columbia 28580 |
Northern mountain | Woodland | 2006 | Hide | No | 34.600 | 0.000 |
|
Columbia North, British Columbia 28646 |
Southern mountain | Woodland | 2014 | Hide | No | 34.912 | 0.053 |
|
Columbia North, British Columbia 28649 |
Southern mountain | Woodland | 2014 | Hide | No | 34.996 | 0.051 |
|
Sahtú, Northwest Territories 35082 |
Boreal | Woodland | 2015 | Muscle | No | 37.693 | 0.001 |
|
A La Peche, Alberta 40092 |
Central mountain | Woodland | 2018 | Faecal | No | 10.162 | 0.000 |
Laboratory protocols for the mitochondrial DNA control region sequencing analysis (mtDNA control region) are described in detail in Klütsch et al. (2012), Klütsch et al. (2016). 1832 samples were included for the mtDNA analysis (Figure 2; Table 3).
FIGURE 2.
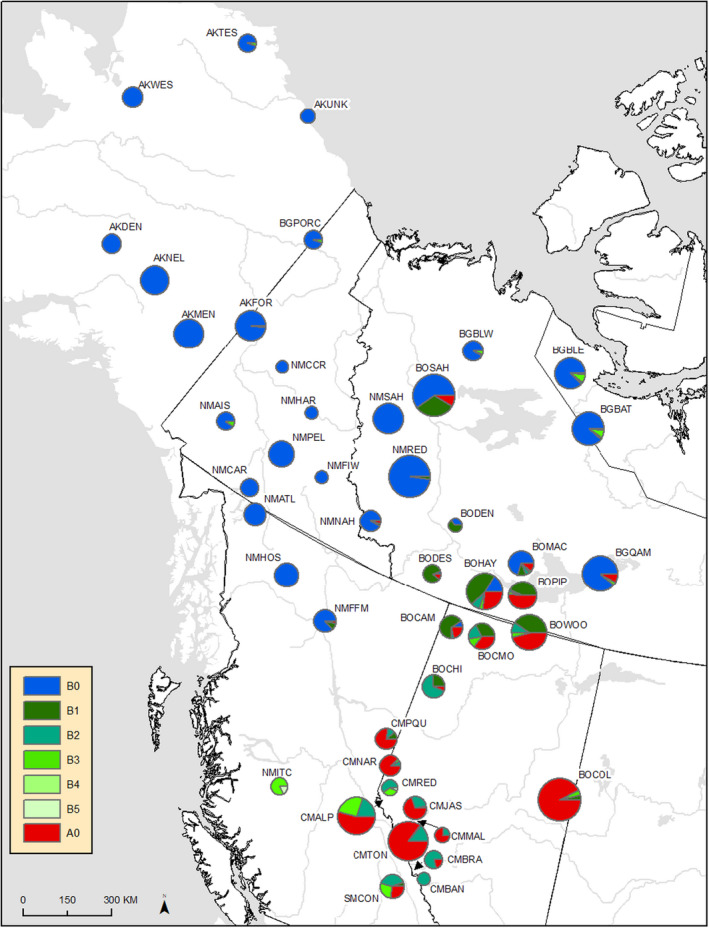
Map with the sampling locations for mitochondrial DNA analysis, showing the distribution of the mitochondrial control region haplotypes, indicating where haplotypes have introgressed. See Table 2 for location codes and sample sizes for each sample site
TABLE 3.
Mitochondrial control region sampling locations with their letter codes from Figure 2
| CODE | Locations | Latitude | Longitude | B0 | B1 | B2 | B3 | B4 | B5 | A0 | Total |
|---|---|---|---|---|---|---|---|---|---|---|---|
| AKDEN | Denali | 63.28396 | −151.50810 | 22 | 0 | 0 | 0 | 0 | 0 | 0 | 22 |
| AKFOR | Forty‐mile | 64.42725 | −140.53373 | 53 | 0 | 0 | 1 | 0 | 0 | 0 | 54 |
| AKMEN | Mentasta | 63.00830 | −143.46220 | 51 | 0 | 0 | 0 | 0 | 0 | 0 | 51 |
| AKNEL | Nelchina | 63.48716 | −147.66420 | 47 | 0 | 0 | 0 | 0 | 0 | 0 | 47 |
| AKTES | Teshekpuk | 70.39597 | −156.91040 | 19 | 0 | 0 | 1 | 0 | 0 | 0 | 20 |
| AKUNK | Alaska | 70.33583 | −148.36222 | 12 | 0 | 0 | 0 | 0 | 0 | 0 | 12 |
| AKWES | Western Arctic | 66.60290 | −158.88430 | 24 | 0 | 0 | 0 | 0 | 0 | 0 | 24 |
| BGBAT | Bathurst | 66.43731 | −114.79346 | 64 | 1 | 0 | 0 | 5 | 0 | 1 | 64 |
| BGBLE | Bluenose East | 67.88562 | −117.50977 | 69 | 0 | 2 | 0 | 7 | 0 | 1 | 79 |
| BGBLW | Bluenose West | 67.412762 | −125.36499 | 32 | 0 | 1 | 0 | 2 | 0 | 0 | 35 |
| BGPORC | Porcupine | 67.66055 | −140.95593 | 19 | 0 | 0 | 1 | 0 | 0 | 0 | 20 |
| BGQAM | Qamanirijuaq | 62.23136 | −111.35033 | 67 | 0 | 0 | 0 | 2 | 0 | 6 | 75 |
| BOCAM | Cameron Hills, Bischto | 59.79785 | −118.55923 | 3 | 21 | 1 | 0 | 0 | 0 | 7 | 32 |
| BOCHI | Chinchaga | 57.41372 | −119.12513 | 0 | 8 | 20 | 0 | 0 | 0 | 2 | 30 |
| BOCMO | Caribou Mountain, Yates | 59.35542 | −117.43220 | 0 | 13 | 8 | 5 | 0 | 0 | 14 | 40 |
| BOCOL | Cold Lake | 55.17002 | −110.67964 | 0 | 4 | 1 | 4 | 0 | 0 | 100 | 109 |
| BODEN | Dehcho North | 62.29718 | −121.45771 | 4 | 7 | 0 | 0 | 0 | 0 | 0 | 11 |
| BODES | Dehcho South | 60.64248 | −121.64378 | 1 | 16 | 0 | 0 | 0 | 0 | 2 | 19 |
| BOHAY | Hay River | 60.77236 | −117.69600 | 13 | 36 | 6 | 3 | 0 | 0 | 21 | 79 |
| BOMAC | Mackenzie | 61.88478 | −116.54786 | 26 | 4 | 2 | 1 | 0 | 0 | 4 | 37 |
| BOPIP | Pine Point Buffalo Lake | 60.21153 | −115.93125 | 0 | 20 | 1 | 1 | 0 | 0 | 24 | 46 |
| BOSAH | Sahtu | 65.65145 | −126.54011 | 62 | 33 | 0 | 0 | 0 | 0 | 9 | 104 |
| BOWOO | Wood Buffalo | 59.90850 | −114.74357 | 0 | 30 | 7 | 3 | 0 | 0 | 34 | 74 |
| CMALP | A La Peche | 53.43858 | −118.92344 | 0 | 0 | 17 | 0 | 23 | 0 | 47 | 87 |
| CMBAN | Banff | 51.71500 | −116.29982 | 0 | 0 | 10 | 0 | 0 | 0 | 0 | 10 |
| CMBRA | Brazeau | 52.34201 | −117.07834 | 0 | 0 | 15 | 0 | 0 | 0 | 4 | 19 |
| CMJAS | Jasper | 52.98333 | −118.10238 | 1 | 0 | 8 | 0 | 0 | 0 | 21 | 30 |
| CMMAL | Maligne | 52.69935 | −117.68889 | 0 | 0 | 3 | 0 | 0 | 0 | 10 | 13 |
| CMRED | Red Rock, Prairie Creek | 54.13340 | −119.53200 | 0 | 0 | 9 | 0 | 5 | 1 | 0 | 15 |
| CMTON | Tonquin | 52.56556 | −117.96707 | 0 | 0 | 13 | 0 | 1 | 0 | 80 | 94 |
| CMNAR | Narraway | 54.66849 | −119.83169 | 0 | 0 | 2 | 0 | 1 | 0 | 23 | 26 |
| NMAIS | Aishihik | 61.61043 | −137.91165 | 17 | 0 | 0 | 2 | 0 | 0 | 0 | 19 |
| NMATL | Atlin | 59.75043 | −133.10369 | 28 | 0 | 0 | 0 | 0 | 0 | 0 | 28 |
| NMCAR | Carcross, Ibex | 60.36040 | −134.28751 | 19 | 0 | 0 | 0 | 0 | 0 | 0 | 19 |
| NMCCR | Clear Creek | 63.98478 | −136.98158 | 9 | 0 | 0 | 0 | 0 | 0 | 0 | 9 |
| NMFFM | Frog, Finlay, Pink Mountain Muskwa | 57.93039 | −126.36552 | 26 | 3 | 0 | 0 | 0 | 0 | 1 | 30 |
| NMFIW | Finlayson, Wolf Lake | 61.80124 | −130.71740 | 10 | 0 | 0 | 0 | 0 | 0 | 0 | 10 |
| NMHAR | Hart River | 63.31764 | −133.55117 | 10 | 0 | 0 | 0 | 0 | 0 | 0 | 10 |
| NMHOS | Horseranch, Tsenglode Spatzizi | 61.26200 | −126.26450 | 33 | 0 | 0 | 0 | 0 | 0 | 0 | 33 |
| NMITC | Itcha‐ilgachuz | 52.76059 | −124.70425 | 0 | 0 | 0 | 0 | 14 | 3 | 0 | 17 |
| NMNAH | Nahanni, Coal River | 61.49190 | −125.26970 | 24 | 1 | 0 | 0 | 0 | 0 | 1 | 26 |
| NMPEL | Pelly, Tay | 61.76141 | −133.73186 | 38 | 0 | 0 | 0 | 0 | 0 | 0 | 38 |
| NMRED | Redstone | 61.69400 | −124.78670 | 99 | 2 | 0 | 0 | 0 | 0 | 0 | 101 |
| NMSAH | Mountain Sahtu | 64.38088 | −128.72190 | 54 | 0 | 0 | 0 | 0 | 0 | 0 | 54 |
| CMPQU | Parnsip, Quintette | 55.0026 | −120.2861 | 0 | 3 | 3 | 0 | 0 | 0 | 21 | 27 |
| SMCON | Columbia North | 51.2043 | −117.6590 | 0 | 2 | 13 | 0 | 9 | 0 | 9 | 33 |
Codes beginning with AK indicate samples from Alaska, BO indicates boreal caribou, CM central mountain, NM northern mountain, and SM southern mountain caribou. The number of each haplotype groups from each location is listed, as well as the total number of samples.
2.2. Genome filtering and variant calling
We used trimmomatic version 0.38 (Bolger et al., 2014) to trim adaptors and other Illumina sequences from the reads using the sliding window approach (4 base pairs at a time) to trim reads once the phred score dropped below 15. We aligned the filtered reads to the reference genome (Taylor et al., 2019; reads available under BioProject accession number PRJNA549927 and fasta assembly available at http://www.caribougenome.ca/downloads using bowtie2 version 2.3.0 (Langmead & Salzberg, 2012). The resulting SAM files were then converted to BAM files and sorted using samtools version 1.5 (Li et al., 2009). We removed duplicate reads and added correct read group information to each BAM file using picard version 2.17.3 (Available: http://broadinstitute.github.io/picard/ and then resorted the BAM file in samtools and built an index using Picard.
We called variants using Haplotype Caller in gatk version 3.8 (McKenna et al., 2010). This produced a variant call format (VCF) file for each caribou. These were combined, including the genomes from Taylor, Manseau, Horn, et al. (2020), using the Combine GVCFs function. We performed joint genotyping using Genotype GVCFs also in GATK. To ensure only high quality variant sites were included in subsequent analyses, we did two rounds of filtering in vcftools version 0.1.14 (Danecek et al., 2011). First, we removed indels and any site with a depth of less than five or more than 56 (double the mean depth of the genomes in the VCF file). We also tried filtering a maximum depth of 49 using the method as suggested by Li (2014) whereby the max depth = mean depth + 4*sqrt (mean depth): however all results were identical so we just present those from filtering at double the mean depth. We removed any low‐quality genotype calls (minGQ) and low‐quality sites (minQ), with scores below 20 (these are changed to missing data in vcftools). Second, we filtered to remove all missing data. The resultant VCF file contained 7,390,596 single nucleotide polymorphisms (SNPs). We measured the mean depth for each individual in vcftools. We used ngsrelate2 (HanghØj et al., 2019) to calculate inbreeding coefficients using the “‐F” function, as NGSrelate is robust to lower coverage samples.
We also produced a VCF file containing a Sitka deer genome (Odocoileus hemionus sitkensis) to use as an outgroup in some analyses. The raw reads for the Sitka deer, which were sequenced as part of the CanSeq150 Initiative, were downloaded from the NCBI database (Bioproject PRJNA476345, run SRR7407804). The reads were aligned to the reference genome and filtered as with the other genomes. We used Combine GVCFs and then performed joint genotyping using Genotype GVCFs in GATK to produce a VCF file with all caribou and the Sitka deer which was filtered in VCFtools as before. The resultant VCF file contained 7,965,158 SNPs.
2.3. Genome demographic PSMC analyses
We used pairwise sequentially Markovian coalescent (PSMC; Li & Durbin, 2011) to reconstruct historical changes in effective population size. Using the BAM files, we made a consensus fastq file for each caribou using samtools and bcftools 1.5 filtering to remove sites with a depth of <10 or more than double the mean depth for that individual and using the “‐C50” to downgrade the mapping quality for reads containing excessive mismatches. The consensus fastq was converted into an input file for PSMC (using the “fq2psmcfa” command), adding a filter to remove anything with a mapping quality score below 30. Following advice from the PSMC manual (https://github.com/lh3/psmc and Nadachowska‐Brzyska et al. (2015), we used several pilot runs to optimize the input parameters (‐t, ‐p, and ‐r), making sure that at least 10 recombination events were inferred at each interval after 20 rounds of iterations. We found that the free atomic time intervals (‐p) and the initial value of r = θ/ρ (−r) did not change the performance or the results. However, we found that the program performed better when setting the upper limit to the time to most recent common ancestor (‐t) to 5. We plotted the results using the mutation rate as calculated for reindeer of 1.1E−8 (Chen et al., 2019) and a generation time of 7 years (COSEWIC, 2014a, 2014b, 2015a, 2015b, 2016, 2017a, 2017b).
To thoroughly assess the impact of different depths of coverage across the genome, we did a subsampling analysis of our 15 highest depth individuals. We used the “‐s” option with samtools “view” to subsample the bam files, after filtering for a mapping quality “‐q 30”. We subsampled the depth to 30×, 25×, 20×, 19×, 18×, 17×, 16×, 15×, 14×, 13×, 12×, 11×, and 10×, and ran PSMC using the above settings. We also aligned the raw reads of the same 15 highest coverage individuals to the repeat masked version of the caribou reference genome (Taylor et al., 2019) to assess the impact of aligning to a repeat masked genome. For this, we created BAM files as above and ran these in PSMC.
Using our optimised settings, we ran all our individuals through PSMC as above, but not including the lowest coverage individuals given the results of our subsampling analysis, boreal Cold Lake (24461) and central mountain A La Peche (40092). We then performed 100 bootstraps for each individual to estimate the variance in the inferred effective population sizes. Additionally, we also analysed a reindeer genome from Inner Mongolia (from Li et al., 2017) by mapping the raw reads to the (nonrepeat masked) reference genome to create a BAM file and then running through PSMC as above.
2.4. Population and phylogenomic structure
Using the VCF file we performed a principal component analysis (PCA) in r 3.4.4 (R Core Team, 2018) using the packages vcfr (Knaus and Grüwald, 2017) and adegenet (Jombart, 2008). We also ran subsets of individuals for higher resolution of some clusters (see Section 3) using VCF files made as above containing only those individuals. We also used admixture (Alexander et al., 2009) to run a population assignment analysis by converting the VCF file into a BED file in plink 1.9 (Purcell et al., 2007). We pruned the data set to remove SNPs with a correlation coefficient of 0.1 or greater, and then ran the admixture analysis for K values between 1 and 8.
For phylogenomic analysis, we generated a SNP phylogeny, and we did not include the Sitka outgroup because it has such a long branch length that it made it difficult to resolve the branching patterns within the caribou, rather we rooted it where indicated by the rooted treemix analyses (see below). We used VCFkit (available here: https://vcf‐kit.readthedocs.io/en/latest/ using numpy 1.14 as the programme does not work with newer versions) and generated a fasta file from the VCF file using the “phylo fasta” command. The program concatenates SNPs for each sample, using the first genotype of each allele and replacing missing values with an N. We input the fasta file into RAxML (Stamatakis, 2014) and ran using the same parameters as above, visualizing the best tree in figtree.
2.5. Genomic tests for introgression
We used treemix 1.13 (Pickrell & Pritchard, 2012) to reconstruct a maximum likelihood phylogeny and to visualize migration events between populations. To create the input file from the VCF file we used stacks 2.4.1 (Catchen et al., 2013) using the populations function. We input this file into treemix and ran 10 iterations of 0–9 migration events. We plotted the resulting trees and residual plots in rstudio 1.0.136 (RStudio Team, 2015). We used the r package optm (available here: https://cran.r‐project.org/web/packages/OptM/index.html to calculate the ad hoc statistic delta M, which is the second order rate of change in the log‐likelihood of the different migration events, to help infer how many migration events to visualize. Because the optm package requires different likelihood scores between iterations, we used two different window sizes in our runs to account for possible linkage, doing five iterations of SNPs in groups of 250 and five iterations of SNPs in groups of 500. This analysis was done both with and without the Sitka deer outgroup.
We also calculated D statistics using ABBA BABA tests with Dsuite (Malinsky et al., 2021) with the “Dtrios” function, using the Sitka deer as the outgroup. This calculates D statistics for all combinations of individuals from a VCF file while attempting to infer relationships between populations. The output contains those combinations where the BBAA pattern is most common and so probably reflects the true relationship between populations, compared to ABBA and BABA patterns. As there are many combinations, Malinsky et al. (2021) suggest using a correction for multiple testing, and so we adjusted the p‐values using a false discovery rate (fdr) adjustment using the stats package in R Studio. After running with all locations as separate groups, we found that the results were always identical for both barren‐ground populations, for northern mountain Redstone and Tay, and for northern mountain Atlin, Chase, Frog, Tsenaglode, Spatzizi, and Muskwa. We grouped these as three populations for the input and reran the analysis to reduce the number of tests. We again corrected the p‐values using a false discovery rate adjustment as before.
2.6. Mitochondrial DNA analysis
We assessed phylogenetic relationships and divergence times among mitogenome control region haplotypes using Bayesian methods. The software jmodeltest 0.1.1 (Posada, 2008) was applied to identify HKY+G as the best substitution model using the Bayesian Information Criterion for caribou haplotypes. Two maximum clade credibility trees were created using beast v1.10.4 (Suchard et al., 2018) using time calibrated tips from ancient DNA derived haplotypes under a strict clock model, HKY+G substitution model, default optimization schedule, MCMC chain‐length of 200 million, sampling every 20,000 generations and removing the first 10% of runs. Two independent runs were conducted, and the results combined using the beast v1.10.4 package logcombiner. We analysed results from beast in tracer v1.7 (Rambaut et al., 2018) to check the effective sample sizes (ESS). The phylogenetic trees we estimated were summarized in the BEAST v1.10.4 package treeannotator and visualized in figtree 1.4.4. Ancient mtDNA haplotype dates, indicated by the timing of tip termination (those that end prior to time 0 indicate ancient sequences and where they terminate indicates the age of the sample), were included in the Bayesian phylogenetic reconstruction to infer divergence times of contemporary haplotypes. Divergence times were calculated as the node heights of the 95% highest posterior density (HPD) intervals.
We also created a minimum spanning tree of the haplotypes used for phylogenetic analysis in R studio using the package pegas (Paradis, 2010). For this, we imported the fasta file and created a distance matrix. We then made a randomized minimum spanning tree with 1,000 randomizations.
3. RESULTS
3.1. Genomic demographic history and the effects of repeat masking and genome depth
The average depth of our 33 whole genome sequences in the VCF file ranged between 8.3 and 39.5× coverage (Table 2). The lowest coverage individual, a boreal caribou from Cold Lake, was one of the three reconstructed from faecal DNA, and the results for this individual for some analyses may need to be interpreted with caution. The inbreeding coefficients varied between individuals, with most caribou having very low values (Table 2). Elevated coefficients were seen in the northern mountain Itcha‐Ilgachuz population (0.162 and 0.148), and slightly elevated coefficients were seen in the northern mountain Aishihik population (0.098 and 0.095; Table 2) and the southern mountain Columbia North population (0.053 and 0.051). The coefficient was lower for the lowest coverage boreal Cold Lake genome (0.000), as compared to the boreal Cold Lake individual with better coverage (0.045), which may indicate some error for this lower coverage individual (Table 2).
We subsampled genome coverage for the 15 highest coverage individuals, including four of the DUs, all of which have very low inbreeding coefficients with the exception of the two southern mountain individuals (Table 2). We found that different genome depths gave very similar shapes of the PSMC curve, but with lower effective population sizes reconstructed with lower depth, and with the curve slightly shifted towards more recent time periods (Figure 3). We did not find convergence of results at a particular depth, but instead the effects of coverage varied between individuals, in some cases going as low as 14x making a small difference in the peak effective population size (e.g., for barren‐ground Bluenose West, Figure 3f,g), but in other cases causing a much larger difference (e.g., barren‐ground Qamanirijuaq, Figure 3d,e). Overall, most showed a very gradual decline with no clear cutoff point (Figure 3).
FIGURE 3.
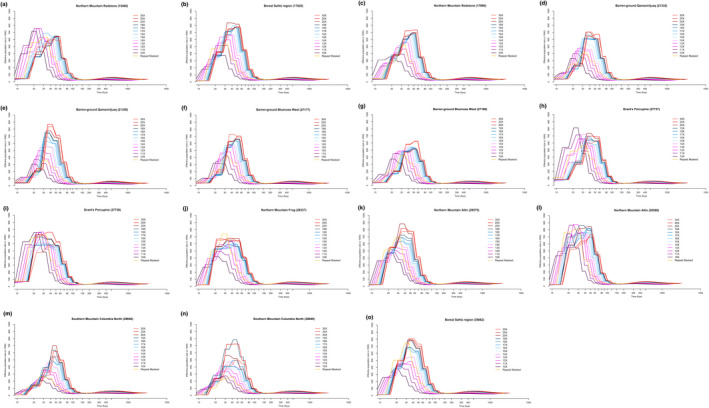
Pairwise sequentially Markovian coalescent (PSMC) results showing the reconstruction of historical effective population sizes of 15 highest coverage genomes subsampled to different depths of sequencing, as well as using the repeat masked version of the reference genome. We include boreal, barren‐ground, Grant's, northern mountain, and southern mountain caribou
We also aligned the raw reads of these genomes to the repeat masked version of the reference genome, which masked 39.55% of the genome (Taylor et al., 2019; repeat masked genome and report available at caribougenome.ca). The PSMC curves for the repeat masked genomes were generally similar in shape, but with lower effective population sizes than the highest coverage reconstructions. The repeat masked curves were also shifted towards more recent time frames (Figure 3), although do not show higher error margins in the bootstrap analyses (Figure S1).
We decided to exclude the two lowest coverage individuals from the full analysis but kept all individuals from 14× and above, given the very gradual shift in the shape of the curve observed and the difficulty in making a hard cutoff. Interpretation of the results for all our individuals should be viewed in light of our subsampling analysis, with higher coverage individuals probably having slightly higher effective population sizes and curves slightly shifted to the right. We decided not to use the repeat masked version of the reference genome given that the curves seem to look more similar to lower coverage results, instead relying on filtering regions for mapping quality and regions with over 2x the average depth for each individual to reduce mapping errors being included in the analysis.
Overall, we found different effective population sizes between sampled locations starting at ~120 kya (Figure 4a–h; see Figures S2–S6 for bootstrap plots). For boreal caribou, the Sahtú individuals from the Northwest Territories had a much higher historical population size during the expansion than the individual from Cold Lake (Figure 4a and Figure S2a–c). The lower coverage of the Cold Lake boreal genome probably caused some of the difference, although, given the magnitude of the difference, Cold Lake caribou probably did have a lower overall peak effective population size given that at comparable coverage levels (~14×), boreal Sahtú region individuals still had higher peak effective population sizes (~550–700,000 vs. ~300,000 for Cold Lake; Figures 3b,o and 2a). This probably reflects the parallel evolution of the boreal ecotype (Horn et al., 2018; Polfus et al., 2017; Taylor, Manseau, Horn, et al., 2020; Yannic et al., 2018).
FIGURE 4.
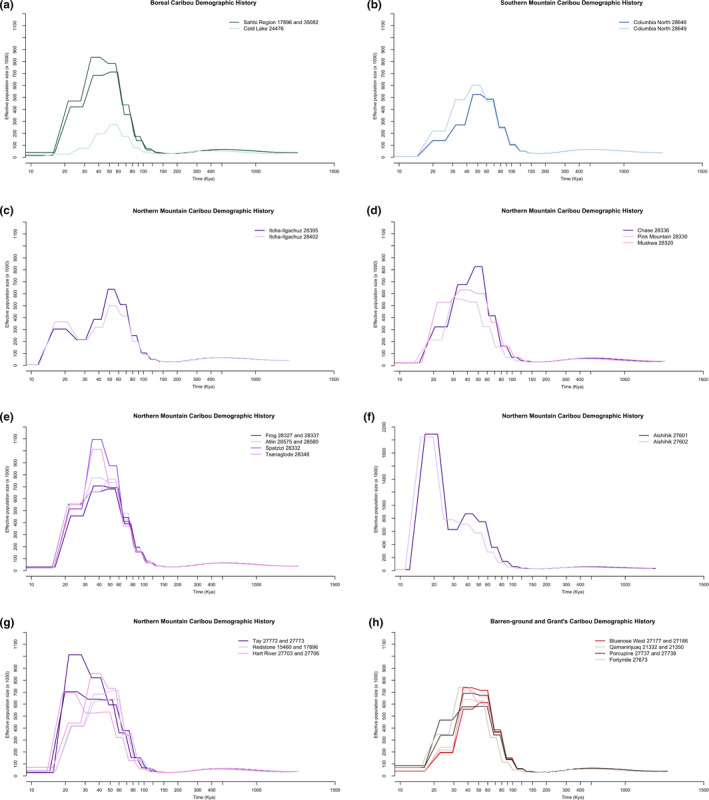
Pairwise sequentially Markovian coalescent (PSMC) reconstruction of historical effective population sizes of (a) boreal caribou (b) southern mountain caribou, (c) northern mountain Itcha, (d) northern mountain Chase, Pink Mountain, and Muskwa, (e) northern mountain Frog, Atlin, Spatzizi, Tseneglode, (f) northern mountain Aishihik, (g) northern mountain Tay, Redstone, Hart River, (h) Barren‐ground and Grant's. Note differences on the Y axis for Aishihik showing effective population sizes
Southern mountain caribou from Columbia North reached around 500–600,000 individuals (Figure 4b and Figure S3). The historical effective population sizes varied widely within the northern mountain caribou. Itcha‐Ilgachuz, Pink Mountain, and Muskwa had the lowest peak population sizes (Figure 4c–d and Figure S4), although for Pink Mountain this may be due to lower coverage. The other northern mountain caribou had peak effective population sizes ranging from ~700,000 to 1 million individuals (Figure 4d–g, Figures S4, S5), with the exception of Aishihik with indicated population sizes peaking at around 2 million caribou (Figure 4f), although with a large variation observed around these values in the bootstrap analysis (Figure S5). The Aishihik herd has a second, larger population increase around the time of the LGM, similar to the reconstruction of the reindeer genome (Figure S7). Itcha‐Ilgachuz also showed a second peak around the LGM, although this is smaller than the previous peak (Figure 4c).
Barren‐ground and Grant's caribou (which both belong to the barren‐ground DU) had similar historical population trajectories, with peak population sizes between 600,000 and 800,000 individuals (Figure 4h and Figure S6). Population sizes reached their highest at around 30–60 kya for boreal caribou (Figure 4a), 40–80 kya for southern mountain (Figure 4b), typically around 30–80 kya for northern mountain caribou (Figure 4c–g) apart from Aishihik with occurred much later at around 15–25 kya (Figure 4f), and around 30–70 kya for barren‐ground and Grant's caribou (Figure 4h). All populations had large declines in population sizes starting between 30–50 kya, aside from Aishihik for which population size declines occurred around 15 kya.
Northern mountain caribou from Itcha‐Ilgachuz and Aishihik had elevated inbreeding coefficients which may impact results, and we saw a large error margin predicted by the bootstrap analysis for Aishihik individuals (Figure 4f and Figures S5). However, removing runs of homozygosity did not change PSMC reconstructions in avian species (Nadachowska‐Brzyska et al., 2015, 2016), and both Aishihik individuals gave the same shape of curve.
3.2. Population and phylogenomic structure
The PCA with all individuals separated the northern mountain caribou from Itcha‐Ilgachuz most strongly (Figure 5). Most other northern mountain caribou grouped together, with the exception of Aishihik and Pink Mountain. Grant's caribou grouped within the cluster with most northern mountain genomes, with the barren‐ground caribou from both Bluenose West and Qamanirijuaq forming a separate group. Southern and central mountain caribou formed separate clusters. Boreal caribou from the Northwest Territories Sahtú and boreal caribou from Cold Lake were well separated from each other (Figure 5).
FIGURE 5.
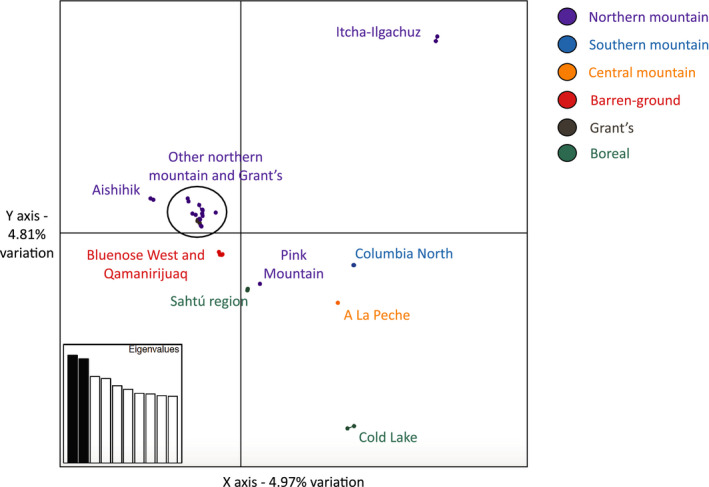
Principal coordinates analysis (PCA) plot showing the first two axes of variation with all caribou genomes. The points are coloured by ecotype, and labels show sampling locations of the points
The PCA with only the northern mountain caribou strongly separated Itcha‐Ilgachuz and Aishihik (Figure 6a) which may be related to their elevated inbreeding coefficients (Table 2). When removing these individuals, we see four major clusters: (1) Atlin, (2) Pink Mountain, (3) the other herds from British Columbia (Chase, Spatzizi, Frog, Muskwa, and Tseneglode), and (4) the herds from the Yukon and the Northwest Territories (Tay, Hart River, and Redstone; Figure 6b).
FIGURE 6.
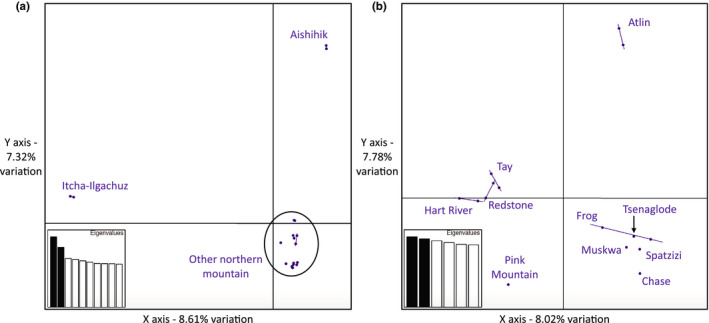
Principal coordinates analysis (PCA) plot showing the first two axes of variation for only the northern mountain caribou (a) and showing the northern mountain caribou without Itcha‐Ilgachuz and Aishihik individuals (b). Labels show sampling locations of the points
The results from Admixture did not give meaningful groups (Figure S8), and the lowest cross validation score was for K = 1. The Treemix analyses using the Sitka deer outgroup gave two possible roots with very similar topologies (Figure S9). We rooted the RAxML phylogeny based on these results (Figure 7 and Figure S10), with the difference that southern mountain Columbia North is reconstructed as a sister group to boreal Cold Lake in one Treemix topology (Figure S9b), but is always sister to northern mountain Itcha‐Ilgachuz in the RAxML analysis (Figure 7 and Figure S10) and the other Treemix topology (Figure S9a). Most of the northern mountain caribou group as sister populations with the Grant's caribou within them. All of the northern mountain caribou from British Columbia (B.C.) apart from Pink Mountain and Itcha‐Ilgachuz sit together in a clade, which is recovered as sister to northern mountain caribou from Tay in the Yukon and those from the Northwest Territories Redstone population (which are neighbouring herds geographically; Figure 1). Aishihik and Hart River northern mountain caribou sit with the Grant's caribou, which matches the geography as these are the closest to the Grant's caribou herds (Figures 1 and 7). The barren‐ground caribou are situated outside of the northern mountain and Grant's caribou. Southern mountain caribou sit with the northern mountain caribou from Itcha‐Ilgachuz, with boreal caribou from the Northwest Territories Sahtú region as a basal group. Depending on which root is used, either the Northwest Territories Sahtú region is followed by the northern mountain caribou from the Pink Mountain herd and then the central mountain caribou (Figure 7) with boreal Cold Lake as a separate clade, or the boreal Cold Lake and central mountain forming a separate clade. Regardless of which root is used, the overall patterns do not closely match the geography (Figure 1) nor the DU designations.
FIGURE 7.

Maximum likelihood phylogenomic reconstruction from SNP data. The tree has been rooted in one of two places indicated by the Treemix analysis, the other shown in Figure S10. Bootstrap support values are indicated on the nodes, and labels are coloured by ecotype
3.3. Genomic signatures of introgression
To determine if some of the population and phylogenomic results could have been influenced by introgression, we first ran Treemix to infer migration events. Adding two migration events gave the highest delta M score (Figure S11); however, when visualizing the trees and inferring two migration events, there was variation in where the events were inferred. Out of the 10 iterations, there were 14 different migration events inferred (out of a possible 20 with each iteration inferring two). Of the migration events that were inferred, most were from boreal Cold Lake into northern mountain Pink Mountain and northern mountain Itcha‐Ilgachuz into the ancestral population of central mountain A La Peche and southern mountain Columbia North (both inferred three times; all trees Figures S12a–j). Migration from southern mountain Columbia North into central mountain A La Peche and from boreal Cold Lake into the ancestral population of central mountain A La Peche and southern mountain Columbia North were both inferred twice. The other 10 inferred instances all occurred once, with nearly all inferred migration events also occurring between populations not matching expected geographical patterns: boreal Cold Lake, boreal Northwest Territories Sahtú region, northern mountain Pink Mountain and Itcha‐Ilgachuz, southern mountain Columbia North, and central mountain A La Peche (Figures S12a–j for full results), indicating that introgression probably impacted the phylogenomic reconstruction. The Treemix results also showed a large drift parameter for northern mountain Aishihik and Itcha‐Ilgachuz herds (Figures S12a–j), in line with the elevated inbreeding coefficients (Table 2). The rooted analysis showed similar patterns, with variation in the migration events occurring but usually involving the same populations (Figures S13a–j).
After false discovery rate correction, the ABBA BABA tests inferred 693 significant signatures of introgression out of 1,141 tests (see supporting information for full results, Tables S1, S2). After grouping some populations which always behaved the same in the analysis (see Methods), we found 218 significant signatures of introgression out of 287 tests, indicating a lot of genetic exchange between caribou populations (see Supporting Information for full results, Tables S1, S2). Significant results included many of the same events indicated by the Treemix analysis, except in cases where the two populations were sister populations (with a BBAA pattern) and therefore could not be tested with the ABBA BABA test. For example, introgression from central mountain A La Peche into southern mountain Columbia North, as well as from southern mountain Columbia North into northern mountain Itcha‐Ilgachuz were never tested, as the SNPs showed a higher prevalence of BBAA patterns in these cases. Overall, most caribou populations showed signatures of introgression between them, which may also explain the high number of migration events being inferred by treemix.
3.4. Mitochondrial analyses and signatures of introgression
The haplotype groups we recovered from both the BEL lineage (B haplotypes) and the NAL lineage (A haplotypes) are shown geographically in Figure 2 (see supporting information for full haplotype sequences, Data S1). We found that after running BEAST, all ESS values were much greater than 200, indicating that the length of the MCMC accurately represented the posterior distribution (Kuhner, 2009). BEL mtDNA associated with western North America coalesced ~120–130 kya (Figure 8; see Figure S14 for figure including HPD intervals). The overall mtDNA diversification is consistent with high effective population sizes given the number of emerging lineages over time and contemporary number of haplotypes. It is important to note that the haplotypes in this analysis are a subset of a much larger data set that contains other regions of Canada as well as Eurasia, reflecting even more diversity.
FIGURE 8.
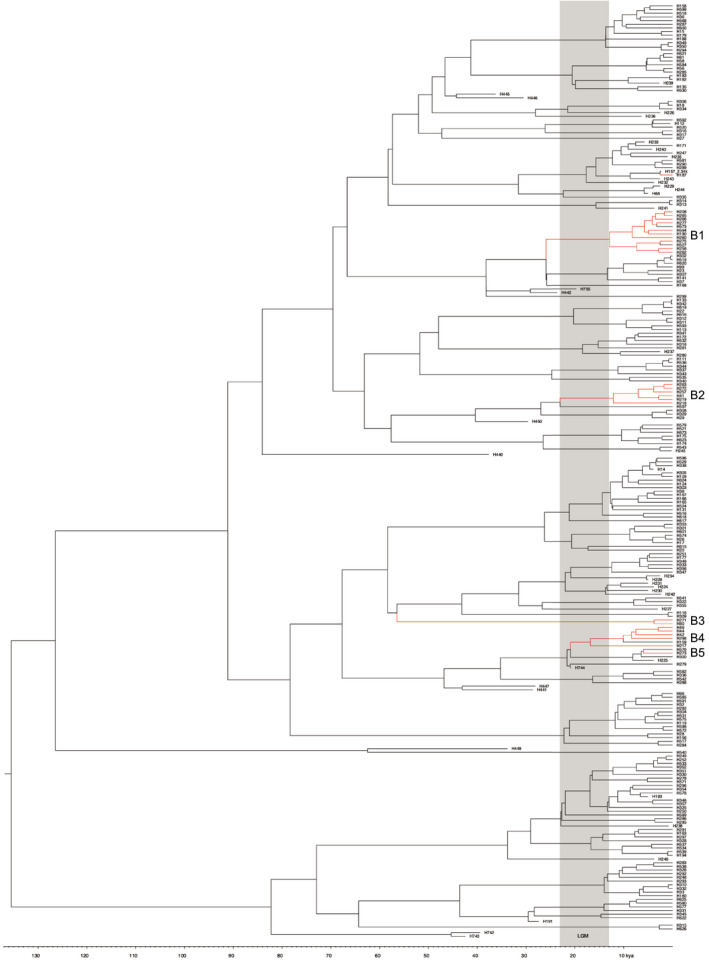
Mitochondrial haplotype phylogeny with the LGM shaded in grey. Introgression events are shown in red and refer to haplotypes from populations not from the same lineage
Lineages or haplotypes putatively reflecting introgression can be seen highlighted in red in Figure 3 and were identified based on clustering together and a predominant distribution within ecotypes not associated with Beringia (e.g., boreal caribou and southern mountain ecotypes; and a southern distribution such as Itcha‐Ilgachuz or Jasper). Lineage B1 (haplotypes 190, 208, 260, 265, 266, 277, 275, 527, 258, 262,573 and 594) reflects introgression dating back to ~38,000 to 25,000 years ago. Lineage B2 (haplotypes 41, 218, 219, 247, 263 and 272) is associated with a broad distribution of boreal caribou in the west and into regions in Ontario and reflects a potential introgression event predating the early LGM boundary. Lineage B3 (haplotypes 80 and 271), associated with Caribou Mountain, Cold Lake, and Wood Buffalo boreal caribou, is also found in Beringian regions such as the Fortymile and the Porcupine caribou populations. These haplotypes may reflect an ancient introgression event dating as far back as 60,000 years ago. Lineage B4 (haplotypes 42, 44, 46, 159, 217, 298), associated with southern and central mountain caribou, dates to within the LGM and may reflect introgression that occurred from ancestral BEL haplotypes that moved south prior to the maximal ice sheet, however this introgression may have occurred post‐LGM. The proliferation of mountain specific haplotypes in this lineage does support a more ancient introgression. Lineage B5 (haplotypes 273 and 576) is associated with Itcha‐Ilgachuz, and Redrock‐Prairie Creek is related to Lineage B4 and appears to reflect post‐LGM introgression (Figures 2 and 8). While incomplete lineage sorting (ILS) is a possible explanation for some for these mtDNA patterns, the grouping of the haplotypes makes introgression more likely. However, future work will be needed to fully rule out ILS. The relationships between the haplotypes and haplotype groups are also visualized in the minimum spanning tree (Figure S15).
4. DISCUSSION
4.1. Western caribou effective population sizes
We used 33 whole‐genome sequences and over 1800 mitochondrial control region sequences to investigate genomic structure, patterns of introgression, and changes in effective population sizes in caribou from different regions of western North America. Even though the different genome depths and repeat masking results affected the peak effective population sizes, the shape of the curve was always similar. We are thus confident that all patterns we uncovered are robust, but that effective population sizes may have been underestimated, with a slight shift in timing towards more recent dates for lower coverage individuals. We found that genetic sub‐structuring between individuals, even those within the northern mountain ecotype is apparent with differences in demographic histories being reconstructed (Figure 4). This highlights the need to analyse multiple individuals of the same species or even ecotype as interpretations based on single individuals, while common with PSMC, can be biased (Kozma et al., 2016).
Caribou show rising and differential effective population sizes starting at ~120 kya (Figure 4). We found that effective population sizes reached up to ~1 million individuals for some populations, (Figure 4, Figures S2–S6), indicating an incredible diversification of caribou in the western regions of North America long before the LGM. It is possible that the PSMC peak is being inflated by population structuring (Mather et al., 2020), but even so, ~120–50 kya was clearly a critical period of diversification between lineages. The large historical effective population sizes are far greater than most PSMC reconstructions of mammal species thus far (Bunnefeld et al., 2015; Ekblom et al., 2018; Liu et al., 2018; Mays et al., 2018; Miller et al., 2012; Tsuchiya et al., 2020; Westbury et al., 2018, 2019; Yim et al., 2014; Yuan et al., 2018) with the potential exception of some bat species, depending on the generation time used (Chattopadhyay et al., 2019). This is perhaps unsurprising given the broad distribution of caribou, especially those with a life history strategy involving large population sizes, for example the barren‐ground DU (Table 1; COSEWIC, 2011, 2016).
Especially for a large mammal species, these high peak effective population sizes probably had lasting impacts on contemporary diversity. Many caribou populations have very high levels of genetic diversity, as seen from the very low whole genome inbreeding coefficients for most individuals (Table 2), but also from previous studies using microsatellites which found high levels of diversity for a large mammal species (Courtois et al., 2003; McLoughlin et al., 2004; Polfus et al., 2017; Zittlau et al., 1998). In addition, at least some of the variation in morphology and life history (COSEWIC, 2011) may have originated during the expansion in population sizes at this time (Polfus et al., 2016).
4.2. Population structure and introgression
Overall genomic structure shows separation between individuals from different DUs, although with a few exceptions: boreal caribou from the Northwest Territories are not most closely related with the boreal caribou from Cold Lake (Figures 5 and 7), a reflection of parallel evolution of the boreal ecotype inferred previously (Horn et al., 2018; Polfus et al., 2017; Taylor, Manseau, Horn, et al., 2020; Yannic et al., 2018). Northern mountain caribou have substructuring within them, notably, Itcha‐Ilgachuz and Aishihik are well separated in the PCA (Figures 5 and 6b). The Aishihik herd has a very different demographic reconstruction than all other caribou included here. However, this population may have had some admixture with reindeer (Mager et al., 2013), and we see a more similar demographic reconstruction with the reindeer genome, which also shows a second, larger population increase around the time of the LGM (Figure S7). Pink Mountain caribou cluster closer to the Northwest Territories Sahtú boreal caribou (Figures 5 and 7). The other northern mountain caribou follow a geographical pattern, with individuals from the province of British Columbia clustering together, with the exception of Atlin, which is found near the Yukon border. Individuals from the Yukon and the Northwest Territories, which are geographically closest, also clustered together (Figure 6b). The populations not found where expected in the phylogenomic reconstruction based on their geographic locations were potentially impacted by introgression events. For example, introgression from boreal caribou from Cold Lake into boreal caribou from the Northwest Territories Sahtú region, and into northern mountain Pink Mountain, as well as introgression between northern mountain Itcha‐Ilgachuz and central and southern mountain caribou, was found in Treemix (Figure S11). The results of the D statistics also point towards extensive introgression between the caribou populations (see supporting information for full results; Tables S1, S2), further supporting that phylogenomic patterns could be influenced by introgression between different caribou populations. The ADMIXTURE results gave no meaningful groups and indicated K = 1, which may be due to the extensive introgression between populations, although this could also be because we did not have enough individuals per population.
The overall patterns from the mitochondrial data, the PCA, nuclear phylogeny, and the PSMC analysis demonstrate that there is no one mountain ancestor, and that even geographically close populations may have different demographic histories. It is likely that mountain caribou underwent multiple different colonization events which influenced the current genetic structure and biogeography, given that there were multiple periods after the original diversification when ice‐free corridors would have allowed the movement of these highly mobile animals (e.g., Figure 9; maps reconstructed from data from Batchelor et al., 2019). Northern mountain Itcha‐Ilgachuz caribou appear to be from a Beringian origin, with mostly B mitochondrial haplotypes, but may have undergone a more ancient colonisation, followed by introgression, reflecting their divergence from other northern mountain caribou. Southern mountain caribou may also be of Beringian origin, having mostly B haplotypes and may also have undergone a more ancient colonisation. In contrast, central mountain caribou have more A haplotypes, and so could be of NAL origin. The genetic groupings we see in the rest of the northern mountain caribou also probably demonstrate different histories, with a clade showing affinity with the Grant's caribou, and a group with Redstone and Tay (Figures 5, 6, 7, also clear when viewing the third and fourth PCA axes with all individuals Figure S16). We also see a clade with the British Columbia northern mountain caribou herds. Although Atlin is positioned basally on the phylogeny, and they separate on the PCAs (Figures 5, 6, 7), it is possible they colonised North America separately from the others. It is clear that mountain caribou comprise populations which have been differentially impacted by potentially differential colonization timing with subsequent introgression and are not one homogenous group.
FIGURE 9.
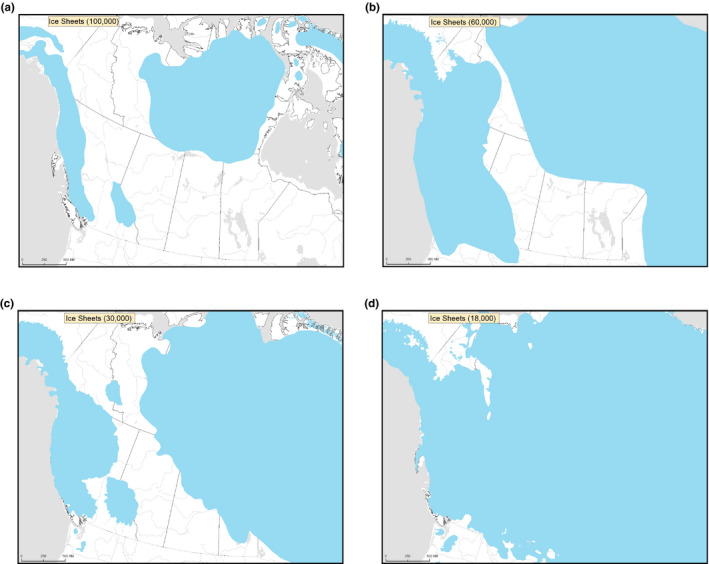
Maps showing the extent of ice coverage in North America at (a) 100 kya, (b) 60 kya, (c) 30 kya, and (d) 18 kya, key time points of divergence and introgression events for caribou. Maps reconstructed from data from Batchelor et al. (2019)
4.3. Relationship of caribou demographic history to temperature and glaciation
Determining how populations have responded to large fluctuations in climate and varying environments throughout the Quaternary may help us to understand how they could respond under future climate change (Chattopadhyay et al., 2019; Kozma et al., 2016, 2018; Louis et al., 2020; Yannic et al., 2013). Particularly at northern latitudes, there were large changes in available habitat and levels of glaciation (Chattopadhyay et al., 2019) which would have influenced caribou distributions and abundance. Comparing the key dates of caribou population expansion, decline, and introgression events to temperature and ice coverage at the same time periods (Figure 9) could lead to some insights. Just before the caribou population expansion was the Eemian, a period of large climatic oscillations (Kozma et al., 2016; Miller et al., 2012). The beginning of the caribou diversification coincides with the transition to the last glacial period ~110 kya, when interglacial temperatures changed from very warm at the end of the Mid‐Brunhes event to a period of cooling (see Figure 2 in Kozma et al., 2016; Miller et al., 2012). Ice coverage was not very extensive over western North America during this time (Figure 9a), and so there was probably an abundance of available habitat for caribou to disperse into. Reconstruction of vegetation patterns around this time (~126–112 kya) show that Canada was predominantly boreal forest and shrub tundra habitats, similar to recent, reconstructed (post‐LGM) vegetation patterns (Allen et al., 2020) The continued period of cooling coincides with the peak of the PSMC plots during the diversification, usually around 40–80 kya (Figure 4; Kozma et al., 2016; Schmidt & Hertzberg, 2011).
Interestingly, the dates of the pre‐LGM introgression events inferred from the mtDNA, ~60 kya and ~30 kya (Figure 8), coincide with periods of lower temperatures during the temperature oscillations of the last glacial period (Kozma et al., 2016; Schmidt & Hertzberg, 2011) and increased ice coverage with an ice‐free corridor (Figure 9b and c). Range redistributions under more extensive glaciation may have increased the likelihood of introgression events among caribou populations normally geographically separated, even if population sizes were not necessarily small, as was the case at 60 kya (Figure 4). The ice‐free corridor would have allowed movement and channelled the movement along a specific path, perhaps facilitating introgression events between populations on either side of the ice sheets. Another two of the introgression events date to around the LGM, another period of maximal glaciation (Figure 9d).
The strong declines in effective population sizes generally coincides with periods of particularly rapid and dramatic climate changes of up to 16ºC, with interstadial warming events (known as Dansgaard‐Oeschger, or D‐O, cycles; Cooper et al., 2015; Schmidt & Hertzberg, 2011). During this period, from ~50 kya onwards, North America lost around 72% of its large mammalian genera probably due to these rapid warming events (Cooper et al., 2015; Lorenzen et al., 2011). Human colonization did not occur in North America until 15 kya ruling out anthropogenic impacts (Lorenzen et al., 2011). It thus seems likely that the population declines we observe in caribou were also driven by these rapid changes in temperature and thus this species is probably vulnerable to future rapid climate warming.
Caribou effective population sizes were already much lower going into the LGM and remained stable after this period up until 10 kya (Figure 4) where PSMC loses accuracy. The barren‐ground and Grant's caribou maintained higher effective population sizes at this point (Figure 4h), never dropping as low as mountain and boreal caribou (the latter two both belong to the woodland subspecies). Caribou ecotypes found in forested habitat present more limited movement or migration when compared to barren‐ground caribou, which may have made them more susceptible to climate change. Additionally, although historical population size changes were assumed to be due to climate changes, predators and other biotic interactions probably also played a role (Bai et al., 2018; Kozma et al., 2018). Currently, woodland ecotypes continue to have smaller, in many cases declining population sizes with significant range retractions resulting in many at risk populations (Festa‐Bianchet et al., 2011; COSEWIC, 2014–2017). More recently, after the LGM, caribou have again undergone population expansion and diversification, as evidenced by the number of new haplotypes emerging within the last 10 kya (Figure 8). This expansion coincides with a period of relatively stable temperatures (Schmidt & Hertzberg, 2011) and low glaciation which provided an abundance of habitat, predominantly boreal forest and shrub tundra biome types (Allen et al., 2020), for caribou to diversify into, similar to the original diversification ~110 kya. Future work should aim to use species distribution models to validate the patterns we describe here, which will become increasingly possible with the further development of climate data and detailed vegetation reconstruction going back to over 100 kya (Allen et al., 2020). Species distribution modelling of caribou during more recent time periods (LGM to present), however, has demonstrated that caribou are not dispersal limited, apart from large significant barriers such as oceans and glaciers, with individuals moving as much as >4800 km/year (Yannic et al., 2020), which supports the likelihood that when ice free corridors were present, caribou would have travelled through them potentially leading to admixture. However, the high mobility of caribou means that modelling is complicated by the fact that the current location of specific caribou ecotypes is probably different from areas occupied in the past; a pattern that can only be elucidated by ancient DNA samples.
4.4. Genome depth and repeat masking for PSMC analyses
As with many whole genome studies, our demographic reconstruction relied in large part on the program PSMC. The depth of genome coverage is known to impact the results from PSMC analyses, with many following guidelines from a useful study on Ficedula flycatchers by Nadachowska‐Brzyska et al. (2016). As our study includes genomes with differences in depth (Table 2), we thought it pertinent to thoroughly assess the effects of depth on PSMC analyses to see if the results from a genome depth below 18× should be avoided due to a drop in effective population sizes being reconstructed in caribou, as was found for the flycatchers (Nadachowska‐Brzyska et al., 2016). We found that depth had a similar effect on the PSMC results as was found by Nadachowska‐Brzyska et al. (2016); however, we did not find convergence of results at 18×, but instead the effects of coverage varied between individuals. We used a slightly different approach, as instead of comparing multiple individuals with different sequencing depth, we subsampled our highest coverage genomes to multiple depths to directly compare the effects within an individual. Our findings demonstrate that it may be necessary for all whole genome studies using PSMC, especially when comparing genomes of different depth, to undertake a similar subsampling analysis to assess the effects of coverage on their study species and populations as results may not be consistent between studies.
Additionally, we wanted to directly compare the depth results with analyses run using a repeat masked genome, which is often recommended for PSMC analyses (Foote et al., 2016; Nadachowska‐Brzyska et al., 2016), but not always used as some studies have found a loss in power due to increased missing data across the genome (Bai et al., 2018; Morin et al., 2021). Our repeat masked genome masked 39.55% of the genome, which may explain why the PSMC analysis appeared to lose power (Figure 3). In cases such as ours where masking the genomes results in a very large proportion of missing data, it is probably better to rely on strict mapping quality and depth filtering, as has been done in other studies (Bai et al., 2018).
5. CONCLUSIONS
We have demonstrated, using nuclear whole‐genome sequencing combined with large scale mitochondrial sequencing, that a major population expansion of caribou occurred starting at the beginning of the last glacial period, ~110 kya. We also found genomic substructuring, even within DUs, with diverse introgression events prior to and following the LGM probably influencing population dynamics. The timing of the origins and differential introgressive history appears to coincide with colder periods and extensive ice coverage whereas the periods of strong declines in effective population sizes generally coincide with periods of rapid warming events. These results will contribute to our understanding of how the species will respond to future climate conditions and importantly, whether the response may vary within the species given intraspecific variation, such as between caribou ecotypes. Additionally, an important outcome of our work is the careful application of PSMC, a widely‐used program for demographic history reconstruction using whole genome data. We recommend other studies also assess the impacts of genome depth and repeat masking on PSMC results, particularly when using genomes of varying sequencing depth.
AUTHOR CONTRIBUTIONS
Rebecca S. Taylor carried out analyses of genomes and wrote the manuscript. Micheline Manseau conceived the study, secured funding, and edited the manuscript. Cornelya F. C. Klütsch helped to conceive the study and write the manuscript. Jean L. Polfus, Audrey Steedman, Dave Hervieux, Allicia Kelly, Nicholas C. Larter, Mary Gamberg, and Helen Schwantje coordinated or collected samples and edited the manuscript. Paul J. Wilson conceived the study, secured funding, performed the mitochondrial DNA analysis, and edited the manuscript.
Supporting information
Figures S1‐S16
Table S1
Table S2
Data S1
ACKNOWLEDGEMENTS
Funding was provided through an NSERC Collaborative Research & Development (CRD) grant, NSERC grant RGPIN‐2015–04477, Manitoba Hydro, Saskatchewan Power and Weyerhaeuser Inc. We would like to thank all the field workers for carefully collecting and storing samples from the field, Marina Kerr, Jill Lalor, Bridget Redquest, and Austin Thompson for technical support in the laboratory and Sonesinh Keobouasone for generating maps and aiding with data management. We are thankful to Ella Clark for help with literature searches, Daria Martchenko for sharing R code for plotting PSMC outputs, and Brody Crosby for making the minimum spanning tree and rooted Treemix figures. We are also thankful to the facilities of the Shared Hierarchical Academic Research Computing Network (SHARCNET: www.sharcnet.ca and Compute Canada/ Calcul Canada gme‐665‐ab. Compute Canada (RRG gme‐665‐ab), and Amazon Cloud Computing for high‐performance computing services.
Taylor, R. S. , Manseau, M. , Klütsch, C. F. C. , Polfus, J. L. , Steedman, A. , Hervieux, D. , Kelly, A. , Larter, N. C. , Gamberg, M. , Schwantje, H. , & Wilson, P. J. (2021). Population dynamics of caribou shaped by glacial cycles before the last glacial maximum. Molecular Ecology, 30, 6121–6143. 10.1111/mec.16166
DATA AVAILABILITY STATEMENT
Raw reads from Taylor, Manseau, Horn, et al. (2020) are available on the National Centre for Biotechnology (NCBI) under BioProject accession number PRJNA634908 and those from Taylor, Manseau, Redquest, et al. (2020) are available under BioProject accession number PRJNA694662. Raw reads from new genomes added in this study are available under BioProject accession number PRJNA754521.
REFERENCES
- Alexander, D. H. , Novembre, J. , & Lange, K. (2009). Fast model‐based estimation of ancestry in unrelated individuals. Genome Research, 19, 1655–1664. 10.1101/gr.094052.109 [DOI] [PMC free article] [PubMed] [Google Scholar]
- Allen, J. R. M. , Forrest, M. , Hickler, T. , Singarayer, J. S. , Valdes, P. J. , & Huntley, B. (2020). Global vegetation patterns of the past 140,000 years. Journal of Biogeography, 47, 2073–2090. 10.1111/jbi.13930 [DOI] [Google Scholar]
- Bai, W. N. , Yan, P. C. , Zhang, B. W. , Woeste, K. E. , Lin, K. , & Zhang, D. Y. (2018). Demographically idiosyncratic responses to climate change and rapid Pleistocene diversification of the walnut genus Juglans (Juglandaceae) revealed by whole‐genome sequences. New Phytologist, 217, 1726–1736. 10.1111/nph.14917 [DOI] [PubMed] [Google Scholar]
- Banfield, A. W. F. (1961). A Revision of the Reindeer and Caribou, Genus Rangifer. National Museum of Canada, Bulletin No. 177, Queen’s Printer. [Google Scholar]
- Batchelor, C. L. , Margold, M. , Krapp, M. , Murton, D. K. , Dalton, A. S. , Gibbard, P. L. , Stokes, C. R. , Murton, J. B. , & Manica, A. (2019). The configuration of Northern Hemisphere ice sheets through the Quaternary. Nature Communications, 10, 3713. 10.1038/s41467-019-11601-2 [DOI] [PMC free article] [PubMed] [Google Scholar]
- Bolger, A. M. , Lohse, M. , & Usadel, B. (2014). trimmomatic: A flexible trimmer for Illumina sequence data. Bioinformatics, 30, 2114–2120. 10.1093/bioinformatics/btu170 [DOI] [PMC free article] [PubMed] [Google Scholar]
- Bunnefeld, L. , Frantz, L. A. , & Lohse, K. (2015). Inferring bottlenecks from genome‐wide samples of short sequence blocks. Genetics, 201, 1157–1169. 10.1534/genetics.115.179861 [DOI] [PMC free article] [PubMed] [Google Scholar]
- Campbell, M. A. , Takebayashi, N. , & López, J. A. (2015). Beringian sub‐refugia revealed in blackfish (Dallia): implications for understanding the effects of Pleistocene glaciations on Beringian taxa and other Arctic aquatic fauna. BMC Evolutionary Biology, 15, 144. 10.1186/s12862-015-0413-2 [DOI] [PMC free article] [PubMed] [Google Scholar]
- Catchen, J. , Hohenlohe, P. A. , Bassham, S. , Amores, A. , & Cresko, W. A. (2013). stacks: An analysis tool set for population genomics. Molecular Ecology, 22, 3124–3140. 10.1111/mec.12354 [DOI] [PMC free article] [PubMed] [Google Scholar]
- Chattopadhyay, B. , Garg, K. M. , Ray, R. , & Rheindt, F. E. (2019). Fluctuating fortunes: genomes and habitat reconstructions reveal global climate‐mediated changes in bats’ genetic diversity. Proceedings of the Royal Society B. Biological Sciences, 286, 20190304. 10.1098/rspb.2019.0304 [DOI] [PMC free article] [PubMed] [Google Scholar]
- Chen, L. , Qiu, Q. , Jiang, Y. U. , Wang, K. , Lin, Z. , Li, Z. , Bibi, F. , Yang, Y. , Wang, J. , Nie, W. , Su, W. , Liu, G. , Li, Q. , Fu, W. , Pan, X. , Liu, C. , Yang, J. , Zhang, C. , Yin, Y. , … Wang, W. (2019). Large‐scale ruminant genome sequencing provides insights into their evolution and distinct traits. Science, 364, eaav6202. 10.1126/science.aav6202 [DOI] [PubMed] [Google Scholar]
- Clark, P. U. , Dyke, A. S. , Shakun, J. D. , Carlson, A. E. , Clark, J. , Wohlfarth, B. , Mitrovica, J. X. , Hostetler, S. W. , & McCabe, A. M. (2009). The last glacial maximum. Science, 325, 710–714. 10.1126/science.1172873 [DOI] [PubMed] [Google Scholar]
- Cooper, A. , Turney, C. , Hughen, K. A. , Brook, B. W. , McDonald, H. G. , & Bradshaw, C. J. (2015). Abrupt warming events drove Late Pleistocene Holarctic megafaunal turnover. Science, 349, 602–606. 10.1126/science.aac4315 [DOI] [PubMed] [Google Scholar]
- COSEWIC (2011). Designatable units for caribou (Rangifer tarandus) in Canada. Committee on the Status of Endangered Wildlife in Canada. [Google Scholar]
- COSEWIC (2014a). COSEWIC assessment and status report on the Caribou Rangifer tarandus, Newfoundland population, Atlantic‐Gaspésie population and Boreal population, in Canada. Committee on the Status of Endangered Wildlife in Canada. [Google Scholar]
- COSEWIC (2014b). COSEWIC assessment and status report on the Caribou Rangifer tarandus, Northern Mountain population, Central Mountain population and Southern Mountain population in Canada. Committee on the Status of Endangered Wildlife in Canada. [Google Scholar]
- COSEWIC (2015a). COSEWIC assessment and status report on the Peary Caribou Rangifer tarandus pearyi in Canada. Committee on the Status of Endangered Wildlife in Canada. [Google Scholar]
- COSEWIC (2015b). COSEWIC assessment process, categories and guidelines. Committee on the Status of Endangered Wildlife in Canada. [Google Scholar]
- COSEWIC (2016). COSEWIC assessment and status report on the Caribou Rangifer tarandus, Barren‐ground population, in Canada. Committee on the Status of Endangered Wildlife in Canada. [Google Scholar]
- COSEWIC (2017a). COSEWIC assessment and status report on the Caribou Dolphin and Union population (Rangifer tarandus), in Canada. Committee on the Status of Endangered Wildlife in Canada. [Google Scholar]
- COSEWIC (2017b). COSEWIC assessment and status report on the Caribou Rangifer tarandus, Eastern Migratory population and Torngat Mountains population, in Canada. Committee on the Status of Endangered Wildlife in Canada. [Google Scholar]
- Courtois, R. , Bernatchez, L. , Ouellet, J. P. , & Breton, L. (2003). Significance of caribou (Rangifer tarandus) ecotypes from a molecular genetics viewpoint. Conservation Genetics, 4, 393–404. 10.1023/A:1024033500799 [DOI] [Google Scholar]
- Danecek, P. , Auton, A. , Abecasis, G. , Albers, C. A. , Banks, E. , DePristo, M. A. , Handsaker, R. E. , Lunter, G. , Marth, G. T. , Sherry, S. T. , McVean, G. , & Durbin, R. , & 1000 Genomes Project Analysis Group (2011). The variant call format and vcftools . Bioinformatics, 27, 2156–2158. 10.1093/bioinformatics/btr330 [DOI] [PMC free article] [PubMed] [Google Scholar]
- Ekblom, R. , Brechlin, B. , Persson, J. , Smeds, L. , Johansson, M. , Magnusson, J. , Flagstad, Ø. , & Ellegren, H. (2018). Genome sequencing and conservation genomics in the Scandinavian wolverine population. Conservation Biology, 32, 1301–1312. 10.1111/cobi.13157 [DOI] [PubMed] [Google Scholar]
- Festa‐Bianchet, M. , Ray, J. C. , Boutin, S. , Côté, S. D. , & Gunn, A. (2011). Conservation of caribou (Rangifer tarandus) in Canada: An uncertain future. Canadian Journal of Zoology, 89, 419–434. [Google Scholar]
- Foote, A. D. , Vijay, N. , Ávila‐Arcos, M. C. , Baird, R. W. , Durban, J. W. , Fumagalli, M. , Gibbs, R. A. , Hanson, M. B. , Korneliussen, T. S. , Martin, M. D. , Robertson, K. M. , Sousa, V. C. , Vieira, F. G. , Vinař, T. , Wade, P. , Worley, K. C. , Excoffier, L. , Morin, P. A. , Gilbert, M. T. P. , & Wolf, J. B. W. (2016). Genome‐culture coevolution promotes rapid divergence of killer whale ecotypes. Nature Communications, 7, 11693. 10.1038/ncomms11693 [DOI] [PMC free article] [PubMed] [Google Scholar]
- Galbreath, K. E. , Cook, J. A. , Eddingsaas, A. A. , & DeChaine, E. G. (2011). Diversity and demography in Beringia: Multilocus tests of paleodistribution models reveal the complex history of Arctic ground squirrels. Evolution, 65, 1879–1896. 10.1046/j.1365-294X.2004.02026.x [DOI] [PubMed] [Google Scholar]
- HanghØj, K. , Moltke, I. , Andersen, P. A. , Manica, A. , & Korneliussen, T. S. (2019). Fast and accurate relatedness estimation from high‐throughput sequencing data in the presence of inbreeding. GigaScience, 8, 1–9. 10.1093/gigascience/giz034 [DOI] [PMC free article] [PubMed] [Google Scholar]
- Heintzman, P. D. , Froese, D. , Ives, J. W. , Soares, A. E. R. , Zazula, G. D. , Letts, B. , Andrews, T. D. , Driver, J. C. , Hall, E. , Hare, P. G. , Jass, C. N. , MacKay, G. , Southon, J. R. , Stiller, M. , Woywitka, R. , Suchard, M. A. , & Shapiro, B. (2016). Bison phylogeography constrains dispersal and viability of the Ice Free Corridor in western Canada. Proceedings of the National Academy of Scienes, 113, 8057–8063. 10.1073/pnas.1601077113 [DOI] [PMC free article] [PubMed] [Google Scholar]
- Hewitt, G. M. (2004). Genetic consequences of climatic oscillations in the Quaternary. Philosophical Transactions of the Royal Society B: Biological Sciences, 359, 183–195. 10.1098/rstb.2003.1388 [DOI] [PMC free article] [PubMed] [Google Scholar]
- Horn, R. L. , Marques, A. J. D. , Manseau, M. , Golding, B. , Klütsch, C. F. C. , Abraham, K. , & Wilson, P. J. (2018). Parallel evolution of site‐specific changes in divergent caribou lineages. Ecology and Evolution, 8, 6053–6064. 10.1002/ece3.4154 [DOI] [PMC free article] [PubMed] [Google Scholar]
- Jombart, T. (2008). adegenet: A R package for the multivariate analysis of genetic markers. Bioinformatics, 24, 1403–1405. 10.1093/bioinformatics/btn129 [DOI] [PubMed] [Google Scholar]
- Klütsch, C. F. C. , Manseau, M. , Anderson, M. , Sinkins, P. , & Wilson, P. J. (2017). Evolutionary reconstruction supports the presence of a Pleistocene Arctic refugium for a large mammal species. Journal of Biogeography, 44, 2729–2739. 10.1111/jbi.13090 [DOI] [Google Scholar]
- Klütsch, C. F. C. , Manseau, M. , Trim, V. , Polfus, J. , & Wilson, P. J. (2016). The eastern migratory caribou: the role of genetic introgression in ecotype evolution. Royal Society Open Science, 3, 150469. 10.1098/rsos.150469 [DOI] [PMC free article] [PubMed] [Google Scholar]
- Klütsch, C. F. C. , Manseau, M. , & Wilson, P. J. (2012). Phylogeographical analysis of mtDNA data indicates postglacial expansion from multiple glacial refugia in woodland caribou (Rangifer tarandus caribou). PLoS One, 7, e52661. 10.1371/journal.pone.0052661 [DOI] [PMC free article] [PubMed] [Google Scholar]
- Knaus, B. J. , & Grüwald, N. J. (2017). vcfr: A package to manipulate and visualize variant call format data in R. Molecular Ecology Resources, 17, 44–53. 10.1111/1755-0998.12549 [DOI] [PubMed] [Google Scholar]
- Kozma, R. , Lillie, M. , Benito, B. M. , Svenning, J. C. , & Höglund, J. (2018). Past and potential future population dynamics of three grouse species using ecological and whole genome coalescent modeling. Ecology and Evolution, 8, 6671–6681. 10.1002/ece3.4163 [DOI] [PMC free article] [PubMed] [Google Scholar]
- Kozma, R. , Melsted, P. , Magnússon, K. P. , & Höglund, J. (2016). Looking into the past – the reaction of three grouse species to climate change over the last million years using whole genome sequences. Molecular Ecology, 25, 570–580. 10.1111/mec.13496 [DOI] [PubMed] [Google Scholar]
- Kuhner, M. K. (2009). Coalescent genealogy samplers: windows into population history. Trends in Ecology and Evolution, 24, 86–93. 10.1016/j.tree.2008.09.007 [DOI] [PMC free article] [PubMed] [Google Scholar]
- Langmead, B. , & Salzberg, S. L. (2012). Fast gapped‐read alignment with bowtie 2. Nature Methods, 9, 357–359. 10.1038/nmeth.1923 [DOI] [PMC free article] [PubMed] [Google Scholar]
- Li, H. (2014). Toward better understanding of artifacts in variant calling from high‐coverage samples. Bioinformatics, 30(20), 2843–2851. 10.1093/bioinformatics/btu356 [DOI] [PMC free article] [PubMed] [Google Scholar]
- Li, H. , & Durbin, R. (2011). Inference of human population history from individual whole‐genome sequences. Nature, 475, 493–496. 10.1038/nature10231 [DOI] [PMC free article] [PubMed] [Google Scholar]
- Li, H. , Handsaker, B. , Wysoker, A. , Fennell, T. , Ruan, J. , Homer, N. , Marth, G. , Abecasis, G. , & Durbin, R. , & 1000 Genome Project Data Processing Subgroup (2009). The sequence alignment/map format and samtools . Bioinformatics, 25, 2078–2079. 10.1093/bioinformatics/btp352 [DOI] [PMC free article] [PubMed] [Google Scholar]
- Li, Z. , Lin, Z. , Ba, H. , Chen, L. , Yang, Y. , Wang, K. , Qiu, Q. , Wang, W. , & Li, G. (2017). Draft genome of the reindeer (Rangifer tarandus). GigaScience, 6, 1–5. 10.1093/gigascience/gix102 [DOI] [PMC free article] [PubMed] [Google Scholar]
- Liu, Y.‐C. , Sun, X. , Driscoll, C. , Miquelle, D. G. , Xu, X. , Martelli, P. , Uphyrkina, O. , Smith, J. L. D. , O’Brien, S. J. , & Luo, S.‐J. (2018). Genome‐wide evolutionary analysis of natural history and adaptation in the world’s tigers. Current Biology, 28, 3840–3849. 10.1016/j.cub.2018.09.019 [DOI] [PubMed] [Google Scholar]
- Lorenzen, E. D. , Nogués‐Bravo, D. , Orlando, L. , Weinstock, J. , Binladen, J. , Marske, K. A. , Ugan, A. , Borregaard, M. K. , Gilbert, M. T. P. , Nielsen, R. , Ho, S. Y. W. , Goebel, T. , Graf, K. E. , Byers, D. , Stenderup, J. T. , Rasmussen, M. , Campos, P. F. , Leonard, J. A. , Koepfli, K.‐P. , … Willerslev, E. (2011). Species‐specific responses of Late Quaternary megafauna to climate and humans. Nature, 479, 359–364. 10.1038/nature10574 [DOI] [PMC free article] [PubMed] [Google Scholar]
- Louis, M. , Skovrind, M. , Castruita, J. A. S. , Garilao, C. , Kaschner, K. , Gopalakrishnan, S. , & Lorenzen, E. D. (2020). Influence of past climate change on phylogeography and demographic history of narwhals, Monodon monoceros . Proceedings of the Royal Society B. Biological Sciences, 287, 20192964. 10.1098/rspb.2019.2964 [DOI] [PMC free article] [PubMed] [Google Scholar]
- Lucena‐Perez, M. , Marmesat, E. , Kleinman‐Ruiz, D. , Martínez‐Cruz, B. , Węcek, K. , Saveljev, A. P. , Seryodkin, I. V. , Okhlopkov, I. , Dvornikov, M. G. , Ozolins, J. , Galsandorj, N. , Paunovic, M. , Ratkiewicz, M. , Schmidt, K. , & Godoy, J. A. (2020). Genomic patterns in the widespread Eurasian lynx shaped by Late Quaternary climatic fluctuations and anthropogenic impacts. Molecular Ecology, 29, 812–828. 10.1111/mec.15366 [DOI] [PMC free article] [PubMed] [Google Scholar]
- Mager, K. H. , Colson, K. E. , & Hundertmark, K. J. (2013). High genetic connectivity and introgression from domestic reindeer characterize northern Alaska caribou herds. Conservation Genetics, 14, 1111–1123. 10.1007/s10592-013-0499-2 [DOI] [Google Scholar]
- Malinsky, M. , Matschiner, M. , & Svardal, H. (2021). dsuite – Fast D‐statistics and related admixture evidence from VCF files. Molecular Ecology Resources, 21, 584–595. [DOI] [PMC free article] [PubMed] [Google Scholar]
- Mather, N. , Traves, S. M. , & Ho, S. Y. W. (2020). A practical introduction to sequentially Markovian coalescent methods for estimating demographic history from genomic data. Ecology and Evolution, 10, 579–589. 10.1002/ece3.5888 [DOI] [PMC free article] [PubMed] [Google Scholar]
- Mays, H. L. , Hung, C.‐M. , Shaner, P.‐J. , Denvir, J. , Justice, M. , Yang, S.‐F. , & Primerano, D. A. (2018). Genomic analysis of demographic history and ecological niche modelling in the endangered Sumatran rhinoceros Dicerorhinus sumatrensis . Current Biology, 28, 70–76. 10.1016/j.cub.2017.11.021 [DOI] [PMC free article] [PubMed] [Google Scholar]
- McDevitt, A. D. , Mariani, S. , Hebblewhite, M. , Decesare, N. J. , Morgantini, L. , Seip, D. , Weckworth, B. V. , & Musiani, M. (2009). Survival in the Rockies of an endangered hybrid swarm from diverged caribou (Rangifer tarandus) lineages. Molecular Ecology, 18, 665–679. 10.1111/j.1365-294X.2008.04050.x [DOI] [PubMed] [Google Scholar]
- McKenna, A. , Hanna, M. , Banks, E. , Sivachenko, A. , Cibulskis, K. , Kernytsky, A. , Garimella, K. , Altshuler, D. , Gabriel, S. , Daly, M. , & DePristo, M. A. (2010). The genome analysis toolkit: A MapReduce framework for analyzing next‐generation DNA sequencing data. Genome Research, 20, 1297–1303. 10.1101/gr.107524.110 [DOI] [PMC free article] [PubMed] [Google Scholar]
- McLoughlin, P. D. , Paetkau, D. , Duda, M. , & Boutin, S. (2004). Genetic diversity and relatedness of boreal caribou populations in western Canada. Biological Conservation, 118, 593–598. 10.1016/j.biocon.2003.10.008 [DOI] [Google Scholar]
- Miller, W. , Schuster, S. C. , Welch, A. J. , Ratan, A. , Bedoya‐Reina, O. C. , Zhao, F. , Kim, H. L. , Burhans, R. C. , Drautz, D. I. , Wittekindt, N. E. , Tomsho, L. P. , Ibarra‐Laclette, E. , Herrera‐Estrella, L. , Peacock, E. , Farley, S. , Sage, G. K. , Rode, K. , Obbard, M. , Montiel, R. , … Lindqvist, C. (2012). Polar and brown bear genomes reveal ancient admixture and demographic footprints of past climate change. Proceedings of the National Academy of Sciences, 109, 2382–2390. 10.1073/pnas.1210506109 [DOI] [PMC free article] [PubMed] [Google Scholar]
- Morin, P. A. , Archer, F. I. , Avila, C. D. , Balacco, J. R. , Bukhman, Y. V. , Chow, W. , Fedrigo, O. , Formenti, G. , Fronczek, J. A. , Fungtammasan, A. , Gulland, F. M. D. , Haase, B. , Peter Heide‐Jorgensen, M. , Houck, M. L. , Howe, K. , Misuraca, A. C. , Mountcastle, J. , Musser, W. , Paez, S. , … Jarvis, E. D. (2021). Reference genome and demographic history of the most endangered marine mammal, the vaquita. Molecular Ecology, 21, 1008–1020. 10.1111/1755-0998.13284 [DOI] [PMC free article] [PubMed] [Google Scholar]
- Nadachowska‐Brzyska, K. , Burri, R. , Smeds, L. , & Ellegren, H. (2016). PSMC analysis of effective population sizes in molecular ecology and its application to black‐and‐white Ficedula flycatchers. Molecular Ecology, 25, 1058–1072. 10.1111/mec.13540 [DOI] [PMC free article] [PubMed] [Google Scholar]
- Nadachowska‐Brzyska, K. , Li, C. , Smeds, L. , Zhang, G. , & Ellegren, H. (2015). Temporal dynamics of avian populations during Pleistocene revealed by whole‐genome sequences. Proceedings of the National Academy of Sciences, 25, 1375–1380. 10.1016/j.cub.2015.03.047 [DOI] [PMC free article] [PubMed] [Google Scholar]
- Paradis, E. (2010). Pegas: an R package for population genetics with an integrated–modular approach. Bioinformatics, 26, 419–420. 10.1093/bioinformatics/btp696 [DOI] [PubMed] [Google Scholar]
- Pickrell, J. K. , & Pritchard, J. K. (2012). Inference of population splits and mixtures from genome‐wide allele frequency data. PLOS Genetics, 8, e1002967. 10.1371/journal.pgen.1002967 [DOI] [PMC free article] [PubMed] [Google Scholar]
- Polfus, J. L. , Manseau, M. , Klütsch, C. F. C. , Simmons, D. , & Wilson, P. J. (2017). Ancient diversification in glacial refugia leads to intraspecific diversity in a Holarctic mammal. Journal of Biogeography, 44, 386–396. 10.1111/jbi.12918 [DOI] [Google Scholar]
- Polfus, J. L. , Manseau, M. , Simmons, D. , Neyelle, M. , Bayha, W. , Andrew, F. , & Wilson, P. (2016). Łeghágots'enetę (learning together): the importance of indigenous perspectives in the identification of biological variation. Ecology and Society, 21, 18. [Google Scholar]
- Posada, D. (2008). jmodeltest: Phylogenetic model averaging. Molecular Biology and Evolution, 25, 1253–1256. 10.1093/molbev/msn083 [DOI] [PubMed] [Google Scholar]
- Pulgarín‐R, P. C. , & Burg, T. M. (2012). Genetic signals of demographic expansion in downy woodpecker (Picoides pubescens) after the last North American glacial maximum. PLoS One, 7, e40412. 10.1371/journal.pone.0040412 [DOI] [PMC free article] [PubMed] [Google Scholar]
- Purcell, S. , Neale, B. , Todd‐Brown, K. , Thomas, L. , Ferreira, M. A. R. , Bender, D. , Maller, J. , Sklar, P. , de Bakker, P. I. W. , Daly, M. J. , & Sham, P. C. (2007). plink: A tool set for whole‐genome association and population‐based linkage analyses. American Journal of Human Genetics, 81, 559–575. 10.1086/519795 [DOI] [PMC free article] [PubMed] [Google Scholar]
- R Core Team (2018). R: A language and environment for statistical computing. R Foundation for Statistical Computing. Retrieved from https://www.R‐project.org/ [Google Scholar]
- Rambaut, A. , Drummond, A. J. , Xie, D. , Baele, G. , & Suchard, M. A. (2018). Posterior summarization in Bayesian phylogenetics using tracer 1.7. Systematic Biology, 67, 901–904. 10.1093/sysbio/syy032 [DOI] [PMC free article] [PubMed] [Google Scholar]
- Roberts, D. R. , & Hamann, A. (2015). Glacial refugia and modern genetic diversity of 22 western North American tree species. Proceedings of the Royal Society B. Biological Sciences, 282, 20142903. 10.1098/rspb.2014.2903 [DOI] [PMC free article] [PubMed] [Google Scholar]
- Roffler, G. H. , Adams, L. G. , Talbot, S. L. , Sage, G. K. , & Dale, B. W. (2012). Range overlap and individual movements during breeding season influence genetic relationships of caribou herds in south‐central Alaska. Journal of Mammalogy, 93, 1318–1330. 10.1644/11-MAMM-A-275.1 [DOI] [Google Scholar]
- RStudio Team (2015). RStudio: Integrated development for R. RStudio Inc. Retrieved from http://www.rstudio.com/ [Google Scholar]
- Schmidt, M. W. , & Hertzberg, J. E. (2011). Abrupt climate change during the last ice age. Nature Education Knowledge, 3, 11. [Google Scholar]
- Shafer, A. B. A. , Cullingham, C. I. , Côté, S. , & Coltman, D. W. (2010). Of glaciers and refugia: a decade of study sheds light on the phylogeography of northwestern North America. Molecular Ecology, 19, 4589–4621. 10.1111/j.1365-294X.2010.04828.x [DOI] [PubMed] [Google Scholar]
- Soltis, D. E. , Morris, A. B. , McLachlan, J. S. , Manos, P. S. , & Soltis, P. S. (2006). Comparative phylogeography of unglaciated eastern North America. Molecular Ecology, 15, 4261–4293. 10.1111/j.1365-294X.2006.03061.x [DOI] [PubMed] [Google Scholar]
- Stamatakis, A. (2014). raxml version 8: A tool for phylogenetic analysis and post‐analysis of large phylogenies. Bioinformatics, 30, 1312–1313. 10.1093/bioinformatics/btu033 [DOI] [PMC free article] [PubMed] [Google Scholar]
- Suchard, M. A. , Lemey, P. , Baele, G. , Ayres, D. L. , Drummond, A. J. , & Rambaut, A. (2018). Bayesian phylogenetic and phylodynamic data integration using beast 1.10. Virus . Evolution, 4, vey016. 10.1093/ve/vey016 [DOI] [PMC free article] [PubMed] [Google Scholar]
- Taylor, R. S. , Horn, R. L. , Zhang, X. , Golding, G. B. , Manseau, M. , & Wilson, P. J. (2019). The caribou (Rangifer tarandus) genome. Genes, 10, 540. 10.3390/genes10070540 [DOI] [PMC free article] [PubMed] [Google Scholar]
- Taylor, R. S. , Manseau, M. , Horn, R. L. , Keobouasone, S. , Golding, G. B. , & Wilson, P. J. (2020). The role of introgression and ecotypic parallelism in delineating intraspecific conservation units. Molecular Ecology, 29, 2793–2809. 10.1111/mec.15522 [DOI] [PMC free article] [PubMed] [Google Scholar]
- Taylor, R. S. , Manseau, M. , Redquest, B. , & Wilson, P. J. (2020). Whole genome sequences from non‐invasively collected samples. Available as a Preprint 10.22541/au.158809437.78730399 [DOI]
- Tsuchiya, M. T. N. , Dikow, R. B. , & Cassin‐Sackett, L. (2020). First genome sequence of the Gunnison’s prairie dog (Cynomys gunnisoni), a keystone species and player in the transmission of sylvatic plague. Genome Biology and Evolution, 12, 618–625. 10.1093/gbe/evaa069 [DOI] [PMC free article] [PubMed] [Google Scholar]
- Weckworth, B. V. , McDevitt, A. , Musiani, M. , Hebblewhite, M. , & Mariani, S. (2012). Reconstruction of caribou evolutionary history in Western North America and its implications for conservation. Molecular Ecology, 21, 3610–3624. 10.1111/j.1365-294X.2012.05621.x [DOI] [PubMed] [Google Scholar]
- Westbury, M. V. , Hartmann, S. , Barlow, A. , Wiesel, I. , Leo, V. , Welch, R. , Parker, D. M. , Sicks, F. , Ludwig, A. , Dalén, L. , & Hofreiter, M. (2018). Extended and continuous decline in effective population size results in low genomic diversity in the world’s rarest hyena species, the brown hyena. Molecular Biology and Evolution, 35, 1225–1237. 10.1093/molbev/msy037 [DOI] [PMC free article] [PubMed] [Google Scholar]
- Westbury, M. V. , Petersen, B. , Garde, E. , Heide‐Jørgensen, M. P. , & Lorenzen, E. D. (2019). Narwhal genome reveals long‐term low genetic diversity despite current large abundance size. iScience, 15, 592–599. 10.1016/j.isci.2019.03.023 [DOI] [PMC free article] [PubMed] [Google Scholar]
- Yannic, G. , Hagen, O. , Leugger, F. , Karger, D. N. , & Pellissier, L. (2020). Harnessing paleo‐environmental modelling nd genetic data to predict intraspecific genetic structure. Evolutionary Applications, 13, 1526–1542. [DOI] [PMC free article] [PubMed] [Google Scholar]
- Yannic, G. , Ortego, J. , Pellissier, L. , Lecomte, N. , Bernatchez, L. , & Côté, S. D. (2018). Linking genetic and ecological differentiation in an ungulate with a circumpolar distribution. Ecography, 41, 922–937. 10.1111/ecog.02995 [DOI] [Google Scholar]
- Yannic, G. , Pellissier, L. , Ortego, J. , Lecomte, N. , Couturier, S. , Cuyler, C. , Dussault, C. , Hundertmark, K. J. , Irvine, R. J. , Jenkins, D. A. , Kolpashikov, L. , Mager, K. , Musiani, M. , Parker, K. L. , Røed, K. H. , Sipko, T. , Þórisson, S. G. , Weckworth, B. V. , Guisan, A. , … Côté, S. D. (2013). Genetic diversity in caribou linked to past and future climate change. Nature Climate Change, 4, 132–137. 10.1038/nclimate2074 [DOI] [Google Scholar]
- Yim, H.‐S. , Cho, Y. S. , Guang, X. , Kang, S. G. , Jeong, J.‐Y. , Cha, S.‐S. , Oh, H.‐M. , Lee, J.‐H. , Yang, E. C. , Kwon, K. K. , Kim, Y. J. , Kim, T. W. , Kim, W. , Jeon, J. H. , Kim, S.‐J. , Choi, D. H. , Jho, S. , Kim, H.‐M. , Ko, J. , … Lee, J.‐H. (2014). Minke whale genome and aquatic adaptation in cetaceans. Nature, 46, 88–92. 10.1038/ng.2835 [DOI] [PMC free article] [PubMed] [Google Scholar]
- Yuan, Y. , Zhang, P. , Wang, K. , Liu, M. , Li, J. , Zheng, J. , Wang, D. , Xu, W. , Lin, M. , Dong, L. , Zhu, C. , Qiu, Q. , & Li, S. (2018). Genome sequence of the freshwater Yangtze finless porpoise. Genes, 9, 213. 10.3390/genes9040213 [DOI] [PMC free article] [PubMed] [Google Scholar]
- Zittlau, K. , Coffin, J. , Farnell, R. , Kuzyk, G. , & Strobeck, C. (1998). Genetic relationships of three Yukon caribou herds determined by DNA typing. Rangifer, 12, 59–62. 10.7557/2.20.5.1625 [DOI] [Google Scholar]
Associated Data
This section collects any data citations, data availability statements, or supplementary materials included in this article.
Supplementary Materials
Figures S1‐S16
Table S1
Table S2
Data S1
Data Availability Statement
Raw reads from Taylor, Manseau, Horn, et al. (2020) are available on the National Centre for Biotechnology (NCBI) under BioProject accession number PRJNA634908 and those from Taylor, Manseau, Redquest, et al. (2020) are available under BioProject accession number PRJNA694662. Raw reads from new genomes added in this study are available under BioProject accession number PRJNA754521.