

Summary
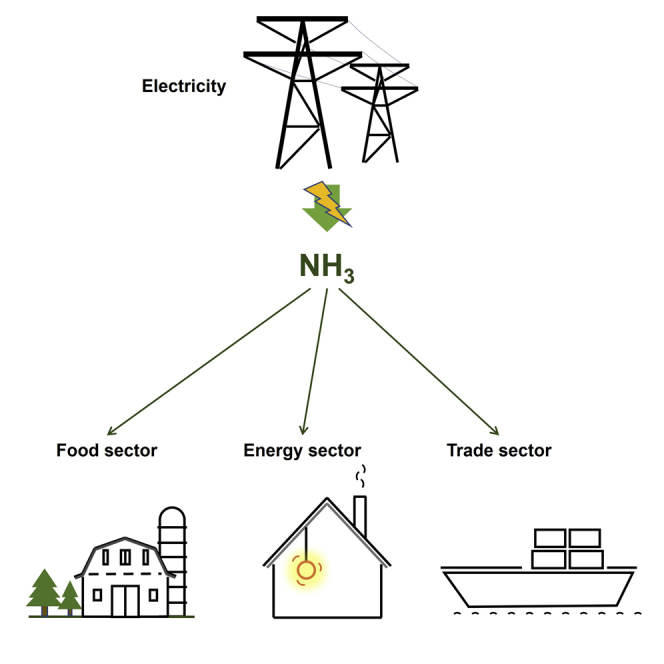
Ammonia, a versatile chemical that is distributed and traded widely, can be used as an energy storage medium. We carried out detailed analyses on the potential economic risks and benefits of using power-to-ammonia in three use pathways in the food, energy, and trade sectors, i.e., local sales, energy storage, and export under different levelized cost of ammonia (LCOA) scenarios. The base-case LCOA is lower than the market price, making local sales and export pathways profitable, and yet the energy storage pathway is at a loss unless ammonia-to-power efficiency is significantly improved. Four different combined use scenarios were also studied. Results show that under the base case LCOA and market assumptions, the combined use pathway leads to a loss of US$30 million. But a combined use pathway can become more profitable when there are higher predicted ammonia prices, larger export demand for low-carbon ammonia, and technology development.
Subject areas: Energy resources, Energy policy, Energy management, Energy modeling
Graphical abstract
Highlights
-
•
Ammonia can be a fertilizer, traded good, or energy storage medium
-
•
Power-to-ammonia can be an alternative route for using excess electricity
-
•
Energy storage route is not competitive unless cost reduction and technology advance
-
•
Higher prices, larger demand, and technology development could result in a net profit
Energy resources; Energy policy; Energy management; Energy modeling
Introduction
Ammonia is a commodity, a low-carbon fuel, and an energy carrier. Global annual ammonia production is over 230 million tonnes (Statista, 2021), and more than 3/4 of the ammonia is used for agriculture (e.g., fertilizers) to increase food production (Mordor Intelligence Analysis, 2021). Meanwhile, ammonia can be used as a fuel with a lower heating value of 18.6 MJ/kg in devices such as reciprocating engines and gas turbines (Dolan et al., 2021; Valera-Medina et al., 2018). Ammonia can also be directly converted to electricity using fuel cells without CO2 emissions (Zhao et al., 2019). In addition, ammonia can serve as an energy storage medium or energy carrier (Hasan et al., 2021; Zendrini et al., 2021). When used as an energy vector for energy production, distribution, storage, and utilization, liquid ammonia has several advantages. First, it has a high H2 density per volume, which is ∼50% more per liter than liquid H2 (Klerke et al., 2008) and 2.1 times more than compressed H2 at 700 bar (Davis et al., 2018). The distribution of liquid ammonia in pipelines is more economic than compressed H2 distribution at a distance larger than 2500 km, even accounting for the H2-to-ammonia conversion costs, and its distribution by ship is cheaper than liquefied H2 distribution (International Energy Agency, 2019).
However, the current ammonia production using the traditional fossil-fuel-based Haber-Bosch process is unsustainable, accounting for 1% of the global greenhouse gas emissions mainly owing to the use of fossil fuels as the hydrogen source (Dolan et al., 2021; Ghavam et al., 2021). To decarbonize ammonia production, several technologies have been proposed to use only renewable or low-carbon energy sources to convert nitrogen and water (or renewable hydrogen) into ammonia (Wang et al., 2018). These include the electrified Haber-Bosch process with electrolytic hydrogen (Ishaq et al., 2021), aqueous electrocatalytic nitrogen reduction (Xu et al., 2020), high temperature protonic conducting membranes (Skodra and Stoukides, 2009) and oxygen permeable membranes (Li et al., 2016), chemical looping (Gao et al., 2018) and plasma-catalytic ammonia production (Wu et al., 2021). These fast-developing alternative ammonia production technologies place a cornerstone for using low-carbon ammonia as a vector to connect the food, energy, and trade sectors.
Apart from technology development, it is also crucial to understand and evaluate the costs and environmental risks and benefits of low-carbon ammonia. Studies were conducted to estimate the ammonia costs at a plant-scale or grid-scale. Plant scale analyses provide the levelized cost of ammonia (LCOA) and show its dependence on variables such as electricity costs, efficiency, and capital costs. Hochman et al. conducted a detailed economics comparison between the conventional fossil fuel-based Haber-Bosch process and alternative electrified processes, including the electrified Haber-Bosch process and direct electrochemical nitrogen reduction for ammonia production (Hochman et al., 2020). They concluded that the cost of the electrified process largely depends on the electricity consumption and its price and hence, a highly efficient electrified process needs to be developed to compete with the conventional fossil fuel-based process economically. For low-temperature electrochemical ammonia production, it was shown that the LCOA depends strongly on the cost of electricity and the faradaic efficiency of the process, while the capital cost of the system has small effects on LCOA (Fernandez and Hatzell, 2020). When the ammonia plants are connected to the grid, the costs can depend on the factors such as electricity supply and demand in the grid. Salmon and Bañares-Alcántara analyzed the cost and location of electrified Haber-Bosch ammonia production in Australia and found that grid connectivity reduces the LCOA by reducing the associated hydrogen and electricity storage facilities (Salmon and Bañares-Alcántara, 2021). Morgan et al. studied the application of an off-grid wind-powered Haber-Bosch ammonia production plant for powering transportation (i.e., boat) and displacing diesel consumption for electricity generation during low-wind hours; they concluded that the power-to-ammonia pathway is economically competitive in high diesel price scenarios and offers environmental benefits (Morgan et al., 2014). When the system is powered by electricity from photovoltaic, the plant capacity follows the solar irradiance, and the electrolyzer was found to have the highest exergy destruction rate and hence impacting the exergy efficiency the most (Ozturk and Dincer, 2021). The renewable intermittency also impacts the plant sizing and levelized costs, and an LCOA of 588 GBP/tonne was estimated for Lerwick, Scotland with 90% wind and 10% solar power supply (Nayak-Luke et al., 2018). To understand the CO2 reduction potential of green ammonia, ammonia production from biomass was investigated and the CO2 emission was found to be 54–68% lower than the conventional fossil fuel-based Haber-Bosch process (Arora et al., 2016). Another analysis of an electrochemical Haber-Bosch process based on a protonic ceramic membrane reactor showed the potential to reduce 50% GHG emissions compared with the conventional process (Kyriakou et al., 2020).
In this article, we focus on understanding the role of electrified ammonia production for the use in the food, energy, and trade sectors in reducing the loss from curtailing electricity or exporting electricity at unfavorably low costs. The ammonia produced can be sold as a fertilizer locally, traded as export goods, and used as an energy storage medium to supply electricity during peak-demand hours. An electrified Haber-Bosch plant is used in the analysis owing to the availability of cost and performance data of the electrolyzers and Haber-Bosch ammonia synthesis loop. A techno-economic analysis (TEA) model was first developed to study the LCOA and its dependence on factors such as capital and operating costs, capacity factors, and plant sizes. Then we evaluated the profits or losses by converting the excess electricity into ammonia for the different use pathways in the food. energy, and trade sectors, namely as fertilizers for local sales, energy storage media, and traded goods for export. The electric grid condition in Ontario, Canada is used in this study as an example of modern low-carbon grids with significant curtailment of renewables and electricity export. For instance, less than 4% of the electricity in the Ontario grid was from fossil fuels (2018 data) (Canada Energy Regulator, 2021). And in 2020, 17% of solar and wind energy was curtailed in Ontario (Independent Electricity System Operator, 2021a). Exporting Ontario’s clean electricity at unfavourable prices cost the province around $3.1 billion between 2009 and 2014 (Yauch and Mitchnick, 2016). Various factors including the technical parameters such as energy consumption and efficiency, and the market values such as the ammonia price and market potential were analyzed.
Ammonia and electricity markets
Ammonia is a global commodity that is distributed over long distances in stainless steel tanks on land or at sea (The Royal Society, 2020). For example, Canada supplies around 12% of the global fertilizer needs, with four to five million tonnes of annual ammonia production (Canadian Industry Program for Energy Conservation, 2008). Most of the ammonia produced in Canada, i.e., three million tonnes, are used as fertilizers directly or fertilizer feedstock, with around one million tonnes being exported; only 10 percent of the ammonia produced in Canada is used for other industrial purposes such as refrigerant and diesel exhaust fluid (Fertilizer Safety and Security Council, 2015).
Ammonia prices are volatile, impacted by factors such as the supply and demand equilibrium and the price of fossil fuels, e.g., natural gas. For instance, ammonia monthly average prices in Iowa jumped 235% between December 2020 and December 2021, from US$ 449.1/ton to US$ 1,506/ton (McConnell et al., 2022). With such volatility, improving local ammonia production capacity is a strategy for food security by alleviating ammonia fertilizer supply shortages via domestic production. By using excess low-carbon electricity from variable renewables, local ammonia production also provides an opportunity to reduce carbon emissions, and to be an energy storage medium to provide electricity in peak-demand hours using various ammonia-to-power technologies such as engines and fuel cells.
On the other hand, the cost of electricity is usually a sum of the global adjustment cost and the marginal cost of electricity production, namely the hourly energy price (Independent Electricity System Operator, 2021b). Global adjustment is the capital expenditure passed on to the electricity consumer owing to grid improvements and capacity upgrades, as well as maintenance. The export of electricity to neighboring provinces or countries is often at a low price, close to the hourly energy price, which cannot recoup the capital investment and maintenance, and therefore, leads to a loss. For example, the Ontario Society of Professional Engineers estimated that Ontario lost between $348 million and $572 million in the first nine months of 2017 owing to the export of low-cost electricity (Ontario Society of Professional Engineers, 2017). In addition, with the expansion of variable renewables such as wind and solar power in the grid, the overgeneration of electricity and the associated curtailment are of increasing concern (Golden and Paulos, 2015). Therefore, the effective use of the excess electricity to produce high-value products or in energy storage is needed to reduce the loss associated with curtailment or low-cost electricity export. A potential opportunity to convert this excess electricity to ammonia for the food, energy, and trade sectors as a commodity (i.e., fertilizer) for sale locally or export and/or as an energy storage medium to provide peak hour electricity is analyzed in this article.
Results
Techno-economic analysis of electrified ammonia production
As discussed in the introduction, there are several electrified ammonia production technologies under development, e.g., electrified Haber-Bosch process, electrochemical nitrogen reduction, and plasma-catalytic ammonia generation. In this analysis, we focused on analyzing the revenues of electrified ammonia production for the food, energy, and trade sectors, so a simplified electrified Haber-Bosch process with electrolytic hydrogen for ammonia synthesis was used for the TEA model to be consistent with the literature (Nayak-Luke et al., 2018). The electrified system consists of a state-of-the-art polymer electrolyte membrane (PEM) water electrolyzer subsystem to produce hydrogen from water, a cryogenic air separation unit (ASU) to generate nitrogen, and a conventional Haber-Bosch synthesis loop with gas recycling and separation for ammonia production. A schematic is shown in Figure 1. The use of oxygen produced from water electrolysis and air separation was not considered in this study.
Figure 1.

Schematic of the electrified Haber-Bosch ammonia production for the food, energy, and trade sectors
The energy input was calculated using the base case assumptions listed in the STAR Methods section with the conversion ratios of H2 and N2 to NH3 at 98%.
From the base case assumption listed in the STAR Methods section, the LCOA of an electrified Haber-Bosch process was calculated to be US$(2018) 515/tonne. A sensitivity analysis was carried out to study the levelized cost by varying different parameters, namely, the prices for electricity and processed water, the electrolyzer efficiency and its cost, the cost constants for the ASU and ammonia reactor, the plant output and capacity factor, by ±20%. Results are summarized in Figure 2, and detailed parametric study results are shown in Figure S1. We can see that the ammonia cost is highly sensitive to the electrolyzer efficiency and capacity factor. If the electrolyzer efficiency drops from 72% to 48%, the levelized cost increases from US$(2018) 454/tonne to US$(2018) 607/tonne. This is because at lower electrolyzer efficiency, both the electricity consumption and electrolyzer system size increase, which leads to higher operating expenditure (OPEX) and capital expenditure (CAPEX), respectively. Meanwhile, lowering the plant capacity factor from 0.804 to 0.536 results in a US$(2018) 146/tonne increase in the LCOA. Therefore, higher LCOA can be expected for plants solely powered by solar PV or wind without energy storage, as the average annual capacities for solar PV, onshore wind, and offshore wind are 10–21%, 23–44%, and 29–52%, respectively (International Energy Agency, 2020). The LCOA is US$(2018) 1,356/tonne when the capacity factor drops to 0.2 while keeping all the other parameters constant as the base case.
Figure 2.

Sensitivity of the levelized cost of ammonia to different parameters
The cost under base-case assumptions (summarized in the STAR Methods section) is US$ 515/tonne. The numbers in ( ) are the higher or lower values of the parameters in the study, while those in { } are the relative changes in the cost constants for the air separation unit and ammonia reactor (i.e., Haber-Bosch synthesis loop).
When the electricity price increases from US$0.011/kWh to $0.0166/kWh, the levelized cost rises from US$(2018) 484/tonne to 546/tonne. For a higher electricity price of US$50/MWh, the LCOA is as high as US$(2018) 918/tonne. However, the cost of water has a negligible impact on the LCOA. Regarding the CAPEX, the cost of the electrolyzer has the highest impact on the ammonia cost. When its cost varies by ±20%, the LCOA changes by ±8.9%. On the other hand, varying the costs of the ammonia reactor and the ASU by ±20% leads to ±4.0% and ±0.9% changes in the LCOA, respectively.
The scale of plant output impacts the LCOA non-linearly, because the unit CAPEX of the ammonia reactor and ASU drops at larger scales owing to the scaling factors being lower than 1 (shown in the STAR Methods section). The LCOA rises significantly at lower plant output, i.e., small-scale operation, as shown in Figure S1D. For a small size ammonia plant with an output of 1 kg/s (or 86.4 tonne/day), the LCOA is as high as US$(2018) 793/tonne. Yet for the ammonia plants at larger scales, when the output increases from 20 to 40 kg/s, the LCOA drops only slightly from US$(2018) 478 to 451/tonne.
In the following analysis, we considered three different cost scenarios: high, base case, and low LCOA, which are summarized in Table 1. The high LCOA scenario is based on the current technologies, with an electrolyzer efficiency of 40% and a cost of US$1,000/kW. A high electricity price is set to be US$0.03/kWh, and the ammonia plant has a small-scale output of 5 kg/s and a lower capacity factor of 0.5. This raises the LCOA to US$(2018) 1,391/tonne. The low LCOA scenario optimistically considers the opportunities for technology development and more low-cost electricity available owing to the higher penetration of variable renewables in the grid. The electrolyzer efficiency increases to 74% based on the lower heating value (LHV) of hydrogen, and electrolyzer system cost reduces to US$ 200/kW, both from the predictions of the International Renewable Energy Agency (IRENA) (International Renewable Energy Agency, 2020). Meanwhile, ammonia reactor energy consumption is lowered to 1.8 MJ/kg-NH3 similar to the energy demand of an industrial Haber-Bosch synthesis loop (Smith et al., 2020). The plant output is assumed to be 40 kg/s for a large-size plant and the capacity factor is assumed to be 0.8. This leads to an LCOA as low as US$(2018) 243/tonne.
Table 1.
A summary of the different parameters in the three LCOA scenarios
| High LCOA | Base case LCOA | Low LCOA | |
|---|---|---|---|
| Electricity price [US$(2018)/kWh] | 0.03 | 0.0138 | 0.0138 |
| Electrolyzer efficiency [%] | 40 | 60 | 74 |
| Electrolyzer cost [US$(2018)/kW] | 1,000 | 700 | 200 |
| Ammonia output [kg/s] | 5 | 10 | 40 |
| Capacity factor [-] | 0.5 | 0.67 | 0.8 |
| Ammonia reactor energy consumption [kWh/kg-NH3] | 0.778 | 0.778 | 0.500 |
| Total unit energy consumption in the plant [kWh/kg-NH3] | 16.14 | 11.14 | 8.97 |
| LCOA [US$(2018)/tonne] | 1,391 | 515 | 225 |
Results of different ammonia use pathways
Unit revenue under base case market assumptions
Using the three LCOA scenarios summarized in the previous section, we compared different ammonia use pathways in the food, energy, and trade sectors, namely, for sale in the local fertilizer market, as an energy storage medium to produce electricity during the peak demand hours and being exported to the international ammonia market. In the following analysis, the time value of money is neglected, as the revenue is calculated within one year.
The unit revenues for the three ammonia use pathways are plotted in Figure 3A, which are compared with the base case and low LCOA values, as the unit revenues are all lower than the high LCOA value. Under the base case LCOA scenario, local sales, and export of ammonia as a commodity provide positive revenues of US$123/tonne and $103/tonne, respectively. However, when ammonia is used as an energy storage medium, a loss of US$283/tonne is observed under the base case LCOA scenario. Yet under the optimistic low LCOA scenario, all the three ammonia use pathways have positive revenues: US$413, $393, and $7/tonne for the local sales, export, and energy storage pathways, respectively.
Figure 3.

Revenues or losses for different ammonia use pathways
(A) Unit revenues and (B) annual revenue from the three different ammonia use pathways, i.e., local sales, export, and energy storage, separately under the high, base case, and low LCOA scenarios.
Figure 3B shows the annual revenue of sole ammonia use pathways, which means all the ammonia produced was used only in local sales, export, and energy storage separately under the three LCOA scenarios. The high LCOA scenario leads to losses in all three use pathways. Under the base case LCOA scenario, local sales and export pathways have positive revenues of US$219 and $183 million, respectively, which are still lower than that of electricity export. The energy storage pathway still leads to losses under base case LCOA. However, if the LCOA is as low as US$225/tonne in the low LCOA scenario, the sole local sales and export pathways can provide annual revenues of US$639 and $595 million more than electricity export, respectively. If ammonia is only used as an energy storage medium, a positive revenue of US$15.3 million will be obtained, which is still US$258 million lower than electricity export. Yet this difference might be compensated by the benefits of large-scale ammonia energy storage on the grid (Dowling et al., 2020; Hunter et al., 2021).
Lowering the LCOA and increasing the ammonia-to-power efficiency will raise the annual revenue of the sole energy storage pathway, as shown in Figure 4. When the ammonia-to-power efficiency is 50%, the LCOA needs to be reduced to US$39.5/tonne to reach the same revenue as electricity export, which is hardly possible. However, if the efficiency increases to 80%, a levelized cost lower than US$187/tonne will result in more revenue than electricity export. This means that significant technology improvements in ammonia conversion efficiency and reduction in CAPEX will be needed to make the sole energy storage pathway economically profitable compared with electricity export.
Figure 4.

The annual revenues of the sole energy storage pathway are impacted by the levelized cost of ammonia and the ammonia-to-power efficiency (η)
Combined ammonia use pathways
As the energy storage pathway alone could not make enough revenue to compete with electricity export unless significant technology development and cost reduction can be achieved, in this section we studied whether combined ammonia use pathways can provide enough economic incentives for electrified ammonia production for the use in the food, energy and trade sectors. For the combined ammonia use pathways under the base case, the local sales and export demands were met first, with the rest of the ammonia used in energy storage. In this case, the revenues from local sales, export, and energy storage are US$33, $97, and -$160 million, respectively, as shown in Table 2. This leads to a loss of US$30.1 million, making the combined ammonia use pathways under base case assumptions uncompetitive.
Table 2.
Summary of the four scenarios of combined ammonia use pathways
| Scenarios | Unit | Base case | S1 | S2 | S3 |
|---|---|---|---|---|---|
| Excess electricity | [TWh] | 19.80 | 19.80 | 19.80 | 19.80 |
| Ammonia produced | [Million tonnes] | 1.78 | 1.78 | 2.21 | 2.21 |
| Pathway 1: local sales | |||||
| Ammonia Sold | [Million tonnes] | 0.27 | 0.27 | 0.27 | 0.27 |
| Net revenue | [Million US$] | $33 | $309 | $112 | $112 |
| Pathway 2: export | |||||
| Ammonia Exported | [Million tonnes] | 0.94 | 0.94 | 1.94 | 0.94 |
| Net revenue | [Million US$] | $97 | $1,060 | $762 | $370 |
| Pathway 3: energy storage | |||||
| Ammonia used | [Million tonnes] | 0.57 | 0.57 | 0.00 | 1.00 |
| Electricity generated | [TWh] | 1.69 | 1.69 | 0.00 | 3.86 |
| Net revenue | [Million US$] | -$160 | -$160 | $0 | $91 |
| Summary | |||||
| Original revenue (electricity export) | [Million US$] | $273 | $273 | $273 | $273 |
| New revenue (ammonia) | [Million US$] | -$30 | $1,208 | $873 | $572 |
| Difference | [Million US$] | -$303 | $935 | $600 | $299 |
A parametric study was carried out to study the impacts of different parameters, i.e., ammonia market price and export amounts, excess electricity, and ammonia-to-power efficiency on the annual revenue obtained in the combined ammonia use pathways under different LCOA scenarios. As shown in Figure 5A, the annual revenue increases with the ammonia market price. The break-even ammonia market prices to match the total profits from the combined ammonia use pathways with that from electricity export are US$460, $888, and $1,646/tonne for the low, base case, and high LCOA scenarios, respectively. Further increase in the ammonia price will lead to higher annual revenue than the current practice of electricity export at unfavourable prices.
Figure 5.

The dependence of annual revenues on various techno-economic parameters
(A) Ammonia market price, (B) Export amounts, (C) Excess electricity, and (D) Ammonia-to-power efficiency for low, base case, and high LCOA scenarios. The black dotted line shows the revenue when the excess electricity is exported.
The maximum amount of ammonia that is exported can also influence the annual revenue, as seen in Figure 5B. At the base case export of 941,813 tonnes of ammonia, the total annual revenues (or losses) are US$489, -$30.1, and -$949 million for the low, base case, and high LCOA scenarios, respectively. As the power-to-ammonia efficiency is different for the three scenarios, the maximum ammonia productions are different. The maximum ammonia production and the maximum revenues for combined pathways are 0.957, 1.508, and 1.939 million tonnes and -US$943, $189, and $873 for the high, base case, and low LCOA scenarios, respectively. For the low LCOA scenario, even when 0.383 million tonnes of ammonia are exported, the combined pathways in the food, energy, and trade sectors can still result in the same revenue as electricity export.
The impacts of available amounts of excess electricity are shown in Figure 5C. More excess electricity for the ammonia pathway leads to lower annual revenue because larger amounts of ammonia will be used in the least profitable energy storage pathway based on our assumptions. Under the LCOA scenario, the excess electricity can be as high as 36.3 TWh, and the profits from the combined pathway still match the revenue from electricity export. Yet the base case LCOA will require 12 TWh of excess electricity to break even. The high LCOA scenario will always result in a loss as none of the pathways could make profits based on our assumptions.
The ammonia-to-power efficiency is an important technical parameter, which impacts the roundtrip efficiency and how much electricity can be generated from the stored ammonia. Figure 5D shows that under the high and base case LCOA scenarios, it is impossible to have an annual revenue higher than that from electricity export, even at a very high ammonia-to-power efficiency of 90%. Yet for the low LCOA scenario, the ammonia-to-power efficiency can be as low as 14% and the total revenues from the combined pathways still match that from electricity export.
Potential profitable scenarios for combined ammonia use pathways
Based on the parametric studies, we identified three potential scenarios with higher revenues compared with electricity export. The results are summarized in Table 2 and shown in Figure 6. In Scenario 1 (S1), the ammonia market price was raised to US$ 1,660/tonne, the same as that in December 2021 (McConnell et al., 2022). As a result, the revenues from local sales and export increased to US$309 and $1,060 million, respectively. Even though there is still a US$160 million loss in using ammonia in energy storage, an overall annual revenue of US$1,208 million is achieved, which is 4.42 times the expected electricity export revenue.
Figure 6.

The annual revenue of the base case and three profitable scenarios studied in this article, compared with that of electricity export
S2 and S3 both considered the opportunities for technology development, and the low LCOA was used. In S2, the energy storage option was not considered, as it is the least competitive pathway among the three different uses. Meanwhile, the quantity of ammonia export was not limited, which could be a result of increased demand for green or low-carbon ammonia. This scenario results in a total revenue of US$873 million, which is US$600 million higher than that from electricity export.
In S3, we considered the improvement in ammonia-to-power efficiency to 75% (Selvam et al., 2021) with combined ammonia use pathways. In this scenario, the energy storage pathway makes $91 million in profit. The overall revenue of the combined pathways is US$299 million higher than that from electricity export.
Conclusion
Ammonia is a versatile chemical product to be used as a commodity or an energy storage medium in the food, energy, and trade sectors. In this article, we studied the economic risks and benefits of converting excess electricity to ammonia and compared it with exporting excess electricity at an unfavourable price. Results are summarized as follows.
-
(1)
The LCOA from an electrified Haber-Bosch process depends largely on the electrolyzer efficiency, capacity factor and plant scale, electrolyzer system costs, and the electricity price. The nitrogen generation from the air separation units and the cost of water has small influences on the levelized cost.
-
(2)
Under the base case LCOA assumptions (US$515/tonne), the net unit revenues of ammonia in local sales and export are US$123/tonne and $103/tonne, respectively, which results in lower total profits than that of electricity export. With the drop of the LCOA to US$225/tonne, all the three ammonia use pathways can make profits. However, the revenue from the sole energy storage pathway is still small and not competitive with the electricity export, owing to the low roundtrip efficiency. Lower LCOA and higher ammonia-to-power efficiency are both important to make the energy storage pathway more profitable.
-
(3)
Under the base case LCOA scenario, combining the three ammonia use pathways in the food, energy, and trade sectors, i.e., local sales, energy storage, and export, still results in a loss of US$30 million. Parametric studies show that with rising ammonia market price, the annual revenue for the combined pathways is expected to be higher than that from electricity export. Higher demand for green or low-carbon ammonia in the international market could also help to increase revenue and encourage electrified ammonia production. However, increasing ammonia-to-power efficiency alone cannot make the combined ammonia use pathways more competitive than electricity export, unless the LCOA is low.
-
(4)
If the ammonia market price is raised to US$1,660/tonne, the total annual revenue increases to US$1,208 million, which is 4.42 times the revenue from electricity export, even under the base case LCOA scenario. Under the low LCOA scenario, eliminating the energy storage option or improving the ammonia conversion technologies can both increase the total revenue to outperform electricity export. In these three profitable scenarios studied, using excess electricity for ammonia production can decrease the loss from electricity export at unfavourable prices. Therefore, opening export channels and advancing technologies of electrified ammonia production and utilization are important.
Limitations of the study
In this study, we didn’t consider the use of ammonia in other sectors such as refrigeration, which could provide additional routes for the sales of ammonia to generate revenue. We used one base case ammonia market price and electricity price, while dynamic market demands and prices for ammonia and electricity were not considered. The ammonia plant capacity factor was estimated based on the average electricity demand and generation profiles, and the optimization of the plant output and capacity factor according to hourly electricity demand and supply was not conducted.
STAR★Methods
Key resources table
| REAGENT or RESOURCE | SOURCE | IDENTIFIER |
|---|---|---|
| Deposited data | ||
| Data generated for this paper | This paper | |
| Software and algorithms | ||
| Techno-economic analysis model | Jouny et al., 2020 | https://doi.org/10.1021/acs.iecr.0c01513 |
| Microsoft Excel | Microsoft Corporation | https://www.microsoft.com/en-ca/microsoft-365/excel |
Resource availability
Lead contact
Further information and requests should be directed to the lead author, Xiao-Yu Wu (xiaoyu.wu@uwaterloo.ca).
Materials availability
Not applicable.
Method details
TEA model: Electrified ammonia production
A TEA cash flow model was built based on reference (Jouny et al., 2020) to evaluate the LCOA with the base case model assumption summarized in Table. Modern ammonia plant capacities range from 200–500 tonnes/day (small size) to as large as 4,500 tonnes/day (ThyssenKrupp, 2022). In the base case, a medium-size ammonia plant with a design ammonia output of 864 tonnes/day (or 10 kg/s) was studied with a capacity factor of 0.67. The dependence of the LCOA on the plant scale and capacity factor are discussed in the paper. The base case capacity factor was estimated from the difference between the average hourly electricity demand and generation profiles in Ontario electricity market in 2020 (Independent Electricity System Operator of Ontario, 2022), by assuming the design capacity operates when there is the largest demand and generation difference. We assumed the project started in 2018, and the construction finished in 2019; the ammonia plant life is 20 years. The net present value at the end of the 20th year was set to be zero to calculate the levelized cost, as the profit or loss of different ammonia use pathways were evaluated separately in Section: Results of different ammonia use pathways. The working capital was assumed to be 5% of the total CAPEX, and the salvage value of the plant at the end of life is 20% of the total CAPEX including the electrolyzer replacement cost. The cash flow was discounted to the US$(2018) value (the project starting year) using a nominal interest rate of 10%. The untaxed net earning from the plant was used when calculating the levelized cost, as the total untaxed revenues in different ammonia use pathways were compared. The tax benefits from annual capital depreciation were neglected.
Assumption for the techno-economic analysis of the electrified ammonia plant
| Parameter | Value |
|---|---|
| Global economic assumptions | |
| Currency conversion rate [USD/CAD] | 0.754 |
| Nominal interest rate | 10% |
| Ammonia plant specification | |
| Ammonia designed output [kg/s] | 10 |
| Total conversion (for both H2 and N2) | 98% |
| Plant life [years] | 20 |
| Plant capacity factor | 0.67 |
| Electrolyzer | |
| Efficiency | 0.6 (based on LHV) |
| Energy consumption [kWh/kg H2] | 55.6 |
| Water conversion ratio | 100% |
| Air separation unit (ASU) | |
| Energy consumption [kWh/kg N2] | 0.421 (Aneke and Wang, 2015) |
| Ammonia reactor | |
| Energy consumption [kWh/kg NH3] | 0.778 |
| Operational cost | |
| Electricity cost [US$(2018)/MWh] | 13.8 |
| Process water cost [US$(2018)/m3] | 2.15 (City of Toronto, 2020) |
| Maintenance cost | 5% of initial CAPEX per annum |
The CAPEX of the three sub-systems in the ammonia plant, i.e., the electrolyzer system, ASU and the Haber-Bosch synthesis loop, were calculated using the factorial method,
| (Equation 1) |
where K is the cost constant (based on per unit of production), S is the characteristic size parameter, and n is the scaling factor. A summary of the K and n factors can be found in Table.
Parameters for the factorial method to calculate the CAPEX of different sub-systems in the ammonia plant
| Component | Unit of production | Cost constant (K) [US$(2018)] | Replacement cost [US$(2018)/kW] | Lifetime | Scaling factor (n) | Ref. |
|---|---|---|---|---|---|---|
| Electrolyzer system | Rated power (kW) | 700 | 400 | 10 | 1 | (International Renewable Energy Agency, 2020) |
| Air separation unit | Tonne-nitrogen production per day | 1,193,000a | / | Project life | 0.49 | (Morgan, 2013) |
| Haber-Bosch synthesis loop | Tonne-ammonia production per day | 4,416,000b | / | Project life | 0.50 | (Nayak-Luke et al., 2018) |
The US$(2010) values were fitted using a bottom-up analysis from reference (Morgan, 2013), and then converted to US$(2018) value using a cumulative inflation rate of 15.2% (US Inflation Calculator, 2022).
Values were converted to US dollar from Great Britain pound (GBP) using an exchange rate of US$1.00 = GBP£0.77 as indicated in the article (Nayak-Luke et al., 2018); the reported values were assumed to be (2018) values based on the publication date of the article.
For the electrolyzer system including the stacks and balance of the plant, a lower bound capital cost of US$700/kW was considered for a scenario of large volume production, which is within the cost estimates (US$700–1,400/kW) reported by IRENA in 2020 using state-of-the-art technologies, i.e., perfluorosulfonic acid membranes, iridium oxide as oxygen side electrode catalysts, and platinum nanoparticles on carbon black as hydrogen side electrode catalysts (International Renewable Energy Agency, 2020). The cost of PEM electrolyzer systems is projected to be lower than US$200/kW in 2050 (International Renewable Energy Agency, 2020), so a sensitivity analysis of electrolyzer cost were conducted and an optimistic future scenario was also considered in this paper. The electrolyzers are modular with linear scaling in CAPEX, so the scaling factor n equals one. The lifetime of the electrolysis cell was assumed to be 10 years, and the replacement cost is 57% of the original system cost (the same as the stack cost/system cost ratio) (International Renewable Energy Agency, 2020), assuming the entire stack has to be replaced at the end of the lifetime.
For the ASU, a previous bottom-up study (Morgan, 2013) provided the CAPEX of a cryogenic ASU system in US$(2010) values at different output scales, which was fitted using the factorial method and converted to US$(2018) value using a cumulative inflation rate of 15.2% (US Inflation Calculator, 2022). The CAPEX of the Haber-Bosch ammonia synthesis loop was from a 2018 study (Nayak-Luke et al., 2018), which used Aspen Economic Evaluator and Sinnott (2005) as references. Since the time values of the CAPEX were not specified in the study (Nayak-Luke et al., 2018), we assumed them to be US$(2018) value based on the publication date of the paper.
Land costs for the plants were not considered, as an acre of farmland in Ontario, at CAD$10,876 per acre in 2018 (Statistics Canada: Canada’s National Statistical Agency, 2021), plays a negligible part of the overall costs of the plants. Based on these assumptions, the CAPEX of the ammonia plant was estimated to be about US$1,306/tonne-ammonia-annual-designed-capacity, which is close to the ITOCHU Blue Ammonia Production Facility planned in Alberta in 2023–2026 (Government of Alberta, 2021).
The OPEX of the ammonia plant includes all the electricity and water costs for the three sub-systems, as well as the maintenance and catalyst replacement costs. In the sensitivity analysis, we assumed the energy efficiency of all the components to be independent of the operating capacity unless specified. For an industrial scale ammonia plant using the Haber-Bosch process, the single-pass conversion is 10–15% with a total conversion of 97–99% with recycling of the unconverted gases (Rouwenhorst et al., 2021). Therefore, the total conversion ratios of H2 and N2 of the ammonia plant in the base case were assumed to be 98%. For the electrolyzer, an efficiency of 60% based on the LHV of hydrogen was estimated, which is within the current (2020) PEM electrolyzer efficiency (40–67% based on LHV) by IRENA (International Renewable Energy Agency, 2020). All the water was assumed to be converted to hydrogen. For the ASU nitrogen generator, energy consumption was assumed to be the same as a conventional cryogenic ASU (0.421 kWh/kg N2) for a nitrogen product of 99.99 mol% purity (Aneke and Wang, 2015), although different air separation technologies could result in different energy requirements (Chen et al., 2021). For the Haber-Bosch ammonia synthesis loop, the major energy consumption is the recycling of unconverted products. Its energy consumption ranges from 1.8 to 3.1 MJ/kg-NH3 (Smith et al., 2020), and here we assumed it to be 2.8 MJ/kg-NH3 (or 0.778 kWh/kg-NH3) which is consistent with a previous study (Wang et al., 2018). The base case plant consumes 11.1 kWh/kg-NH3 under the base case assumptions, which is shown in the schematic in Figure 1. The maintenance and catalyst replacement costs were assumed to be 5% of the CAPEX (excluding the replacement cost) per annum, which is consistent with a previous study (Nayak-Luke et al., 2018), where a personal communication with Siemens Corporate Technology was referred to.
The electricity consumed in the ammonia plant is assumed to cost the same as the electricity to be exported to neighboring provinces and regions. We used the average export electricity cost in this study at US$13.8/MWh in 2019 (Independent Electricity System Operator, 2020a), which neglects the real-time price variation in electricity export due to factors such as demand, season, and inefficiencies in the grid. For the process water price, the discounted rates of the Industrial Water Rate Program in Toronto were used at US$2.15/m3 (City of Toronto, 2020). The price difference for the first 5,000 m3 annual water consumption in this program was neglected as the total annual water consumption is much higher than 5,000 m3.
The base case market assumption
Assumptions about the ammonia and electricity markets in the base case were made using data in 2019, as these numbers were consistently found in the literature and largely uninterrupted by the supply chain issues and other disruptions in the COVID-19 pandemic. A summary of the base case market assumptions is shown in Table.
Base case market assumption in the food-energy-trade nexus
| Input | Value |
|---|---|
| Levelized cost of ammonia [US$/kg] | Three scenarios summarized in Table 1 |
| Annual electricity export (Ontario) [TWh] | 19.8 (2019 data) (Independent Electricity System Operator, 2021c) |
| Hourly energy price (Ontario) [US$/kWh] | 0.0138 (2019 data) (Independent Electricity System Operator, 2020b) |
| Global adjustment cost (Ontario) [US$/kWh] | 0.0814 (2019 data) (Independent Electricity System Operator, 2020b) |
| Electricity wholesale price (Ontario) [US$/kWh] | 0.0952 |
| Local sales | |
| Market value of ammonia (anhydrous) [US$/tonne] | $638 (2019 data, converted to tonne based on (Schnitkey et al., 2021)) |
| Maximum ammonia sale in Ontario [tonnes] | 270,000a |
| Export | |
| Cost to distribute ammonia [US$/tonne] | $20b |
| Maximum ammonia export [tonnes] | 941,813 (2019 data) (World Integrated Trade Solution, 2022) |
| Energy storage | |
| Cost to store ammonia [US$/tonne] | $53 |
| Ammonia to power efficiency (LHV) | 57.9% (Rokni, 2013) |
Estimated based on farmland area in Ontario (Statistics Canada: Canada’s National Statistical Agency, 2017) and the national ammonia consumption for fertilizing purposes in Canada (Fertilizer Safety and Security Council, 2015).
Estimated based on ammonia distribution on tankers (Al-Breiki and Bicer, 2020), which hardly depends on the distance of distribution (International Energy Agency, 2019).
First, the excess electricity in the base case is assumed to be the 19.8 TWh exported electricity in 2019 (Independent Electricity System Operator, 2021c). The electricity will be converted to ammonia using the total unit energy consumption in the ammonia plant shown in Table 1, resulting in 1.23, 1.78 and 2.21 million tonnes ammonia production for the high, base-case and low LCOA scenarios, respectively.
The local sales capacity in Ontario was estimated considering that Ontario contains 9% of Canada’s farmland (Statistics Canada: Canada’s National Statistical Agency, 2017), while Canada uses three million tonnes of ammonia for agricultural purposes (Fertilizer Safety and Security Council, 2015); hence, 0.27 million tonnes of ammonia sales capacity was assumed in Ontario alone for agricultural purposes in the base case. The maximum ammonia export quality in the base case was set to be 941,813 tonnes, which is equal to the annual ammonia export from Canada (2019 data) (World Integrated Trade Solution, 2022). Yet the ammonia export is expected to expand, as it can be used to distribute hydrogen effectively. The rest of the ammonia is used for energy storage. Applications of ammonia for industrial purposes other than fertilizers, such as refrigerant and diesel exhaust fluid, were not considered in this study.
The total revenue received (before tax) from the combined ammonia pathways is calculated based on how much ammonia would be directed to each of the three options multiply by their respective unit revenues. The assumptions for the unit revenues in the three pathways are summarized in Table. For local sales, the market value of ammonia sold to Ontario users was assumed to be US$638/tonnes based on the 2019 ammonia price in Illinois (Schnitkey et al., 2021). For export, the revenue was calculated by subtracting the distribution costs from the same market value. The ammonia was assumed to be distributed by tankers on the Great Lakes to the US, and the cost of distribution was estimated as US$20/tonne (Al-Breiki and Bicer, 2020), which hardly depends on the distance of distribution (International Energy Agency, 2019). Furthermore, ammonia used for storage will be converted to electricity using different power cycles and fuel cells (Valera-Medina et al., 2018). In the base case, we assumed the ammonia-to-power efficiency to be 57.9% based on LHV in a solid oxide fuel cell–Stirling hybrid plant (Rokni, 2013), and hence, the electricity generation is 2.99 kWh/kg-NH3. The cost of the ammonia power plant is not considered in this study, as it is assumed that the ammonia production and storage facilities are located near an existing power plant which can use ammonia as a fuel or blend ammonia into fuel mixtures (Erdemir and Dincer, 2021). The cost for liquid ammonia storage is US$53/tonne, which is the average of US$10.6 - $95.3/tonne for 15- to 182-day storage durations (Bartels, 2008). The electricity generated from the ammonia power plant will be sold at an average wholesale price of US$0.0952/kWh (sum of the global adjustment and hourly energy prices in 2019 in Ontario (Independent Electricity System Operator, 2020b)). Therefore, each tonne of ammonia used for energy storage will result in US$232/tonne of revenue.
Acknowledgments
M.J. received the President’s Research Award at the University of Waterloo to work on this project. R.M. received the Dean’s Top-up from the Faculty of Engineering at the University of Waterloo for the work. The project was also supported by the University of Waterloo Start-Up Grant. We acknowledge the support of the Natural Sciences and Engineering Research Council of Canada (NSERC), [funding reference number RGPIN-2021-02453].
Author contributions
Methodology: M.J. and R.M.; Formal analysis: M.J., R.M., X.-Y.W.; Writing – Original Draft: M.J. and X.-Y.W.; Writing – Review & Editing: M.J., R.M., X.-Y.W.; Supervision: X.-Y.W.
Declaration of interests
The authors declare no competing interests.
Published: August 19, 2022
Footnotes
Supplemental information can be found online at https://doi.org/10.1016/j.isci.2022.104724.
Supplemental information
Data and code availability
-
•
Non-proprietary data and excel model that support the analysis within this paper is available from the lead contact upon reasonable request.
-
•
Any additional information is available from the lead contact upon reasonable request.
References
- Al-Breiki M., Bicer Y. Comparative cost assessment of sustainable energy carriers produced from natural gas accounting for boil-off gas and social cost of carbon. Energy Rep. 2020;6:1897–1909. doi: 10.1016/j.egyr.2020.07.013. [DOI] [Google Scholar]
- Aneke M., Wang M. Potential for improving the energy efficiency of cryogenic air separation unit (ASU) using binary heat recovery cycles. Appl. Therm. Eng. 2015;81:223–231. doi: 10.1016/j.applthermaleng.2015.02.034. [DOI] [Google Scholar]
- Arora P., Hoadley A.F.A., Mahajani S.M., Ganesh A. Small-scale Ammonia production from biomass: a techno-enviro-economic perspective. Ind. Eng. Chem. Res. 2016;55:6422–6434. doi: 10.1021/acs.iecr.5b04937. [DOI] [Google Scholar]
- Bartels J.R. Iowa State University; 2008. A Feasibility Study of Implementing an Ammonia Economy. [Google Scholar]
- Canada Energy Regulator Provincial and territorial energy profiles – Ontario. 2021. https://www.cer-rec.gc.ca/en/data-analysis/energy-markets/provincial-territorial-energy-profiles/provincial-territorial-energy-profiles-ontario.html
- Canadian Industry Program for Energy Conservation . Canadian Industry Program for Energy Conservation; 2008. Canadian Ammonia Producers - Benchmarking Energy Efficiency and Carbon Dioxide Emissions. [Google Scholar]
- Chen G., Feldhoff A., Weidenkaff A., Li C., Liu S., Zhu X., Sunarso J., Huang K., Wu X.-Y., Ghoniem A.F., et al. Roadmap on sustainable mixed ionic-electronic conducting membranes. Adv. Funct. Mater. 2021;32 doi: 10.1002/adfm.202105702. [DOI] [Google Scholar]
- City of Toronto Industrial water rate program. 2020. https://www.toronto.ca/services-payments/water-environment/how-to-use-less-water/water-efficiency-for-business/industrial-water-rate-program/
- Davis S.J., Lewis N.S., Shaner M., Aggarwal S., Arent D., Azevedo I.L., Benson S.M., Bradley T., Brouwer J., Chiang Y.-M., et al. Net-zero emissions energy systems. Science. 2018;360:eaas9793. doi: 10.1126/science.aas9793. [DOI] [PubMed] [Google Scholar]
- Dolan R.H., Anderson J.E., Wallington T.J. Outlook for ammonia as a sustainable transportation fuel. Sustain. Energy Fuels. 2021;5:4830–4841. doi: 10.1039/D1SE00979F. [DOI] [Google Scholar]
- Dowling J.A., Rinaldi K.Z., Ruggles T.H., Davis S.J., Yuan M., Tong F., Lewis N.S., Caldeira K. Role of long-duration energy storage in variable renewable electricity systems. Joule. 2020;4:1907–1928. doi: 10.1016/j.joule.2020.07.007. [DOI] [Google Scholar]
- Erdemir D., Dincer I. A perspective on the use of ammonia as a clean fuel: challenges and solutions. Int. J. Energy Res. 2021;45:4827–4834. doi: 10.1002/er.6232. [DOI] [Google Scholar]
- Fernandez C.A., Hatzell M.C. Editors’ choice—economic considerations for low-temperature electrochemical ammonia production: achieving haber-bosch parity. J. Electrochem. Soc. 2020;167:143504. doi: 10.1149/1945-7111/abc35b. [DOI] [Google Scholar]
- Fertilizer Safety and Security Council . Fertilizer Safety and Security Council; 2015. Anhydrous Ammonia Factbook - Awareness and Training for First Responders. [Google Scholar]
- Gao W., Guo J., Wang P., Wang Q., Chang F., Pei Q., Zhang W., Liu L., Chen P. Production of ammonia via a chemical looping process based on metal imides as nitrogen carriers. Nat. Energy. 2018;3:1067–1075. doi: 10.1038/s41560-018-0268-z. [DOI] [Google Scholar]
- Ghavam S., Vahdati M., Wilson I.A.G., Styring P. Sustainable ammonia production processes. Front. Energy Res. 2021;34 [Google Scholar]
- Golden R., Paulos B. Curtailment of renewable energy in California and beyond. Electr. J. 2015;28:36–50. doi: 10.1016/j.tej.2015.06.008. [DOI] [Google Scholar]
- Government of Alberta ITOCHU blue ammonia production facility. 2021. https://majorprojects.alberta.ca/details/ITOCHU-Blue-Ammonia-Production-Facility/4509
- Hasan M.H., Mahlia T.M., Mofijur M., Rizwanul Fattah I.M., Handayani F., Ong H.C., Silitonga A.S. A comprehensive Review on the recent development of ammonia as a renewable energy carrier. Energies. 2021 doi: 10.3390/en14133732. [DOI] [Google Scholar]
- Hochman G., Goldman A.S., Felder F.A., Mayer J.M., Miller A.J.M., Holland P.L., Goldman L.A., Manocha P., Song Z., Aleti S. The potential economic feasibility of direct electrochemical nitrogen reduction as a route to ammonia. ACS Sustain. Chem. Eng. 2020 doi: 10.1021/acssuschemeng.0c01206. [DOI] [Google Scholar]
- Hunter C.A., Penev M.M., Reznicek E.P., Eichman J., Rustagi N., Baldwin S.F. Techno-economic analysis of long-duration energy storage and flexible power generation technologies to support high-variable renewable energy grids. Joule. 2021;5:2077–2101. doi: 10.1016/j.joule.2021.06.018. [DOI] [Google Scholar]
- Independent Electricity System Operator of Ontario Generator output capability month report. 2022. http://reports.ieso.ca/public/GenOutputCapabilityMonth/
- Independent Electricity System Operator 2019 year-end data. 2020. https://www.ieso.ca/en/Corporate-IESO/Media/Year-End-Data/2019
- Independent Electricity System Operator Average HOEP plus average GA. 2020. https://www.ieso.ca/-/media/Files/IESO/Power-Data/price-overview/Average-HOEP-plus-Average-GA.ashx
- Independent Electricity System Operator 2020 year in review. 2021. https://www.ieso.ca/en/Corporate-IESO/Media/Year-End-Data
- Independent Electricity System Operator Hourly ontario energy price (HOEP) 2021. https://www.ieso.ca/en/Power-Data/Price-Overview/Hourly-Ontario-Energy-Price
- Independent Electricity System Operator Imports and exports. 2021. https://www.ieso.ca/en/Power-Data/Supply-Overview/Imports-and-Exports
- International Energy Agency . International Energy Agency; 2019. The Future of Hydrogen. [Google Scholar]
- International Energy Agency Average annual capacity factors by technology, 2018. 2020. https://www.iea.org/data-and-statistics/charts/average-annual-capacity-factors-by-technology-2018
- International Renewable Energy Agency . International Renewable Energy Agency; 2020. Green Hydrogen Cost Reduction: Scaling up Electrolysers to Meet the 1.5°C Climate Goal. [Google Scholar]
- Ishaq H., Siddiqui O., Dincer I. Experimental and theoretical investigations of a new cascaded reactor for ammonia as a renewable fuel. Fuel Process. Technol. 2021;217:106780. doi: 10.1016/j.fuproc.2021.106780. [DOI] [Google Scholar]
- Jouny M., Luc W., Jiao F. Correction to “General techno-economic analysis of CO2 electrolysis systems”. Ind. Eng. Chem. Res. 2020;59:8121–8123. doi: 10.1021/acs.iecr.0c01513. [DOI] [Google Scholar]
- Klerke A., Christensen C.H., Nørskov J.K., Vegge T. Ammonia for hydrogen storage: challenges and opportunities. J. Mater. Chem. 2008;18:2304–2310. doi: 10.1039/B720020J. [DOI] [Google Scholar]
- Kyriakou V., Garagounis I., Vourros A., Vasileiou E., Stoukides M. An electrochemical haber-bosch process. Joule. 2020;4:142–158. doi: 10.1016/j.joule.2019.10.006. [DOI] [Google Scholar]
- Li W., Zhu X., Chen S., Yang W. Integration of nine steps into one membrane reactor to produce synthesis gases for ammonia and liquid fuel. Angew. Chem. Int. Ed. Engl. 2016;55:8566–8570. doi: 10.1002/anie.201602207. [DOI] [PubMed] [Google Scholar]
- McConnell M., Liefert O., Williams A., Boline A. U.S. Department of Agriculture, Economic Research Service; 2022. Feed Outlook: January 2022. [Google Scholar]
- Mordor Intelligence Analysis Ammonia market - growth, trends, COVID-19 impact, and forecasts (2021 - 2016) 2021. https://www.mordorintelligence.com/industry-reports/ammonia-market
- Morgan E., Manwell J., McGowan J. Wind-powered ammonia fuel production for remote islands: a case study. Renew. Energy. 2014;72:51–61. doi: 10.1016/j.renene.2014.06.034. [DOI] [Google Scholar]
- Morgan E.R. University of Massachusetts; 2013. Techno-Economic Feasibility Study of Ammonia Plants Powered by Offshore Wind. [Google Scholar]
- Nayak-Luke R., Bañares-Alcántara R., Wilkinson I. Green” ammonia: impact of renewable energy intermittency on plant sizing and levelized cost of ammonia. Ind. Eng. Chem. Res. 2018;57:14607–14616. doi: 10.1021/acs.iecr.8b02447. [DOI] [Google Scholar]
- Ontario Society of Professional Engineers . Ontario Society of Professional Engineers; 2017. Empower Ontario’s Engineers to Obtain Opportunity - an Analysis of Ontario’s Clean Electricity Exports. [Google Scholar]
- Ozturk M., Dincer I. An integrated system for ammonia production from renewable hydrogen: a case study. Int. J. Hydrogen Energy. 2021;46:5918–5925. doi: 10.1016/j.ijhydene.2019.12.127. [DOI] [Google Scholar]
- Rokni M. Thermodynamic analysis of SOFC (solid oxide fuel cell)–Stirling hybrid plants using alternative fuels. Energy. 2013;61:87–97. doi: 10.1016/j.energy.2013.06.001. [DOI] [Google Scholar]
- Rouwenhorst K.H.R., Van der Ham A.G.J., Lefferts L. Beyond Haber-Bosch: the renaissance of the Claude process. Int. J. Hydrogen Energy. 2021;46:21566–21579. doi: 10.1016/j.ijhydene.2021.04.014. [DOI] [Google Scholar]
- Salmon N., Bañares-Alcántara R. Impact of grid connectivity on cost and location of green ammonia production: Australia as a case study. Energy Environ. Sci. 2021;14:6655–6671. doi: 10.1039/D1EE02582A. [DOI] [Google Scholar]
- Schnitkey G., Paulson N., Swanson K., Zulauf C. 2021 fertilizer price increases in perspective, with implications for 2022 Costs. Wkly. Farm Econ. 2021 https://farmdocdaily.illinois.edu/2021/08/2021-fertilizer-price-increases-in-perspective-with-implications-for-2022-costs.html [Google Scholar]
- Selvam K., Komatsu Y., Sciazko A., Kaneko S., Shikazono N. Thermodynamic analysis of 100% system fuel utilization solid oxide fuel cell (SOFC) system fueled with ammonia. Energy Convers. Manag. 2021;249:114839. doi: 10.1016/j.enconman.2021.114839. [DOI] [Google Scholar]
- Sinnott R.K. Fourth edition. Elsevier Science; 2005. Chemical Engineering Design: Chemical Engineering. [Google Scholar]
- Skodra A., Stoukides M. Electrocatalytic synthesis of ammonia from steam and nitrogen at atmospheric pressure. Solid State Ionics. 2009;180:1332–1336. doi: 10.1016/j.ssi.2009.08.001. [DOI] [Google Scholar]
- Smith C., Hill A.K., Torrente-Murciano L. Current and future role of Haber–Bosch ammonia in a carbon-free energy landscape. Energy Environ. Sci. 2020;13:331–344. doi: 10.1039/C9EE02873K. [DOI] [Google Scholar]
- Statista Production capacity of ammonia worldwide from 2018 to 2030. 2021. https://www.statista.com/statistics/1065865/ammonia-production-capacity-globally/
- Statistics Canada: Canada’s National Statistical Agency Farm and farm operator data - Saskatchewan remains the breadbasket of Canada. 2017. https://www150.statcan.gc.ca/n1/pub/95-640-x/2016001/article/14807-eng.htm
- Statistics Canada: Canada’s National Statistical Agency Value per acre of farm land and buildings at July 1. 2021. https://www150.statcan.gc.ca/t1/tbl1/en/tv.action?pid=3210004701
- The Royal Society . The Royal Society; 2020. Ammonia: Zero-Carbon Ferlitiser, Fuel and Energy Store. [Google Scholar]
- ThyssenKrupp A.G. Ammonia plants. 2022. https://www.thyssenkrupp-industrial-solutions.com/en/products-and-services/fertilizer-plants/ammonia-plants-by-uhde
- US inflation calculator. 2022. https://www.usinflationcalculator.com/
- Valera-Medina A., Xiao H., Owen-Jones M., David W.I.F., Bowen P.J. Ammonia for power. Prog. Energy Combust. Sci. 2018;69:63–102. doi: 10.1016/j.pecs.2018.07.001. [DOI] [Google Scholar]
- Wang L., Xia M., Wang H., Huang K., Qian C., Maravelias C.T., Ozin G.A. Greening ammonia toward the solar ammonia refinery. Joule. 2018;2:1055–1074. doi: 10.1016/j.joule.2018.04.017. [DOI] [Google Scholar]
- World Integrated Trade Solution Ammonia; anhydrous exports by country in 2019. 2022. https://wits.worldbank.org/trade/comtrade/en/country/ALL/year/2019/tradeflow/Exports/partner/WLD/product/281410
- Wu A., Yang J., Xu B., Wu X.-Y., Wang Y., Lv X., Ma Y., Xu A., Zheng J., Tan Q., et al. Direct ammonia synthesis from the air via gliding arc plasma integrated with single atom electrocatalysis. Appl. Catal. B Environ. 2021;299:120667. doi: 10.1016/j.apcatb.2021.120667. [DOI] [Google Scholar]
- Xu X., Tian X., Sun B., Liang Z., Cui H., Tian J., Shao M. 1 T-phase molybdenum sulfide nanodots enable efficient electrocatalytic nitrogen fixation under ambient conditions. Appl. Catal. B Environ. 2020;272 doi: 10.1016/j.apcatb.2020.118984. [DOI] [Google Scholar]
- Yauch B., Mitchnick S. Probe International; 2016. Power Exports at What Cost? How Ontario Electricity Customers Are Paying More to Dump the Province’s Excess Power. [Google Scholar]
- Zendrini M., Testi M., Trini M., Daniele P., Van Herle J., Crema L. Assessment of ammonia as energy carrier in the use with reversible solid oxide cells. Int. J. Hydrogen Energy. 2021;46:30112–30123. doi: 10.1016/j.ijhydene.2021.06.139. [DOI] [Google Scholar]
- Zhao Y., Setzler B.P., Wang J., Nash J., Wang T., Xu B., Yan Y. An efficient direct ammonia fuel cell for affordable carbon-neutral transportation. Joule. 2019;3:2472–2484. doi: 10.1016/j.joule.2019.07.005. [DOI] [Google Scholar]
Associated Data
This section collects any data citations, data availability statements, or supplementary materials included in this article.
Supplementary Materials
Data Availability Statement
-
•
Non-proprietary data and excel model that support the analysis within this paper is available from the lead contact upon reasonable request.
-
•
Any additional information is available from the lead contact upon reasonable request.