

Correction to: Tissue Eng Regen Med https://doi.org/10.1007/s13770-022-00438-4
In this article the graphics relating to Figs. 3, 4, 5 and 6 captions had been interchanged; the figures should have appeared as shown below.
Fig. 3.

Exploded pie chart showing analytical data of the frequencies regarding source of teeth selected in study designs from the relevant articles
Fig. 4.

Bar chart showing analytical data of the frequencies regarding tooth part selected in study designs from the relevant articles
Fig. 5.
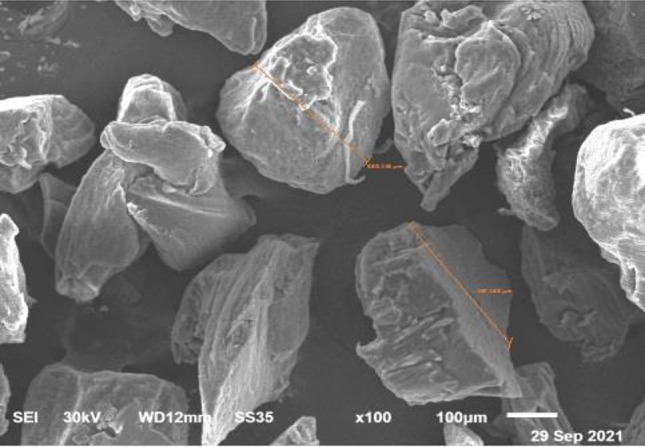
SEM images showing DDM particle size ranging from 350-500lm. Courtesy provided by the staff members of Oral Biology, Faculty of Dentistry, Mansoura University, Mansoura, Egypt
Fig. 6.
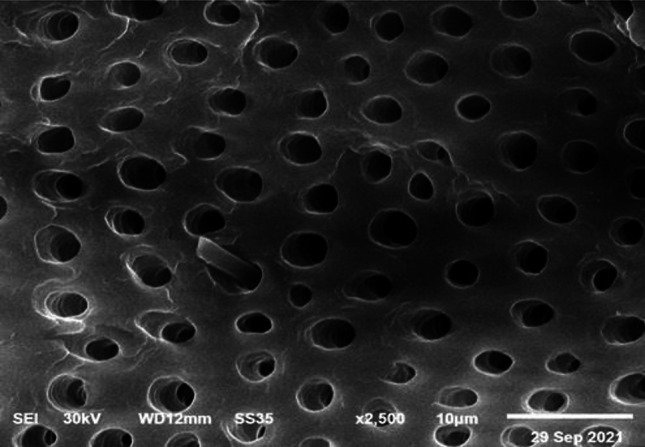
SEM images showing the basic dentin micro-texture after demineralization. Structurally, dentinal tubules are enlarged. Courtesy provided by the staff members of Oral Biology, Faculty of Dentistry, Mansoura University, Mansoura, Egypt.
The original article has been corrected.
Footnotes
Publisher's Note
Springer Nature remains neutral with regard to jurisdictional claims in published maps and institutional affiliations.