

Abstract
Rapidly detecting salient information in our environments is critical for survival. Visual processing in subcortical areas like the pulvinar and amygdala has been shown to facilitate unconscious processing of salient stimuli. It is unknown, however, if and how these areas might interact with cortical regions to facilitate faster conscious perception of salient stimuli. Here we investigated these neural processes using 7T functional magnetic resonance imaging (fMRI) in concert with computational modelling while participants (n = 33) engaged in a breaking continuous flash suppression paradigm (bCFS) in which fearful and neutral faces are initially suppressed from conscious perception but then eventually ‘breakthrough’ into awareness. Participants reported faster breakthrough times for fearful faces compared with neutral faces. Drift‐diffusion modelling suggested that perceptual evidence was accumulated at a faster rate for fearful faces compared with neutral faces. For both neutral and fearful faces, faster response times were associated with greater activity in the amygdala (specifically within its subregions, including superficial, basolateral and amygdalo‐striatal transition area) and the insula. Faster rates of evidence accumulation coincided with greater activity in frontoparietal regions and occipital lobe, as well as the amygdala. A lower decision‐boundary correlated with activity in the insula and the posterior cingulate cortex (PCC), but not with the amygdala. Overall, our findings suggest that hastened perceptual awareness of salient stimuli recruits the amygdala and, more specifically, is driven by accelerated evidence accumulation in fronto‐parietal and visual areas. In sum, we have mapped distinct neural computations that accelerate perceptual awareness of visually suppressed faces.
Keywords: 7T‐fMRI, drift diffusion modelling, perceptual awareness, perceptual decision‐making
Overall, our findings suggest that hastened perceptual awareness of salient stimuli recruits the amygdala and, more specifically, is driven by accelerated evidence accumulation in fronto‐parietal and visual areas.
1. INTRODUCTION
At any given moment, we receive vast quantities of information about our ever‐changing environments. To survive, it is critical that we can rapidly detect biologically relevant stimuli within this stream of information. Previous studies have found that salient information (e.g., spiders, fearful faces and fear‐conditioned stimuli) gain preferential access to awareness and are perceived faster than nonsalient information (Gayet, Paffen, Belopolsky, Theeuwes, & Van der Stigchel, 2016; Gomes, Silva, Silva, & Soares, 2017). Faster detection of salient information might be facilitated by subconscious processing within subcortical neural networks (i.e., the ‘low‐road’ subcortical route to the amygdala; Tamietto & de Gelder, 2010). This ‘low‐road’ describes a connection from the superior colliculus to the amygdala via the pulvinar that effectively bypasses cortical visual networks, thus enabling faster transmission to the amygdala (McFadyen, Mermillod, Mattingley, Halász, & Garrido, 2017) for processes relating to biological relevance and saliency computation (Koller, Rafal, Platt, & Mitchell, 2019).
An alternative hypothesis is that there are ‘many‐roads’ for processing salient information, such that other neural networks (e.g., dorsal and ventral visual streams, as well as fronto‐parietal and cingulate networks) play a significant role in the fast detection of salient information (Pessoa & Adolphs, 2010). Both hypotheses have in common that the amygdala plays a role in these processes. However, the hypotheses differ as to whether subcortical regions are also involved. The ‘many‐roads’ hypothesis suggests a role of the amygdala in evaluating salience in concert with cortical networks. The ‘low‐road’ hypothesis emphasises the role of the subcortical route to the amygdala with respect to rapid processing of survival critical stimuli.
The aim of the present study was to use functional magnetic resonance imaging (fMRI) to map neural activity in subcortical and cortical visual areas while participants made perceptual decisions about fearful and neutral faces. While we use ideas from the low‐road and high‐road hypotheses to make specific predictions for our study, we do not directly test the high‐road and low‐road hypotheses in the present article, which may be better tested with methods involving structural, functional and/or effective connectivity and a higher temporal resolution (see our related work; Garvert, Friston, Dolan, & Garrido, 2014; McFadyen, Mattingley, & Garrido, 2019; McFadyen et al., 2017). We used a breaking continuous flash suppression (bCFS) paradigm (Jiang, Costello, & He, 2007; Stein, Hebart, & Sterzer, 2011; Stein, Seymour, Hebart, & Sterzer, 2014), in which stimuli gradually emerged into conscious perception. Participants were tasked with reporting whether each stimulus was rotated clockwise or anticlockwise. The time taken to make this perceptual decision was used as a proxy for the time taken for the stimulus to enter peoples' awareness.
First, we sought to establish whether different brain regions were recruited for neutral versus fearful faces presented under bCFS. Previous accounts using the continuous flash suppression (CFS) paradigm (Tsuchiya & Koch, 2005) have used fMRI to establish differences between fearful and neutral stimuli when suppressed versus when consciously perceived (Jiang & He, 2006; Vizueta, Patrick, Jiang, Thomas, & He, 2012). Both studies found the involvement of the amygdala when processing suppressed fearful faces. Consistent with these studies, we hypothesised that the amygdala will be more strongly activated when processing fearful than neutral faces in the bCFS paradigm. Other studies, however, have found that activity in cortical regions (fronto‐parietal, temporal and occipital) correlates with perceptual transitions during binocular rivalry (Frässle, Sommer, Jansen, Naber, & Einhäuser, 2014; Knapen, Brascamp, Pearson, van Ee, & Blake, 2011; Lumer, Friston, & Rees, 1998; Lumer & Rees, 1999). Thus, we hypothesised that greater amygdala activity for fearful faces would coincide with increased activity within cortical brain regions (Pessoa & Adolphs, 2010). Interestingly, Balderston et al. (2017) used 3T‐fMRI and tractography to show that there are functional differences between the distinct human amygdala subregions as they process fear stimuli. Therefore, there may also be intra‐amygdala differences in the processing of suppressed fear and neutral stimuli. To test this possibility, we utilised a higher resolution 7T‐fMRI where we were able to image specific amygdala subregions while participants completed our task.
Secondly, we manipulated expectations about emotional expression of the upcoming suppressed faces by using probabilistic cues. Previous research has found that more probable stimuli become consciously accessible earlier than improbable stimuli—that is, ‘we see what we expect to see’ (McFadyen, Smout, Tsuchiya, Mattingley, & Garrido, 2019; Melloni, Schwiedrzik, Müller, Rodriguez, & Singer, 2011; Pinto, van Gaal, de Lange, Lamme, & Seth, 2015; Sterzer, Haynes, & Rees, 2008). Thus, we sought to investigate whether the degree of surprise (or expectation) about a visual stimulus might modulate neural activity relating to neutral and fearful face processing during bCFS.
Finally, we utilised drift diffusion modelling (Ratcliff, 1978) to specifically address the computational mechanisms underlying differences in response times to neutral versus fearful and expected versus unexpected stimuli. Previous studies have found that the drift rate parameter (emulating the rate of evidence accumulation) is higher for biologically relevant stimuli such as snakes and emotional facial expressions (Lerche, Bucher, & Voss, 2019; Lufityanto, Donkin, & Pearson, 2016; Tipples, 2015). This increased rate of evidence accumulation (drift‐rate) allows for faster accumulation of information and possibly leads to faster awareness of the stimulus and/or decision‐output in response. To better understand the neural computations underlying faster response times, we also mapped neural activity to the drift diffusion model parameters. Overall, using the current task design, we were able to investigate the specific neural and computational processes involved in hastening perceptual awareness of suppressed visual stimuli.
2. METHODS
2.1. Participants
We recruited 33 participants through the University of Queensland's Participation Scheme. The sample consisted of 16 males and 17 females between the ages of 18 and 36 years (mean = 23.18 years, SD = 4.73). Participants had a Beck's anxiety and depression inventory score of (mean ± SD) 7.6 ± 8.1 and 4.7 ± 4.5, respectively. All participants reported having no colour‐blindness and normal vision with or without corrective lenses. Participants with corrective glasses were excluded due to a practical difficulty with installing red‐green anaglyph lenses on top of the prescription glasses in the MRI scanner. Participants with contact lenses were included in the present study. All participants were compensated AU$20 per hour for their time and provided written consent. This study was approved by the University of Queensland's Human Research Ethics Committee. Two participants were excluded from behavioural and imaging analysis, one for falling asleep at multiple stages of the task and one decided to stop the study due to feeling claustrophobic in the MRI (total n = 31 for behavioural analysis). Additionally, there were three participants excluded from imaging analysis (but were included for behavioural analysis), two were excluded for excessive movement (±3 mm) throughout the task and one for having an unknown cyst in the brain (total n = 28 for imaging analysis).
2.2. Stimuli
Face stimuli used in the present study were collected from different experimentally validated databases, with the aim of maximising the number of unique faces presented. These databases included the Amsterdam Dynamic Facial Expressions Set (van der Schalk, Hawk, Fischer, & Doosje, 2011), the Karolinska Directed Emotional Faces set (Goeleven, De Raedt, Leyman, & Verschuere, 2008), the NimStim set (Tottenham et al., 2009) and the Warsaw Set of Emotional Expression Pictures (Olszanowski et al., 2014). The overall set of face stimuli consisted of 267 images of Caucasian adults (66 females and 71 males), with either neutral or emotional facial expressions. We cropped the hair, neck and shoulders from each image and then centred the faces within a 365 × 365‐pixel square with a black background. We calculated the luminance and root‐mean square contrast of the entire image (consisting of the grey‐scaled face and background), across all images using the SHINE toolbox (Willenbockel et al., 2010). There were no significant differences between the neutral and fearful emotional faces [luminance: neutral = 125.9, fearful = 124.68, t(130) = 1.954, p = .1; contrast: neutral = 125.9, fearful = 125.5, t(130) = 2.038, p = .09; Bonferroni‐corrected for two comparisons].
To suppress the face stimuli from perceptual awareness, we used Mondrian images made using code available online (http://martin-hebart.de/webpages/code/stimuli.html; as also used in Stein et al., 2014). These Mondrian masks were presented at 125% the size of the face stimuli to ensure that the faces were sufficiently masked. We then used MATLAB to convert all face and mask stimuli into sets of either red or green by removing the non‐relevant colour planes (e.g., to make red images, we removed the blue and green planes of the image). Having sets of red and green faces and masks allowed us to achieve dichoptic presentation with red‐green anaglyph glasses (specific dimensions and materials of the lenses can be found here: http://www.oz3d.com.au/catalog/product/view/id/99/s/red-green-paper-3d-glasses/).
2.3. Procedure
Participants first completed the MRI safety questionnaires and the consent form. We then determined the participants' ocular dominance using the Miles Test (Miles, 1930). Participants wore the red‐green anaglyph lenses such that the colour of the lens over the dominant eye matched the colour of the mask, which was predetermined using a counterbalancing approach to limit any confound of the red‐green colours. Participants then completed a short practice task using a titration procedure (see section on ‘Behavioural Titration’). Participants were then moved into the MRI scanner, where they first performed a titration task to account for individual differences in sensitivity to perceptual suppression caused by the mask and then proceeded with the main task (see section on ‘Behavioural Paradigm’). After completing scanning, participants completed the Beck's Anxiety and Depression Inventory (21 questions each; Beck, Steer, & Brown, 1996; Beck & Steer, 1990) outside of the scanner.
2.3.1. Behavioural paradigm
For the behavioural task, we utilized a ‘breakthrough’ variant of CFS (Jiang et al., 2007), which suppresses a stimulus of interest to one eye from conscious perception by presenting a high‐contrast flickering mask to the other eye. In the bCFS paradigm, the contrast of the stimulus of interest is then gradually increased from low to high such that the stimulus is no longer suppressed by the mask and emerges into awareness. By incorporating a discrimination task for the stimulus of interest (here, whether the face was rotated clockwise or anticlockwise), the task response time measures when different types of stimuli became consciously discriminable (Stein et al., 2011).
In the present experiment, each trial began with a 0.7‐s cue—the word ‘NEUTRAL’ or ‘FEARFUL’—for the upcoming stimulus. The cues were probabilistic, such that they reliably predicted the upcoming emotional expression 80% of the time. The cues were used to generate an expectation regarding the upcoming trial, and a resulting specific surprise (e.g., fearful face presented when cue was neutral, to create unexpected fearful). There would be some degree of unpredictability if no cues were used at all, rendering events unpredictable due to their random occurrence. This is different to being surprising per se, due to an explicit violation of expectation (conferred by incongruent cues). After the cue, a 3‐s transitioning anaglyph was presented. In the first frame, the mask stimulus (in the dominant‐eye's lens colour) was presented in the centre of the screen (see Figure 1). Over a period of 3 s, the face stimulus (in the non‐dominant eye's lens colour) was gradually superimposed over the mask stimulus at increasingly greater contrast levels (0–100% of titrated contrast level). The final frame of the trial consisted of both the mask and face simultaneously presented, both at 100% in different colours (red or green). On each trial, the face stimulus was rotated by 5° either clockwise or counter‐clockwise in a pseudo‐random order. Throughout the 3 s of each trial, the mask randomly changed to different Mondrian images at a rate of 10 Hz, creating a flickering effect that enhanced suppression of the face from conscious perception (Tsuchiya & Koch, 2005). A fixation cross was presented in the centre of the screen at all times. The inter‐trial interval was uniformly and randomly jittered between 0.25 and 0.5 s in 0.05‐s bins. Participants were instructed to report the rotation of the face as soon as it was perceptible by pressing the left (for counter clockwise) or right (for clockwise) button. Participants were instructed to be as fast as possible and were also informed that the emotional expression of the face was task‐irrelevant.
FIGURE 1.
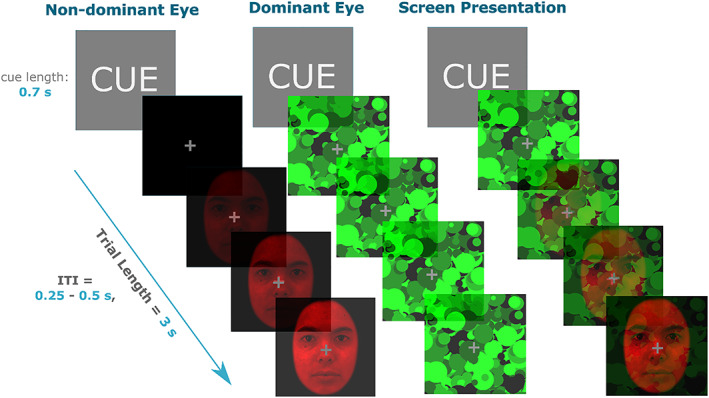
bCFS paradigm design example trial. Prior to the onset of the trial, participants were cued on the upcoming emotion of the face for 0.7 s. The face and masks were then presented to each eye, with the face increasing in contrast for 3 s and mask at 100% contrast for the full duration. The screen presentation panel is what the trial looked like without the red‐green anaglyph lenses, which were used to achieve dichoptic presentation. The face stimuli were always presented in the non‐dominant eye and mask in the dominant eye. The inter‐trial interval (ITI) was 0.25–0.50 s
Our design produced four different conditions: (1) expected fearful (EF; ‘fearful’ cue, followed by a fearful face, (2) expected neutral (EN; ‘neutral’ cue, followed by a neutral face), (3) unexpected fearful (UF; ‘neutral’ cue, followed by a fearful face) and (4) unexpected neutral (UN; ‘fearful’ cue, followed by a neutral face). There were 600 trials in total, consisting of 240 EF, 240 EN, 60 UN and 60 UF trials. These were all pseudo‐randomly ordered with the following constraints: (1) no two unexpected trials presented in a row and (2) no more than four consecutive presentations of the expected trials of the same emotional face. These 600 trials were split into four runs, containing 150 trials each. Each run had all four trial types with approximately 80–20% frequency of the expected–unexpected trials. The first five trials of each run were always expected trials. Lastly, the order that each run was presented was counter‐balanced across participants to minimise any confounding order‐effects. At the end of each run, participants had a less than 1‐min break while the scanner was restarted. The total task took approximately 42 min to complete (~10 min per run).
2.3.2. Behavioural titration
A titration task was used to determine the relative contrast of the face and mask stimuli that produced average response times of approximately 2 s. This was to ensure that participants were able to respond within the 3‐s trial period, while also accounting for individual differences in sensitivity to interocular suppression. The titration task contained all four conditions (EN, EF, UN and UF) as presented in the main behavioural task.
The first trial in the procedure started with the mask at lowest contrast relative to the face at highest contrast (100% face, 0% mask). We then altered their contrast using a staircasing procedure. Specifically, if the response time was faster than 2 s, the contrast of the mask was increased on the subsequent trial while that of the face was decreased so that the sum of the contrasts was always 1. Conversely, if response time was slower than 2 s, the contrast of the face on the following trial was increased (and the mask contrast decreased). This was adjusted trial‐by‐trial using the Palamedes toolbox in MATLAB (Prins & Kingdom, 2009) using a stepwise function, starting with 10% contrast adjustments that were then decreased by 2% after each reversal (i.e., a change in response type; fast to slow or slow to fast). After four reversals, contrast adjustments were fixed at 2%. The procedure produced four sets of contrast values per condition. A single contrast value was then calculated by taking the mean contrast across all conditions (EN, EF, UN and EF), which was subsequently used for all trials in the main task. The mean response time from the main task across all trials and participants was 1.9 s; a close match to the titrated value of 2 s.
Participants performed a brief (5 min, 80 trials) practice titration task before entering the scanner to ensure participants understood the task. This practice task did not include the unexpected conditions. The full titration procedure (120 trials) then took place inside the scanner while structural T1 scans were acquired.
2.3.3. MRI image acquisition parameters and sequences
Imaging data was acquired using a MAGNETOM 7T whole‐body scanner (Siemens Healthcare, Erlangen, Germany) with a 32‐channel head coil (Nova Medical, Wilmington, Delaware). The parameters for echo‐planer imaging (EPI) sequences for whole‐brain coverage used were the following: TR = 1.58 s, TE = 21 ms, flip angle = 65°, voxel size = 1.5 × 1.5 × 1.25 mm3, matrix dimensions = 148 × 148 × 78. The sequences were chosen based on Sladky et al. (2018), optimised for imaging the amygdala.
2.4. Analysis
2.4.1. Behaviour
Trials that had a response time of 0.5 s or less were removed (total of 79 trials removed across all participants). We also removed outliers (outside 3 SDs; total of 78 trials removed across all participants). To determine response time differences between conditions we used a 2 (prediction: expected, unexpected) × 2 (emotion: neutral, fearful) repeated‐measures analysis of variance (ANOVA) on only correct trials (mean accuracy = 94%).
2.4.2. Drift diffusion modelling
We used drift diffusion modelling (Ratcliff, 1978) and estimated its parameters to explain the response time distribution. We then used the estimated parameters to localise the respective neural correlates of psychological processes that are captured by these parameters. For parameter optimisation we tested a series of eight models, that is, a power set (=8) of three parameters (decision‐boundary: α, drift rate: v and non‐decision time: t 0) per condition (see Table 1). To test for which model best explained our data, we used the fast‐dm software that estimates maximum likelihood (Voss & Voss, 2007). Other than α, v and t0, we fixed three available parameters based on our experimental design: (1) starting point (z) at 0.5 as the face rotation was randomised, (2) differences in response execution at 0 in order to reduce the number of free parameters and we expect that the decision boundary has the same effect for adjusting response execution in our task, (3) inter‐trial variability was fixed at 0 for z and v as the number of incorrect trials (average of 5% across all conditions) were not enough to give reliable inter‐trial estimates. We then computed the Akaike information criteria (AIC) and the Bayesian information criteria (BIC) individually for each participant (all conditions) to test for which of the eight models best explained our data at the group level (by summing AIC/BIC across participants for each model). We then extracted the parameter estimates from the winning model for each of the four conditions for each participant. We compared the differences between these condition‐specific parameter estimates using a 2 (prediction: expected, unexpected) × 2 (emotion: neutral, fearful) ANOVA design with the two factors.
TABLE 1.
Model numbers and the associated free parameters
| Model number | Free parameter |
|---|---|
| 1 | Null |
| 2 | v |
| 3 | α |
| 4 | t 0 |
| 5 | α, v |
| 6 | α, t 0 |
| 7 | v, t 0 |
| 8 | α, v, t 0 |
Abbreviations: v, drift‐rate; α, decision‐boundary; t 0 , non‐decision time.
2.4.3. Functional magnetic resonance imaging
We used SPM12 (http://www.fil.ion.ucl.ac.uk/spm/software/spm12/) for all imaging analyses. We pre‐processed the MRI data using SPM default functions with steps in the order of realignment, co‐registration and segmentation, and normalised into MNI‐space with spatial resolution of 1.5 × 1.5 × 1.5 mm3. We smoothed the images using a 6 mm FWHM Gaussian kernel. This 6 mm kernel was used due to a relatively reduced BOLD signal yield, likely caused by the short inter‐trial interval (0.25–0.5 s) and jitter (0.05 s) in our task design. This short inter‐trial interval and jitter was used to maximise the number of trials in the task. However, we repeated the procedure with a 3 mm smoothing kernel for the amygdala region of interest analysis and yielded similar results (see Tables S3 and S4). We excluded runs with movement of greater than 3 mm (double the voxel size) in either of the x, y, z planes from further analyses. Each run consisted of 150 trials, with four runs in total per session (600 trials per session). Two participants were removed due to bad movement throughout the task, and in addition to this, 10 out of 112 runs were also removed across the remainder participants for excessive movement (n = 28). Movement was calculated during the image realignment step in spatial pre‐processing using SPM12, this provides an output of six movement parameters covering translation (x, y and z) and rotation (pitch, roll and yaw). See SPM12 manual section 30.2.1 for further details https://www.fil.ion.ucl.ac.uk/spm/doc/spm12_manual.pdf.
All first‐level general linear models (GLMs) included a regressor for the four conditions (EF, EN, UF and UN) as well as six additional movement regressors. We applied a 128 s high‐pass filter and set the masking threshold to 0.4, specified in the first‐level modelling. We performed all functional analyses within the time epoch of 1.9 s (mean response time across all conditions and participants) from the onset of the face stimuli. We designed a total of four second‐level GLMs that included the four condition regressors, as well as either: GLM (1) no additional regressor, GLM (2) average response time, GLM (3) drift rate and GLM (4) decision boundary. All these were added in the second‐level modelling, with any response‐time and drift‐rate outlier participants (±3 SD) removed. Because the computational parameters were not a trial‐by trial estimate, we could not specifically exclude just the trials, but had to exclude the participant. There were no outliers in the response time and decision‐boundary regressor (n = 28 for both), however there were three participants removed as outliers in the drift‐rate regressor (n = 25). We determined the anatomical labels for the resultant maps of significant neural activity using the SPM Anatomy Toolbox (Eickhoff et al., 2005).
We also conducted ROI analyses to identify activation within the amygdala and its subregions that covaried with response time, drift‐rate and decision‐boundary using the four GLMs described above. We created an amygdala‐specific anatomical mask (using SPM Anatomy Toolbox; Eickhoff et al., 2005) by combining individual masks of four of the amygdala subregions: superficial (SF), amygdalo‐striatal transition area (AStr), basolateral (BL) and centromedial (CM). This mask was specified in the second‐level analysis as an explicit mask for the ROI analysis. The background image in all brain figures is from Bollmann et al. (2017); https://imaging.org.au/Human7T/MP2RAGE). All fMRI data presented is at p < .05 family‐wise error corrected threshold, with a voxel cut‐off of k = 4.
3. RESULTS
3.1. Behaviour
3.1.1. Perceptual decisions are accelerated for fearful faces
We first investigated the response time data across conditions. Both the fearful conditions (EF; 1.87 s ± 0.03 and UF; 1.88 s ± 0.03) had a faster breakthrough time compared with the neutral conditions (EN; 1.91 s ± 0.03 and UN; 1.92 s ± 0.03)—main effect of emotion: F(1,30) = 21.56, p < .001. There were no significant response time differences based on the prediction factor [main effect of prediction: F(1,30) = 2.2, p = .15] and no interaction between the emotion and prediction factors [F(1,30) = 0.56, p = .46]. Overall, this suggests that both fearful conditions (EF and UF) had a faster response time compared with the neutral conditions (EN and UN), irrespective of expectation (see Figure 2). Accuracy scores were at ceiling across all four conditions: EN (95% ± 0.8), UN (95% ± 0.7), EF (94% ± 0.9) and UF (96% ± 0.6).
FIGURE 2.
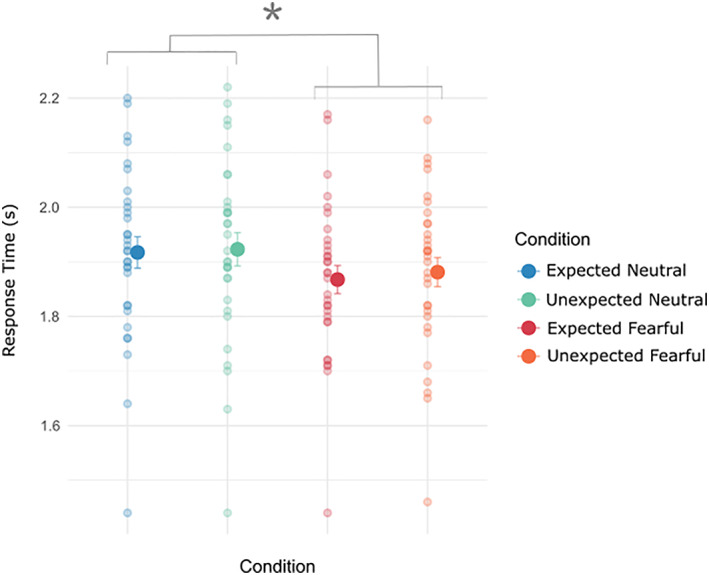
Behavioural results of response time and accuracy across conditions. Fearful faces (both EF and UF) had faster response times compared with neutral faces. Smaller dots are individual participants' mean response times, with the larger dot being the overall mean. Error bars are standard error of the means. *p < .05
3.1.2. Faster drift‐rate and lower decision‐boundary for fearful faces
We used drift‐diffusion modelling to investigate the processes that underpin accelerated response time we observed for fearful faces. The aim of this modelling was to disentangle which latent processes may be influencing the reaction time differences found between the fearful and neutral faces. We first performed parameter optimisation to determine the winning model (see section on ‘Methods’ for details). To determine this, we computed the AIC and BIC scores and compared across the eight models (Table 1). We found that model 3, which included the free parameter of drift‐rate (v), best explained our data according to AIC and BIC (by only approximately 3.5 over the second‐best model, m2 which included the free parameter decision‐boundary; see Figure 3). The difference between the top two models provides moderate, but not strong, evidence in favour of model 3 and therefore we report the condition specific differences of these parameters across participants using both the top two winning models; model 2 (decision‐boundary) and model 3 (drift‐rate).
FIGURE 3.
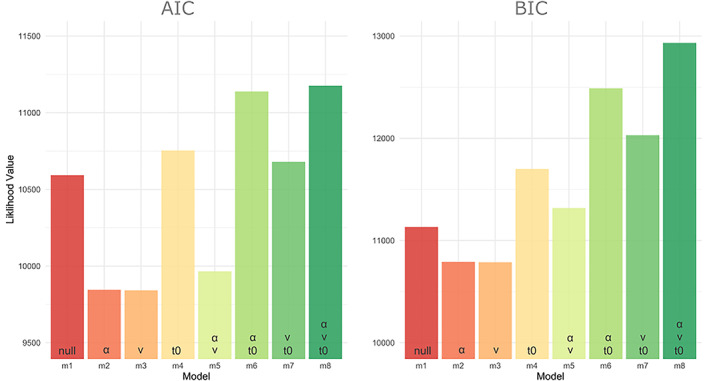
AIC and BIC scores for parameter optimisation across all eight models (m1–8). Parameter combinations used for each model are specified at the bottom of the bars. Lower values indicate better fits. For both AIC and BIC, the winning model was model 3 (v), by 3.5, compared with the next best model (model 2; α). v, drift‐rate; α, decision‐boundary; t 0, non‐decision time
Fearful faces (both expected and unexpected) had a significantly faster drift‐rate [main effect of emotion; F(1,27) = 20.12, p < .0001] compared with neutral faces (EN = 1.66 ± 0.06, UN = 1.65 ± 0.05, EF = 1.74 ± 0.06, UF = 1.72 ± 0.06). We did not find a significant main effect of prediction [F(1,27) = 0.52, p = .5], nor an interaction between emotion and prediction factors [F(1,27) = 0.1, p = .75]. This suggests that faster response times for the fearful conditions were influenced by an increased drift‐rate (Figure 4a), which reflects an increased rate of evidence accumulation of the fearful stimuli and facilitate a faster perceptual discrimination on the rotation of the faces.
FIGURE 4.
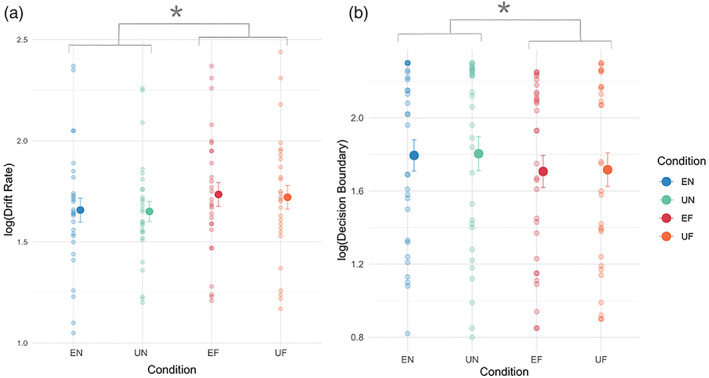
Parameter estimates across conditions using drift‐diffusion modelling. (a) Drift‐rate parameter estimates. Fearful faces had a faster drift rate compared with neutral faces. Individual small dots represent each participant's parameter estimate. (b) Decision‐boundary parameter‐estimate. Fearful faces have a lower decision boundary. Results plotted as mean ± SEM. *p < .05. EF, expected fearful; EN, expected neutral; UF, unexpected fearful; UN, unexpected neutral
Fearful faces (both expected and unexpected) had a lower decision‐boundary [main effect of emotion; F(1,29) = 15.3, p < .001] compared with neutral faces (EN = 1.79 ± 0.86, UN = 1.80 ± 0.09, EF = 1.71 ± 0.09, UF = 1.72 ± 0.09). There was no main effect of prediction [F(1,29) = 0.19, p = .66] and no interaction between emotion and prediction factors [F(1,29) = 0.0001, p = .997]. This suggests that a lower decision‐boundary provides a plausible alternative explanation for faster reaction times for fearful conditions (Figure 4b), which emulates a reduction in the amount of information required to make a perceptual decision.
In sum, it appears that the faster reaction times of the fearful conditions may be explained by an increased drift‐rate or a lower decision‐boundary, although we observed sufficiently greater model evidence for an increased drift‐rate. A greater drift‐rate corresponds to a greater rate of evidence accumulation from information in our environments, leading to a faster reaction time as a result. Similarly, a reduced decision boundary requires less information/evidence for a decision‐output, also leading to a faster reaction time.
3.2. fMRI neural activity
3.2.1. Neural correlates of accelerated response times
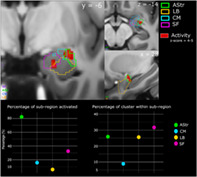
We first investigated patterns of whole‐brain BOLD signal that correlated with faster response time (negative T‐contrast correlation) across all conditions (GLM 2). We found significant covariation in the bilateral insular lobes, bilateral Rolandic operculum which covers the insula (top panel, Figure 5), bilateral cuneus (bottom left, Figure 5), the right visual thalamus (bottom right Figure 5), superior and middle temporal gyrus (MTG and STG) and the amygdala. We then performed an ROI analysis on the amygdala and its subregions [superficial (SF), amygdalo‐striatal transition area (AStr), basolateral (BL) and centromedial (CM)]. There was a small cluster (9 voxels) in the left amygdala within the SF area that significantly covaried with response time. In the right amygdala, we observed a larger cluster (117 voxels) across the AStr, SF and BL areas. A large percentage of AStr (82.3%) was activated, with 25.9% of this cluster being within the AStr. We also found a slightly larger percentage of this cluster to be within the SF area (31.7%), with 32.5% of this subregion activated. Lastly, 25.6% of this cluster was also within the BL with 5.9% percentage of this area activated (Figure 6; see Table S1 for a list of all the brain regions activated and their respective MNI‐coordinates). We also performed the ROI analysis for the amygdala using a 3 mm smoothing kernel instead of 6 mm in order to increase the spatial resolution. We find the same amygdalar subregions are activated with a similar trend of the AStr being the subregion with the largest percentage activated (see Tables S4 and S5).
FIGURE 5.
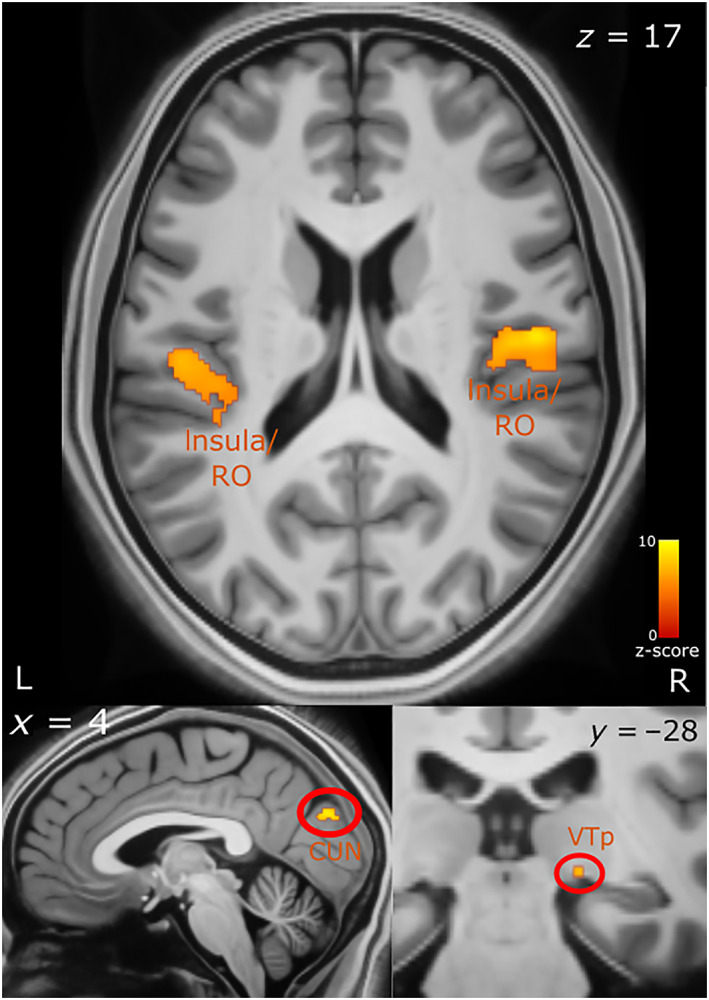
Brain activity correlated with faster response times. Top panel shows activation in the insula and Rolandic operculum. The bottom left panel shows activation in the cuneus and bottom right in the right visual thalamus. The axial (z), coronal (y) and sagittal (x) MNI coordinates are embedded in the relevant images. CUN, cuneus; L, left; R, right; RO, Rolandic operculum; VT, visual thalamus (pulvinar)
FIGURE 6.
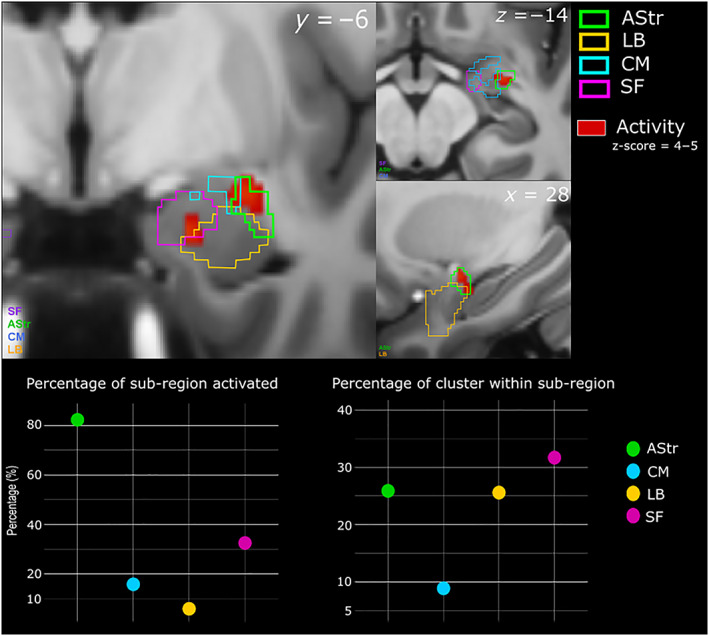
Subregion activations within the right amygdala, correlated with faster response time. Top panel shows activity in red with the subregional divisions overlaid in their respective colours. The bottom left graph shows the percentage of subregion activated. The bottom right graph shows the percentage of the cluster within each of the subregions. The axial (z), coronal (y) and sagittal (x) MNI coordinates are embedded in the relevant images. AStr, amygdalo‐striatal transition area; BL, basolateral; CM, centromedial; SF, superficial
3.2.2. Neural correlates of increased drift rate/evidence accumulation
We next investigated which brain regions were engaged in the implementation of the computation modelled above, namely the increased drift‐rate (positive T‐contrast; GLM 3) or evidence accumulation. We found that greater activity in frontal regions including the middle frontal gyrus (MFG) and inferior frontal gyrus (IFG) significantly covaried with increased drift rate (see Figure 7).
FIGURE 7.
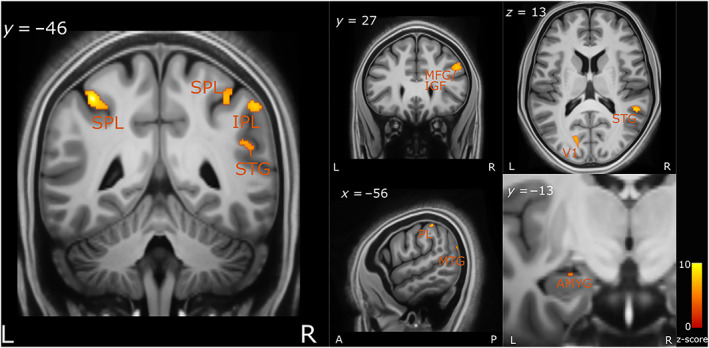
Brain regions correlated with increased drift‐rate. The axial (z), coronal (y) and sagittal (x) MNI coordinates and brain region labels are embedded in the relevant images. AMYG, amygdala; IPL, inferior parietal lobule; L, left; MFG, middle frontal cortex; MTG, middle temporal gyrus; PL, parietal lobe; R, right; SPL, superior parietal lobe; STG, superior temporal gyrus; V1, primary visual cortex
There was also significant covariation within the primary visual cortex and the surrounding visual areas (including the middle and superior occipital gyri), as well as the middle and superior temporal gyrus and bilateral inferior and superior parietal lobe (IPL and SPL). Lastly, there was also a relatively small cluster (voxels = 13) activated within the left amygdala. See Table S2 for a list of all the brain regions activated and their respective MNI coordinates.
3.2.3. Neural correlates of lower decision‐boundary
We investigated brain activity correlating with a lower decision‐boundary (negative T‐contrast correlation) (GLM 4). The left insula, posterior cingulate cortex (PCC) and the postcentral gyrus showed increased activation with a decreasing decision boundary (Figure 8). The pMFC and angular gyrus activity was also correlated with a lower decision‐boundary. Lastly, we did not observe significant activity in the amygdala. See Table S3 for a list of all the brain regions activated and their respective MNI coordinates.
FIGURE 8.
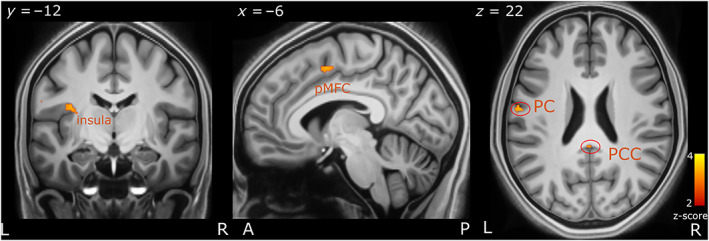
Brain regions correlating with lower decision‐boundary. Interoceptive brain regions including the PCC, insula and the PS as well as in the pMFC. The axial (z), coronal (y) and sagittal (x) MNI coordinates and brain region labels are embedded in the relevant images. A, anterior; L, left; P, posterior; PC, postcentral; PCC, posterior cingulate cortex; pMFC, posterior medial frontal cortex; R, right
4. DISCUSSION
Our findings demonstrate that participants can perceptually discriminate fearful faces faster than neutral faces in a breaking continuous flash suppression paradigm, replicating a previous finding from our lab (McFadyen, Smout, et al., 2019) and supporting findings from previous psychophysical experiments (Jiang et al., 2009; Yang, Zald, & Blake, 2007). Drift diffusion modelling revealed that the faster response times to fearful faces could be explained by an increased rate of evidence accumulation prior to response as well as a reduced decision boundary. Using 7T‐fMRI we found that faster response times correlated with greater activity in the insula, amygdala, visual areas and the temporal gyrus, across both fearful and neutral faces. Further, an increased drift rate correlated with activity in the parietal lobe, inferior and medial frontal gyri, as well as the temporal gyrus and amygdala, across both neutral and fearful faces. Lastly, we found that interoceptive brain regions (insula, postcentral and posterior cingulate cortex) underpin lower decision‐boundaries.
The response time findings support previous literature in that fearful faces do gain preferential access to awareness. The faster perceptual discrimination and response times for fearful faces are computationally explained by a greater rate of evidence accumulation (drift‐rate) as suggested by our drift‐diffusion modelling results. These response time differences may therefore be influenced by fearful faces breaking into awareness faster than neutral faces, and also by fearful faces leading to faster perceptual decision‐making in discriminating the face's rotation. Our computational model suggested an involvement of these processes where fear hastened perceptual decision‐making enabled by an increased drift‐rate, allowing for a faster accumulation of visual evidence.
Contrary to our hypothesis, we did not observe significant brain activity differences for the main effect of emotion, between the fearful and neutral conditions (Figure S1). This is likely due to neutral faces having an equal relevance to fearful faces in completing our task, where participants were tasked to discriminate facial orientation irrespective of emotion. This interpretation is consistent with Reinders, Den Boer, and Büchel (2005), where both fearful and neutral faces were shown to engage salience related brain regions such as the amygdala, when contrasted with non‐salient stimuli (e.g., a house). Additional studies have also demonstrated that neutral faces have a relatively high salience value, evident from the observed activation of salience‐related brain regions in response to these neutral faces (Fischer et al., 2003; Goossens et al., 2009; Jiang & He, 2006; Kesler‐West et al., 2001; Ottaviani et al., 2012; Reinders et al., 2006; Santos, Mier, Kirsch, & Meyer‐Lindenberg, 2011). Consistent with these previous accounts, we found that faster response times correlated with activity in the insula and amygdala across both, fearful and neutral conditions. The insula has been implicated in facilitating attentional processing, both externally toward the stimuli and internally with interoceptive processing. Moreover, the insula mediates visual awareness in CFS and binocular rivalry paradigms (Frässle et al., 2014; Knapen et al., 2011; Lumer et al., 1998; Lumer & Rees, 1999; Menon & Uddin, 2010; Salomon et al., 2016; Salomon et al., 2018). Additionally, our findings support the theoretical proposal by Craig (2009) in that the insula plays a critical role in conscious awareness and salient information processing. Overall, insula activity correlated with faster response times and suggest that faster breakthrough and/or perceptual decisions are mediated by rapid salience detection, enhanced for both neutral and fearful faces.
The amygdala is a key component in salience processing (Ledoux, 1998; Pessoa & Adolphs, 2010), and is thought to play a role in general relevance/salience detection (Attar, Müller, Andersen, Büchel, & Rose, 2010; Sander, Grafman, & Zalla, 2003), including responding to faces irrespective of emotional valence (Goossens et al., 2009; Lin et al., 2020; Santos et al., 2011). The amygdala has also been shown to process visually‐suppressed salient stimuli in CFS and binocular rivalry paradigms (Jiang & He, 2006; Pasley, Mayes, & Schultz, 2004; Troiani & Schultz, 2013; Vizueta et al., 2012; Williams, Morris, McGlone, Abbott, & Mattingley, 2004). Consistent with these previous accounts, we interpret amygdala activation in our data as playing a role in detecting stimulus salience and potentially increasing attention, thereby facilitating perceptual awareness and/or decision, for both neutral and fearful faces. More specifically, we show that the AStr subregion within the right amygdala plays a significant role in these processes, together with the BL and SF subregions. The rat AStr was shown to conduct given neural stimulation with high velocity in vitro, relative to other amygdala subregions and this was interpreted as AStr being involved in producing fast behavioural responses (Wang, Kang‐Park, Wilson, & Moore, 2002). Therefore, our finding of AStr's involvement with hastening response times is consistent with the interpretation from Wang et al. (2002). However, the activation of the other subregions (SF and BL) within the amygdala also implicates that several different processes within the amygdala may be involved in hastening response times. For example, the BL of the amygdala receives sensory input (Davis & Shi, 2000), suggesting that visual processes and computations involved in hastening reaction times may be happening at a relatively early stage of visual processing. Additionally, the SF regions of the amygdala (compared with the deeper amygdala regions) had been shown to be better connected to the frontal cortex (Bach, Behrens, Garrido, Weiskopf, & Dolan, 2011), and therefore the activation of SF as well as the frontal cortex (see Table S1) in our task may also suggest the involvement of SF and frontal cortex in hastening the response times. Goossens et al. (2009) combined 3T fMRI with cytoarchitectonic probability maps of the amygdala and found that the SF amygdala is generally activated in response to faces (with fearful, happy and neutral expressions) and these responses did not differ across different emotional expressions. Our finding, with a higher spatial resolution of 7T fMRI, is consistent with that of Goossens et al. (2009) since we also found SF activation across both fearful and neutral faces. Critically, the lack of intra‐amygdala differences in processing fearful and neutral faces, supports the general salience processing hypothesis of the amygdala proposed by Sander et al. (2003). Lastly, we also found activation of temporal, occipital and frontoparietal cortical regions correlated with faster response times. Given that we did not find brain activity differences between fearful and neutral faces, our brain results suggest that situational salience may be an important factor in speeding response times, as supposed to just valence. This function would allow individuals to learn specific salience values of the same cues in a given environmental context (e.g. traffic lights that are specific for bikes should be more salient in the context of riding a bike as supposed to driving a car). However, given that we do find response time differences between the two conditions, valence also seems to be playing a role here, but was not observed in the brain activity specific to our task and design, and therefore we cannot conclude that situational salience is the only factor driving our results. In sum, faster response times for both neutral and fearful faces appeared to engage the salience processing systems, with contributions from the insula and the amygdala. Both these regions are part of the salience network (Goulden et al., 2014; Jacobs et al., 2016; Uddin, 2016).
Correlating our computational model parameters with the neuroimaging data across all conditions allowed for a more mechanistic understanding of the processes involved leading up to the perceptual awareness and decision, as well as where in the brain these processes might be implemented. Faster drift‐rate correlated with increased activity in the parietal lobe, which has been associated with attention, evidence accumulation and perceptual decision‐making which are processes that are likely involved in accelerating the response time in our task (Behrmann, Geng, & Shomstein, 2004; d'Acremont, Fornari, & Bossaerts, 2013; Ploran et al., 2007). Faster drift rate also correlated with increased activation of the IFG and MFG, both part of the dorsolateral prefrontal cortex (dlPFC) (Cieslik et al., 2013). These regions have been shown to play a critical role in accumulating sensory evidence (Pleger et al., 2006; Summerfield et al., 2006), collectively facilitating perceptual decision‐making by integrating outputs from lower‐level task‐related sensory regions (Heekeren, Marrett, Bandettini, & Ungerleider, 2004; Heekeren, Marrett, & Ungerleider, 2008). Consistent with previous work, our results show that dlPFC activity also co‐occurs with activation in low‐level visuo‐sensory areas including the occipital lobe and MTG. Therefore, the dlPFC likely integrates visuo‐sensory evidence from the occipital lobe and MTG, which allows for the accelerated decision‐output in discriminating the face's rotation. Further support for this comes from Philiastides, Auksztulewicz, Heekeren, and Blankenburg (2011). Philiastides et al. reported that the disruption of dlPFC using repetitive transcranial magnetic stimulation (rTMS) in a perceptual decision‐making task slowed response times, which was associated with a reduced drift‐rate. However, it is important to note that there have been inconsistent results using rTMS on dlPFC in assessing conscious awareness (see Bor, Schwartzman, Barrett, and Seth (2017) and Rounis, Maniscalco, Rothwell, Passingham, and Lau (2010)). However, overall, there is evidence demonstrating the integrative role of dlPFC in evidence accumulation and perceptual decision making.
A lower decision boundary correlated with the PCC, insula and postcentral. These brain regions have previously been implicated in greater interoceptive awareness, which was found to improve decision‐making (Terasawa, Fukushima, & Umeda, 2013; Werner et al., 2013). Therefore, we speculate that one component of a lower decision boundary, and the faster reaction‐times in our task may be influenced by increased interoceptive awareness. There was also activity in the pMFC and angular gyrus which are involved in performance monitoring and visuospatial attention (Cattaneo, Silvanto, Pascual‐Leone, & Battelli, 2009; Danielmeier, Eichele, Forstmann, Tittgemeyer, & Ullsperger, 2011), which may contribute to hasten reaction‐times in our task.
Prior work using fMRI and the CFS paradigm found that the superior temporal sulcus (STS) is involved in processing visible and suppressed fearful faces but not suppressed neutral faces (Jiang & He, 2006). Vizueta et al. (2012) also used the CFS paradigm in fMRI and found that the STS activity correlated with processing suppressed fearful faces, but only when accounting for negative affectivity traits. Critically, in both tasks, STS activity was positively correlated (across subjects) with activity in the amygdala. In contrast, in our task (using bCFS) we found activity in the MTG and the STG (which is anatomically separated by the STS) to be correlated with faster response time and increased drift rate, across both, neutral and fearful faces. Consistent with the previous studies, we also found amygdala activity (although a relatively small cluster for drift‐rate correlation) co‐occurring with regions close to the STS (the MTG and STG). However, contrary to the previous accounts, we also found MTG and STG/amygdala activity for neutral faces. Given that our behavioural task places equal demands/task relevance on both face conditions, it is likely that the MTG and STG/amygdala activity here is playing a role in processing both neutral and fearful faces. The contrasting findings may also suggest that different brain and computational processes are engaged in the bCFS task compared with the CFS paradigm, with bCFS likely engaging brain regions involved perceptual in decision‐making, in addition to just perceptual awareness.
A limitation of the present study is that we were unable to disambiguate the specific contributions of the two processes of perceptual awareness and perceptual decision‐making. This is due to the possibility of our response time capturing both the time taken to perceive the stimuli and the time taken to decide (discriminate rotation) and make a response. While the non‐decision time parameter in the diffusion model is supposed to absorb processes related to perception and motor control, it is possible that low‐level stimulus features influence the other parameters of the decision‐making process such as drift‐rate and decision‐boundary. Therefore, in the future, to better disambiguate the specific contributions of threat processing from the effects of low‐level visual features inherent to fearful versus neutral faces, a controlled fear conditioning paradigm may allow for more explicit interpretations. Further, given that fearful faces have larger eye whites discriminating their orientation may be easier compared with neutral faces. This could therefore lead to the faster response times for fearful faces and may be a potential confound in the present study. Future studies may better account for this by using a localization or detection paradigm (del Río, Greenlee, & Volberg, 2018; Pinto et al., 2015). Additionally, contrary to our hypothesis, we did not find response time differences relating to the expectation manipulation. One explanation for this lack of an effect may be due to the task design where expectation had a relatively low task relevance. Participants were tasked to discriminate face rotation irrespective of the cue and therefore may have ignored the cue altogether. For this reason, the expectation factor may not have been encoded in the first place. Lastly, our reduced BOLD signal, possibly due to our task design where a very small jitter was used, is a limitation of the present study and may be one contributor to the lack of brain activity differences between fearful and neutral faces.
In sum, we find speeded response time in our task that correlated with salience‐related brain regions for both neutral and fearful faces. In search of a more mechanistic account, we correlated our computational parameter estimate of drift rate and decision boundary with our brain data. We found that increased drift rate engaged regions within the dlPFC (IFG and MFG) as well as visuo‐sensory (occipital lobe and MTG) and attentional brain regions (IPL), suggesting that collectively, these regions contribute to increased rate of sensory evidence accumulation that leads to faster perceptual awareness and decision processes. We also found that a reduced decision boundary correlated with the PCC, postcentral and insula which may be playing a role in increased interception. Lastly, we found that faster response time correlated with increased activity in the amygdala and the insula, likely playing a role in salience detection across both neutral and fearful faces. Overall, we shed light on the specific neural computational processes leading to awareness and perceptual decisions of salient information processing that as it emerges into consciousness.
CONFLICT OF INTEREST
The authors declare no conflicts of interest.
ETHICS APPROVAL STATEMENT
This study was approved by the University of Queensland's Human Research Ethics Committee.
Supporting information
Appendix S1 Supporting Information.
ACKNOWLEDGMENTS
This work was funded by the Australian Research Council Centre of Excellence for Integrative Brain Function (ARC Centre Grant CE140100007) to M.I.G and ARC Discovery Projects: DP180104128 to M.I.G and N.T. We thank the participants for their time. We also thank the radiographers Aiman Al‐Najjar, Nicole Atcheson and Sarah Daniel.
Kalhan, S. , McFadyen, J. , Tsuchiya, N. , & Garrido, M. I. (2022). Neural and computational processes of accelerated perceptual awareness and decisions: A 7T fMRI study. Human Brain Mapping, 43(12), 3873–3886. 10.1002/hbm.25889
Funding information Australian Research Council, Grant/Award Numbers: CE140100007, DP180104128
DATA AVAILABILITY STATEMENT
Data and code may be made available upon request to the authors given ethics approval and a formal data sharing agreement.
REFERENCES
- Attar, C. H. , Müller, M. M. , Andersen, S. K. , Büchel, C. , & Rose, M. (2010). Emotional processing in a salient motion context: Integration of motion and emotion in both V5/hMT+ and the amygdala. Journal of Neuroscience, 30(15), 5204–5210. 10.1523/JNEUROSCI.5029-09.2010 [DOI] [PMC free article] [PubMed] [Google Scholar]
- Bach, D. R. , Behrens, T. E. , Garrido, L. , Weiskopf, N. , & Dolan, R. J. (2011). Deep and superficial amygdala nuclei projections revealed in vivo by probabilistic tractography. Journal of Neuroscience, 31(2), 618–623. 10.1523/JNEUROSCI.2744-10.2011 [DOI] [PMC free article] [PubMed] [Google Scholar]
- Balderston, N. L. , Hale, E. , Hsiung, A. , Torrisi, S. , Holroyd, T. , Carver, F. W. , Coppola, R. , Ernst, M. , & Grillon, C. (2017). Threat of shock decreases excitability and connectivity of the intraparietal sulcus. eLife, 6, e23608. 10.7554/eLife.23608 [DOI] [PMC free article] [PubMed] [Google Scholar]
- Beck, A. T. , & Steer, R. A. (1990). Manual for the Beck anxiety inventory. San Antonio, TX: Psychological Corporation. [Google Scholar]
- Beck, A. T. , Steer, R. A. , & Brown, G. K. (1996). Manual for the Beck depression inventory‐II. Psychological Corporation. [Google Scholar]
- Behrmann, M. , Geng, J. J. , & Shomstein, S. (2004). Parietal cortex and attention. Current Opinion in Neurobiology, 14(2), 212–217. 10.1016/j.conb.2004.03.012 [DOI] [PubMed] [Google Scholar]
- Bollmann, S. , Janke, A. , Marstaller, L. , Reutens, D. , O'Brien, K. , & Barth, M. (2017). MP2RAGE T1‐weighted average 7T model. The University of Queensland. 10.14264/uql.2017.266 [DOI] [Google Scholar]
- Bor, D. , Schwartzman, D. J. , Barrett, A. B. , & Seth, A. K. (2017). Theta‐burst transcranial magnetic stimulation to the prefrontal or parietal cortex does not impair metacognitive visual awareness. PLoS One, 12(2), e0171793. 10.1371/journal.pone.0171793 [DOI] [PMC free article] [PubMed] [Google Scholar]
- Cattaneo, Z. , Silvanto, J. , Pascual‐Leone, A. , & Battelli, L. (2009). The role of the angular gyrus in the modulation of visuospatial attention by the mental number line. NeuroImage, 44, 563–568. 10.1016/j.neuroimage.2008.09.003 [DOI] [PMC free article] [PubMed] [Google Scholar]
- Cieslik, E. C. , Zilles, K. , Caspers, S. , Roski, C. , Kellermann, T. S. , Jakobs, O. , Langner, R. , Laird, A. R. , Fox, P. T. , & Eickhoff, S. B. (2013). Is there one DLPFC in cognitive action control? Evidence for heterogeneity from co‐activation‐based parcellation. Cerebral Cortex, 23(11), 2677–2689. 10.1093/cercor/bhs256 [DOI] [PMC free article] [PubMed] [Google Scholar]
- Craig, A. D. (2009). How do you feel—now? The anterior insula and human awareness. Nature Reviews Neuroscience, 10, 59–70. 10.1038/nrn2555 [DOI] [PubMed] [Google Scholar]
- d'Acremont, M. , Fornari, E. , & Bossaerts, P. (2013). Activity in inferior parietal and medial prefrontal cortex signals the accumulation of evidence in a probability learning task. PLoS Computational Biology, 9(1), e1002895. 10.1371/journal.pcbi.1002895 [DOI] [PMC free article] [PubMed] [Google Scholar]
- Danielmeier, C. , Eichele, T. , Forstmann, B. U. , Tittgemeyer, M. , & Ullsperger, M. (2011). Posterior medial frontal cortex activity predicts post‐error adaptations in task‐related visual and motor areas. Journal of Neuroscience, 31, 1780–1789. 10.1523/JNEUROSCI.4299-10.2011 [DOI] [PMC free article] [PubMed] [Google Scholar]
- Davis, M. , & Shi, C. (2000). The amygdala. Current Biology, 10(4), R131. 10.1016/s0960-9822(00)00345-6 [DOI] [PubMed] [Google Scholar]
- del Río, M. , Greenlee, M. W. , & Volberg, G. (2018). Neural dynamics of breaking continuous flash suppression. NeuroImage, 176, 277–289. 10.1016/j.neuroimage.2018.04.041 [DOI] [PubMed] [Google Scholar]
- Eickhoff, S. B. , Stephan, K. E. , Mohlberg, H. , Grefkes, C. , Fink, G. R. , Amunts, K. , & Zilles, K. (2005). A new SPM toolbox for combining probabilistic cytoarchitectonic maps and functional imaging data. NeuroImage, 25(4), 1325–1335. 10.1016/j.neuroimage.2004.12.034 [DOI] [PubMed] [Google Scholar]
- Fischer, H. , Wright, C. I. , Whalen, P. J. , McInerney, S. C. , Shin, L. M. , & Rauch, S. L. (2003). Brain habituation during repeated exposure to fearful and neutral faces: A functional MRI study. Brain Research Bulletin, 59(5), 387–392. 10.1016/S0361-9230(02)00940-1 [DOI] [PubMed] [Google Scholar]
- Frässle, S. , Sommer, J. , Jansen, A. , Naber, M. , & Einhäuser, W. (2014). Binocular rivalry: Frontal activity relates to introspection and action but not to perception. Journal of Neuroscience, 34(5), 1738–1747. 10.1523/JNEUROSCI.4403-13.2014 [DOI] [PMC free article] [PubMed] [Google Scholar]
- Garvert, M. M. , Friston, K. J. , Dolan, R. J. , & Garrido, M. I. (2014). Subcortical amygdala pathways enable rapid face processing. NeuroImage, 102(P2), 309–316. 10.1016/j.neuroimage.2014.07.047 [DOI] [PMC free article] [PubMed] [Google Scholar]
- Gayet, S. , Paffen, C. L. E. , Belopolsky, A. V. , Theeuwes, J. , & Van der Stigchel, S. (2016). Visual input signaling threat gains preferential access to awareness in a breaking continuous flash suppression paradigm. Cognition, 149, 77–83. 10.1016/j.cognition.2016.01.009 [DOI] [PubMed] [Google Scholar]
- Goeleven, E. , De Raedt, R. , Leyman, L. , & Verschuere, B. (2008). The Karolinska directed emotional faces: A validation study. Cognition and Emotion, 22(6), 1094–1118. 10.1080/02699930701626582 [DOI] [Google Scholar]
- Gomes, N. , Silva, S. , Silva, C. F. , & Soares, S. C. (2017). Beware the serpent: The advantage of ecologically‐relevant stimuli in accessing visual awareness. Evolution and Human Behavior, 38(2), 227–234. 10.1016/j.evolhumbehav.2016.10.004 [DOI] [Google Scholar]
- Goossens, L. , Kukolja, J. , Onur, O. A. , Fink, G. R. , Maier, W. , Griez, E. , Schruers, K. , & Hurlemann, R. (2009). Selective processing of social stimuli in the superficial amygdala. Human Brain Mapping, 30(10), 3332–3338. 10.1002/hbm.20755 [DOI] [PMC free article] [PubMed] [Google Scholar]
- Goulden, N. , Khusnulina, A. , Davis, N. J. , Bracewell, R. M. , Bokde, A. L. , McNulty, J. P. , & Mullins, P. G. (2014). The salience network is responsible for switching between the default mode network and the central executive network: Replication from DCM. NeuroImage, 99, 180–190. 10.1016/j.neuroimage.2014.05.052 [DOI] [PubMed] [Google Scholar]
- Heekeren, H. R. , Marrett, S. , Bandettini, P. A. , & Ungerleider, L. G. (2004). A general mechanism for perceptual decision‐making in the human brain. Nature, 431(7010), 859–862. 10.1038/nature02966 [DOI] [PubMed] [Google Scholar]
- Heekeren, H. R. , Marrett, S. , & Ungerleider, L. G. (2008). The neural systems that mediate human perceptual decision making. Nature Reviews Neuroscience, 9(6), 467–479. 10.1038/nrn2374 [DOI] [PubMed] [Google Scholar]
- Jacobs, R. H. , Barba, A. , Gowins, J. R. , Klumpp, H. , Jenkins, L. M. , Mickey, B. J. , Ajilore, O. , Peciña, M. , Sikora, M. , Ryan, K. A. , Hsu, D. T. , Welsh, R. C. , Zubieta, J. K. , Phan, K. L. , & Langenecker, S. A. (2016). Decoupling of the amygdala to other salience network regions in adolescent‐onset recurrent major depressive disorder. Psychological Medicine, 46(5), 1055–1067. 10.1017/S0033291715002615 [DOI] [PMC free article] [PubMed] [Google Scholar]
- Jiang, Y. , Costello, P. , & He, S. (2007). Processing of invisible stimuli: Advantage of upright faces and recognizable words in overcoming interocular suppression. Psychological Science, 18(4), 349–355. 10.1111/j.1467-9280.2007.01902.x [DOI] [PubMed] [Google Scholar]
- Jiang, Y. , & He, S. (2006). Cortical responses to invisible faces: Dissociating subsystems for facial‐information processing. Current Biology, 16(20), 2023–2029. 10.1016/j.cub.2006.08.084 [DOI] [PubMed] [Google Scholar]
- Jiang, Y. , Shannon, R. W. , Vizueta, N. , Bernat, E. M. , Patrick, C. J. , & He, S. (2009). Dynamics of processing invisible faces in the brain: Automatic neural encoding of facial expression information. NeuroImage, 44(3), 1171–1177. 10.1016/j.neuroimage.2008.09.038 [DOI] [PMC free article] [PubMed] [Google Scholar]
- Kesler‐West, M. L. , Andersen, A. H. , Smith, C. D. , Avison, M. J. , Davis, C. E. , Kryscio, R. J. , & Blonder, L. X. (2001). Neural substrates of facial emotion processing using fMRI. Cognitive Brain Research, 11(2), 213–226. 10.1016/S0926-6410(00)00073-2 [DOI] [PubMed] [Google Scholar]
- Knapen, T. , Brascamp, J. , Pearson, J. , van Ee, R. , & Blake, R. (2011). The role of frontal and parietal brain areas in bistable perception. Journal of Neuroscience, 31(28), 10293–10301. 10.1523/JNEUROSCI.1727-11.2011 [DOI] [PMC free article] [PubMed] [Google Scholar]
- Koller, K. , Rafal, R. D. , Platt, A. , & Mitchell, N. D. (2019). Orienting toward threat: Contributions of a subcortical pathway transmitting retinal afferents to the amygdala via the superior colliculus and pulvinar. Neuropsychologia, 128, 78–86. 10.1016/J.NEUROPSYCHOLOGIA.2018.01.027 [DOI] [PubMed] [Google Scholar]
- Ledoux, J . (1998). The emotional brain: The mysterious underpinnings of emotional life—Joseph Ledoux—Google Books. https://books.google.co.nz/books?hl=en&lr=&id=7EJN5I8sk2wC&oi=fnd&pg=PA9&dq=+The+emotional+brain:+The+mysterious+underpinnings+of+emotional+life&ots=087gfDwlSE&sig=h458BbqpI8S2ALjHvA38CJMPZMg#v=onepage&q
- Lerche, V. , Bucher, A. , & Voss, A. (2019). Processing emotional expressions under fear of rejection: Findings from diffusion model analyses. Emotion, 21(1), 184–210. 10.1037/emo0000691 [DOI] [PubMed] [Google Scholar]
- Lin, H. , Müller‐Bardorff, M. , Gathmann, B. , Brieke, J. , Mothes‐Lasch, M. , Bruchmann, M. , Miltner, W. H. R. , & Straube, T. (2020). Stimulus arousal drives amygdalar responses to emotional expressions across sensory modalities. Scientific Reports, 10(1), 1–12. 10.1038/s41598-020-58839-1 [DOI] [PMC free article] [PubMed] [Google Scholar]
- Lufityanto, G. , Donkin, C. , & Pearson, J. (2016). Measuring intuition: Nonconscious emotional information boosts decision accuracy and confidence. Psychological Science, 27(5), 622–634. 10.1177/0956797616629403 [DOI] [PubMed] [Google Scholar]
- Lumer, E. D. , Friston, K. J. , & Rees, G. (1998). Neural correlates of perceptual rivalry in the human brain. Science, 280(5371), 1930–1934. 10.1126/science.280.5371.1930 [DOI] [PubMed] [Google Scholar]
- Lumer, E. D. , & Rees, G. (1999). Covariation of activity in visual and prefrontal cortex associated with subjective visual perception. Proceedings of the National Academy of Sciences of the United States of America, 96(4), 1669–1673. 10.1073/pnas.96.4.1669 [DOI] [PMC free article] [PubMed] [Google Scholar]
- McFadyen, J. , Mattingley, J. B. , & Garrido, M. I. (2019). An afferent white matter pathway from the pulvinar to the amygdala facilitates fear recognition. eLife, 8, e40766. 10.7554/eLife.40766 [DOI] [PMC free article] [PubMed] [Google Scholar]
- McFadyen, J. , Mermillod, M. , Mattingley, J. B. , Halász, V. , & Garrido, M. I. (2017). A rapid subcortical amygdala route for faces irrespective of spatial frequency and emotion. Journal of Neuroscience, 37(14), 3864–3874. 10.1523/JNEUROSCI.3525-16.2017 [DOI] [PMC free article] [PubMed] [Google Scholar]
- McFadyen, J. , Smout, C. , Tsuchiya, N. , Mattingley, J. B. , & Garrido, M. I. (2019). Surprising threats accelerate evidence accumulation for conscious perception. BioRxiv Preprints. 10.1101/525519 [DOI] [Google Scholar]
- Melloni, L. , Schwiedrzik, C. M. , Müller, N. , Rodriguez, E. , & Singer, W. (2011). Expectations change the signatures and timing of electrophysiological correlates of perceptual awareness. Journal of Neuroscience, 31(4), 1386–1396. 10.1523/JNEUROSCI.4570-10.2011 [DOI] [PMC free article] [PubMed] [Google Scholar]
- Menon, V. , & Uddin, L. Q. (2010). Saliency, switching, attention and control: A network model of insula function. Brain Structure & Function, 31(4), 1386–1396. 10.1007/s00429-010-0262-0 [DOI] [PMC free article] [PubMed] [Google Scholar]
- Miles, W. R. (1930). Ocular dominance in human adults. The Journal of General Psychology, 3(3), 412–430. 10.1080/00221309.1930.9918218 [DOI] [Google Scholar]
- Olszanowski, M. , Pochwatko, G. , Kuklinski, K. , Scibor‐Rylski, M. , Lewinski, P. , & Ohme, R. K. (2014). Warsaw set of emotional facial expression pictures: A validation study of facial display photographs. Frontiers in Psychology, 5, 1516. 10.3389/fpsyg.2014.01516 [DOI] [PMC free article] [PubMed] [Google Scholar]
- Ottaviani, C. , Cevolani, D. , Nucifora, V. , Borlimi, R. , Agati, R. , Leonardi, M. , de Plato, G. , & Brighetti, G. (2012). Amygdala responses to masked and low spatial frequency fearful faces: A preliminary fMRI study in panic disorder. Psychiatry Research: Neuroimaging, 203(2–3), 159–165. 10.1016/j.pscychresns.2011.12.010 [DOI] [PubMed] [Google Scholar]
- Pasley, B. N. , Mayes, L. C. , & Schultz, R. T. (2004). Subcortical discrimination of unperceived objects during binocular rivalry. Neuron, 42(1), 163–172. 10.1016/S0896-6273(04)00155-2 [DOI] [PubMed] [Google Scholar]
- Pessoa, L. , & Adolphs, R. (2010). Emotion processing and the amygdala: From a ‘low road’ to ‘many roads’ of evaluating biological significance. Nature Reviews Neuroscience, 11(11), 773–782. 10.1038/nrn2920 [DOI] [PMC free article] [PubMed] [Google Scholar]
- Philiastides, M. G. , Auksztulewicz, R. , Heekeren, H. R. , & Blankenburg, F. (2011). Causal role of dorsolateral prefrontal cortex in human perceptual decision making. Current Biology, 21(11), 980–983. 10.1016/j.cub.2011.04.034 [DOI] [PubMed] [Google Scholar]
- Pinto, Y. , van Gaal, S. , de Lange, F. P. , Lamme, V. A. F. , & Seth, A. K. (2015). Expectations accelerate entry of visual stimuli into awareness. Journal of Vision, 15(8), 13. 10.1167/15.8.13 [DOI] [PubMed] [Google Scholar]
- Pleger, B. , Ruff, C. C. , Blankenburg, F. , Bestmann, S. , Wiech, K. , Stephan, K. E. , Capilla, A. , Friston, K. J. , & Dolan, R. J. (2006). Neural coding of tactile decisions in the human prefrontal cortex. Journal of Neuroscience, 26(48), 12596–12601. 10.1523/JNEUROSCI.4275-06.2006 [DOI] [PMC free article] [PubMed] [Google Scholar]
- Ploran, E. J. , Nelson, S. M. , Velanova, K. , Donaldson, D. I. , Petersen, S. E. , & Wheeler, M. E. (2007). Evidence accumulation and the moment of recognition: Dissociating perceptual recognition processes using fMRI. Journal of Neuroscience, 27(44), 11912–11924. 10.1523/JNEUROSCI.3522-07.2007 [DOI] [PMC free article] [PubMed] [Google Scholar]
- Prins, N. , & Kingdom, F. A. . (2009). Palamedes: Matlab routines for analyzing psychophysical data. www.palamedestoolbox.org
- Ratcliff, R. (1978). A theory of memory retrieval. Psychological Review, 85(2), 59–108. 10.1037/0033-295X.85.2.59 [DOI] [Google Scholar]
- Reinders, A. A. T. S. , Den Boer, J. A. , & Büchel, C. (2005). The robustness of perception. European Journal of Neuroscience, 22(2), 524–530. 10.1111/j.1460-9568.2005.04212.x [DOI] [PubMed] [Google Scholar]
- Reinders, A. A. T. S. , Gläscher, J. , de Jong, J. R. , Willemsen, A. T. M. , den Boer, J. A. , & Büchel, C. (2006). Detecting fearful and neutral faces: BOLD latency differences in amygdala‐hippocampal junction. NeuroImage, 33(2), 805–814. 10.1016/j.neuroimage.2006.06.052 [DOI] [PubMed] [Google Scholar]
- Rounis, E. , Maniscalco, B. , Rothwell, J. C. , Passingham, R. E. , & Lau, H. (2010). Theta‐burst transcranial magnetic stimulation to the prefrontal cortex impairs metacognitive visual awareness. Cognitive Neuroscience, 1(3), 165–175. 10.1080/17588921003632529 [DOI] [PubMed] [Google Scholar]
- Salomon, R. , Ronchi, R. , Dönz, J. , Bello‐Ruiz, J. , Herbelin, B. , Faivre, N. , Schaller, K. , & Blanke, O. (2018). Insula mediates heartbeat related effects on visual consciousness. Cortex, 101, 87–95. 10.1016/j.cortex.2018.01.005 [DOI] [PubMed] [Google Scholar]
- Salomon, R. , Ronchi, R. , Dönz, J. , Bello‐Ruiz, J. , Herbelin, B. , Martet, R. , Faivre, N. , Schaller, K. , & Blanke, O. (2016). The insula mediates access to awareness of visual stimuli presented synchronously to the heartbeat. Journal of Neuroscience, 36(18), 5115–5127. 10.1523/JNEUROSCI.4262-15.2016 [DOI] [PMC free article] [PubMed] [Google Scholar]
- Sander, D. , Grafman, J. , & Zalla, T. (2003). The human amygdala: An evolved system for relevance detection. Reviews in the Neurosciences, 14(4), 303–316. 10.1515/REVNEURO.2003.14.4.303 [DOI] [PubMed] [Google Scholar]
- Santos, A. , Mier, D. , Kirsch, P. , & Meyer‐Lindenberg, A. (2011). Evidence for a general face salience signal in human amygdala. NeuroImage, 54(4), 3111–3116. 10.1016/j.neuroimage.2010.11.024 [DOI] [PubMed] [Google Scholar]
- Sladky, R. , Geissberger, N. , Pfabigan, D. M. , Kraus, C. , Tik, M. , Woletz, M. , Paul, K. , Vanicek, T. , Auer, B. , Kranz, G. S. , Lamm, C. , Lanzenberger, R. , & Windischberger, C. (2018). Unsmoothed functional MRI of the human amygdala and bed nucleus of the stria terminalis during processing of emotional faces. NeuroImage, 168, 383–391. 10.1016/j.neuroimage.2016.12.024 [DOI] [PubMed] [Google Scholar]
- Stein, T. , Hebart, M. N. , & Sterzer, P. (2011). Breaking continuous flash suppression: A new measure of unconscious processing during interocular suppression? Frontiers in Human Neuroscience, 5, 167. 10.3389/fnhum.2011.00167 [DOI] [PMC free article] [PubMed] [Google Scholar]
- Stein, T. , Seymour, K. , Hebart, M. N. , & Sterzer, P. (2014). Rapid fear detection relies on high spatial frequencies. Psychological Science, 25(2), 566–574. 10.1177/0956797613512509 [DOI] [PubMed] [Google Scholar]
- Sterzer, P. , Haynes, J. D. , & Rees, G. (2008). Fine‐scale activity patterns in high‐level visual areas encode the category of invisible objects. Journal of Vision, 8(15), 10–1012. 10.1167/8.15.10 [DOI] [PubMed] [Google Scholar]
- Summerfield, C. , Egner, T. , Greene, M. , Koechlin, E. , Mangels, J. , & Hirsch, J. (2006). Predictive codes for forthcoming perception in the frontal cortex. Science, 314(5803), 1311–1314. 10.1126/science.1132028 [DOI] [PubMed] [Google Scholar]
- Tamietto, M. , & de Gelder, B. (2010). Neural bases of the non‐conscious perception of emotional signals. Nature Reviews. Neuroscience, 11(10), 697–709. 10.1038/NRN2889 [DOI] [PubMed] [Google Scholar]
- Terasawa, Y. , Fukushima, H. , & Umeda, S. (2013). How does interoceptive awareness interact with the subjective experience of emotion? An fMRI study. Human Brain Mapping. 34(3), 598–612. 10.1002/hbm.21458 [DOI] [PMC free article] [PubMed] [Google Scholar]
- Tipples, J. (2015). Rapid temporal accumulation in spider fear: Evidence from hierarchical drift diffusion modelling. Emotion, 15(6), 742–751. 10.1037/emo0000079 [DOI] [PubMed] [Google Scholar]
- Tottenham, N. , Tanaka, J. W. , Leon, A. C. , McCarry, T. , Nurse, M. , Hare, T. A. , Marcus, D. J. , Westerlund, A. , Casey, B. J. , & Nelson, C. (2009). The NimStim set of facial expressions: Judgments from untrained research participants. Psychiatry Research, 168(3), 242–249. 10.1016/j.psychres.2008.05.006 [DOI] [PMC free article] [PubMed] [Google Scholar]
- Troiani, V. , & Schultz, R. T. (2013). Amygdala, pulvinar, and inferior parietal cortex contribute to early processing of faces without awareness. Frontiers in Human Neuroscience, 168(3), 242–249. 10.3389/fnhum.2013.00241 [DOI] [PMC free article] [PubMed] [Google Scholar]
- Tsuchiya, N. , & Koch, C. (2005). Continuous flash suppression reduces negative afterimages. Nature Neuroscience, 8(8), 1096–1101. 10.1038/nn1500 [DOI] [PubMed] [Google Scholar]
- Uddin, L. Q. (2016). Salience network of the human brain. Academic Press. 10.1016/c2015-0-01862-7 [DOI] [Google Scholar]
- van der Schalk, J. , Hawk, S. T. , Fischer, A. H. , & Doosje, B. (2011). Moving faces, looking places: Validation of the Amsterdam dynamic facial expression set (ADFES). Emotion, 11(4), 907–920. 10.1037/a0023853 [DOI] [PubMed] [Google Scholar]
- Vizueta, N. , Patrick, C. J. , Jiang, Y. , Thomas, K. M. , & He, S. (2012). Dispositional fear, negative affectivity, and neuroimaging response to visually suppressed emotional faces. NeuroImage, 59(1), 761–771. 10.1016/j.neuroimage.2011.07.015 [DOI] [PMC free article] [PubMed] [Google Scholar]
- Voss, A. , & Voss, J. (2007). Fast‐dm: A free program for efficient diffusion model analysis. Behavior Research Methods, 39(4), 767–775. 10.3758/BF03192967 [DOI] [PubMed] [Google Scholar]
- Wang, C. , Kang‐Park, M. H. , Wilson, W. A. , & Moore, S. D. (2002). Properties of the pathways from the lateral amygdal nucleus to basolateral nucleus and amygdalostriatal transition area. Journal of Neurophysiology, 87(5), 2593–2601. 10.1152/jn.2002.87.5.2593 [DOI] [PubMed] [Google Scholar]
- Werner, N. S. , Schweitzer, N. , Meindl, T. , Duschek, S. , Kambeitz, J. , & Schandry, R. (2013). Interoceptive awareness moderates neural activity during decision‐making. Biological Psychology, 94, 498–506. 10.1016/j.biopsycho.2013.09.002 [DOI] [PubMed] [Google Scholar]
- Willenbockel, V. , Sadr, J. , Fiset, D. , Horne, G. , Gosselin, F. , & Tanaka, J. (2010). The SHINE toolbox for controlling low‐level image properties. Journal of Vision, 10(7), 653. 10.1167/10.7.653 [DOI] [PubMed] [Google Scholar]
- Williams, M. A. , Morris, A. P. , McGlone, F. , Abbott, D. F. , & Mattingley, J. B. (2004). Amygdala responses to fearful and happy facial expressions under conditions of binocular suppression. Journal of Neuroscience, 24(12), 2898–2904. 10.1523/JNEUROSCI.4977-03.2004 [DOI] [PMC free article] [PubMed] [Google Scholar]
- Yang, E. , Zald, D. H. , & Blake, R. (2007). Fearful expressions gain preferential access to awareness during continuous flash suppression. Emotion, 7(4), 882–886. 10.1037/1528-3542.7.4.882 [DOI] [PMC free article] [PubMed] [Google Scholar]
Associated Data
This section collects any data citations, data availability statements, or supplementary materials included in this article.
Supplementary Materials
Appendix S1 Supporting Information.
Data Availability Statement
Data and code may be made available upon request to the authors given ethics approval and a formal data sharing agreement.