

Abstract
Transcranial focused ultrasound (tFUS) neuromodulation provides a promising emerging non-invasive therapy for the treatment of neurological disorders. Many studies have demonstrated the ability of tFUS to elicit transient changes in neural responses. However, the ability of tFUS to induce sustained changes need to be carefully examined. In this study, we use the long-term potentiation / long term depression (LTP/LTD) model in the rat hippocampus, the medial perforant path (mPP) to dentate gyrus (DG) pathway, to explore whether tFUS is capable of encoding frequency specific information to induce plasticity. Single-element focused transducers were used for tFUS stimulation with ultrasound fundamental frequency of 0.5 MHz and nominal focal distance of 38 mm. tFUS stimulation is directed to mPP. Measurement of synaptic connectivity is achieved through the slope of field excitatory post synaptic potentials (fEPSPs), which are elicited using bipolar electrical stimulation electrodes and recorded at DG using extracellular electrodes to quantify degree of plasticity. We applied pulsed tFUS stimulation with total duration of 5 minutes, with 5 levels of pulse repetition frequencies each administered at 50 Hz sonication frequency at the mPP. Baseline fEPSP is recorded 10 minutes prior, and 30+ minutes after tFUS administration. In N = 16 adult wildtype rats, we observed sustained depression of fEPSP slope after 5 minutes of tFUS focused at the presynaptic field mPP. Across all PRFs, no significant difference in maximum fEPSP slope change was observed, average tFUS induced depression level was observed at 19.6%. When compared to low frequency electrical stimulation (LFS) of 1Hz delivered to the mPP, the sustained changes induced by tFUS stimulation show no statistical difference to LFS for up to 24 minutes after tFUS stimulation. When both the maximum depression effects and the duration of sustained effects are both taken into account, PRF 3 kHz can induce significantly larger effects than other PRFs tested. tFUS stimulation is measured with spatial-peak pressure amplitude of 99 kPa, with translates to an estimation of 0.43 °C temperature increase when assuming no loss of heat. The results suggest the ability of tFUS to encode sustained changes in synaptic connectivity through mechanism which are unlikely to involve thermal changes.
Keywords: Ultrasound neuromodulation, long term plasticity, hippocampus, field excitatory postsynaptic potential
Introduction
Low intensity ultrasound neuromodulation uses focused high frequency mechanical waves to non-invasively interface with the brain. This method of brain stimulation has the unique advantage of high spatial specificity and ability to target deep brain regions. Since a decade ago, many researchers have demonstrated the effectiveness of low-intensity transcranial focused ultrasound (tFUS) in the central nervous system of rodent models1–6, sheep models7, primate models8–10 and human subjects11–15. The capabilities of tFUS as a neuromodulation technique is coming into light, such as the ability to reliably induce time-locked neuronal activity in vitro16,17, and in rodents5,18, or the ability to safely modulate evoked potentials in humans11,13,14,19, etc. As the field advances towards a better understanding of the mechanisms of tFUS and its translatability to clinical utility5, a natural subsequent investigation is the ability of tFUS to effectively deliver sustained therapeutic effects. Sustained therapies are highly on interest due to the potential clinical impact of delivering lasting treatments to improve patients’ quality of life.
tFUS targeting the deep brain has been practiced20–22, and non-transient neuromodulatory effects have been observed in anesthetized rat3,5,23, monkey24 and swine models25. In particular, reversible suppression of the somatosensory evoked potentials were observed over 10 minutes after tFUS stimulation at the pig thalamus25, similar changes in somatosensory evoked potentials have also been observed in rats over 35 minutes23. Primary rat cortical neuron cultures have shown neuronal excitability changes in response to 40 seconds of 5 Hz pulsed ultrasound stimulation, suggesting the presence of plasticity-like mechanism26. In human subjects, 15 minutes of pulsed ultrasound stimulation with 5% duty cycle and 100Hz pulse repetition frequency (PRF) at the motor cortex significantly potentiates amplitude of motor evoked potentials, lasting longer than 30 minutes27. These are early evidences of ultrasound-induced neuroplasticity. Here we further explore the concept of tFUS induced plasticity in the well characterized system of hippocampal long-term potentiation (LTP) and depression (LTD) in anesthetized rats.
The hippocampal network is of particular interest in this study due to the well characterized circuit pathways and mechanisms. Both LTP and LTD have been widely studied in neuroscience as a mechanism of memory storage and emotion processing in the hippocampus28. Brief high frequency electrical stimulation trains applied at the Schaffer collaterals have shown to increase the excitatory postsynaptic potential (EPSP) slope amplitudes seen in the CA1 pyramidal cells29,30, as well as in the medial perforant path (mPP) to the dentate gyrus (DG) pathway31,32. When stimulated with high frequency electrical stimulation (HFS) at 50–100 Hz, LTP can be elicited30; conversely stimulated with low frequency electrical stimulation (LFS), at < 1Hz, LTD can be observed28. The frequency of electrical stimulation pulses results in increases below the action potential threshold in the postsynaptic potential, which in turn activates of N-Methyl-D-aspartate (NMDA) receptors and initiates a signaling cascade of transcriptions in the postsynaptic neuron33. Several trains of high frequency tetanus electrical stimulations applied at 50 to 100 Hz for 1 second can induce LTP by causing an increase in presynaptic potential strong enough to remove the Mg2+ blocker on the NMDA receptor, which then triggers the downstream signaling pathways involving Ca2+/calmodulin-dependent protein kinase II (CaMKII) and protein kinase C (PKC)34–40. Similarly, low frequency tetanus electrical stimulation is applied at 0.5–1 Hz for several minutes in order to induce LTD. Here, the low frequency stimulation only leads to a modest increase in presynaptic potential, which is not enough to activate NMDA receptors but leads to subthreshold increase in postsynaptic calcium concentration due to repetitive stimulation, which triggers LTD41. LTD is triggered by moderate increase in postsynaptic calcium signaling pathway, induced by LFS, activating a calcium dependent protein phosphatase cascade involving calcineurin and Protein phosphatase 1 (PP1)42–46.
The dependence of LTP and LTD on electrical tetanus stimulation frequency illustrates the immense ability of the brain to respond to frequency encoding via changes in synaptic connectivity. In this study, first presented in 201747, we use the well characterized mechanisms of LTP and LTD to explore the potential of tFUS to induce long-term changes in synaptic plasticity. We hypothesize that, similar to electrical stimulation, tFUS has the ability to increase the postsynaptic potential and induce sustained changes in neuronal connectivity when applied at a comparable frequency as tetanus electrical stimulation. Thus, we examine whether tFUS is able to induce sustained synaptic plasticity in the hippocampus using the field EPSP (fEPSP) as an indicator of synaptic connectivity strength, and whether the frequency of tFUS PRF has a significant effect on the degree of change in fEPSP slope.
Materials and Methods
Rat Subjects
Adult wild-type Wistar outbred male rats (Hsd:WI, Envigo, USA) were used as subjects, weight 300–500 g. All rat studies were approved by the Institutional Animal Care and Use Committees at the University of Minnesota and Carnegie Mellon University in accordance with US National Institutes of Health guidelines.
Ultrasound Stimulation
Single-element focused transducers were used for tFUS stimulation with ultrasound fundamental frequency 0.5 MHz, element diameter of 25.4 mm and nominal focal distance of 38 mm (V301-SU-F1.5INPTF Olympus Scientific Solutions Americas, Inc., USA). It is a focused ultrasound transducer with a concave surface. tFUS stimulation is delivered at the dentate gyrus through the rat skull. Transducer interfaces with the skull via a collimator filled with ultrasound coupling gel, with a tip diameter of 5 mm. Pulsed tFUS stimulation was delivered for 5 minutes at various PRFs. Stimulation parameters are shown in Fig. 1B. tFUS waveforms were generated with 3 single-channel waveform generators (33220 A/33612A, Keysight Technologies, Inc., USA) to control the PRF and pulsing duration of the transducer. Waveforms generated were amplified via a 50-watt wide-band radio-frequency (RF) power amplifier (BBS0D3FHM, Empower RF Systems, Inc., USA). Ultrasound stimulation parameters are delivered as pulses of pulse trains, i.e., pulsed ultrasound is applied at various PRFs with 50% duty cycle (DCPRF), then the groups of pulses are further encoded with a frequency modulation, which we term encoding frequency, of 50 Hz at 50% duty cycle (DCfreq encoding). The overall duty cycle of the stimulation, including DCPRF and DCfreq encoding, is 25%. The number of pulses pulsed at PRF within inter-sonication-interval is adjusted for each PRF to maintain a 50% DCPRF across subjects. For example, for PRF 3000 Hz, each pulse consists of 83 cycles of the 500 kHz fundamental frequency, with approximate pulse duration of 167μs at 50% DCPRF. Similarly, for PRF 4000Hz, 63 cycles of the 500 kHz fundamental frequency are delivered for each pulse. These groups of PRF pulses are delivered for a duration of 10 ms, with 10 ms rest at 50% DCfreq encoding for a total duration of 5 minutes. Hydrophone measured spatial-peak temporal-peak intensity (ISPTP) after transmission through skull is 846 mW/cm2 (spatial-peak pulse-average intensity ISPPA: 425 mW/cm2, spatial-peak temporal-average ISPTA: 255 mW/cm2 at PRF 3000 Hz.) with the spatial-peak pressure amplitude of 99 kPa. Ultrasound stimulation localization is guided through anatomical landmarks on the skull.
Figure 1. Experiment setup and tFUS waveform and spatial profiles.

A. Schematic experimental setup. tFUS is delivered with normal incidence to the skull. fEPSP stimulating electrode inserted at 40 degrees and recording electrode inserted at 50 degrees incidence angle.
B. tFUS stimulation waveform for long-term effect induction. Trains of pulsed tFUS at various PRFs (3 – 10 kHz) are delivered at 50 Hz (20 ms) intervals at 50% duty cycle to mimic the frequency of long-term potentiation (LTP) induction using electrical stimulation.
C-D. Ultrasound field mapping of one transverse (X-Y plane, in panel C) and one coronal (Y-Z plane, in panel D) scans of ultrasound pressure distribution during tFUS induction under the cranium using a hydrophone-based ultrasound field mapping system.
E-F. Ultrasound field mapping of ultrasound transducer without the presence of skull of one transverse (X-Y plane, in panel E) and one coronal (Y-Z plane, in panel F) plane using a hydrophone-based ultrasound field mapping system in water. Both panels use the same color bar shown in panel F. The ISPPA is 1.61 W/cm2, and the ISPTA is 975 mW/cm2 at a PRF of 3000 Hz.
Ultrasound Intensity Mapping
A 3D ex vivo pressure mapping system was used to characterize the tFUS temporal and spatial profiles. The system used a water submerged needle hydrophone (HNR500, Onda Corporation, Sunnyvale, CA USA) driven by a 3-axial positioning stage (XSlide, Velmex, Inc., Bloomfield, NY, USA). Freshly excised ex vivo rat skull samples were placed incident to the ultrasound transducer, above the hydrophone. Only the rat cranium skull is used during scanning, the base of the skull was not included. The scanning resolution was set at 0.25 mm laterally, 0.5 mm axially. Further details on the scanning system can be found in a prior publication5. A MATLAB-based toolbox, k-Wave49 was employed to implement the 3D computer simulations and estimate the ultrasound field distribution inside a full rat skull model. A similar protocol described by Mueller et al.50 was used in the simulation study. The acoustic properties throughout the rat skull were calculated from CT Hounsfield units51 using the assumed acoustic parameters5. The skull was deemed to be immersed in water for the simulations.
Eliciting and Recording of fEPSP
Rats were initially sedated with 4% isoflurane and medical grade O2 mixture, and maintained at 1.5–2% isoflurane during recordings or sedated with. Due to the increase pain level during surgery, local injections of bupivacaine (5 mg/ml) were applied at the scalp. Bipolar tungsten electrodes (TST33C40KT, World Precision Instruments, USA) were inserted at 40 degrees into the medial perforant path (mPP) in order to stimulate the presynaptic field, a 16 or 32 channel recording electrode (NeuroNexus, Ann Arbor, MI, USA) was inserted at 50 degrees angle at the dentate gyrus (depth 3 mm) to record the resultant field excitatory postsynaptic potentials (fEPSP). The target location of the perforant pathway is at AP: - 7mm, ML: 4.1 mm and DV: 2.5–3 mm. The location of the dentate gyrus is at AP: - 4.5mm, ML: 2.2 mm, and DV: 3–3.5 mm. All electrodes were inserted using a stereotaxic head stage with 10-micron precision manipulators (Model 963, David Kopf Instruments, Tujunga, CA, USA). fEPSP excitations were elicited with single square pulses with 200 μs to 1 ms pulse width and pulse amplitude of 0.7 to 1.7 V, delivered at 0.1 Hz (PowerLab 26T, ADInstruments, Colorado Springs, CO, USA). Subthreshold stimulation strengths were selected based on individual experiment setup and electrode location. The maximum energy delivered generating fEPSP without eliciting presynaptic action potentials was selected48. Electrical stimulation strengths were held consistent within subjects across all recording sessions. Extracellular raw neural recordings were comb filtered for 60 Hz powerline noise and bandpass filtered from 0.1 Hz to 3 kHz. The downward fEPSP slope was calculated after the electrical stimulation artifact, the slope of the fEPSP was determined based on a linear function fit of the linear portion of the downward waveform. Linear portions of the fEPSP slope are identified through finding the second derivative of fEPSP segments after stimulation artifacts, and verified through visual inspection for each subject. This time range differed from subject to subject. The same time range was use for all conditions within the same subject. For each animal, one to two sham conditions, and five to six tFUS conditions were applied. For statistical comparisons, PRF 10 kHz was used for sham conditions as the highest PRF tested. Five to six tFUS conditions were randomly selected for each animal. For each stimulation type (sham, tFUS or LFS), a pre-stimulation baseline is measured immediately before each stimulation. The number of sham conditions and tFUS conditions depended on animal conditions throughout surgery and recordings assessed through monitoring of vitals. In a subset of animals (n = 2), LFS was applied after all ultrasound conditions. The interval between each stimulation is 45 minutes to 1 hour.
Statistical Test and Definition of Significance
Statistical testing was performed in MATLAB (R2020b) and R (V3.2.1). Statistical significance was characterized by one-way ANOVA test with post hoc Tukey procedure. All bar graphs presented the results as mean ± standard deviation (std).
Results
Single transducer tFUS is able to target the rat hippocampus
In order to examine the sustained effects of tFUS in the deep brain, we developed an anesthetized head-fixed recording setup to allow single-element tFUS penetration to the hippocampal region (Fig. 1A). To target the deep brain, we designed a collimator to allow normal incidence of tFUS at the scalp. In ex vivo pressure scanning, we can observe that the spatial-peak ultrasound pressure field (Fig. 1C–D), with a local maximum ultrasound pressure at a depth of 3.5 mm in the hydrophone scanning (Fig. 1D). Computer simulations of the pressure field (Fig. S1) also demonstrate that ultrasound energy is able to penetrate deep and aim at the subcortical regions with the normal ultrasound incidence.
tFUS Induces Long Term Shifts in Synaptic Connectivity
To test whether tFUS can induce frequency encoded potentiation in the synapse, we applied tFUS stimulation at the presynaptic region mPP, in wild-type rats anesthetized with isoflurane (n = 7) and with ketamine/xylazine cocktail (n = 9). Five different tFUS PRFs were tested, each pulsed at 50 Hz encoding frequency at mPP (Fig. 1B) in order to induce the effects of high frequency electrical stimulation of LTP in the dentate gyrus. Experiment designs are illustrated in Fig. 2. Field response is assessed from the descending slope of the linear region of the field excitatory postsynaptic potential (fEPSP), shown in Fig. 3B, D. Based on previous results5, we set the PRF starting from 3 kHz for investigating the transcranial neural effects at the deep brain due to observed preferential activation of regular spiking neurons under high PRFs. Under both isoflurane (Fig. 4) and ketamine-xylazine anesthesia (Fig. S2), LTD was observed after tFUS stimulation was applied with PRF of 3–10 kHz.
Figure 2. Illustration of experiment design.

After surgical preparation, under 1.5–2.5% anesthesia, subjects receive 10 minutes of fEPSP recording as baseline measurements of synaptic connectivity. fEPSP are assessed at 0.1 Hz frequency with subthreshold electrical stimulation, with subject specific amplitude. Subsequently, 5 minutes of stimulation is applied, sham is always applied first, electrical stimulation if applied is always applied at the end of an experiment due to the potential confound of sustained long-term effects confounding other testing conditions. Immediately after stimulation, fEPSP is again measured with the same parameters as baseline fEPSP for 30–60 minutes.
Figure 3. Example fEPSP changes after tFUS and sham stimulation.

A. Sample traces of LTD induced by pulsed tFUS at PRF of 3kHz shown through normalized fEPSP. Baseline fEPSP slopes are shown in yellow, post tFUS fEPSP slopes are shown in red. The red block denotes the timing of administering tFUS for 5 minutes, applied from Time zero. Data shown in panels A and C as mean ± std. across 3-minute time windows.
B. Average fEPSP waveforms pre and post tFUS stimulation. The blue line represents the fEPSP before the stimulation, and the red line indicates the one after the stimulation. Markers show segments used to measure fEPSP slope.
C. The sham tFUS at 3 kHz PRF was delivered by applying ultrasound to a control location at the anterior contralateral cortex, which controls for vibrations of tFUS coupled across the skull without tFUS application at hippocampus. All other procedures held constant.
D. Average fEPSP waveforms pre and post sham tFUS stimulation at a control location in the anterior contralateral cortex. The blue line represents the fEPSP before the stimulation, and the red line indicates the one after the stimulation. Markers show segments used to measure fEPSP slope.
Figure 4. Comparison of initial fEPSP slope change after tFUS stimulation under isoflurane anesthesia.
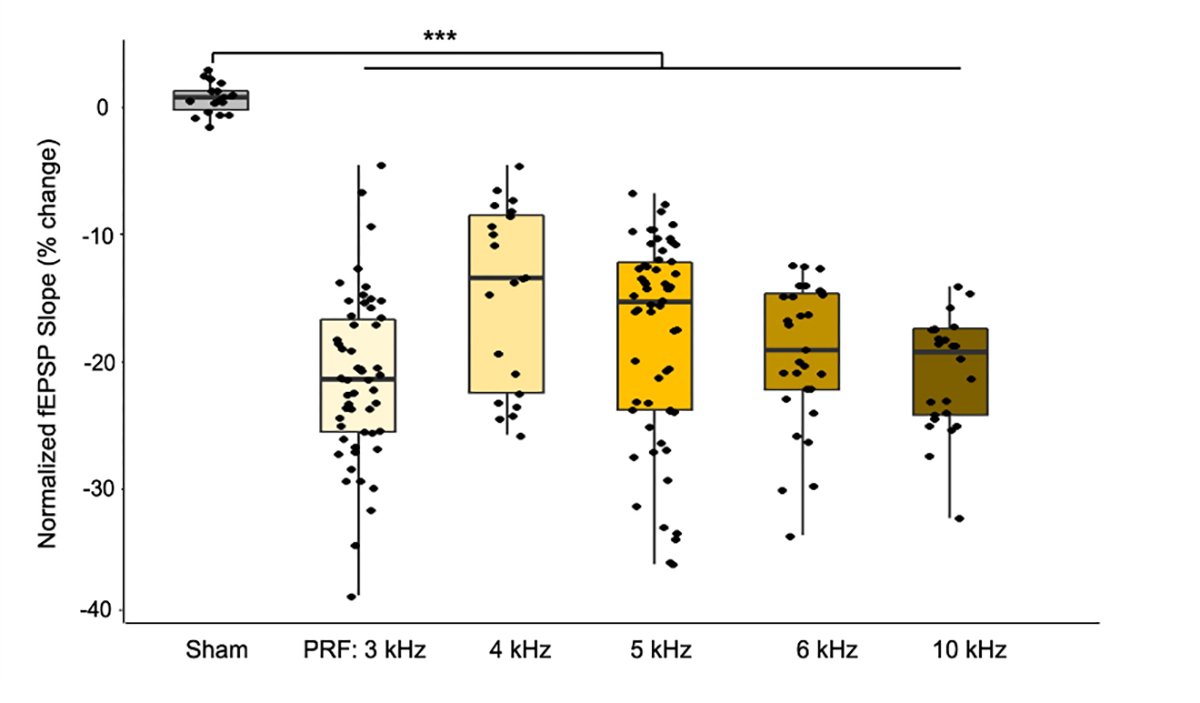
Normalized fEPSP slope changes are calculated based on the averaged fEPSP slope within a 5-minute interval immediately before and after tFUS stimulation. Data are shown in the boxplot as the median with 25% and 75% quantiles (lower and upper hinges). Each data point in box plot shows individual trial results from independent recording channels. Statistics by one-way ANOVA test with post-hoc Tukey’s Honestly Significant Difference Procedure. *p < 0.05.
LTD was observed to persist for 20 to 60 minutes after stimulation cessation (Fig. 3A). As seen in Fig. 3A, the fEPSP slope significantly decreases after tFUS stimulation and returns toward baseline over time. Sham experiments with tFUS delivered at the contralateral skull frontal region away from the hippocampus configuration, demonstrate that LTD does not occur when sham tFUS is applied (Fig. 3C–D). Averaged fEPSP traces in Fig. 3B and D show changes in fEPSP immediately pre- or post tFUS stimulation, averaged across 5 minutes immediately before and after tFUS stimulation. The slope of the descending segment of fEPSP after the electrical pulse artifact is used to calculate fEPSP slope.
Comparing tFUS stimulation to LFS
In n = 2 animals under isoflurane anesthesia, after tFUS experiments, LTD is elicited using LFS (1 Hz) electrical tetanus stimulation to validate the correct localization of neural pathway and compare strength of LFS to tFUS stimulation. As seen in Fig. 5, after 5 minutes of LFS and tFUS in the same rodent, fEPSP slopes become significantly different 24 minutes after stimulation, whereas LFS induces LTD, fEPSP slopes return to baseline 24 minutes after stimulation (p = 7.82×10⁻⁷).
Figure 5. Comparison of fEPSP slope change to LFS.
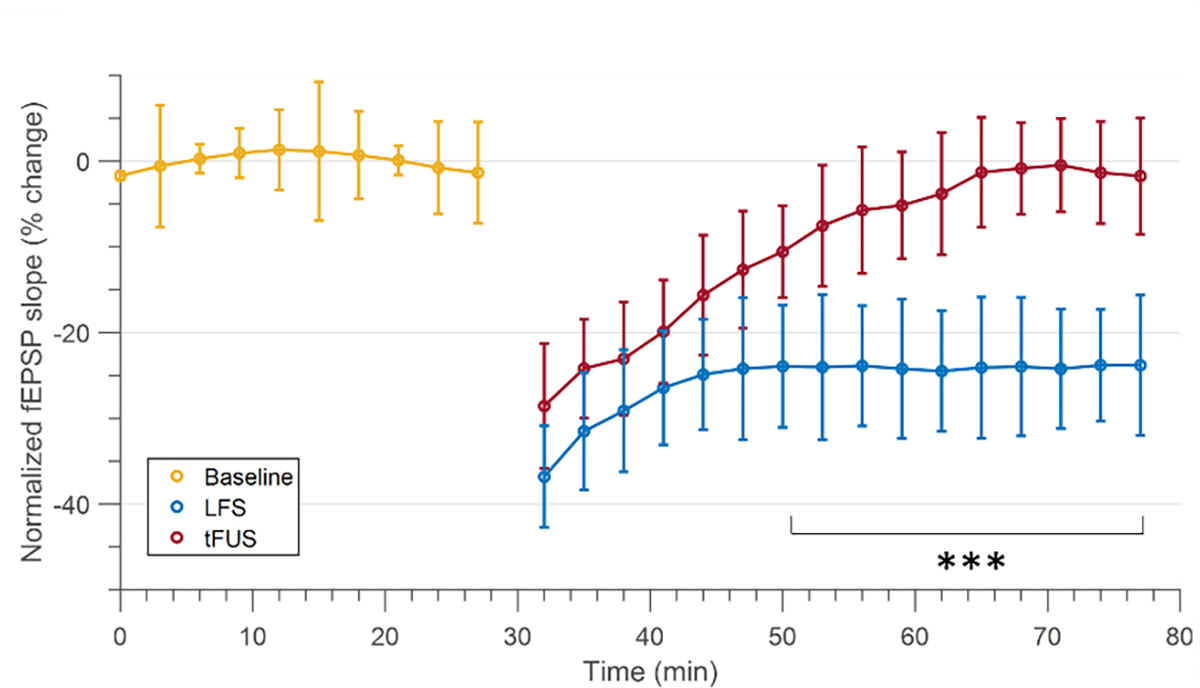
fEPSP slopes induced by 5 minutes of tFUS stimulation at 3kHz PRF (red), and LFS (blue) in the same subject. LFS stimulation is induced after tFUS stimulation due to the long duration of the modulation effects. Both tFUS and LFS fEPSP slopes are normalized to the baseline (yellow). Data shown as mean ± std. across 3-minute time windows.
Comparing Effect of tFUS PRF on LTD strength
In order to investigate whether tFUS PRF has an effect on strength of LTD induction, we examined a range of PRFs from 3 to 10 kHz. Shown in Fig. 4, all of the PRFs applied are significantly different when compared to sham stimulation, based on one-way ANOVA tests with a post hoc Tukey’s honestly significant difference test procedure to adjust for sample size difference. Although there were no statistically significant differences between the sample groups, overall, we observed shared LTD patterns (e.g., PRF 3 kHz vs. PRF 4 kHz in both Fig. 4 and Fig. S2) across the PRF conditions. This phenomenon suggests that, although tFUS PRF is not statistically correlated with the strength of LTD in the hippocampus, tFUS may be used to encode time dependent stimulation paradigms into neural networks and non-invasively elicit sustained changes in the strength of synaptic connections. Furthermore, when both the strength of LTD and duration of LTD is taken into account, termed “modulation effect size”, 4 kHz show significant lower effect than 3 kHz and 10 kHz (Fig. 6). Modulation effect size is calculated by the total area under the curve between the tFUS normalized fEPSP slope and the baseline level, normalized with a mean of 0.
Figure 6. Comparison modulation effect size of tFUS stimulation under isoflurane anesthesia.

Comparison of modulation effect sized based on tFUS PRF. Modulation effect size (arbitrary units) is characterized with the total areal under the curve of tFUS fEPSP slope changes shown in Figs. 3A and 3C. Data are shown in the boxplot as the median with 25% and 75% quantiles (lower and upper hinges). Each data point in box plot shows individual trial results from independent recording channels. Statistics by one-way ANOVA test with post hoc Tukey’s Honestly Significant Difference Procedure. *p < 0.05.
Discussion
Based on our hypothesis, we expected to observe LTP after tFUS stimulation since tFUS was applied at the same frequency as the high frequency tetanic stimulation used throughout LTP literature. The observed results did not show LTP, suggesting that the temporal encoding using tFUS does not share the same efficiency and/or mechanism as electrical tetanus stimulation. However, the demonstrated sustained effect is a promising new feature of tFUS stimulation to be employed as a potential non-invasive therapeutic neuromodulation technique.
Possible Mechanisms of Sustained Effects Observed in the Deep Brain
In this study, the lack of LTP induction can be due to a few factors. First, the mechanism of activation elicited by tFUS requires the delivery of repeated pulsed stimulation, which is more difficult to encode frequency dependent information in the presynaptic terminals. In contrast to electrical stimulation, where each electrical pulse applied at the presynaptic axon leads to a correlated increase in voltage, tFUS may need to be applied for multiple pulses in order to achieve the same effect. LTD effects observed in the hippocampus may be attributed to the ability of tFUS to modulate intracellular calcium concentrations, which is a direct modulator of synaptic plasticity. Recent works have shown evidences of tFUS to excite neurons through specific calcium-selective mechanosensitive ion channels, which leads to a gradual build-up of intracellular calcium52. We postulate that since PRFs studied in this experiment setup do not show large significant differences on LTD magnitude, future studies should alter the encoding frequency, which may exhibit larger effects on the magnitude, duration and direction of the synaptic connectivity modulation.
In this study, sham stimulation condition delivers tFUS at the contralateral frontal skull frontal region away from the hippocampus in order to control for auditory confounds caused by vibrations coupled across the skull. Due to the constrains of rat skull size, the sham location was placed at the frontal skull region, which is further away from the cochlea than the hippocampus. Therefore, if auditory confounding effects are significant factors leading to the plasticity effects observed, the sham stimulation location does not fully simulate the vibrations present in the cochlea during tFUS stimulation. However, studies in primary rat neuronal cultures26 have shown similar plasticity-like effects where auditory confounds are not relevant. Future work should direct sham stimulation at locations equidistant or closer in distance to the cochlea to better control for vibrations. Further, due to the high duty cycles applied during LTD induction, there may be local temperature rises in focal spots of the ultrasound field. This is of particular concern because thermal changes have been known to modulate neural excitability and neurons will experience damage at significant deviations from physiological temperature ranges. No change in neural response as a function of temperature is expected, given that the estimated rise in temperature due to a 5-min exposure period of pulsed ultrasound (temporal sequence and spatial distribution are shown in Fig. 1B) with a PRF of 3000 Hz, normal incidence and measured spatial-peak pressure amplitude of 99 kPa is only 0.43 °C when assuming no loss of heat. The temperature estimation methods can be found in our previously published work5. Considering the possible skull heating when the focused ultrasound is propagating through such a bone structure, an estimated temperature rise at the skull-brain interface would be 0.97 °C. In addition, given the micron scale size of the silicon-based electrode, 125 μm wide and 50 μm thick, which are more than 20 times smaller than the ultrasound wavelength, the brain-electrode interface is negligible for inducing significant temperature rise due to the ultrasound-driven vibrations. In fact, from multi-physics simulations, negligible deflection is induced at the electrode tip induced by ultrasound incidence5. Hematoxylin and eosin stains gathered immediately after stimulation in the hippocampus show no evidence of neuronal damage, local hemorrhage or inflammatory response at the stimulation site (see Fig. S3).
Moreover, due to the aperture of coupling collimator limiting the ultrasound to planar wave propagation which further weakens the axial focusing of single-element focused ultrasound transducers, we cannot achieve focal activation only in the deep brain regions. Currently we cannot assert that in activating the deep brain, no other brain regions in the path of the ultrasound beam are activated. This represents a limitation of the present study, and future experiments using array-based focused ultrasound will be required to achieve a ~1 mm scale target resolution at the hippocampus53.
Another limitation of the study is the use of anesthesia. In this study two groups of subjects were anesthetized using isoflurane or ketamine + xylazine cocktail. Although previous studies examining plasticity23–25 have also used anesthesia due to the constrains of experimental set up, anesthesia have been reported to affect LTP induction in parts of the hippocampus54,55. However, studies on the effect of anesthesia on behavioral changes, brain function and apoptosis show the presentation of these effects over days to weeks after anesthesia exposure56. Although the effect of anesthesia is undeniable, since the present study examines the effect of tFUS in acute anesthetized models under constant levels of anesthesia, we believe this study effectively demonstrates the effect of tFUS in the hippocampus. Future studies should be conducted in awake models to eliminate confounding effects of anesthesia.
Based on the temporal scales of the sustained effects observed, we do not conclude short term depression (STD) is present. The mechanism of STD is due to the depletion of neurotransmitters consumed during synaptic signaling, which exhibits a temporal filtering effect on neural information transmission57,58. Since the effects observed in this study averages to greater than 20 minutes, we therefore make the conclusion that STD via neurotransmitter depletion is not the mechanism observed.
Potential Clinical Implications
The ability to induce sustained synaptic depression may be used as a therapy for diseases involving hyperactivity or hypersynchrony of pathological neural tissues. In the case of Parkinson’s disease, pathological synchronization in the STN at the β frequency band, which can be disrupted by deep brain stimulation59, may presumably be altered through the application of noisy signals to perturb the local synchronized activity in the STN60,61. Based on our results, we speculate tFUS may be used to perturb the synchronization in deep brain regions with potential for sustained effects. Thus, tFUS may become a non-invasive tool that patients may use for an intermittent neuromodulatory therapy.
Conclusion
The findings in this study provide a critical first step towards understanding the mechanism of tFUS to induce sustained changes in synaptic connectivity in the hippocampus. The successful induction of sustained plasticity has the promise to advance tFUS towards the treatments of neurological disorders.
Supplementary Material
Acknowledgements
We thank Dr. Akira Sumiyoshi from Tohoku University for providing Wistar rat MRI atlas, John Basile for help setting up ex-vivo scanning and Daniel Suma and Abbas Sohrabpour for suggestions on experimental design.
Funding
This work was supported in part by NIH grants MH114233, EB029354, NS124564, AT009263, EB021027, NS096761, and NSF grant CBET-1450956. X.N. was supported in part by Liang Ji Dian Graduate Fellowship and Carnegie Mellon Neuroscience Institute Presidential Fellowship at Carnegie Mellon University.
Footnotes
Conflict of Interest
K.Y., X.N., and B.H. are co-inventors of a pending patent application with PCT (PCT/US2019/055955) on some techniques used in this investigation.
References
- 1.King RL, Brown JR, Newsome WT, Pauly KB. Effective parameters for ultrasound-induced in vivo neurostimulation. Ultrasound Med Biol. Published online 2013. doi: 10.1016/j.ultrasmedbio.2012.09.009 [DOI] [PubMed] [Google Scholar]
- 2.Han S, Kim M, Kim H, Shin H, Youn I. Ketamine Inhibits Ultrasound Stimulation-Induced Neuromodulation by Blocking Cortical Neuron Activity. Ultrasound Med Biol. 2018;44(3):635–646. doi: 10.1016/J.ULTRASMEDBIO.2017.11.008 [DOI] [PubMed] [Google Scholar]
- 3.Gulick DW, Li T, Kleim JA, Towe BC. Comparison of Electrical and Ultrasound Neurostimulation in Rat Motor Cortex. Ultrasound Med Biol. 2017;43(12):2824–2833. doi: 10.1016/J.ULTRASMEDBIO.2017.08.937 [DOI] [PubMed] [Google Scholar]
- 4.Younan Y, Deffieux T, Larrat B, Fink M, Tanter M, Aubry JF. Influence of the pressure field distribution in transcranial ultrasonic neurostimulation. Med Phys Published online 2013. doi: 10.1118/1.4812423 [DOI] [PubMed] [Google Scholar]
- 5.Yu K, Niu X, Krook-Magnuson E, He B. Intrinsic functional neuron-type selectivity of transcranial focused ultrasound neuromodulation. Nat Commun. 2021;12(1):2519. doi: 10.1038/s41467-021-22743-7 [DOI] [PMC free article] [PubMed] [Google Scholar]
- 6.Yu K, Sohrabpour A, He B. Electrophysiological Source Imaging of Brain Networks Perturbed by Low-Intensity Transcranial Focused Ultrasound. IEEE Trans Biomed Eng. Published online 2016. doi: 10.1109/TBME.2016.2591924 [DOI] [PMC free article] [PubMed] [Google Scholar]
- 7.Lee W, Lee SD, Park MY, et al. Image-Guided Focused Ultrasound-Mediated Regional Brain Stimulation in Sheep. Ultrasound Med Biol. Published online 2016. doi: 10.1016/j.ultrasmedbio.2015.10.001 [DOI] [PubMed] [Google Scholar]
- 8.Kubanek J, Brown J, Ye P, Butts Pauly K, Moore T, Newsome W. Remote, Brain Region-Specific Control of Choice Behavior with Ultrasonic Waves; 2020. Accessed August 4, 2020. http://advances.sciencemag.org/ [DOI] [PMC free article] [PubMed] [Google Scholar]
- 9.Wattiez N, Constans C, Deffieux T, et al. Transcranial ultrasonic stimulation modulates single-neuron discharge in macaques performing an antisaccade task. Brain Stimul. 2017;10(6):1024–1031. doi: 10.1016/J.BRS.2017.07.007 [DOI] [PubMed] [Google Scholar]
- 10.Deffieux T, Younan Y, Wattiez N, Tanter M, Pouget P, Aubry JF. Low-Intensity Focused Ultrasound Modulates Monkey Visuomotor Behavior. Curr Biol. 2013;23(23):2430–2433. doi: 10.1016/J.CUB.2013.10.029 [DOI] [PubMed] [Google Scholar]
- 11.Legon W, Sato TF, Opitz A, et al. Transcranial focused ultrasound modulates the activity of primary somatosensory cortex in humans. Nat Neurosci Published online 2014. doi: 10.1038/nn.3620 [DOI] [PubMed] [Google Scholar]
- 12.Legon W, Ai L, Bansal P, Mueller J. Neuromodulation with single-element transcranial focused ultrasound in human thalamus. Hum Brain Mapp. 2018;39(5):1995–2006. doi: 10.1002/HBM.23981 [DOI] [PMC free article] [PubMed] [Google Scholar]
- 13.Legon W, Bansal P, Tyshynsky R, Ai L, Mueller JK. Transcranial focused ultrasound neuromodulation of the human primary motor cortex. Sci Reports 2018 81. 2018;8(1):1–14. doi: 10.1038/s41598-018-28320-1 [DOI] [PMC free article] [PubMed] [Google Scholar]
- 14.Liu C, Yu K, Niu X, He B. Transcranial Focused Ultrasound Enhances Sensory Discrimination Capability through Somatosensory Cortical Excitation. Ultrasound Med Biol. 2021;47(5):1356–1366. doi: 10.1016/J.ULTRASMEDBIO.2021.01.025 [DOI] [PMC free article] [PubMed] [Google Scholar]
- 15.Yu K, C, Liu C, Niu X, He B. Transcranial Focused Ultrasound Neuromodulation of Voluntary Movement-Related Cortical Activity in Humans. IEEE Trans Biomed Eng. 2021;68(6):1923–1931. doi: 10.1109/TBME.2020.3030892 [DOI] [PMC free article] [PubMed] [Google Scholar]
- 16.Tyler WJ, Tufail Y, Finsterwald M, Tauchmann ML, Olson EJ, Majestic C. Remote Excitation of Neuronal Circuits Using Low-Intensity, Low-Frequency Ultrasound. PLoS One. 2008;3(10):e3511. doi: 10.1371/journal.pone.0003511 [DOI] [PMC free article] [PubMed] [Google Scholar]
- 17.Kim H, Swanberg K, Han H, et al. Prolonged stimulation with low-intensity ultrasound induces delayed increases in spontaneous hippocampal culture spiking activity. J Neurosci Res. 2017;95(3):885–896. doi: 10.1002/JNR.23845 [DOI] [PubMed] [Google Scholar]
- 18.Tufail Y, Matyushov A, Baldwin N, et al. Transcranial Pulsed Ultrasound Stimulates Intact Brain Circuits. Neuron. 2010;66(5):681–694. doi: 10.1016/j.neuron.2010.05.008 [DOI] [PubMed] [Google Scholar]
- 19.Lee W, Chung Y, Jung Y, Song I, Yoo S. Simultaneous acoustic stimulation of human primary and secondary somatosensory cortices using transcranial focused ultrasound. BMC Neurosci. 2016;17(1). doi: 10.1186/S12868-016-0303-6 [DOI] [PMC free article] [PubMed] [Google Scholar]
- 20.Yang PS, Kim H, Lee W, Bohlke M, Park S, Maher TJYS. Transcranial focused ultrasound to the thalamus is associated with reduced extracellular GABA levels in rats. Neuropsychobiology. 2012;65(3):153–160. doi: 10.1159/000336001 [DOI] [PubMed] [Google Scholar]
- 21.Mehić E, Xu JM, Caler CJ, Coulson NK, Moritz CTMP. Increased anatomical specificity of neuromodulation via modulated focused ultrasound. PLoS One. Published online 2014. doi: 10.1371/journal.pone.0086939 [DOI] [PMC free article] [PubMed] [Google Scholar]
- 22.Koroleva VI, Vykhodtseva NI, Elagin VA. Cortical and subcortical spreading depression in rats produced by focused ultrasound. Neurophysiol 1986 181. 1986;18(1):43–48. doi: 10.1007/BF01052490 [DOI] [PubMed] [Google Scholar]
- 23.Yoo SS, Yoon K, Croce P, Cammalleri A, Margolin RWLW. Focused ultrasound brain stimulation to anesthetized rats induces long-term changes in somatosensory evoked potentials. Int J Imaging Syst Technol. 2018;28(2):106–112. doi: 10.1002/ima.22262 [DOI] [PMC free article] [PubMed] [Google Scholar]
- 24.Verhagen L, Gallea C, Folloni D, et al. Offline impact of transcranial focused ultrasound on cortical activation in primates. Elife. 2019;8:e40541. doi: 10.7554/eLife.40541 [DOI] [PMC free article] [PubMed] [Google Scholar]
- 25.Dallapiazza RF, Timbie KF, Holmberg S, Gatesman J, Lopes MB, Price RJ, Miller GW EW, Dallapiazza RF, Timbie KF, et al. Noninvasive neuromodulation and thalamic mapping with low-intensity focused ultrasound. J Neurosurg. 2018;128(3):875–884. doi: 10.3171/2016.11.jns16976 [DOI] [PMC free article] [PubMed] [Google Scholar]
- 26.Clennell B, Steward TGJ, Elley M, et al. Transient ultrasound stimulation has lasting effects on neuronal excitability. Brain Stimul. 2021;14(2):217–225. doi: 10.1016/J.BRS.2021.01.003 [DOI] [PMC free article] [PubMed] [Google Scholar]
- 27.Zhang Y, Ren L, Liu K, Tong S, Yuan TF, Sun J. Transcranial ultrasound stimulation of the human motor cortex. iScience. 2021;24(12). doi: 10.1016/J.ISCI.2021.103429 [DOI] [PMC free article] [PubMed] [Google Scholar]
- 28.Dunwiddie T, Lynch G. Long-term potentiation and depression of synaptic responses in the rat hippocampus: localization and frequency dependency. J Physiol. 1978;276(1):353–367. doi: 10.1113/JPHYSIOL.1978.SP012239 [DOI] [PMC free article] [PubMed] [Google Scholar]
- 29.Bashir ZI, Collingridge GL. An investigation of depotentiation of long-term potentiation in the CA1 region of the hippocampus. Exp Brain Res 1994 792. 1994;79(2):437–443. doi: 10.1007/BF00229183 [DOI] [PubMed] [Google Scholar]
- 30.Dudek S, Bear M. Homosynaptic long-term depression in area CA1 of hippocampus and effects of N-methyl-D-aspartate receptor blockade. Proc Natl Acad Sci U S A. 1992;89(10):4363–4367. doi: 10.1073/PNAS.89.10.4363 [DOI] [PMC free article] [PubMed] [Google Scholar]
- 31.Gonzalez J, Morales IS, Villarreal DM, Derrick BE. Low-frequency stimulation induces long-term depression and slow onset long-term potentiation at perforant path-dentate gyrus synapses in vivo. 10.1152/jn009412012. 2014;111(6):1259–1273. doi: [DOI] [PMC free article] [PubMed] [Google Scholar]
- 32.Doyère V, Srebro B, Laroche S. Heterosynaptic LTD and Depotentiation in the Medial Perforant Path of the Dentate Gyrus in the Freely Moving Rat. J Neurophysiol. 1997;77(2):571–578. doi: 10.1152/JN.1997.77.2.571 [DOI] [PubMed] [Google Scholar]
- 33.Lüscher C, Malenka RC. NMDA receptor-dependent long-term potentiation and long-term depression (LTP/LTD). Cold Spring Harb Perspect Biol. Published online 2012. doi: 10.1101/cshperspect.a005710 [DOI] [PMC free article] [PubMed] [Google Scholar]
- 34.Malenka R. Postsynaptic factors control the duration of synaptic enhancement in area CA1 of the hippocampus. Neuron. 1991;6(1):53–60. doi: 10.1016/0896-6273(91)90121-F [DOI] [PubMed] [Google Scholar]
- 35.Malenka RC, Nicoll RA. NMDA-receptor-dependent synaptic plasticity: multiple forms and mechanisms. Trends Neurosci. 1993;16(12):521–527. doi: 10.1016/0166-2236(93)90197-T [DOI] [PubMed] [Google Scholar]
- 36.Sanes J, Lichtman J. Can molecules explain long-term potentiation? Nat Neurosci. 1999;2(7):597–604. doi: 10.1038/10154 [DOI] [PubMed] [Google Scholar]
- 37.Barria A, Muller D, Derkach V, Griffith LC ST. Regulatory phosphorylation of AMPA-type glutamate receptors by CaM-KII during long-term potentiation. Science. 1997;276(5321):2042–2045. doi: 10.1126/SCIENCE.276.5321.2042 [DOI] [PubMed] [Google Scholar]
- 38.Fukunaga K, Muller D, E. M. Increased phosphorylation of Ca2+/calmodulin-dependent protein kinase II and its endogenous substrates in the induction of long-term potentiation. J Biol Chem. 1995;270(11):6119–6124. doi: 10.1074/JBC.270.11.6119 [DOI] [PubMed] [Google Scholar]
- 39.Hrabetova S, Sacktor T. Bidirectional regulation of protein kinase M zeta in the maintenance of long-term potentiation and long-term depression. J Neurosci. 1996;16(17):5324–5333. doi: 10.1523/JNEUROSCI.16-17-05324.1996 [DOI] [PMC free article] [PubMed] [Google Scholar]
- 40.Ling DS, Benardo LS, Serrano PA, Blace N, Kelly MT, Crary JFST. Protein kinase Mzeta is necessary and sufficient for LTP maintenance. Nat Neurosci. 2002;5(4):295–296. doi: 10.1038/NN829 [DOI] [PubMed] [Google Scholar]
- 41.Sabatini BL, Oertner TG, Svoboda K. The life cycle of Ca2+ ions in dendritic spines. Neuron. Published online 2002. doi: 10.1016/S0896-6273(02)00573-1 [DOI] [PubMed] [Google Scholar]
- 42.Lisman J. A mechanism for the Hebb and the anti-Hebb processes underlying learning and memory. Proc Natl Acad Sci U S A. 1989;86(23):9574–9578. doi: 10.1073/PNAS.86.23.9574 [DOI] [PMC free article] [PubMed] [Google Scholar]
- 43.Kirkwood A, Bear M. Homosynaptic long-term depression in the visual cortex. J Neurosci. 1994;14(5 Pt 2):3404–3412. doi: 10.1523/JNEUROSCI.14-05-03404.1994 [DOI] [PMC free article] [PubMed] [Google Scholar]
- 44.Morishita W, Connor JH, Xia H, Quinlan EM, Shenolikar SMR. Regulation of synaptic strength by protein phosphatase 1. Neuron. 2001;32(6):1133–1148. doi: 10.1016/S0896-6273(01)00554-2 [DOI] [PubMed] [Google Scholar]
- 45.RM M, CE H, RC M. An essential role for protein phosphatases in hippocampal long-term depression. Science. 1993;261(5124):1051–1055. doi: 10.1126/SCIENCE.8394601 [DOI] [PubMed] [Google Scholar]
- 46.Mulkey RM, Endo S, Shenolikar S MR. Involvement of a calcineurin/inhibitor-1 phosphatase cascade in hippocampal long-term depression. Nature. 1994;369(6480):486–488. doi: 10.1038/369486A0 [DOI] [PubMed] [Google Scholar]
- 47.Niu X, Yu K, Basile J, He B. Induction of long-term depression using transcranial focused ultrasound in rat hippocampus. Soc Neurosci. 2017;(Program No. 808.09). [Google Scholar]
- 48.O’Boyle MP, Do V, Derrick BE, Claiborne BJ. In Vivo Recordings of Long-Term Potentiation and Long-Term Depression in the Dentate Gyrus of the Neonatal Rat. J Neurophysiol. 2004;91(2):613–622. doi: 10.1152/JN.00307.2003 [DOI] [PubMed] [Google Scholar]
- 49.Treeby BE, Cox BT. k-Wave: MATLAB toolbox for the simulation and reconstruction of photoacoustic wave fields. J Biomed Opt. Published online 2010. doi: 10.1117/1.3360308 [DOI] [PubMed] [Google Scholar]
- 50.Mueller JK, Ai L, Bansal P, Legon W. Numerical evaluation of the skull for human neuromodulation with transcranial focused ultrasound. J Neural Eng. 2017;14(6):66012. doi: 10.1088/1741-2552/aa843e [DOI] [PubMed] [Google Scholar]
- 51.Aubry J-F, Tanter M, Pernot M, Thomas J-L, Fink M. Experimental demonstration of noninvasive transskull adaptive focusing based on prior computed tomography scans. J Acoust Soc Am. 2003;113(1):84–93. doi: 10.1121/1.1529663 [DOI] [PubMed] [Google Scholar]
- 52.Yoo S, Mittelstein DR, Hurt R, Lacroix J, Shapiro MG. Focused ultrasound excites neurons via mechanosensitive calcium accumulation and ion channel amplification. bioRxiv Published online January 1, 2020:2020.05.19.101196. doi: 10.1101/2020.05.19.101196 [DOI] [PMC free article] [PubMed] [Google Scholar]
- 53.Ballard JR, Casper AJ, Wan Y, Ebbini ES. Adaptive transthoracic refocusing of dual-mode ultrasound arrays. IEEE Trans Biomed Eng. Published online 2010. doi: 10.1109/TBME.2009.2028150 [DOI] [PMC free article] [PubMed] [Google Scholar]
- 54.Ribeiro PO, Tomé ÂR, Silva HB, Cunha RA, Antunes LM. Clinically relevant concentrations of ketamine mainly affect long-term potentiation rather than basal excitatory synaptic transmission and do not change paired-pulse facilitation in mouse hippocampal slices. Brain Res. 2014;1560:10–17. doi: 10.1016/J.BRAINRES.2014.03.004 [DOI] [PubMed] [Google Scholar]
- 55.Zhu C, Gao J, Karlsson N, et al. Isoflurane anesthesia induced persistent, progressive memory impairment, caused a loss of neural stem cells, and reduced neurogenesis in young, but not adult, rodents. J Cereb Blood Flow Metab. 2010;30(5):1017–1030. doi: 10.1038/jcbfm.2009.274 [DOI] [PMC free article] [PubMed] [Google Scholar]
- 56.Colon E, Bittner EA, Kussman B, McCann ME, Soriano S, Borsook D. Anesthesia, brain changes, and behavior: Insights from neural systems biology. Prog Neurobiol. 2017;153:121–160. doi: 10.1016/J.PNEUROBIO.2017.01.005 [DOI] [PubMed] [Google Scholar]
- 57.Zucker RS, Regehr WG. Short-Term Synaptic Plasticity. Annu Rev Physiol. 2003;64:355–405. doi: 10.1146/ANNUREV.PHYSIOL.64.092501.114547 [DOI] [PubMed] [Google Scholar]
- 58.Rosenbaum R, Rubin J, Doiron B. Short Term Synaptic Depression Imposes a Frequency Dependent Filter on Synaptic Information Transfer. PLOS Comput Biol. 2012;8(6):e1002557. doi: 10.1371/JOURNAL.PCBI.1002557 [DOI] [PMC free article] [PubMed] [Google Scholar]
- 59.Eusebio A, Thevathasan W, Doyle Gaynor L, Pogosyan A, Bye E, Foltynie T, Zrinzo L, Ashkan K, Aziz TBP. Deep brain stimulation can suppress pathological synchronisation in parkinsonian patients. J Neurol Neurosurg Psychiatry. 2011;82(5):569–573. doi: 10.1136/JNNP.2010.217489 [DOI] [PMC free article] [PubMed] [Google Scholar]
- 60.Gatev P, Darbin O, Wichmann T. Oscillations in the basal ganglia under normal conditions and in movement disorders. Mov Disord. 2006;21(10):1566–1577. doi: 10.1002/MDS.21033 [DOI] [PubMed] [Google Scholar]
- 61.Hammond C, Bergman H, Brown P. Pathological synchronization in Parkinson’s disease: networks, models and treatments. Trends Neurosci. 2007;30(7):357–364. doi: 10.1016/J.TINS.2007.05.004 [DOI] [PubMed] [Google Scholar]
Associated Data
This section collects any data citations, data availability statements, or supplementary materials included in this article.