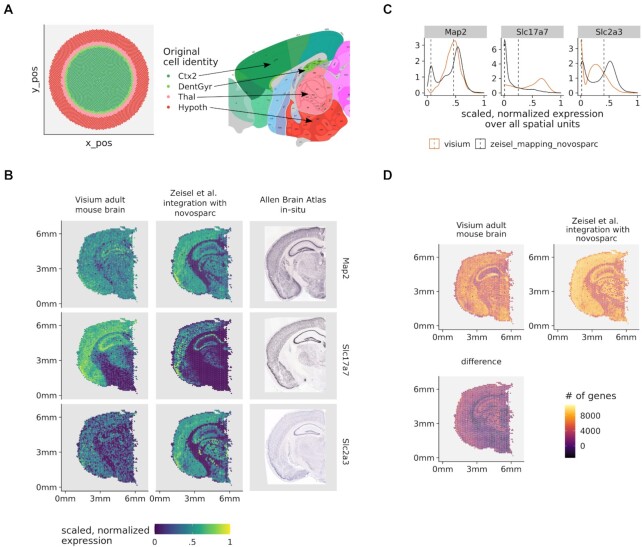
Figure 5:
Spacemake can integrate scRNA-seq and spatial transcriptomics data sets. (A) Spatially mapping an adult mouse brain scRNA-seq data set with 30,000 cells onto an in silico created circular puck with 5,000 locations reveals cortical layers (left). Tissue labels used: Thal, CA1, Hypoth, Ctx2, DentGyr, SScortex. The identified clusters correspond to spatially distinct anatomical regions (right, adapted from Allen Reference Atlas—http://atlas.brain-map.org). (B) Expression of neuronal markers (Map2,Slc2a3,Slc17a7) in the original Visium data (right column), after novoSpaRc integration (middle column) and in in-situ images from the Allen Brain Atlas (left column). (C) The bimodal distributions of gene expression are shown together with the corresponding mean values. To arrive at the results of panel (D), the expression of each gene was modeled with a Gaussian mixture model with 2 components. For each spatial unit, only genes whose expression was in the upper mode were counted. (D) Integrating the single-cell and spatial transcriptomics data sets increases the number of genes quantified per spatial unit.

