

ABSTRACT
Staphylococcus aureus is a medically important pathogen with high metabolic versatility allowing it to infect various niches within a host. S. aureus utilizes two major transcriptional regulators, namely, CodY and CcpA, to remodel metabolic and virulence gene expression in response to changing environmental conditions. Previous studies revealed that inactivation of either codY or ccpA has a pronounced impact on different aspects of staphylococcal physiology and pathogenesis. To determine the contribution and interplay of these two regulators in modulating central metabolism, virulence, and biofilm development, we constructed and characterized the codY ccpA double mutant in S. aureus UAMS-1. In line with previous studies, we found that CcpA and CodY control the cellular metabolic status by altering carbon flux through the central and overflow metabolic pathways. Our results demonstrate that ccpA inactivation impairs biofilm formation and decreases incorporation of extracellular DNA (eDNA) into the biofilm matrix, whereas disrupting codY resulted in a robust structured biofilm tethered together with eDNA and polysaccharide intercellular adhesin (PIA). Interestingly, inactivation of both codY and ccpA decreases biofilm biomass and reduces eDNA release in the double mutant. Compared with the inactivation of codY, the codY ccpA mutant did not overexpress toxins but maintained overexpression of amino acid metabolism pathways. Furthermore, the codY ccpA mutant produced large amounts of PIA, in contrast to the wild-type strain and ccpA mutant. Combined, the results of this study suggest that the coordinated action of CodY and CcpA modulate central metabolism, virulence gene expression, and biofilm-associated genes to optimize growth on preferred carbon sources until starvation sets in.
IMPORTANCE Staphylococcus aureus is a leading cause of biofilm-associated infections, including infective endocarditis, worldwide. A greater understanding of metabolic forces driving biofilm formation in S. aureus is essential for the identification of novel therapeutic targets and for the development of new strategies to combat this medically important pathogen. This study characterizes the interplay and regulation of central metabolism and biofilm development by two global transcriptional regulators, CodY and CcpA. We found that the lack of CcpA and/or CodY have different impacts on intracellular metabolic status leading to a formation of morphologically altered biofilms. Overall, the results of this study provide new insights into our understanding of metabolism-mediated regulation of biofilm development in S. aureus.
KEYWORDS: metabolism, transcriptional regulation, biofilm development, virulence, Staphylococcus aureus
INTRODUCTION
Staphylococcus aureus is an opportunistic human pathogen responsible for a variety of hospital- and community-associated infections that range from relatively minor skin and soft tissue infections to severe life-threatening systemic diseases, such as sepsis, endocarditis, and bacteremia (1, 2). S. aureus is resistant to several antibiotics and was listed in the high priority category of the WHO global priority pathogen list (3). The adaptability of S. aureus to diverse environments can be attributed to the metabolic versatility of the organism and its ability to overhaul the regulatory networks governing metabolism and virulence (4, 5). It has been shown that S. aureus controls the production of virulence factors, biofilm development, and expression of numerous metabolic genes through the use of two global transcriptional regulators, CodY and CcpA, that sense and respond to changing environmental cues (6–11).
CodY is a global transcriptional regulator in Gram-positive bacteria that directly or indirectly controls the expression of over 200 genes (12). CodY activity is regulated by intracellular levels of branched-chain amino acids (BCAAs) and GTP, tying its activity to nutrient availability. As nutrients become limited and levels of BCAAs and GTP decrease, CodY loses affinity to its targets, which are typically under repression by CodY (13). Genes regulated by CodY have various affinities of their promoters to CodY and are grouped by their functions (12). Promoters with a higher affinity to CodY will continue to be repressed under conditions with slight nutrient limitation, and as conditions become more nutrient depleted, there is a stepwise derepression of CodY target genes (12). For example, genes encoding nutrient transporters are derepressed first, followed by biosynthetic pathways and finally virulence factors used to damage tissues and scavenge limited resources (11). This stepwise regulation allows S. aureus to adjust its metabolism to changing environmental conditions and enhances its survival in ecological niches with limited nutrient supply (12).
Carbon catabolite protein A (CcpA) is another global transcriptional regulator in Gram-positive bacteria that is responsible for carbon catabolite repression (CCR) and carbon catabolite activation (14, 15). CcpA regulation can be glucose dependent or independent, but the majority of CcpA-regulated genes are subject to glucose-mediated control by this transcriptional regulator (6). CcpA can form complexes with several partners, including HPr and CodY (16). In Gram-positive bacteria, the HPr protein can be phosphorylated at two distinct sites, His-15 and Ser-46 (17). His-15-phosphorylated HPr is a part of the sugar phosphotransferase system (PTS) phosphorylation cascade involved in sugar transport, whereas Ser-46 phosphorylated HPr is involved in CCR (15, 17). During growth in the presence of preferred carbon sources, such as glucose, HPr is phosphorylated at the Ser-46 residue by its cognate HPr kinase, which is activated by elevated levels of glycolytic intermediates, i.e., fructose-1,6-bisphosphate and glucose-6-phosphate (15, 17, 18). Ser-46 phosphorylated HPr can form a complex with CcpA, which has an increased affinity for catabolite responsive element (cre) sites in the promoter regions of target genes (14, 19). CcpA represses the transcription of genes within the tricarboxylic acid (TCA) cycle and secondary carbon source catabolism, such as amino acids, while activating the expression of genes encoding components of the glycolytic and fermentative pathways (9).
Interestingly, the metabolic gene targets of CodY and CcpA meet at key nodes of central metabolism, such as glycolysis, the TCA cycle, and amino acid biosynthetic pathways (6, 14, 20). Together, these two regulators sense the nutritional environment and govern carbon and nitrogen flux by controlling catabolic and anabolic pathways involved in sugar and amino acid utilization. Previous studies have implicated the importance of these metabolic regulators during biofilm formation (7, 8, 21–24). It has been shown that the inactivation of ccpA results in a loss of biofilm biomass but retains the ability of S. aureus to adhere to a surface (7, 8). However, the inactivation of codY in S. aureus can either increase or decrease biofilm biomass in a strain-dependent manner (21, 22, 25). Atwood et al. attributed it to the strain-specific ability to produce polysaccharide intercellular adhesin (PIA; poly-N-acetylglucosamine [PNAG]), which is correlated with methicillin resistance (24). Inactivation of codY appears to decrease biofilm biomass in methicillin-resistant strains, which typically produce small amounts of PIA but have an increased expression of various proteases (25) that promote biofilm dispersal (26). In contrast, codY mutation in methicillin-sensitive strains significantly increases PIA production leading to the formation of protease-tolerant robust biofilms with very “stringy” structures, presumably resulting from the positively charged polysaccharide acting as a sponge for negatively charged extracellular DNA (eDNA) (23, 24). It has been shown that the operon encoding the biosynthetic machinery for producing PIA, icaADBC, is repressed by CodY (27).
In the current study, we investigated the impact and interplay of CodY and CcpA in regulating central metabolism and biofilm formation in S. aureus. Consistent with previous findings, our results show that the inactivation of ccpA and/or codY in S. aureus has global, but distinct, effects on cellular metabolism by altering carbon flux through glycolysis, the TCA cycle, and amino acid biosynthesis in different ways (6, 9, 27). Furthermore, our results demonstrate that ccpA and codY inactivation antithetically impacts virulence factor production and biofilm development in S. aureus. Overall, the results of this study provide new insights into metabolic regulation of fitness and biofilm formation in S. aureus.
RESULTS
Growth characteristics of codY, ccpA, and codY ccpA mutants in S. aureus.
Previous studies have shown that the inactivation of either ccpA or codY in staphylococci affects bacterial growth and fitness by altering carbon flux through central metabolic pathways (6–8, 11, 22, 23, 28). To determine the contribution of CcpA and CodY to the control of bacterial fitness and metabolic status, the codY ccpA double mutant was constructed in the methicillin-sensitive S. aureus strain UAMS-1, and the growth and physiology of this mutant were assessed and compared with those of the wild-type strain and codY and ccpA single mutants (Fig. 1). As shown in Fig. 1A, disruption of codY has a minor impact on overall bacterial growth compared with the wild-type strain. However, inactivation of ccpA or both codY and ccpA leads to more pronounced growth defects with significant declines in the growth rates during the exponential phase (Fig. 1A and B). The growth yields of all mutants were comparable to those of the wild-type strain, suggesting that deletion of ccpA and/or codY does not affect biomass production in S. aureus in the long term (Fig. 1A). To assess the production of weak acids by the wild-type strain and the mutants, we measured the pH of culture supernatants during growth (Fig. 1A). The pH values of culture supernatants from the codY mutant were similar to those of the wild-type strain, suggesting that the lack of CodY does not affect weak acid production in S. aureus. In contrast, inactivation of ccpA in the wild-type strain and codY mutant led to a significant decline in acidification of the culture media during growth, demonstrating the importance of CcpA in regulating fermentative and overflow metabolic pathways (Fig. 1A).
FIG 1.

Growth characteristics of the wild-type (WT) strain and the codY, ccpA, and codY ccpA mutants in TSB supplemented with glucose. (A) Each strain was cultured in TSB supplemented with 0.25% glucose and incubated for 12 h at 37°C with aeration at 250 rpm. Optical density (OD600) and extracellular pH were determined at the indicated times. (B) Doubling time of the wild-type strain and codY, ccpA, and ccpA codY mutants, determined between 0 and 3 h of growth. For A, the results are representative of at least three independent experiments. For B, the results are presented as the means plus standard errors of the means of duplicate determinations for at least three independent experiments. Statistical significance between the wild-type strain and the codY, ccpA, and ccpA codY mutants was determined by using Student's t test. *, P < 0.01.
To determine the outcome of the interplay between these transcriptional regulators on cellular metabolic status, we first performed assays to quantify glucose, acetate, ammonia, and acetoin in the culture supernatants of the wild-type strain and the mutants over the course of 12 h of growth. As shown in Fig. 2A, glucose consumption in the codY mutant was similar to that of the wild-type strain. In contrast, temporal depletion of glucose from the culture media in ccpA and codY ccpA mutants was significantly reduced, confirming that CcpA acts as a positive regulator of glycolytic genes (Fig. 2A) (15). In agreement with decreased acidification (Fig. 1A) and declined glucose consumption (Fig. 2A), the ccpA and codY ccpA mutants produced significantly less acetate than the wild-type strain, while the codY mutant showed only a slight decrease in the accumulation of acetate (Fig. 2B). To determine the impact of ccpA and codY inactivation on amino acid metabolism, we measured ammonia accumulation in the culture supernatants since ammonia is produced from deamination reactions during amino acid catabolism (29). As shown in Fig. 2C, the ccpA and codY ccpA mutants produced more ammonia than the wild-type strain and the codY mutant during the exponential growth phase, suggesting that ccpA inactivation resulted in increased amino acid consumption due to disruption of carbon catabolite repression. Acetoin is a neutral molecule produced during overflow metabolism to prevent intracellular acidification (30). Therefore, to evaluate the contribution of CodY and CcpA on acetoin generation, we measured its concentrations in the culture supernatants of the wild-type and mutant strains. As shown in Fig. 2D, inactivation of ccpA decreased acetoin production in the mutant cells compared with that of the wild-type strain, confirming that CcpA is an activator of the alsSD operon encoding enzymes required for acetoin production (9, 31). In contrast, inactivation of codY leads to a drastic increase in acetoin generation by the mutant cells, suggesting that CodY acts as a repressor of the alsSD operon (Fig. 2D). In support of the positive regulatory function of CcpA on the alsSD operon, inactivation of ccpA partially (3 h) and completely (6 h) negated the positive impact of the codY mutation on acetoin production (Fig. 2D).
FIG 2.

An analysis of extracellular metabolites reveals major changes to central metabolism as a result of ccpA and/or codY inactivation. (A) Temporal depletion of glucose from the culture medium of the wild-type strain and codY, ccpA, and ccpA codY mutants. (B) Temporal accumulation and depletion of acetic acid in the culture medium of the wild-type strain and codY, ccpA, and ccpA codY mutants. (C) Temporal accumulation of ammonia in the culture medium of the wild-type strain and codY, ccpA, and ccpA codY mutants. (D) Acetoin accumulation in the culture medium of the wild-type strain and codY, ccpA, and ccpA codY mutants, determined after 3 and 6 h of growth. For A, B, and C, the results are representative of at least three independent experiments. For D, the results are presented as the means plus standard errors of the means of duplicate determinations for at least three independent experiments. Statistical significance between the wild-type strain and the codY, ccpA, and ccpA codY mutants was determined by using Student's t test. *, P < 0.0001.
Transcriptomic analysis reveals global changes in the expression of central metabolism genes in the mutants.
To gain a better understanding of the interplay between these two master transcriptional regulators, we performed a transcriptome sequencing (RNA-seq) analysis of the codY, ccpA, and codY ccpA mutants in comparison with the wild-type strain after 3 and 6 h of growth. In agreement with previous works (9, 27), mutations in codY and ccpA result in significant changes to metabolic gene expression after 3 h of growth (Fig. 3A), when bacterial cultures are at the exponential phase and both regulators are active. Color-coordinated arrows indicate changes in metabolic gene expression for each mutant compared with the wild-type strain (Fig. 3A). In line with the results reported by Majerczyk et al. (27), RNA-seq analysis of the codY mutant revealed an overexpression of genes involved in amino acid biosynthesis (ilv-leu operon, hom, thrCB, lysC, and gltB), peptide and amino acid transport (yveA, gmpC, gsiD, and abgT), toxin production (hlgB, hlgD, lukF, and lukH), and biofilm formation (icaADBC and nuc1) (Fig. 3A; see Table S3 in the supplemental material). Furthermore, the RNA-seq analysis revealed a decreased expression of genes involved in pyrimidine (pyr) and purine (pur and guaC) biosynthesis and an increase in purine salvage gene expression (xpt) (32) in the codY mutant (Fig. 3A). Earlier, Majerczyk et al. (27) observed an increase in the expression of the TCA cycle genes in the codY mutant, i.e., sucAB operon encoding alpha-ketoglutarate dehydrogenase. In contrast, our RNA-seq data showed that codY inactivation decreased the expression of the TCA cycle genes, i.e., sucCD genes encoding succinyl coenzyme A (succinyl-CoA) synthetase (Fig. 3A). Furthermore, the RNA-seq analysis revealed that the inactivation of codY also leads to a decreased expression of the pdhA gene encoding the E1 component subunit alpha of the pyruvate dehydrogenase complex required for the biosynthesis of acetyl-CoA (Fig. 3A).
FIG 3.

RNA-seq analysis reveals an interplay between CodY and CcpA in regulating central metabolism. (A) Alteration of metabolic gene expression in the codY, ccpA, and ccpA codY mutants compared with the wild-type strain after 3 h of growth. (B) Changes in metabolic gene expression in the codY, ccpA, and ccpA codY mutants compared with that of the wild-type strain after 6 h of growth. Color-coordinated arrows indicate changes in the codY (blue), ccpA (red), and codY ccpA (green) mutants.
As for the ccpA mutant, we found a decreased expression of glycolytic genes (fda, fba, and gpmA) and virulence genes (agrAD and seo) (Fig. 3A and Table S3), consistent with the results of previous studies on the CcpA regulon (6, 9, 10). Our transcriptomic analysis also revealed an increased expression of pgl, encoding 6-phosphogluconolactonase, the second enzyme of the pentose phosphate pathway (PPP) which catalyzes the hydrolysis of 6-phosphogluconolactone to 6-phosphogluconate (33). Interestingly, a previous study showed that the gluconate operon gntRKP, which is involved in the uptake and catabolism of gluconate to the PPP intermediate 6-phosphogluconate, was partially regulated by CcpA (9). Our RNA-seq data revealed an increase in the expression of the acsA gene, which product catalyzes the reaction toward the formation of acetyl-CoA from acetate (Fig. 3A). In a previous study, Seidl et al. (9) did not detect significant changes in the acsA gene expression in their transcriptomic analysis but did observe increased levels of the acetyl-CoA synthetase enzyme in the ccpA mutant. Derepression of the acsA transcription during the exponential phase of growth suggested that CcpA negatively regulates the catabolism of secondary carbon sources, such as acetate in the presence of excess glucose and oxygen. Impairment of carbon catabolite repression was further evidenced by the upregulation of peptide and amino acid transporters in the ccpA mutant, supporting our conclusion that deamination of the consumed amino acids results in increased ammonia production by the ccpA mutant during the exponential phase (Table S3; Fig. 2C).
In independent experiments, Majerczyk et al. and Seidl et al. (9, 27) observed the involvement of CodY and CcpA in regulating purine metabolism. In this study, we found a decreased expression of purine biosynthesis genes in all tested mutants, suggesting purine biosynthesis is a tightly regulated pathway that is sensitive to changes in central metabolism (Fig. 3A). Since ATP is used as a substrate for the initial reactions of both pyrimidine and purine biosynthesis, the decrease in the expression of these biosynthetic genes could be a result of the ATP deficiency in the mutant strains (34). Therefore, to determine the impact of ccpA and/or codY inactivation on intracellular ATP levels and cellular energy status we measured and compared ATP concentrations in all mutants and the wild-type strain. As a result, we found a slight decrease in the intracellular ATP levels for the codY mutant after 3 h of growth (Fig. 4). In the ccpA and codY ccpA mutants, however, there is an increase in ATP levels (Fig. 4), in direct contrast to the hypothesis that ATP is limiting purine biosynthesis in these two strains.
FIG 4.
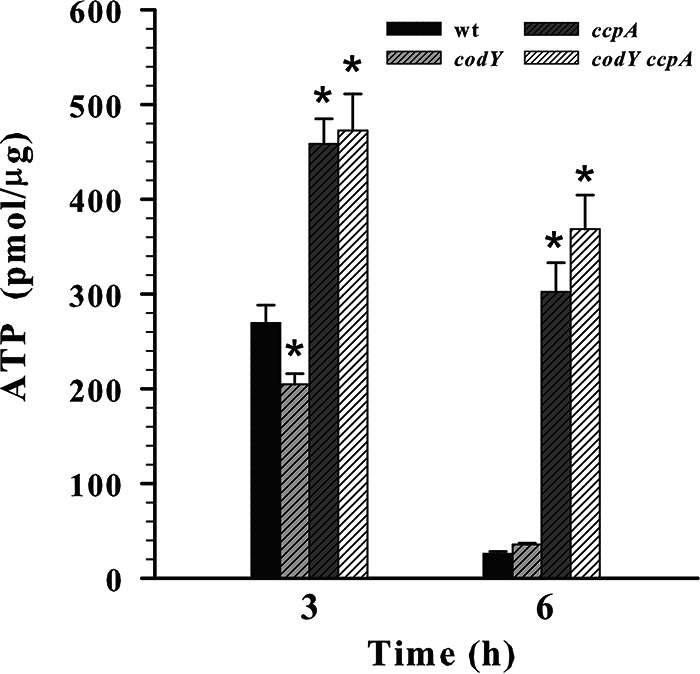
The inactivation of ccpA and/or codY has an antithetical impact on cellular energy status. Intracellular ATP concentrations were determined for the wild-type strain and codY, ccpA, and codY ccpA mutants after 3 and 6 h of aerobic growth in TSB containing 0.25% glucose. The results are presented as the means plus standard errors of the means of duplicate determinations for at least three independent experiments. Statistical significance between the wild-type strain and the codY, ccpA, and ccpA codY mutants was determined by using Student's t test. *, P < 0.0005.
The codY ccpA double mutant phenocopied the ccpA and codY single mutants in different ways. For example, during the exponential growth phase, the codY ccpA mutant exhibited a decreased expression of glycolytic genes (like the ccpA mutant) and increased amino acid biosynthesis genes (like the codY mutant) (Fig. 3A; Table S3). As mentioned above, inactivation of ccpA resulted in a decreased expression of the agr genes, a master regulatory system for virulence gene expression in S. aureus (10, 35). Conversely, CodY represses the transcription of agr system leading to the overexpression of various S. aureus toxin genes in the codY mutant, including hlgB, hlgD, lukF, and lukH (12, 25, 27). Therefore, the codY and ccpA mutations have antithetical impacts on the expression of the key virulence factor regulatory system agr, resulting in opposing phenotypes for the expression of toxin genes (10, 36). In our analysis, the codY ccpA double mutant did not show an increased expression of toxin genes, indicating the ccpA phenotype of the decreased toxin expression was dominant over the codY toxin overexpression phenotype (Table S3). These data suggest that direct or indirect activation of the agr locus by CcpA is required for the expression of toxin genes, regardless of CodY repression of agr. Similarly, the derepression of biofilm formation genes (ica, nuc, or sdrH) caused by the inactivation of codY was ablated in the codY ccpA mutant (Table S3), suggesting the effect of the ccpA mutation was dominant over the effect of the codY mutation. Altogether, during the exponential growth phase when nutrients are abundant, CodY and CcpA reduce carbon flow from secondary carbon sources and shut down toxin production to optimize growth (Fig. 3A; Table S3). However, inactivation of these metabolic regulators has detrimental effects on growth characteristics during the exponential phase (Fig. 1A and B, Fig. 2A to D).
During the post-exponential growth phase (6 h), when the wild-type strain has depleted glucose and utilizes acetate to fuel the TCA cycle to support further growth (Fig. 2A and B), we found other differences between the codY, ccpA, and codY ccpA mutants. Due to slower growth and glucose consumption (Fig. 1A and B, Fig. 2A), the ccpA and codY ccpA mutants still have glucose available to them at this time point (6 h). As a result, the RNA-seq analysis revealed an increased transcription of the PTS glucose transporter gene glcB in both the ccpA and codY ccpA mutants and enhanced expression of glycolytic genes, namely, fda and gapA1, in the ccpA mutant (Fig. 3B). Furthermore, since glucose is still available to the ccpA and codY ccpA mutants, we observed a decreased expression of the gluconeogenic gene gapA2 in both mutants (Fig. 2A, Fig. 3B). Additionally, the expression of genes encoding enzymes of carbon overflow metabolism, i.e., acetate kinase (AckA) (37) and pyruvate formate lyase (Pfl) (38) was upregulated in the ccpA and codY ccpA mutants (Fig. 3B), indicating increased carbon flux through the pyruvate node compared with the wild-type strain and the codY mutant. In agreement with the RNA-seq data suggestive of the increased glycolytic flux in the ccpA and codY ccpA mutants, the intracellular ATP concentrations after 6 h of growth were significantly higher in both mutants than those in the wild-type strain and the codY mutant (Fig. 4). Together, these observations can be attributed to the differences in glucose availability for the wild-type strain and the ccpA and codY ccpA mutants and suggested that the ccpA and codY ccpA mutants are still at the exponential phase of growth. The main differences between the wild-type strain and the codY mutant at the post-exponential growth phase were the increased expression of amino acid biosynthesis genes (ilv-leu operon) and proteases (aur, sspB, and sspC) and the decreased expression of pfl (formate production) and the pur operon (purine biosynthesis) in the codY mutant (Fig. 3B; Table S3). These data indicate that amino acids are still available to the wild type and CodY negatively regulates exoprotease expression (that would scavenge nutrients from the host) as well as amino acid biosynthesis during the post-exponential phase of growth (Fig. 3B; Table S3) (12, 25).
Targeted gene expression analysis reveals the coordination of metabolism and virulence by CodY and CcpA.
To validate the RNA-seq results and to get a closer look on gene expression at key metabolic nodes, we performed reverse transcriptase quantitative PCR (RT-qPCR) analysis on select gene targets (pgi, pfkA, pdhA, ackA, citZ, pyc, glmU, icaA, ldh1, alsS, cidA, ilvD, and RNAIII) after 3 and 6 h of growth (Fig. 5A and B). We observed consistent patterns with the RNA-seq data for the exponentially growing cells, including a decreased expression of glycolytic genes across all three mutants compared with the wild-type strain, with the exception of pfkA in the codY mutant (Fig. 5A). Furthermore, the codY and codY ccpA mutants demonstrated elevated levels of ilvD transcripts, which validates the increased expression of amino acid biosynthesis genes seen in the RNA-seq analysis (Table S3). In agreement with the RNA-seq data that showed reduced levels of sucCD transcripts in the codY mutant (Table S3), RT-qPCR analysis of the codY mutant revealed a decrease in the expression of citZ (Fig. 5A), the gene encoding citrate synthase, a pace-making enzyme in the first step of the TCA cycle (39). In contrast, the inactivation of ccpA leads to an increased expression of citZ, which is consistent with a previous study demonstrating the negative control of citZ transcription by CcpA (Fig. 5A) (9).
FIG 5.

RT-qPCR analysis corroborates RNA-seq results. (A) Changes in the levels of mRNA transcripts in the codY, ccpA, and ccpA codY mutants compared with the wild-type strain after 3 (A) and 6 (B) hours of growth.
Using RT-qPCR, we found changes in gene expression that were not identified in the RNA-seq analysis. For example, RT-qPCR quantification of icaA transcripts after 3 h of growth showed a drastic increase of icaA expression in the codY and codY ccpA mutants, while the RNA-seq analysis revealed only a significant difference in the icaDBC expression for the codY mutant (Fig. 5A; Table S3). Although we did not detect any significant changes in pyruvate carboxylase (pyc) gene expression in the RNA-seq analysis (Table S3), RT-qPCR revealed increased levels of pyc transcripts in the codY and codY ccpA mutants, which was consistent with a previous transcriptomics analysis (Fig. 5A) (27). Furthermore, using RT-qPCR, we detected a decreased expression of pyruvate fermentation genes (ldh1, alsS, and cidA) in the ccpA and codY ccpA mutants, which is also consistent with results from a previous transcriptomic study (Fig. 5A) (27). Additionally, there was a decreased pta expression in all mutants at the exponential growth phase but no changes in the ackA expression in any of the mutants (Fig. 5A). Earlier, Seidl et al. (9) did not observe any changes to pta or ackA expression in the S. aureus ccpA mutant, although Shivers et al. (20) found that both CodY and CcpA act as positive regulators of the ackA gene expression in Bacillus subtilis. Interestingly, our RT-qPCR analysis revealed reduced glmU expression in all strains, which is similar to the decrease in glycolytic gene expression (Fig. 5A). GlmU is a key enzyme in the synthesis of UDP-N-acetylglucosamine (UDP-GlcNAc), an important precursor for cell wall biosynthesis and PIA production (40). In agreement with the RNA-seq results, RNAIII was overexpressed in the codY mutant during the exponential growth, while in the ccpA mutant, RNAIII expression was strongly downregulated compared with the wild-type strain (Fig. 5A). Finally, consistent with our findings that virulence genes are not upregulated in the codY ccpA double mutant, we found decreased RNAIII expression in the codY ccpA mutant, verifying that CcpA is required for activation of the agr system even if repression by CodY is alleviated (Fig. 5A).
After 6 h of growth, the ccpA and codY ccpA mutants demonstrated increased glycolytic gene expression (pgi, pfkA, and pdhA), except for pfkA expression in the ccpA mutant, which was slightly lower than in the wild-type strain (Fig. 5B). As mentioned above, glucose is still available for these strains after 6 h of growth (Fig. 2A); therefore, an increase in glycolytic gene expression compared with that of the wild-type strain was anticipated. Similarly, RT-qPCR analysis revealed an increase in ackA expression for both the ccpA and codY ccpA mutants, while only a slight upregulation of ackA transcription was detected for the codY mutant (Fig. 5B). Compared with the exponential growth, the expression of the pta gene was not affected by CodY and/or CcpA during the post-exponential growth phase (Fig. 5B). Interestingly, the RT-qPCR analysis revealed decreased citZ expression in the ccpA and codY ccpA mutants after 6 h of growth, whereas pyc expression was upregulated in the codY and codY ccpA mutants (Fig. 5B). Overall, the RT-qPCR data support the findings of the global transcriptomic approach, where CcpA modulates carbon catabolite repression and virulence gene expression and CodY modulates amino acid biosynthesis and virulence.
A metabolomic approach further elucidates pathways disrupted by CodY and CcpA inactivation.
Next, we evaluated the impact of the ccpA and codY inactivation on bacterial metabolic status by measuring intracellular metabolite concentrations after 3 and 6 h of growth using liquid chromatography-tandem mass spectrometry (LC/MS-MS) (Fig. 6A and B; see Table S4 in the supplemental material). Generally, the observed differences between the mutants and the wild-type strain were in a correlation with the changes found in the transcriptomic analysis. During the exponential growth phase, the codY mutant had elevated pools of intracellular amino acids, PPP intermediates, and nucleic acid intermediates (Fig. 6A; Table S4). Increased intracellular amino acid concentrations were consistent with the increased expression of amino acid biosynthesis genes (Fig. 3A, Fig. 6A). Interestingly, while the RNA-seq analysis showed a decreased expression of purine biosynthesis genes in the codY mutant, the metabolomics approach revealed increased concentrations of PPP and nucleic acid intermediates (Fig. 3A, Fig. 6A; Table S4). For the most part, the trends of intracellular metabolite concentrations were similar between the ccpA and codY ccpA mutants (Fig. 6A; Table S4). In particular, the concentrations of 6-phospho-d-gluconate and hypoxanthine were highly increased in the ccpA and codY ccpA mutants during the exponential growth (Fig. 6A; Table S4). The ccpA mutant also had decreased intracellular levels of amino acids, consistent with previous data that suggest the ccpA mutant is consuming amino acids for growth during the exponential phase (41) (Fig. 2C, Fig. 3A, Fig. 6A). Similar to the ccpA mutant, where the TCA cycle is derepressed, the codY mutant demonstrated an increase in citrate and succinate levels (Fig. 6A; Table S4), despite the decreased expression of the TCA cycle genes (Fig. 3A, Fig. 5A). In contrast, CcpA is a repressor of the TCA cycle, and alleviation of this repression by inactivating ccpA results in increased carbon flux through the TCA cycle (42). The ccpA and codY ccpA mutants demonstrated decreased concentrations of d-alanine-d-alanine (Fig. 6A), indicating a defect in cell wall biosynthesis. There was a concomitant increase in d-glucosamine 6-phosphate concentrations in the ccpA and codY ccpA mutants (Fig. 6A), possibly due to a block in cell wall biosynthesis as indicated by decreased d-alanine-d-alanine levels. The decreased concentration of d-alanine-d-alanine in the ccpA and codY ccpA mutants was also evident during the post-exponential phase (Fig. 6B), suggesting that inactivation of ccpA, in general, causes a decrease in cell wall biosynthesis. Inactivation of ccpA has been linked to cell wall alterations in previous studies (10, 43). In one study, the cell wall fraction of a ccpA mutant was compared with that of the wild-type S. pneumoniae strain, and the authors found many cell wall proteins, which are anchored to the cell wall via d-ala within the peptidoglycan (44), were regulated directly or indirectly by CcpA (43). Another study showed that deletion of ccpA in the S. aureus strain COL caused a 4-fold reduction in susceptibility to oxacillin, an antibiotic targeting biosynthesis of the cell wall (10). These findings, along with our data, suggest CcpA plays an important role in cell wall biosynthesis.
FIG 6.

Metabolomic analysis further elucidates changes in the intracellular metabolic status resulting from codY and/or ccpA inactivation. Heat map generated from the normalized mean peak intensities for each metabolite identified from the triplicate set of LC-MS/MS experiments after 3 (A) and 6 (B) hours of growth. (A) The normalized mean intensities are plotted on a color scale from −3.1 (red) to 6.5 (green). (B) The normalized mean intensities are plotted on a color scale from −4.7 (red) to 9.4 (green). Only metabolites with a fold change differences greater than 2 are shown in the heat map.
Since glucose is still available to the ccpA and codY ccpA mutants after 6 h of growth (Fig. 2A) and these mutants have a higher expression of glucose transporter genes, i.e., glcB (45), compared with that of the wild-type strain (Fig. 3B), a metabolomics analysis revealed higher concentrations of glycolytic intermediates as anticipated (Fig. 6B; Table S4). In contrast to the ccpA and codY ccpA mutants, the codY mutant exhibited the same or even decreased levels of glycolytic intermediates compared with the wild-type strain (Fig. 6B; Table S4). Particularly, d-glyceraldehyde-3-phosphate concentrations in the codY mutant were found to be much lower than those in the wild-type strain (Fig. 6B; Table S4). Since glucose is no longer available for the codY mutant, these results suggest decreased carbon flux through the glycolytic machinery with a consequent depletion of d-glyceraldehyde-3-phosphate. d-Glyceraldehyde-3-phosphate is a metabolite linking glycolysis and the PPP, of which most intermediates are decreased in the codY mutant with the exception for 6-phospho-d-gluconate (Fig. 6B). These results might indicate reduced PPP activity in the codY mutant during the post-exponential phase leading to a buildup of 6-phospho-d-gluconate and decreased concentrations of other PPP intermediates. In contrast, the ccpA and codY ccpA mutants show significantly higher intracellular concentrations of PPP intermediates, which is likely a result of increased glycolytic flux feeding into the PPP (Fig. 6B; Table S4). Since PPP intermediates are used for nucleotide biosynthesis and our RNA-seq analysis revealed downregulation of the pur operon in the codY mutant, it would stand to reason that the codY mutant would have decreased concentrations of nucleotide intermediates. Indeed, the metabolomics analysis demonstrated a drastic reduction in the concentrations of nucleotide intermediates in the codY mutant compared with those of the wild-type strain (Fig. 6B; Table S4). In contrast to the codY mutant, the codY ccpA double mutant did not show the decrease in nucleotide intermediates, as it is still undergoing glycolysis and the pur operon is overexpressed compared with that of the wild-type strain (Fig. 2A, Fig. 3B, Fig. 6B; Table S4). Combined, the results of metabolomics analysis highlight the critical role of CodY and CcpA as master regulators of both metabolism and virulence gene expression, of which all impact the optimal growth of the organism.
CcpA and CodY antithetically regulate PIA production in S. aureus.
Previous works revealed an opposing impact of the codY and ccpA inactivation on the expression of the icaADBC operon (8, 27). Particularly, it has been shown that deletion of ccpA led to a decrease in the icaA transcript levels (8), while inactivation of codY drastically increased PIA biosynthesis through overexpression of the ica operon (12, 22, 27). Hence, we asked whether reduced glucose uptake and disruption of carbon flux through central carbon metabolism caused by inactivation of ccpA resulted in a decreased PIA biosynthesis. The results of the RT-qPCR analysis revealed that icaA gene expression during exponential growth was comparable between the codY and codY ccpA mutants (Fig. 5A). However, since the impairment of carbon flux could still impact the ability of the codY ccpA double mutant to produce PIA, we directly measured PIA production in all mutants using specific anti-PIA antibodies. As shown in Fig. 7A and B, compared with the codY mutant, the inactivation of ccpA reduced PIA biosynthesis in the codY ccpA double mutant during the exponential growth phase, whereas after 6 h of growth, the PIA production in the codY ccpA mutant was similar to the codY mutant. Notably, the biosynthesis of PIA in the codY ccpA double mutant was still highly elevated compared with that of the wild-type strain and the ccpA mutant (Fig. 7A and B). These results suggest that codY inactivation has a dominant impact on the production of PIA in the codY ccpA mutant and indicate that overproduction of PIA by the double mutant could result in a biofilm phenotype similar to the codY mutant (23).
FIG 7.

The codY and codY ccpA mutants overproduce PIA. (A) Relative amounts of cell-associated PIA were determined using a PIA immunoblot assay for the wild-type strain and codY, ccpA, and codY ccpA mutants after 3 and 6 h of aerobic growth in TSB containing 0.25% glucose. To determine the relative amounts of PIA, we defined the amount of PIA produced by the wild-type strain at 3 h in one experiment as 100% and expressed all other amounts as relative to the amount at this 3-h point. The results are presented as the means plus standard errors of the means (error bars) for three independent experiments. Statistical significance between the wild-type strain and the codY, ccpA, and ccpA codY mutants was determined by using Student's t test. *, P < 0.0005. (B) Representative immunoblot used for determining spot volumes.
Disruption of metabolic regulation alters biofilm matrix production and biofilm morphology.
Previous studies have revealed the opposing regulatory impact of CcpA and CodY on biofilm formation by staphylococci. For example, it has been shown that the inactivation of codY leads to an increase in biofilm thickness (22), while disrupting ccpA impairs biofilm development (8). To delineate the contribution of CcpA and CodY to staphylococcal biofilm development, we tested the ability of the mutant strains to form biofilms and the effects of codY and ccpA inactivation on biofilm matrix production. Previously, it has been shown that the inactivation of codY led to the formation of robust biofilms with very stringy structures consisting of PIA and eDNA (23). In agreement with this, the biofilms formed by the codY mutant stained strongly with TOTO-1 (Fig. 8), a fluorescent probe that indicates the presence of eDNA and dead cells (46). After 6 h of biofilm development in a constant flow environment, we added matrix-degrading agents to test the biofilm matrix composition of each strain (Fig. 8). To eliminate proteins in the matrix, we added proteinase K, which completely disrupted the wild-type strain and the ccpA mutant biofilms, whereas the codY and codY ccpA mutant biofilms remained relatively intact, with only the basal layer of cells being disrupted (Fig. 8). The remaining biofilm cells were associated with the long stringy structures that were described previously (23). These remaining structures were held intact presumably by the increased levels of PIA as a result of codY inactivation. In contrast, DNase I treatment did not cause a drastic impact on the basal layer of the biofilms in all tested strains but disrupted the stringy structures formed by the codY mutant (Fig. 8), confirming the presence of eDNA in these structures. Interestingly, the codY mutant overexpresses nuc, which encodes a secreted nuclease that degrades matrix eDNA and is involved in the “exodus” phase of biofilm development (47). In agreement with the low eDNA staining, the codY ccpA mutant biofilm “strings” were not disrupted by DNase I treatment (Fig. 8), presumably because they are held intact by the elevated levels of PIA. To determine the contribution of this polysaccharide to biofilm development in the mutants, we used sodium metaperiodate to degrade matrix-associated PIA. As shown in Fig. 8, the addition of sodium metaperiodate did not affect biofilm formation in the wild-type strain and the ccpA mutant. However, the stringy structures produced in the codY and codY ccpA mutant biofilms were disrupted by sodium metaperiodate (Fig. 8), suggesting that PIA is a major component for these structures.
FIG 8.

CodY and CcpA regulation is critical for proper biofilm development. Each quadrant shows how the wild-type strain and codY, ccpA, and codY ccpA mutants form biofilms in untreated conditions or when they are exposed to treatment with a matrix-degrading agent proteinase K (100 μg mL−1), DNase I (10 U mL−1), or sodium metaperiodate (2 mM). To further determine matrix composition, we stained the biofilms with TOTO-1, which fluoresces green when it interacts with eDNA or dead cells. Elapsed time (h) after the attachment stage and initiation of media flow are indicated.
Overall, the biofilm matrix produced by the UAMS-1 wild-type strain consists of PIA, eDNA, and proteins, with proteins being the most crucial matrix component. In the codY mutant, the basal biofilm layer attaches through protein-substrate interactions and the stringy structures produced by the codY mutant are held together by PIA and eDNA. The ccpA mutant incorporates relatively little eDNA compared with the wild-type strain and the codY mutant (Fig. 8), with most of the matrix composition being proteins. The codY ccpA mutant exhibits an intermediate biofilm phenotype that incorporates less eDNA in the matrix than all other strains (Fig. 8), the basal layer attaches via proteins, and the stringy structures are held together by PIA (but not eDNA, in contrast to the codY mutant). Combined, these results showed that the metabolic regulation of biofilm development by CodY and CcpA is critical for the formation of a healthy, structured biofilm.
DISCUSSION
Carbon catabolite repression is a global regulatory process in bacteria that modulates the expression of genes involved in carbon utilization in the presence of the preferred carbon sources, such as glucose (17). In staphylococci and other Gram-positive bacteria, the master transcriptional regulator of carbon metabolism CcpA, along with different components of CCR (e.g., HPr, HPrK, and PTS), mediates the connection between environmental input (availability of glucose) and the expression of genes involved in the consumption of glucose and secondary carbon sources (15). Previous studies have shown that staphylococcal CcpA not only is involved in the regulation of carbon metabolism but also acts as a modulator of virulence determinant production and biofilm development (7, 8, 10). Another global transcriptional regulator in Gram-positive bacteria, CodY, links staphylococcal physiology and pathogenesis in diverse environments by modulating the production of toxins, amino acids, and biofilm matrix components like PIA (11). It has been shown that CodY also senses environmental input, as low concentrations of GTP and/or isoleucine resulted in a loss of CodY affinity for its DNA targets in a stepwise fashion (12). In staphylococci, CcpA and CodY form a coordinated regulatory network that senses changes in the environmental cues and transduces those signals to globally modulate gene expression, allowing optimal growth and survival (4).
In this study, we evaluated the contribution and interplay of CodY and CcpA in regulating central metabolism, virulence factor production, and biofilm development in S. aureus. We constructed the ccpA codY double mutant in the methicillin-sensitive S. aureus strain UAMS-1 and compared its growth characteristics, gene expression profile, metabolic status, and biofilm formation with the wild-type strain and the codY and ccpA single mutants. Our results demonstrate that the inactivation of ccpA leads to reduced glucose consumption and, therefore, affects bacterial fitness by extending the exponential growth phase, while increasing utilization of secondary carbon sources, such as amino acids and acetate (Fig. 2A, Fig. 3A, Fig. 7A; Table S3). In contrast, the inactivation of codY has a limited impact on growth during the exponential phase, with a slight reduction in acetate production (Fig. 2B) and increased amino acid biosynthesis (Fig. 3A). The codY ccpA double mutant grew similarly to the ccpA mutant, with enhanced consumption of secondary carbon sources (Fig. 1A, Fig. 2A and B, Fig. 3A and B) but increased amino acid biosynthesis like the codY mutant (Fig. 3A and B). Notably, the ccpA codY double mutant had a slower depletion of glucose from the medium than the wild-type strain and the codY mutant but exhibited a higher temporal glucose consumption than the ccpA mutant (Fig. 2A). The RNA-seq analysis revealed that similar to the ccpA mutant, the ccpA codY mutant had a decreased expression of glycolytic genes (Fig. 3A; Table S3) suggestive of the decreased glucose-mediated carbon flux through the glycolytic machinery in the double mutant. However, unlike the ccpA mutant where PIA biosynthesis is impaired despite the presence of glucose in the medium, the ccpA codY double mutant directs carbon into the production of PIA similarly to the codY mutant (Fig. 2A, Fig. 7). The direction of carbon flux into PIA biosynthesis in the codY ccpA mutant revealed an example of the regulatory CcpA/CodY interface, where derepression of icaADBC expression caused by the inactivation of codY has a dominant impact over positive regulation of PIA production by CcpA. Consequently, the regulatory interface of CodY and CcpA affecting glycolytic flux and PIA biosynthesis in S. aureus leads to a higher and slower glucose consumption in the ccpA codY mutant than that of the ccpA and codY mutants, respectively. The control of acetoin biosynthesis in S. aureus represents another example of the regulatory interface of CcpA and CodY, where CcpA demonstrates a dominant outcome on acetoin production by negating the positive impact of the codY inactivation (Fig. 2D).
Another interesting finding was that CcpA is seemingly required for the activation of the agr system (Fig. 7A and B; Table S3). Even though codY inactivation derepresses the agr system and causes overexpression of virulence factors, such as hlgB, hlgD, lukF, and lukH, inactivation of ccpA had the dominant phenotype in the codY ccpA double mutant. In the ccpA mutant, we found a strong decrease in the expression of the agr system effector molecule RNAIII, which stayed consistent in the codY ccpA mutant (Fig. 5A and B). The interplay of CodY and CcpA in controlling the expression of this major virulence regulator (agr) highlights the complexity and importance of coordinated gene regulation and sheds light on metabolic requirements driving virulence factor production in S. aureus. Furthermore, the results of the current study demonstrated that these regulators are playing an important role in the proper development of mature biofilms. The wild-type UAMS-1 strain forms highly structured biofilms containing various niches with unique morphologies, including differences in gene expression and matrix composition (47, 48), which are completely susceptible to proteinase K treatment (Fig. 7). In contrast, the codY mutant is known to make stringy biofilm structures held together by increased amounts of PIA and eDNA (23). In our experiments, we found that the ccpA mutant biofilms incorporate less eDNA into the matrix (Fig. 8). In the double codY ccpA mutant biofilm, stringy biofilm structures are still formed but they incorporate less eDNA, as evidenced by the recalcitrance of these structures to DNase I treatment (Fig. 8). Therefore, a coordinated regulation of central metabolism and biofilm matrix production by CodY and CcpA is critical for proper biofilm development, as inactivation of either or both regulators drastically affect the morphology and composition of S. aureus biofilms. Overall, the results of this study shed light on the contribution and interplay between CodY and CcpA to optimize bacterial fitness by regulating central metabolism, virulence, and biofilm development. However, there is still much to be learned about the complexity of CodY and CcpA interactions and the roles they play during the pathogenesis of staphylococcal infections.
MATERIALS AND METHODS
Bacterial strains and growth conditions.
All strains used in this study are listed in Table S1 in the supplemental material. S. aureus strains were grown in tryptic soy broth (TSB) (BD Biosciences) supplemented with 0.25% glucose (Sigma-Aldrich). Bacterial cultures were inoculated to an optical density at 600 nm (OD600) of 0.05 from overnight cultures, incubated at 37°C, and aerated at 250 rpm with a flask-to-medium ratio of 10:1. Bacterial growth was assessed by measuring the OD600. The OD600 for stationary-phase cultures was measured following the dilution of cultures in TSB to remain within the linear range of a spectrophotometer. Antibiotics were purchased from Thermo Fisher Scientific and were used at the following concentrations: 5 μg/mL erythromycin, 10 μg/mL chloramphenicol, and 10 μg/mL tetracycline.
The UAMS-1codY ccpA double mutant was generated by bacteriophage ϕ11-mediated transduction (49) of the ccpA::tetL allele from the JE2 ccpA::tetL strain (41) into UAMS-1-codY::ermC (22). The replacement of the ccpA gene by the ccpA::tetL allele was verified by PCR using primers SAV1737-f and acuC-f (50). The UAMS-1 background in all mutants was confirmed by PCR using primers cna-f and cna-r (37).
Measurement of lactate, acetate, glucose, acetoin, and ammonia concentrations in culture medium.
Aliquots of bacterial cultures (1 mL) were centrifuged for 3 min at 14,000 rpm at 4°C. The supernatants were removed and stored at −20°C until use. Lactate, acetate, glucose, and ammonia concentrations were determined using kits purchased from R-Biopharm, according to the manufacturer’s protocol. Acetoin concentrations were determined at 560 nm as described previously (51).
Determination of intracellular ATP concentrations.
Intracellular ATP concentrations were determined using the BacTiter-Glo kit (Promega) according to the manufacturer’s protocol and normalized to the total cellular protein concentration at the time of harvest.
Sample preparation for LC-MS/MS analysis.
Samples were prepared as described previously for metabolomics analysis (52). Briefly, strains were inoculated in TSB supplemented with 0.25% glucose to an OD600 of 0.05 and grown aerobically at 37°C with shaking at 250 rpm. Ten optical units of bacterial cultures were harvested and filtered through a 0.45-μm membrane (Millipore). Two washes of 5 mL cold saline were performed on the membrane-trapped cells, followed by quenching in ice-cold 60% ethanol containing 2 μM Br-ATP as an internal control. Next, cells were lysed with a bead homogenizer set to oscillate for three cycles (30 s) of 6,800 rpm with a 10-s pause between each cycle. The tubes were centrifuged at 13,000 rpm, and the supernatant was collected, lyophilized, and stored at −80°C.
LC-MS/MS analysis.
Triple-quadrupole-ion trap hybrid mass spectrometer, viz., QTRAP6500+ (Sciex, USA) connected with a ultraperformance liquid chromatography I-class (UPLC) system procured from Waters, USA, was used for the metabolite analysis. The chromatographic separation was performed by liquid chromatography using an XBridge Amide (150- by 2.1-mm internal diameter [ID]; 3.5-μm particle size; Waters, USA) analytical column and a binary solvent system with a flow rate of 0.4 mL/min. A guard XBridge Amide column (20- by 2.1-mm ID; 3.5-μm particle size; Waters) was connected in front of the analytical column. Mobile phase A was composed of 10 mM ammonium acetate and 10 mM ammonium hydroxide containing 5% acetonitrile in LC-MS grade water; mobile phase B was 100% LC-MS-grade acetonitrile. The column was maintained at 40°C, and the autosampler temperature was maintained at 5°C. The gradient was started with the A/B solvent ratio at 15/85 which was maintained for 0.5 min followed by a gradual increase of A to 16% for 3.0 min. A was increased to 35% for 5.0 min then to 40% 4.0 min. A was further increased to 45% for next 3.5 min, to 50% for another 2.0 min, and finally to 65% over 2.0 min. A was reduced to 15% A at 25.0 min from the run start and was equilibrated for 5.0 min before the next run. A total of 300 μL Strong wash solvent for needle containing 100% acetonitrile whereas 600 μL of weak wash solvent comprised of 10% aqueous methanol were used after each injection. Injection volume was 5 μL. QTRAP6500+ operated in polarity switching mode was used for targeted quantitation of amino acids through the multiple reaction monitoring (MRM) process. Electrospray ionization (ESI) parameters were optimized as follows: electrospray ion voltage of −4,200V and 5,500V in negative and positive mode, respectively; source temperature of 400°C; curtain gas of 35; and gas 1 and 2 of 40 and 40 lb/in2, respectively. Compound-specific parameters were optimized for each compound using manual tuning. These parameters are as follows: declustering potential (DP) of 65V and −60V in positive and negative mode, respectively; entrance potential (EP) at 10V and −10V in positive and negative mode, respectively; and collision cell exit potential (CXP) at 10V and −10V in positive and negative mode, respectively. A yeast labeled and unlabeled metabolomics extract procured from the Cambridge Isotope laboratories, Inc. (CIL), UK, was used as the retention time marker. A labeled Canonical amino acid mix from CIL was used as a quality control and system performance check.
RNA-seq.
Libraries were generated using 100 ng of total RNA from each sample and the Universal Prokaryotic RNA-seq Prokaryotic AnyDeplete (Tecan Genomics, Inc.) following the recommended procedure. Libraries were multiplexed and sequenced on the NextSeq550 DNA analyzer (Illumina) in the UNMC Genomics Core to generate a total of approximately 5 million 150-bp single reads for each sample. The mRNA sequencing reads for the 24 samples were imported into CLC Genomics Workbench version 21.0.4 along with the annotated reference genome Staphylococcus aureus strain UAMS-1 (GCA_000788115.1) from NCBI to calculate the gene expressions in each sample. The CLC Genomics Workbench calculates gene expressions based on the approach described previously (53).
mRNA quantification using RT-qPCR.
RNA was isolated from S. aureus cultures after 3 and 6 h of growth in TSB supplemented with 0.25% glucose as described previously (40). Gene-specific primers (rpoD, pfkA, citZ, icaA, pta, ackA, pdhA, pgi, alsS, cidA, glmU, ldh1, pyc, ilvD, accD, and RNAIII) were used to perform quantitative real-time PCR (see Table S2 in the supplemental material). Briefly, cDNA was synthesized from 1 μg of total RNA using the QuantiNova reverse transcription kit (Qiagen). The samples were then diluted 1:10, and the cDNA products were amplified using the LightCycler FastStart DNA master SYBR green I kit (Roche Applied Science) following the manufacturer’s protocol. The relative transcript levels were calculated using the comparative threshold cycle (CT) method (54) with normalization to the amount of rpoD transcripts. The results were recorded in duplicate and are representative of three independent experiments.
PIA immunoblot analysis.
PIA accumulation was determined as described previously (40). Briefly, TSB medium containing 0.25% glucose was inoculated with equal numbers of bacteria from overnight cultures. The cultures were grown for 3 and 6 h at 37°C with a flask-to-medium ratio of 10:1 and aerated at 250 rpm. Equal numbers of bacteria (2.0 OD600 units) were harvested by centrifugation, and the PIA was extracted in 0.5 M EDTA by boiling for 10 min. Samples were incubated with proteinase K for 1 h at 37°C, followed by boiling for 5 min to inactivate proteinase K. Aliquots of PIA were applied to a neutral nylon membrane (GVS North America) and blocked with 5% skim milk for 6 h. The nylon membrane was incubated overnight with PIA-specific antibodies, followed by a 4-h incubation with an anti-rabbit immunoglobulin G-peroxidase conjugate. The presence of PIA was detected using the SuperSignal West Pico chemiluminescent substrate (Pierce). The integrated density values of bands on autoradiographs were determined with the TotalLab software (Nonlinear Dynamics Ltd.).
Bioflux1000, gene expression analysis, and matrix degradation treatments.
S. aureus biofilm development was assessed using a BioFlux 1000 microfluidic system (Fluxion Biosciences, Inc.) as described previously (48). Briefly, to grow biofilms in the BioFlux system, the channels in a 48-well plate were first primed with 210 μL of TSB for 1 min at 20.0 dynes/cm2. After priming the plate, 300 μL of fresh 50% TSB supplemented with 0.125% glucose was added to the input wells and 210 μL of inoculums containing exponentially growing cultures diluted to an OD600 of 0.8 was added to the output wells. The channels were seeded by pumping from the output wells to the input wells at 2.0 dynes/cm2 for 3 to 6 s. After cells were allowed to attach for 1 h at 37°C, excess inoculums were aspirated from the output well, and 1.0 mL of 50% TSB supplemented with 0.125% glucose was added to the input well and pumped at 0.6 dyne/cm2 for 18 h (flow rate, 64 μL/h). After 6 h of biofilm formation in the flow cell, fresh media in the inlet wells were replaced with fresh media alone or fresh media containing matrix-disrupting enzymes or chemicals with treatments (DNase I [10 U mL−1], proteinase K [100 mg μL−1], or sodium metaperiodate [2 mM]) (Thermo Fisher Scientific). In all biofilm experiments, fresh media contained 0.25 μM TOTO-1 iodide (Invitrogen) to stain for dead cells and eDNA. Bright-field and fluorescent images were taken every 5 min at ×200 magnification. The settings for gain and exposure were kept constant for all images, of which representative images are shown for each time point and strain.
Data availability.
The RNA-sequencing data generated in this work have been deposited in the Gene Expression Omnibus (GEO) public repository (https://www.ncbi.nlm.nih.gov/gds) with the accession number GSE204884. The metabolomics data that support the findings of this study are available at the NIH Common Fund’s National Metabolomics Data Repository (NMDR) website, the Metabolomics Workbench (https://www.metabolomicsworkbench.org), where it has been assigned study identifier (ID) ST002187 and a digital object identifier (DOI) of http://dx.doi.org/10.21228/M8J12Z.
ACKNOWLEDGMENTS
We thank Paul Fey (University of Nebraska Medical Center) for the gift of PIA-specific antibodies. We also thank the University of Nebraska DNA Sequencing Core, who receives partial support from the National Institute for General Medical Science (NIGMS) INBRE P20GM103427-19 grant and The Fred & Pamela Buffett Cancer Center Support Grant P30 CA036727.
This work was supported by research grants from the National Institute of Allergy and Infectious Diseases P01-AI83211 (to K.W.B. and V.C.T.), R01-AI125589 (to K.W.B.), and R01AI125588 (to V.C.T.).
Footnotes
Supplemental material is available online only.
Contributor Information
Marat R. Sadykov, Email: msadykov@unmc.edu.
Julie A. Maupin-Furlow, University of Florida
REFERENCES
- 1.Tong SY, Davis JS, Eichenberger E, Holland TL, Fowler VG, Jr.. 2015. Staphylococcus aureus infections: epidemiology, pathophysiology, clinical manifestations, and management. Clin Microbiol Rev 28:603–661. 10.1128/CMR.00134-14. [DOI] [PMC free article] [PubMed] [Google Scholar]
- 2.Salgado-Pabon W, Schlievert PM. 2014. Models matter: the search for an effective Staphylococcus aureus vaccine. Nat Rev Microbiol 12:585–591. 10.1038/nrmicro3308. [DOI] [PubMed] [Google Scholar]
- 3.Tacconelli E, Carrara E, Savoldi A, Harbarth S, Mendelson M, Monnet DL, Pulcini C, Kahlmeter G, Kluytmans J, Carmeli Y, Ouellette M, Outterson K, Patel J, Cavaleri M, Cox EM, Houchens CR, Grayson ML, Hansen P, Singh N, Theuretzbacher U, Magrini N, WHO Pathogens Priority List Working Group. 2018. Discovery, research, and development of new antibiotics: the WHO priority list of antibiotic-resistant bacteria and tuberculosis. Lancet Infect Dis 18:318–327. 10.1016/S1473-3099(17)30753-3. [DOI] [PubMed] [Google Scholar]
- 4.Somerville GA, Proctor RA. 2009. At the crossroads of bacterial metabolism and virulence factor synthesis in Staphylococci. Microbiol Mol Biol Rev 73:233–248. 10.1128/MMBR.00005-09. [DOI] [PMC free article] [PubMed] [Google Scholar]
- 5.Mazharul Islam M, Thomas VC, Van Beek M, Ahn JS, Alqarzaee AA, Zhou C, Fey PD, Bayles KW, Saha R. 2020. An integrated computational and experimental study to investigate Staphylococcus aureus metabolism. NPJ Syst Biol Appl 6:3. 10.1038/s41540-019-0122-3. [DOI] [PMC free article] [PubMed] [Google Scholar]
- 6.Poudel S, Tsunemoto H, Seif Y, Sastry AV, Szubin R, Xu S, Machado H, Olson CA, Anand A, Pogliano J, Nizet V, Palsson BO. 2020. Revealing 29 sets of independently modulated genes in Staphylococcus aureus, their regulators, and role in key physiological response. Proc Natl Acad Sci USA 117:17228–17239. 10.1073/pnas.2008413117. [DOI] [PMC free article] [PubMed] [Google Scholar]
- 7.Sadykov MR, Hartmann T, Mattes TA, Hiatt M, Jann NJ, Zhu Y, Ledala N, Landmann R, Herrmann M, Rohde H, Bischoff M, Somerville GA. 2011. CcpA coordinates central metabolism and biofilm formation in Staphylococcus epidermidis. Microbiology (Reading) 157:3458–3468. 10.1099/mic.0.051243-0. [DOI] [PMC free article] [PubMed] [Google Scholar]
- 8.Seidl K, Goerke C, Wolz C, Mack D, Berger-Bachi B, Bischoff M. 2008. Staphylococcus aureus CcpA affects biofilm formation. Infect Immun 76:2044–2050. 10.1128/IAI.00035-08. [DOI] [PMC free article] [PubMed] [Google Scholar]
- 9.Seidl K, Muller S, Francois P, Kriebitzsch C, Schrenzel J, Engelmann S, Bischoff M, Berger-Bachi B. 2009. Effect of a glucose impulse on the CcpA regulon in Staphylococcus aureus. BMC Microbiol 9:95. 10.1186/1471-2180-9-95. [DOI] [PMC free article] [PubMed] [Google Scholar]
- 10.Seidl K, Stucki M, Ruegg M, Goerke C, Wolz C, Harris L, Berger-Bachi B, Bischoff M. 2006. Staphylococcus aureus CcpA affects virulence determinant production and antibiotic resistance. Antimicrob Agents Chemother 50:1183–1194. 10.1128/AAC.50.4.1183-1194.2006. [DOI] [PMC free article] [PubMed] [Google Scholar]
- 11.Brinsmade SR. 2017. CodY, a master integrator of metabolism and virulence in Gram-positive bacteria. Curr Genet 63:417–425. 10.1007/s00294-016-0656-5. [DOI] [PubMed] [Google Scholar]
- 12.Waters NR, Samuels DJ, Behera RK, Livny J, Rhee KY, Sadykov MR, Brinsmade SR. 2016. A spectrum of CodY activities drives metabolic reorganization and virulence gene expression in Staphylococcus aureus. Mol Microbiol 101:495–514. 10.1111/mmi.13404. [DOI] [PMC free article] [PubMed] [Google Scholar]
- 13.Levdikov VM, Blagova E, Young VL, Belitsky BR, Lebedev A, Sonenshein AL, Wilkinson AJ. 2017. Structure of the branched-chain amino acid and GTP-sensing global regulator, CodY, from Bacillus subtilis. J Biol Chem 292:2714–2728. 10.1074/jbc.M116.754309. [DOI] [PMC free article] [PubMed] [Google Scholar]
- 14.Lorca GL, Chung YJ, Barabote RD, Weyler W, Schilling CH, Saier MH. Jr.. 2005. Catabolite repression and activation in Bacillus subtilis: dependency on CcpA, HPr, and HprK. J Bacteriol 187:7826–7839. 10.1128/JB.187.22.7826-7839.2005. [DOI] [PMC free article] [PubMed] [Google Scholar]
- 15.Gorke B, Stulke J. 2008. Carbon catabolite repression in bacteria: many ways to make the most out of nutrients. Nat Rev Microbiol 6:613–624. 10.1038/nrmicro1932. [DOI] [PubMed] [Google Scholar]
- 16.Wunsche A, Hammer E, Bartholomae M, Volker U, Burkovski A, Seidel G, Hillen W. 2012. CcpA forms complexes with CodY and RpoA in Bacillus subtilis. FEBS J 279:2201–2214. 10.1111/j.1742-4658.2012.08604.x. [DOI] [PubMed] [Google Scholar]
- 17.Warner JB, Lolkema JS. 2003. CcpA-dependent carbon catabolite repression in bacteria. Microbiol Mol Biol Rev 67:475–490. 10.1128/MMBR.67.4.475-490.2003. [DOI] [PMC free article] [PubMed] [Google Scholar]
- 18.Presecan-Siedel E, Galinier A, Longin R, Deutscher J, Danchin A, Glaser P, Martin-Verstraete I. 1999. Catabolite regulation of the pta gene as part of carbon flow pathways in Bacillus subtilis. J Bacteriol 181:6889–6897. 10.1128/JB.181.22.6889-6897.1999. [DOI] [PMC free article] [PubMed] [Google Scholar]
- 19.Weickert MJ, Chambliss GH. 1990. Site-directed mutagenesis of a catabolite repression operator sequence in Bacillus subtilis. Proc Natl Acad Sci USA 87:6238–6242. 10.1073/pnas.87.16.6238. [DOI] [PMC free article] [PubMed] [Google Scholar]
- 20.Shivers RP, Dineen SS, Sonenshein AL. 2006. Positive regulation of Bacillus subtilis ackA by CodY and CcpA: establishing a potential hierarchy in carbon flow. Mol Microbiol 62:811–822. 10.1111/j.1365-2958.2006.05410.x. [DOI] [PubMed] [Google Scholar]
- 21.Tu Quoc PH, Genevaux P, Pajunen M, Savilahti H, Georgopoulos C, Schrenzel J, Kelley WL. 2007. Isolation and characterization of biofilm formation-defective mutants of Staphylococcus aureus. Infect Immun 75:1079–1088. 10.1128/IAI.01143-06. [DOI] [PMC free article] [PubMed] [Google Scholar]
- 22.Majerczyk CD, Sadykov MR, Luong TT, Lee C, Somerville GA, Sonenshein AL. 2008. Staphylococcus aureus CodY negatively regulates virulence gene expression. J Bacteriol 190:2257–2265. 10.1128/JB.01545-07. [DOI] [PMC free article] [PubMed] [Google Scholar]
- 23.Mlynek KD, Bulock LL, Stone CJ, Curran LJ, Sadykov MR, Bayles KW, Brinsmade SR. 2020. Genetic and biochemical analysis of CodY-mediated cell aggregation in Staphylococcus aureus reveals an interaction between extracellular DNA and polysaccharide in the extracellular matrix. J Bacteriol 202:e00593-19. 10.1128/JB.00593-19. [DOI] [PMC free article] [PubMed] [Google Scholar]
- 24.Atwood DN, Loughran AJ, Courtney AP, Anthony AC, Meeker DG, Spencer HJ, Gupta RK, Lee CY, Beenken KE, Smeltzer MS. 2015. Comparative impact of diverse regulatory loci on Staphylococcus aureus biofilm formation. Microbiologyopen 4:436–451. 10.1002/mbo3.250. [DOI] [PMC free article] [PubMed] [Google Scholar]
- 25.Rivera FE, Miller HK, Kolar SL, Stevens SM, Jr., Shaw LN. 2012. The impact of CodY on virulence determinant production in community-associated methicillin-resistant Staphylococcus aureus. Proteomics 12:263–268. 10.1002/pmic.201100298. [DOI] [PMC free article] [PubMed] [Google Scholar]
- 26.Loughran AJ, Atwood DN, Anthony AC, Harik NS, Spencer HJ, Beenken KE, Smeltzer MS. 2014. Impact of individual extracellular proteases on Staphylococcus aureus biofilm formation in diverse clinical isolates and their isogenic sarA mutants. Microbiologyopen 3:897–909. 10.1002/mbo3.214. [DOI] [PMC free article] [PubMed] [Google Scholar]
- 27.Majerczyk CD, Dunman PM, Luong TT, Lee CY, Sadykov MR, Somerville GA, Bodi K, Sonenshein AL. 2010. Direct targets of CodY in Staphylococcus aureus. J Bacteriol 192:2861–2877. 10.1128/JB.00220-10. [DOI] [PMC free article] [PubMed] [Google Scholar]
- 28.Patzold L, Brausch AC, Bielefeld EL, Zimmer L, Somerville GA, Bischoff M, Gaupp R. 2021. Impact of the histidine-containing phosphocarrier protein HPr on carbon metabolism and virulence in Staphylococcus aureus. Microorganisms 9:466. 10.3390/microorganisms9030466. [DOI] [PMC free article] [PubMed] [Google Scholar]
- 29.Lindgren JK, Thomas VC, Olson ME, Chaudhari SS, Nuxoll AS, Schaeffer CR, Lindgren KE, Jones J, Zimmerman MC, Dunman PM, Bayles KW, Fey PD. 2014. Arginine deiminase in Staphylococcus epidermidis functions to augment biofilm maturation through pH homeostasis. J Bacteriol 196:2277–2289. 10.1128/JB.00051-14. [DOI] [PMC free article] [PubMed] [Google Scholar]
- 30.Yang SJ, Dunman PM, Projan SJ, Bayles KW. 2006. Characterization of the Staphylococcus aureus CidR regulon: elucidation of a novel role for acetoin metabolism in cell death and lysis. Mol Microbiol 60:458–468. 10.1111/j.1365-2958.2006.05105.x. [DOI] [PubMed] [Google Scholar]
- 31.Turinsky AJ, Moir-Blais TR, Grundy FJ, Henkin TM. 2000. Bacillus subtilis ccpA gene mutants specifically defective in activation of acetoin biosynthesis. J Bacteriol 182:5611–5614. 10.1128/JB.182.19.5611-5614.2000. [DOI] [PMC free article] [PubMed] [Google Scholar]
- 32.Endo T, Uratani B, Freese E. 1983. Purine salvage pathways of Bacillus subtilis and effect of guanine on growth of GMP reductase mutants. J Bacteriol 155:169–179. 10.1128/jb.155.1.169-179.1983. [DOI] [PMC free article] [PubMed] [Google Scholar]
- 33.Kupor SR, Fraenkel DG. 1972. Glucose metabolism in 6 phosphogluconolactonase mutants of Escherichia coli. J Biol Chem 247:1904–1910. 10.1016/S0021-9258(19)45556-7. [DOI] [PubMed] [Google Scholar]
- 34.Cohen GN. 2014. The biosynthesis of nucleotides, p 453–476. In Microbial biochemistry. Springer Netherlands, Dordrecht, Netherlands. [Google Scholar]
- 35.Novick RP. 2003. Autoinduction and signal transduction in the regulation of staphylococcal virulence. Mol Microbiol 48:1429–1449. 10.1046/j.1365-2958.2003.03526.x. [DOI] [PubMed] [Google Scholar]
- 36.Roux A, Todd DA, Velazquez JV, Cech NB, Sonenshein AL. 2014. CodY-mediated regulation of the Staphylococcus aureus Agr system integrates nutritional and population density signals. J Bacteriol 196:1184–1196. 10.1128/JB.00128-13. [DOI] [PMC free article] [PubMed] [Google Scholar]
- 37.Sadykov MR, Thomas VC, Marshall DD, Wenstrom CJ, Moormeier DE, Widhelm TJ, Nuxoll AS, Powers R, Bayles KW. 2013. Inactivation of the Pta-AckA pathway causes cell death in Staphylococcus aureus. J Bacteriol 195:3035–3044. 10.1128/JB.00042-13. [DOI] [PMC free article] [PubMed] [Google Scholar]
- 38.Leibig M, Liebeke M, Mader D, Lalk M, Peschel A, Gotz F. 2011. Pyruvate formate lyase acts as a formate supplier for metabolic processes during anaerobiosis in Staphylococcus aureus. J Bacteriol 193:952–962. 10.1128/JB.01161-10. [DOI] [PMC free article] [PubMed] [Google Scholar]
- 39.Richardson AR, Somerville GA, Sonenshein AL. 2015. Regulating the intersection of metabolism and pathogenesis in Gram-positive bacteria. Microbiol Spectr 3. 10.1128/microbiolspec.MBP-0004-2014. [DOI] [PMC free article] [PubMed] [Google Scholar]
- 40.Sadykov MR, Olson ME, Halouska S, Zhu Y, Fey PD, Powers R, Somerville GA. 2008. Tricarboxylic acid cycle-dependent regulation of Staphylococcus epidermidis polysaccharide intercellular adhesin synthesis. J Bacteriol 190:7621–7632. 10.1128/JB.00806-08. [DOI] [PMC free article] [PubMed] [Google Scholar]
- 41.Halsey CR, Lei S, Wax JK, Lehman MK, Nuxoll AS, Steinke L, Sadykov M, Powers R, Fey PD. 2017. Amino acid catabolism in Staphylococcus aureus and the function of carbon catabolite repression. mBio 8:e01434-16. 10.1128/mBio.01434-16. [DOI] [PMC free article] [PubMed] [Google Scholar]
- 42.Tobisch S, Zuhlke D, Bernhardt J, Stulke J, Hecker M. 1999. Role of CcpA in regulation of the central pathways of carbon catabolism in Bacillus subtilis. J Bacteriol 181:6996–7004. 10.1128/JB.181.22.6996-7004.1999. [DOI] [PMC free article] [PubMed] [Google Scholar]
- 43.Iyer R, Baliga NS, Camilli A. 2005. Catabolite control protein A (CcpA) contributes to virulence and regulation of sugar metabolism in Streptococcus pneumoniae. J Bacteriol 187:8340–8349. 10.1128/JB.187.24.8340-8349.2005. [DOI] [PMC free article] [PubMed] [Google Scholar]
- 44.Navarre WW, Schneewind O. 1999. Surface proteins of gram-positive bacteria and mechanisms of their targeting to the cell wall envelope. Microbiol Mol Biol Rev 63:174–229. 10.1128/MMBR.63.1.174-229.1999. [DOI] [PMC free article] [PubMed] [Google Scholar]
- 45.Vitko NP, Grosser MR, Khatri D, Lance TR, Richardson AR. 2016. Expanded glucose import capability affords Staphylococcus aureus optimized glycolytic flux during infection. mBio 7:e00296-16. 10.1128/mBio.00296-16. [DOI] [PMC free article] [PubMed] [Google Scholar]
- 46.Okshevsky M, Meyer RL. 2014. Evaluation of fluorescent stains for visualizing extracellular DNA in biofilms. J Microbiol Methods 105:102–104. 10.1016/j.mimet.2014.07.010. [DOI] [PubMed] [Google Scholar]
- 47.Moormeier DE, Bose JL, Horswill AR, Bayles KW. 2014. Temporal and stochastic control of Staphylococcus aureus biofilm development. mBio 5:e01341-14. 10.1128/mBio.01341-14. [DOI] [PMC free article] [PubMed] [Google Scholar]
- 48.Moormeier DE, Endres JL, Mann EE, Sadykov MR, Horswill AR, Rice KC, Fey PD, Bayles KW. 2013. Use of microfluidic technology to analyze gene expression during Staphylococcus aureus biofilm formation reveals distinct physiological niches. Appl Environ Microbiol 79:3413–3424. 10.1128/AEM.00395-13. [DOI] [PMC free article] [PubMed] [Google Scholar]
- 49.Novick RP. 1991. Genetic systems in staphylococci. Methods Enzymol 204:587–636. 10.1016/0076-6879(91)04029-N. [DOI] [PubMed] [Google Scholar]
- 50.Sadykov MR, Windham IH, Widhelm TJ, Yajjala VK, Watson SM, Endres JL, Bavari AI, Thomas VC, Bose JL, Bayles KW. 2019. CidR and CcpA synergistically regulate Staphylococcus aureus cidABC Expression. J Bacteriol 201:e00371-19. 10.1128/JB.00371-19. [DOI] [PMC free article] [PubMed] [Google Scholar]
- 51.Nicholson WL. 2008. The Bacillus subtilis ydjL (bdhA) gene encodes acetoin reductase/2,3-butanediol dehydrogenase. Appl Environ Microbiol 74:6832–6838. 10.1128/AEM.00881-08. [DOI] [PMC free article] [PubMed] [Google Scholar]
- 52.Liebeke M, Dorries K, Meyer H, Lalk M. 2012. Metabolome analysis of gram-positive bacteria such as Staphylococcus aureus by GC-MS and LC-MS. Methods Mol Biol 815:377–398. 10.1007/978-1-61779-424-7_28. [DOI] [PubMed] [Google Scholar]
- 53.Mortazavi A, Williams BA, McCue K, Schaeffer L, Wold B. 2008. Mapping and quantifying mammalian transcriptomes by RNA-Seq. Nat Methods 5:621–628. 10.1038/nmeth.1226. [DOI] [PubMed] [Google Scholar]
- 54.Schmittgen TD, Livak KJ. 2008. Analyzing real-time PCR data by the comparative C(T) method. Nat Protoc 3:1101–1108. 10.1038/nprot.2008.73. [DOI] [PubMed] [Google Scholar]
Associated Data
This section collects any data citations, data availability statements, or supplementary materials included in this article.
Supplementary Materials
Table S3. Download jb.00617-21-s0001.xlsx, XLSX file, 0.1 MB (119.7KB, xlsx)
Table S4. Download jb.00617-21-s0002.xlsx, XLSX file, 0.1 MB (131.3KB, xlsx)
Tables S1 and S2. Download jb.00617-21-s0003.pdf, PDF file, 0.4 MB (392.7KB, pdf)
Data Availability Statement
The RNA-sequencing data generated in this work have been deposited in the Gene Expression Omnibus (GEO) public repository (https://www.ncbi.nlm.nih.gov/gds) with the accession number GSE204884. The metabolomics data that support the findings of this study are available at the NIH Common Fund’s National Metabolomics Data Repository (NMDR) website, the Metabolomics Workbench (https://www.metabolomicsworkbench.org), where it has been assigned study identifier (ID) ST002187 and a digital object identifier (DOI) of http://dx.doi.org/10.21228/M8J12Z.