

Abstract
Introduction
Hip fractures among older people are a major public health issue, which can impact quality of life and increase mortality within the year after they occur. A recent observational study found an increased risk of hip fracture in subjects who were new users of tramadol compared with codeine. These drugs have somewhat different indications. Tramadol is indicated for moderate to severe pain and can be used for an extended period; codeine is indicated for mild to moderate pain and cough suppression.
Objective
In this observational study, we compared the risk of hip fracture in new users of tramadol or codeine, using multiple databases and analytical methods.
Methods
Using data from the Clinical Practice Research Datalink and three US claims databases, we compared the risk of hip fracture after exposure to tramadol or codeine in subjects aged 50–89 years. To ensure comparability, large-scale propensity scores were used to adjust for confounding.
Results
We observed a calibrated hazard ratio of 1.10 (95% calibrated confidence interval 0.99–1.21) in the Clinical Practice Research Datalink database, and a pooled estimate across the US databases yielded a calibrated hazard ratio of 1.06 (95% calibrated confidence interval 0.97–1.16).
Conclusions
Our results did not demonstrate a statistically significant difference between subjects treated for pain with tramadol compared with codeine for the outcome of hip fracture risk.
Supplementary Information
The online version contains supplementary material available at 10.1007/s40264-022-01198-9.
Key Points
| When subjects treated with cough prior to the index date were excluded from the analyses of the US claims databases, there was a decrease in the number of codeine-treated versus tramadol-treated subjects, suggesting that codeine was often used for cough instead of pain. |
| This finding highlights the importance of accounting for differences in indications, when comparing data from subjects treated with tramadol versus codeine. |
Introduction
Hip fractures are a major public health issue, particularly for older persons [1]. These fractures of the upper portion of the femur, are classified per anatomical location: femoral-neck, intertrochanteric, or subtrochanteric [2]. Hip fractures are associated with a 25% reduction in life expectancy and approximately 17% of patients who experience fractures spend their remaining life in a nursing facility [3]. Globally, hip fractures affect 18% of women and 6% of men and rank among the top ten causes of disability [4, 5]. Measures that reduce the risk of hip fracture are therefore important to patient welfare.
Tramadol is both an opioid agonist and an inhibitor of norepinephrine and serotonin reuptake and it is indicated for moderate to severe pain in adults [6]. Although the mode of action is not completely understood, the analgesic effect is believed to be due to both the agonism of µ-opioid receptors (the low affinity binding of the parent compound and the higher affinity binding of the O-demethylated metabolite [M1] to µ-opioid receptors), and the weak inhibition of norepinephrine and serotonin reuptake [7, 8]. Codeine is a centrally acting weak µ-opioid receptor agonist indicated for mild to moderate pain and as a cough suppressant [8, 9]. It acts on the µ-opioid receptor, predominantly via its active metabolite morphine.
Recently, Wei et al. [6] conducted an observational study of hip fracture incidence among new users of tramadol (aged 50–90 years) compared with propensity score (PS)-matched new users of codeine and several nonselective nonsteroidal anti-inflammatory drugs. The study used data from The Health Improvement Network collected between January 2000 and December 2016. The results showed that the hazard ratio (HR) for hip fractures was higher for new users of tramadol compared with new users of codeine, HR 1.28 (95% confidence interval 1.13–1.46). Wei et al. hypothesized that the underlying mechanism of action was that “tramadol could activate MORs and suppress central serotonin and norepinephrine reuptake, resulting in seizures [10], dizziness [11, 12], and/or delirium [13]” [6].
Johnson & Johnson (hereafter referred to as the Company) is the marketing authorization holder of both tramadol and codeine-containing products, and therefore has the responsibility to investigate newly identified adverse events to these drugs [14, 15]. If an association is confirmed, the Company takes appropriate actions to address patient safety. Wei et al.’s study prompted a review of the risk of hip fracture after exposure to tramadol versus codeine. This review included multiple work streams within the Company including the observational study outlined in this publication. The main objective of this study was to evaluate existing patient data for evidence of an association between hip fracture and new exposure to tramadol using the Clinical Practice Research Datalink (CPRD), and in other databases.
The initial strategy in this study, was to replicate Wei et al.’s methodology [6]; however, upon review of this, we were concerned that their results might reflect confounding effects rather than a medication effect. First, it appeared that methods such as large-scale PS fitting with least absolute shrinkage and selection operator regression were not used [16]. Second, the study did not make systematic use of negative controls or other similar methods to check for residual confounding. Third, the study did not document whether the extent of exposure to tramadol was similar to that of codeine either in terms of morphine milligram equivalents (MME) per day or in terms of days’ supply dispensed. Fourth, the study did not exclude cough and cold preparations that may contain relatively low doses of codeine. Finally, the study used data from a single source, thus there is no assurance of the generalizability of the findings to other databases or whether the findings may be attributable to unique characteristics of the database. Because of these concerns, in this study, data from additional databases were analyzed.
The present study, using real-world data, assessed the risk of hip fracture among subjects who initiated treatment with tramadol or codeine and were between the ages of 50 and 89 years. We used data from the CPRD, a UK database derived from electronic health records, and three US claims databases. We sought to quantify and characterize whether tramadol use was associated more strongly than codeine use with an increased risk of hip fractures.
Material and Methods
Study Design
This was a retrospective, observational, comparative cohort design study [17]. The protocol and code were publicly available prior to study execution on GitHub [18], the study was registered with the European Union PAS register (EUPAS36038) [19], and the results were kept blinded until diagnostics were reviewed. Blinding in this setting means the effect size of interest was not revealed until after diagnostics were reviewed and the protocol was finalized. Blinding avoids p-hacking or adjusting an analysis to achieve a desired result.
Study Populations
We employed two variants of the target (tramadol; T1 and T2) and comparator (codeine; C1 and C2) cohorts among subjects aged 50–89 years with 365 days of continuous observable time prior to the index date. The index date in all cases was the first exposure to either tramadol or codeine that met all cohort criteria.
The first cohort variants (T1, C1) were similar to the cohorts employed by Wei et al. [6]. Subjects were excluded if they were exposed to tramadol, codeine, or other opioids in the 365 days prior to index date. Additionally, subjects were excluded if they experienced hip fracture, cancer, or were diagnosed with opioid abuse in the 365 days prior. As noted above, these cohort definitions may lead to confounding by indication because codeine is also used to treat cough, and we expected that the analysis would show this. The assumption was that patients who received codeine for cough would be younger and healthier than patients receiving tramadol for pain.
The objective of the second cohort variants (T2, C2) was to make the target and comparator cohorts more comparable and this was done in two ways. First, by excluding subjects diagnosed with cough or cold in the 30 days prior to initial exposure to the opioids of interest and second, by excluding subjects who were prescribed cold or cough medications, antibiotics, or antihistamines in the 30 days prior to initial exposure of the opioids of interest. Code lists can be accessed in the Electronic Supplementary Material (ESM) and detailed descriptions of the cohorts can be found in Tables 1–4 of the ESM.
Databases
Data from an electronic health record database from the UK and three administrative claims databases from the USA were used in our analyses. The UK database was the CPRD, which is similar to the The Health Improvement Network database used by Wei et al. [6]. The US databases included the IBM® MarketScan® Medicare Supplemental Database (MDCR), the IBM® MarketScan® Multi-State Medicaid Database (MDCD), and Optum’s De-identified Clinformatics® Data Mart—Date of Death (OPTUM_DOD). Additional information on these four databases can be found in Table 5 of the ESM. Each database was standardized to the Observational Medical Outcomes Partnership Common Data Model, version 5.3.1 [20–22].
Of note, the OPTUM_DOD censors subjects at 90 years of age. This means that 90-year-old subjects in this database could actually be older. Therefore, for all cohorts, across all databases, we decided to censor at age 89 years, while Wei et al. [6] censored at age 90 years.
Time-at-Risk and Outcome Definitions
For this study, two time-at-risk (TAR) definitions were used: on-treatment (OT) and intent-to-treat (ITT). The OT TAR was calculated from the index date of the first exposure to the end of treatment, based on days’ supply, allowing for up to 30-day gaps between the end of days’ supply and the start of the next prescription. This end date was censored if a subject died, left the database, reached the age of 89 years, reached 365 days after the index date, was exposed to the other opioid of interest (i.e., was censored when patients in the tramadol cohort were exposed to codeine or when patients in the codeine cohort were exposed to tramadol), or experienced the outcome of interest.
The ITT TAR started on the index date and continued until the target or comparator subject died, left the database, or experienced the outcome of interest. The ITT TAR is more sensitive to potentially longer lasting effects of exposure compared with the OT TAR.
The outcome of interest was hip fracture, which was defined in two different ways. Outcome Definition 1 (O1) was specifically designed for the CPRD analysis. This definition included the first occurrence of either a diagnosis of a hip fracture or a procedure associated with treatment of hip fracture among subjects aged 50–89 years with 365 days of continuous observable time prior to the index date (see Table 6 of the ESM for a detailed description). While the analysis was conducted on Observational Medical Outcomes Partnership Common Data Models that leveraged standard terminologies, in an attempt to replicate the Wei et al. study’s definition [6, 23], hip fracture O1 was defined via READ codes (which was the coding system used in the study). Because standardized terminologies were not used, O1 will only work on databases that use the READ code system.
The second definition of hip fracture was Outcome Definition 2 (O2), which was tailored to the US claims databases (see Table 7 of the ESM). This outcome was developed based on the algorithms from Ray et al. [1] and Nair et al. [24] and was defined as the first hip fracture in a subject’s medical history, among subjects aged 50–89 years with 365 days of observable time prior to the index date. The O2 definition leveraged standard terminologies found in the Observational Medical Outcomes Partnership Common Data Model. Because of the differences in how the outcome definitions were defined we decided, a priori, to perform the analysis for risk separately (one for CPRD while performing individual assessments of and a meta-analysis across the three administrative claims databases from the USA) [18, 19].
Negative control outcomes were also assessed in our study. Negative controls are exposure-outcome pairs where no causal relationship is believed to exist between the exposure and the outcome, and therefore the true relative risk is assumed to be 1. To account for the remaining systematic bias after PS matching, negative controls can be used to calibrate the results of an observational study [25]. The negative control outcomes were selected by choosing conditions with no evidence of an exposure-associated outcome in products labels or adverse event reporting, or the literature (process previously outlined in detail [26, 27]). A total of 221 possible negative controls were reviewed by two physicians, who ultimately agreed on 101 of the outcomes, which became our negative controls (see Table 8 of the ESM).
Statistical Analyses
Model Specification
In this study, we compared target cohorts with the comparator cohorts for the hazards of O1 or O2 during the TAR by applying a Cox proportional hazards model conditioned on PSs. Empirical calibration based on the negative controls was used to minimize any potential residual confounding with empirically calibrated HR (CHR), 95% calibrated confidence interval (CCI), and calibrated p-values [25, 28]. The number of subjects, days of TAR, and outcome events in each cohort, in each pairwise comparison after PS adjustment, were also reported. The time to event for O1 or O2 among subjects in the target (T1, T2) and comparator (C1, C2) cohorts was determined by calculating the number of days from the start of the TAR window (index date), until the first occurrence of the outcome, and it was right-censored at the end of the TAR window.
Propensity scores were used in the analyses to reduce potential confounding due to an imbalance of baseline subject characteristics between the target and comparator cohorts in the pairwise comparisons. The PS is the probability that a subject received the target exposure versus the comparator exposure, given a set of observed covariates. The covariates were chosen via a data-driven approach, which does not rely on clinical expertise, but instead uses a model, which can include 10,000–100,000 unique characteristics [29]. The types of baseline covariates used to fit the PS model are found in Table 9 of the ESM.
A PS was estimated for each subject using the predicted probability from a regularized logistic regression model, fit with a Laplace prior (least absolute shrinkage and selection operator), and the regularization hyperparameter selected by optimizing the likelihood in a ten-fold cross validation, using a starting variance of 0.01 and a tolerance of 2e−7 [30, 31]. Covariates that occurred in less than 0.1% of the combined target and comparator cohorts in a pairwise comparison were excluded prior to model fitting. Subjects were matched on 1:1 ratio of target to comparator subjects. This approach used a greedy matching algorithm by applying a caliper of 0.2 of the standard deviation on the logit scale of the PS distribution [32].
Evidence Evaluation
For each population-level effect estimate generated by the study, i.e., each target-comparator-outcome-analysis-database combination, diagnostics were conducted to understand its potential for bias and threat to a valid interpretation. The diagnostics included both PS distribution and covariate balance (before and after PS matching).
Once the PS model was fitted for each pairwise comparison, the preference score for the target and comparator cohorts was plotted to evaluate the comparability of the two cohorts (T1 vs C1, T2 vs C2) before matching. If the proportion of subjects was in clinical equipoise (i.e., the subjects with a PS between 0.3 and 0.7, was less than 50%), then the estimate was not reported [33].
Covariate balance was evaluated by computing the standardized mean difference of each covariate before PS matching against the standardized mean difference after PS matching. After matching, standardized mean differences with values <0.1 indicate negligible group differences [34].
Analyses Performed
Six pairwise analysis groups, comparing a tramadol cohort (T1 or T2) with a codeine cohort (C1 or C2), were performed across the TARs (OT or ITT) for a total of 24 analyses (Table 1). Three of the analysis groups (Analyses 101, 201, and 301) were performed using the CPRD for a total of six analyses. The other three analysis groups (Analyses 102, 202, and 302) were performed using the three US claims databases for a total of 18 analyses. Additionally, for the US claims database analyses, there was a pre-planned aggregation of the results using a random-effects meta-analysis. This meta-analysis did not combine the results for the CPRD and US databases because of differences in the outcome definition. In summary, Analyses 101 and 102 were meant as a replication of Wei et al. [6], Analyses 201 and 202 were a second replication that excluded some variables in the PS model that were highly correlated with exposure, and Analyses 301 and 302 excluded subjects with cough and/or prescribed cough, antibiotic, cold and cough medications, and antihistamines in the last 30 days, which resulted in the tramadol and codeine cohorts being more comparable, i.e., not confounded by differences in indication.
Table 1.
Analyses performed
| Analysis groups | Analysis specifications | Count |
|---|---|---|
| Analysis 101: replication of Wei et al. |
T1 vs C1 for O1 2 TAR specifications * CPRD database |
2 |
| Analysis 102: replication of Wei et al. |
T1 vs C1 2 TAR specifications × 3 US claims databasesa Meta-analysis performed |
6 |
| Analysis 201: replication of Wei et al. (excluding some variables from the propensity score model) |
T1 vs C1 for O1 2 TAR specifications * CPRD database |
2 |
| Analysis 202: replication of Wei et al. (excluding some variables from the propensity model) |
T1 vs C1 for O2 2 TAR specifications × 3 US claims databasesa Meta-analysis performed |
6 |
| Analysis 301: replication using best practices |
T2 vs C2 for O1 2 TAR specifications * CPRD database |
2 |
| Analysis 302: replication using best practices |
T2 vs C2 for O2 2 TAR specifications × 3 US claims databasesa Meta-analysis performed |
6 |
| Total analyses | 24 | |
C1 comparator cohort 1: codeine, C2 comparator cohort 2: codeine (exclude cough, antibiotic, cold and cough medications, and antihistamines in last 30 days), CPRD Clinical Practice Research Datalink, MDCD IBM MarketScan® Multi-State Medicaid Database, MDCR IBM MarketScan® Medicare Supplemental Database, O1 outcome definition 1: primary hip fracture, O2 outcome cefinition 2: primary hip fracture emergency room/inpatient diagnosis with hip fracture procedures ± 7 days or primary hip fracture procedures with hip fracture emergency room/inpatient ± 7 days, OPTUM_DOD Optum® De-Identified Clinformatics® Data Mart Database - Date of Death, T1 target cohort 1: tramadol, T2 target cohort 2: tramadol (exclude cough, antibiotic, cold and cough medications, and antihistamines in last 30 days), TAR time-at-risk
aMDCR, MDCD, and OPTUM_DOD
Additionally, a priori, we were concerned that the doses of tramadol and codeine might differ in terms of MMEs [35] as the risk of an adverse event can be dose dependent. We characterized the initial dose of both tramadol and codeine and compared the results before and after PS matching. This was done by computing the daily dose as the number of oral tablets times the number of milligrams (mg) of tramadol or codeine per tablet divided by the days’ supply. It should be noted that days’ supply was not always provided by the CPRD; however, for the tramadol and codeine exposures it was missing less than 0.2% of the time [36, 37]. For the analysis, exposure to tramadol or codeine was used regardless of its days’ supply. The MME was calculated by multiplying this daily dose by a conversion factor (0.1 for tramadol and 0.15 for codeine).
Results
Diagnostics
After PS matching, each analysis was required to be in clinical equipoise and a covariate balance reached. Table 10 of the ESM presents the 24 analyses and indicates which analysis passed diagnostics.
Analyses 101, 102, and 202 failed these diagnostics because there was little PS overlap, i.e., the cohorts were not comparable. Analysis 101 (Fig. 1) failed diagnostics because there was no preference score overlap and thus no matches were found, and no diagnostics produced. Analyses 102 (Fig. 2 and Figs. 9–10 of the ESM) and 202 (Fig. 3 and Figs. 11–12 of the ESM) failed diagnostics as clinical equipoise was not reached. Thus, all of these analyses have preference score distributions that were indicative of cohorts that should not be compared as the results would not be generalizable.
Fig. 1.
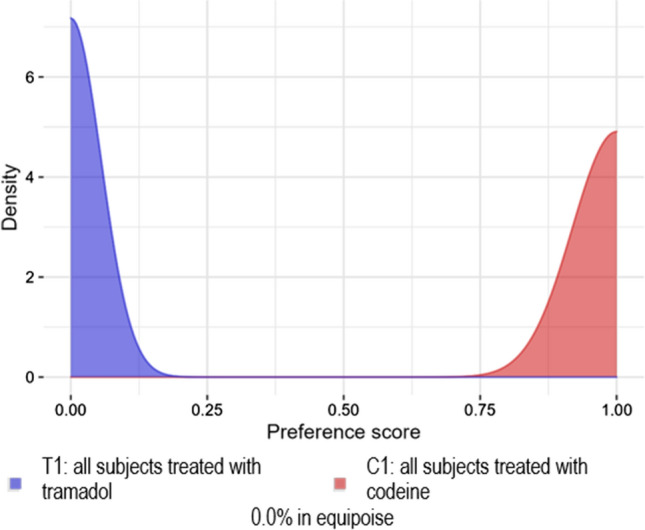
Analysis 101: Replication of Wei et al [6]. Preference score distribution for the Clinical Practice Research Datalink
Fig. 2.
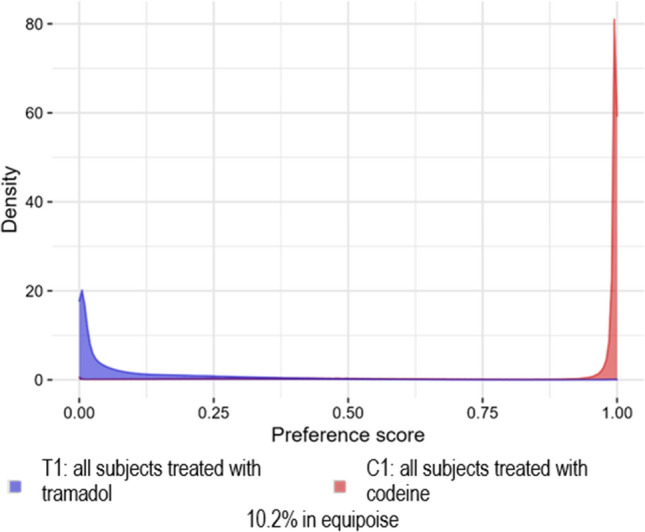
Analysis 102: replication of Wei et al. [6]. Preference score distribution for the IBM MarketScan® Medicare Supplemental Database
Fig. 3.
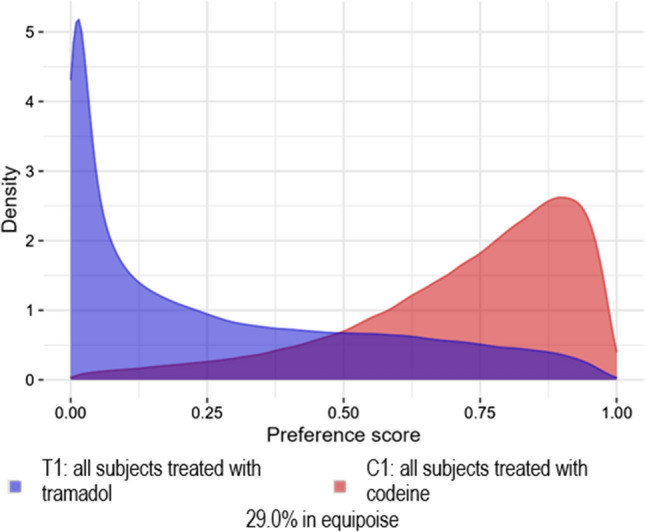
Analysis 202: Wei et al. [6] replication (excluding some variables from the propensity model) preference score distribution for the IBM MarketScan® Medicare Supplemental Database
Analyses 201, 301, and 302 passed the diagnostics, which allowed these estimates to be reported. Analyses 201 (Fig. 4), 301 (Fig. 13 of the ESM), and 302 (Figs. 14–16 of the ESM) demonstrated sufficient between-group equipoise (> 50%). The objective of Analyses 301 and 302 was to make the tramadol and codeine cohorts more similar prior to PS mapping by excluding subjects diagnosed with a cough or cold. In the CPRD database, a small effect of this was observed as the percent in equipoise moved from 72.5% in Analysis 201 to 75.9% in Analysis 301.This effect was more pronounced in the three US claims databases as the percent in equipoise moved from 27.7–38.2% to 51.4–65.9%. The matched populations, Analyses 201, 301, and 302, were well balanced; the covariate balance score both before and after PS stratification are presented in Figs. 17–19 of the ESM.
Fig. 4.
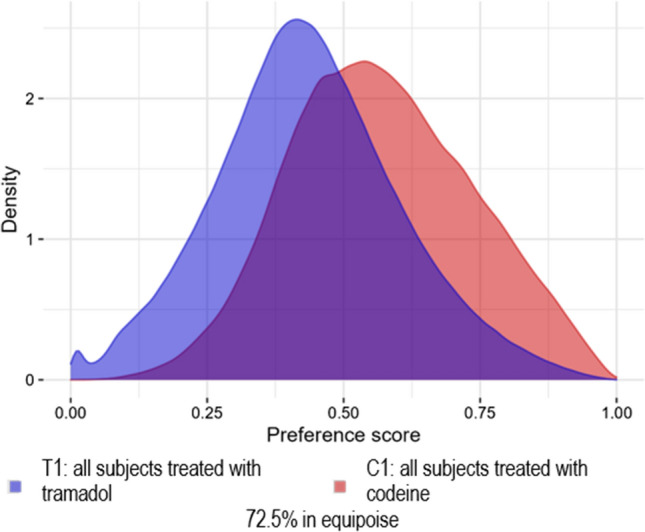
Analysis 201: Wei et al. [6] replication (excluding some variables from the propensity score model) preference score distribution for the Clinical Practice Research Datalink
Subjects
Table 2 shows the number of subjects in each cohort prior to PS matching or implementation of diagnostics. Of note, in data from the USA, tramadol exposures dropped by about 30% in T2 and codeine exposures dropped by about 68% in C2 when subjects were treated for a cough with antibiotics, cold and cough medications, and antihistamines in the last 30 days were excluded.
Table 2.
Number of subjects in target and comparator cohorts before matching
| Cohort | CPRD | MDCR | MDCD | OPTUM_DOD |
|---|---|---|---|---|
| T1 | 166,884 | 381,096 | 111,716 | 948,214 |
| T2 | 139,015 | 283,036 | 72,113 | 684,406 |
| C1 | 1,116,400 | 551,519 | 69,065 | 1,215,785 |
| C2 | 894,883 | 182,930 | 22,720 | 356,804 |
C1 comparator cohort 1: codeine, C2 comparator cohort 2: codeine (excluding cough, antibiotic, cold and cough medications, and antihistamines in last 30 days), CPRD Clinical Practice Research Datalink, MDCD IBM MarketScan® Multi-State Medicaid Database, MDCR IBM MarketScan® Medicare Supplemental Database, T1 target cohort 1: tramadol, T2 target cohort 2: tramadol (exclude cough, antibiotic, cold and cough medications, and antihistamines in last 30 days)
Figure 5a and b, present the attrition diagrams for Analysis 201 and Analysis 301, respectively, based on data from the CPRD. Figure 6a–c present the attrition diagrams for Analysis 302, for the MDCR, MDCD, and OPTUM_DOD databases, respectively. After PS matching, there were 166,082 subjects in the T1 and C1 cohorts in Analysis 201, 138,333 subjects in the T2 and C2 cohorts in Analysis 301, and 119,491 subjects in the MDCR, 18,491 in the MDCD, and 261,462 in the OPTUM_DOD databases in the T2 and C2 cohorts for Analysis 302.
Fig. 5.

Attrition diagram, showing the number of subjects in the target and comparator cohorts after various stages in the analysis. a T1 and C1 and b T2 and C2
Fig. 6.

Attrition diagram showing the number of subjects in the target (T2) and comparator cohorts (C2) by database after various stages of the analysis. a IBM MarketScan® Medicare Supplemental Database, b IBM Multi-State Medicaid Database, and c Optum’s De-identified Clinformatics® Data Mart—Date of Death
Table 3 presents, after PS matching, the number of subjects, person-years at risk, outcome events, and the minimum detectable relative risk for each database, each analysis group, and each TAR. The mean follow-up in years can be derived from Table 3 (). For Analysis 201 (CPRD), the OT analysis was 0.14 for tramadol and 0.13 for codeine and the ITT analysis was 5.85 for tramadol and 5.84 for codeine. The mean follow-up in years for Analysis 301 (CPRD) for the OT analysis was 0.14 for both tramadol and codeine and for the ITT analysis it was 5.94 for both tramadol and codeine. The mean follow-up in years for Analysis 302 for the OT analysis was 0.10, 0.12, and 0.09 for tramadol and 0.05, 0.06, and 0.05 for codeine for the MDCR, MDCD, and OPTUM_DOD databases, respectively. The mean follow-up in years for Analysis 302 for the ITT analysis was 3.67, 3.24, and 3.00 for tramadol and 3.60, 3.00, and 3.02 for codeine for the MDCR, MDCD, and OPTUM_DOD databases, respectively. It is important to note that the ITT analysis in this study included more follow-up time than did Wei et al.’s study [6].
Table 3.
Number of subjects, years followed, and number of outcome events in the target (tramadol) and comparator (codeine) cohorts after propensity score adjustment
| Analysis group | Time-at-risk | Subjects | Time (years) | Outcome events | MDRR | |||
|---|---|---|---|---|---|---|---|---|
| Target | Com. | Target | Com. | Target | Com. | |||
| Analysis 201: replication (assuming some propensity score model exclusions) | ||||||||
| T1 | C1 | T1 | C1 | Outcome O1 | ||||
| T1 | C1 | |||||||
| CPRD | OT | 166,082 | 166,082 | 23,782 | 22,073 | 202 | 165 | 1.34 |
| ITT | 166,082 | 166,082 | 972,351 | 970,046 | 2519 | 2383 | 1.08 | |
| Analysis 301: replication using best practices | ||||||||
|---|---|---|---|---|---|---|---|---|
| T2 | C2 | T2 | C2 | Outcome O2 | ||||
| T2 | C2 | |||||||
| CPRD | OT | 138,333 | 138,333 | 19,907 | 18,688 | 178 | 123 | 1.38 |
| ITT | 138,333 | 138,333 | 821,229 | 821,911 | 2100 | 1987 | 1.09 | |
| Analysis 302: replication using best practices | ||||||||
|---|---|---|---|---|---|---|---|---|
| T2 | C2 | T2 | C2 | Outcome O2 | ||||
| T2 | C2 | |||||||
| MDCR | OT | 119,491 | 119,491 | 11,454 | 6296 | 175 | 108 | 1.40 |
| ITT | 119,491 | 119,491 | 438,135 | 430,662 | 3051 | 2700 | 1.08 | |
| MDCD | OT | 18,491 | 18,491 | 2263 | 1200 | 11 | 8 | 3.62 |
| ITT | 18,491 | 18,491 | 59,906 | 55,512 | 162 | 147 | 1.38 | |
| OPTUM_DOD | OT | 261,462 | 261,462 | 23,546 | 14,198 | 177 | 122 | 1.38 |
| ITT | 261,462 | 261,462 | 783,503 | 789,710 | 3142 | 2991 | 1.07 | |
C1 comparator cohort 1: codeine, C2 comparator cohort 2: codeine (excluding cough, antibiotic, cold and cough medications, and antihistamines in last 30 days), Com. comparator, CPRD Clinical Practice Research Datalink, ITT intent to treat, MDCD IBM MarketScan® Multi-State Medicaid Database, MDCR IBM MarketScan® Medicare Supplemental Database, MDRR minimum detectable relative risk, O1 outcome definition 1: primary hip fracture, O2 outcome definition 2: primary hip fracture emergency room/inpatient diagnosis with hip fracture procedures ± 7 days or primary hip fracture procedures with hip fracture emergency room/inpatient ± 7 days), OPTUM_DOD Optum® De-Identified Clinformatics® Data Mart Database - Date of Death, OT on treatment, T1 target cohort 1: tramadol, T2 target cohort 2: tramadol (exclude cough, antibiotic, cold and cough medications, and antihistamines in last 30 days)
Baseline characteristics of T1 compared with C1 in the CPRD database, before and after large-scale PS stratification are shown in Table 4. Prior to PS matching, the tramadol cohorts had more exposures to drugs from the following categories (as classified by the Anatomical Therapeutic Chemical Classification System) [38]: Antidepressants, Antiepileptics, Anti-inflammatory and Antirheumatic Products, Lipid Modifying Agents, Psycholeptics, and, most notably, Drugs for Acid Related Disorders in the 365 days prior to the index date. Drugs for Acid Related Disorders include omeprazole, pantoprazole, famotidine, ranitidine, esomeprazole, and lansoprazole. Among subjects in the T1 cohort, 42% had exposure to a drug for acid-related disorders prior to the index date compared with 32% in the C1 cohort.
Table 4.
Subject baseline characteristics before and after propensity score adjustment between the target T1 and comparator C1 cohorts from the Clinical Practice Research Datalink database
| Characteristic | Before PS adjustment | After PS adjustment | ||||
|---|---|---|---|---|---|---|
| Target | Com. | Target | Com. | |||
| % | % | SMD | % | % | SMD | |
| Participants (n) | 166,884 | 1,116,400 | – | 166,082 | 166,082 | – |
| Age group, years | ||||||
| 50−54 | 21.0 | 22.2 | − 0.03 | 21.1 | 21.4 | − 0.01 |
| 55−59 | 17.1 | 15.9 | 0.03 | 17.2 | 17.3 | 0.00 |
| 60−64 | 15.6 | 15.4 | 0.01 | 15.6 | 15.4 | 0.00 |
| 65−69 | 13.5 | 13.2 | 0.01 | 13.5 | 13.4 | 0.00 |
| 70−74 | 11.8 | 11.6 | 0.01 | 11.8 | 11.6 | 0.01 |
| 75−79 | 9.9 | 9.9 | 0.00 | 9.9 | 10.0 | 0.00 |
| 80−84 | 7.0 | 7.4 | − 0.01 | 7.0 | 6.9 | 0.00 |
| 85−89 | 4.0 | 4.4 | − 0.02 | 4.0 | 4.0 | 0.00 |
| Sex: female | 56.4 | 55 | 0.03 | 56.3 | 56.1 | 0.00 |
| Medical history: general | ||||||
| Chronic liver disease | 0.1 | 0.1 | 0.02 | 0.1 | 0.1 | 0.00 |
| Chronic obstructive lung disease | 2.1 | 1.8 | 0.03 | 2.1 | 2.1 | 0.00 |
| Crohn's disease | 0.1 | 0.1 | 0.02 | 0.1 | 0.1 | 0.01 |
| Dementia | 0.3 | 0.4 | − 0.02 | 0.3 | 0.3 | 0.00 |
| Depressive disorder | 2.4 | 2.4 | 0.00 | 2.4 | 2.5 | 0.00 |
| Diabetes mellitus | 3.0 | 2.7 | 0.02 | 3.0 | 3.1 | 0.00 |
| Gastroesophageal reflux disease | 0.6 | 0.5 | 0.02 | 0.6 | 0.6 | 0.00 |
| Gastrointestinal hemorrhage | 1.3 | 1.0 | 0.03 | 1.3 | 1.4 | − 0.01 |
| Hyperlipidemia | 1.6 | 1.4 | 0.02 | 1.6 | 1.7 | − 0.01 |
| Hypertensive disorder | 3.7 | 3.9 | − 0.02 | 3.7 | 3.6 | 0.00 |
| Lesion of liver | 0.2 | 0.1 | 0.02 | 0.2 | 0.2 | 0.00 |
| Obesity | 0.5 | 0.4 | 0.01 | 0.5 | 0.5 | 0.00 |
| Osteoarthritis | 7.5 | 6.0 | 0.06 | 7.4 | 7.5 | 0.00 |
| Pneumonia | 0.4 | 0.3 | 0.01 | 0.4 | 0.4 | 0.00 |
| Psoriasis | 0.7 | 0.7 | 0.00 | 0.7 | 0.8 | − 0.01 |
| Renal impairment | 2.7 | 2.1 | 0.04 | 2.7 | 2.8 | − 0.01 |
| Rheumatoid arthritis | 0.4 | 0.3 | 0.03 | 0.4 | 0.5 | 0.00 |
| Ulcerative colitis | 0.1 | 0.1 | 0 | 0.1 | 0.1 | 0.00 |
| Visual system disorder | 7.2 | 7.0 | 0.01 | 7.2 | 7.2 | 0.00 |
| Medical history: cardiovascular disease | ||||||
| Atrial fibrillation | 1.1 | 1.0 | 0.01 | 1.1 | 1.1 | 0.00 |
| Coronary arteriosclerosis | 0.3 | 0.2 | 0.03 | 0.3 | 0.3 | 0.00 |
| Heart disease | 4.8 | 4.0 | 0.04 | 4.8 | 4.8 | 0.00 |
| Heart failure | 0.7 | 0.6 | 0.00 | 0.7 | 0.7 | − 0.01 |
| Ischemic heart disease | 2.4 | 2.0 | 0.03 | 2.4 | 2.4 | 0.00 |
| Peripheral vascular disease | 0.4 | 0.3 | 0.03 | 0.4 | 0.4 | 0.00 |
| Pulmonary embolism | 0.2 | 0.2 | 0.02 | 0.2 | 0.3 | − 0.01 |
| Venous thrombosis | 1.0 | 0.8 | 0.02 | 1.0 | 0.9 | 0.00 |
| Medical history: neoplasms | ||||||
| Malignant neoplastic disease | 0.7 | 0.6 | 0.01 | 0.7 | 0.7 | 0.00 |
| Medication use | ||||||
| Agents acting on the renin-angiotensin system | 28.8 | 25.4 | 0.08 | 28.8 | 28.9 | 0.00 |
| Antibacterials for systemic use | 50.0 | 46.6 | 0.07 | 50.0 | 50.1 | 0.00 |
| Antidepressants | 22.8 | 17.6 | 0.13* | 22.8 | 22.9 | 0.00 |
| Antiepileptic agents | 6.1 | 3.6 | 0.12* | 6.1 | 5.9 | 0.01 |
| Anti-inflammatory and antirheumatic products | 48.2 | 42.4 | 0.12* | 48.2 | 48.8 | − 0.01 |
| Antineoplastic agents | 1.4 | 0.9 | 0.05 | 1.4 | 1.5 | 0.00 |
| Anti-psoriatic agents | 1.2 | 1.1 | 0.01 | 1.2 | 1.3 | 0.00 |
| Antithrombotic agents | 27.7 | 24 | 0.08 | 27.7 | 27.8 | 0.00 |
| Beta-blocking agents | 19.2 | 17.9 | 0.03 | 19.1 | 19.2 | 0.00 |
| Calcium channel blockers | 18.8 | 17.1 | 0.04 | 18.8 | 18.7 | 0.00 |
| Drugs for acid-related disorders | 41.8 | 31.7 | 0.21* | 41.7 | 42.0 | − 0.01 |
| Drugs for obstructive airway diseases | 20.7 | 17.5 | 0.08 | 20.7 | 20.9 | − 0.01 |
| Drugs used in diabetes | 9.0 | 8.0 | 0.04 | 9.0 | 9.2 | − 0.01 |
| Immunosuppressants | 1.7 | 1.0 | 0.06 | 1.7 | 1.7 | 0.00 |
| Lipid-modifying agents | 31.4 | 26.4 | 0.11* | 31.4 | 31.6 | 0.00 |
| Psycholeptic agents | 21.8 | 16.9 | 0.12* | 21.7 | 22.0 | − 0.01 |
| Psychostimulants, agents used for ADHD and nootropics | 0.1 | 0.1 | 0.0 | 0.1 | 0.1 | 0.00 |
ADHD attention-deficit/hyperactivity disorder, C1 comparator cohort 1: codeine, Com. comparator, PS propensity score, SDM standardized mean difference; SMD > 0.1 are highlighted with a *, T1 target cohort 1: tramadol
The baseline characteristics of the T2 cohort compared with the C2 cohort in the CPRD database are shown in Table 5. Prior to PS matching, the T2 cohort had more exposures to Antidepressants, Antiepileptics, Psycholeptics, and Drugs for Acid Related Disorders. Baseline characteristics of the T2 cohort compared with C2, before and after large-scale PS stratification in the MDCR, MDCD, and OPTUM_DOD databases are shown in Tables 11A, B, and C of the ESM, respectively. While there were some slight differences, the results were similar to that found in the CPRD. After PS matching, all characteristics were well balanced, regardless of cohorts being compared or database.
Table 5.
Subject baseline characteristics before and after propensity score adjustment between the target T2 and comparator C2 cohorts from the Clinical Practice Research Datalink database
| Characteristic | Before PS adjustment | After PS adjustment | ||||
|---|---|---|---|---|---|---|
| Target | Com. | Target | Com. | |||
| % | % | SDM | % | % | SDM | |
| Participants (n) | 139,015 | 894,883 | – | 138,333 | 138,333 | – |
| Age group, years | ||||||
| 50–54 | 21.4 | 22.3 | − 0.02 | 21.4 | 21.9 | − 0.01 |
| 55–59 | 17.4 | 16.2 | 0.03 | 17.5 | 17.6 | 0.00 |
| 60–64 | 15.7 | 15.4 | 0.01 | 15.8 | 15.5 | 0.01 |
| 65–69 | 13.4 | 13.2 | 0.01 | 13.4 | 13.2 | 0.00 |
| 70–74 | 11.6 | 11.5 | 0.00 | 11.6 | 11.6 | 0.00 |
| 75–79 | 9.8 | 9.9 | 0.00 | 9.7 | 9.7 | 0.00 |
| 80–84 | 6.9 | 7.3 | − 0.02 | 6.8 | 6.7 | 0.00 |
| 85–89 | 3.8 | 4.3 | − 0.02 | 3.8 | 3.8 | 0.00 |
| Sex: female | 55.8 | 54.3 | 0.03 | 55.7 | 55.6 | 0.00 |
| Medical history: general | ||||||
| Acute respiratory disease | 6.3 | 5.6 | 0.03 | 6.3 | 6.3 | 0.00 |
| Chronic obstructive lung disease | 1.5 | 1.2 | 0.02 | 1.4 | 1.4 | 0.00 |
| Crohn’s disease | 0.1 | 0.1 | 0.01 | 0.1 | 0.1 | 0.00 |
| Dementia | 0.2 | 0.4 | − 0.02 | 0.2 | 0.2 | 0.00 |
| Depressive disorder | 2.3 | 2.3 | 0.00 | 2.3 | 2.4 | 0.00 |
| Gastroesophageal reflux disease | 0.6 | 0.5 | 0.02 | 0.6 | 0.6 | 0.00 |
| Gastrointestinal hemorrhage | 1.2 | 1.0 | 0.02 | 1.2 | 1.2 | 0.00 |
| Hyperlipidemia | 1.6 | 1.4 | 0.02 | 1.6 | 1.6 | 0.00 |
| Hypertensive disorder | 3.7 | 4.0 | − 0.01 | 3.7 | 3.6 | 0.00 |
| Lesion of liver | 0.2 | 0.1 | 0.02 | 0.2 | 0.2 | 0.00 |
| Obesity | 0.5 | 0.4 | 0.01 | 0.5 | 0.5 | 0.00 |
| Pneumonia | 0.3 | 0.2 | 0.01 | 0.3 | 0.3 | 0.00 |
| Psoriasis | 0.7 | 0.7 | 0.00 | 0.7 | 0.7 | 0.00 |
| Renal impairment | 2.5 | 2.0 | 0.04 | 2.5 | 2.5 | 0.00 |
| Rheumatoid arthritis | 0.4 | 0.3 | 0.03 | 0.4 | 0.5 | 0.00 |
| Ulcerative colitis | 0.1 | 0.1 | 0.00 | 0.1 | 0.1 | − 0.01 |
| Urinary tract infectious disease | 2.1 | 1.8 | 0.03 | 2.1 | 2.2 | 0.00 |
| Visual system disorder | 6.9 | 6.7 | 0.01 | 6.9 | 6.8 | 0.00 |
| Medical history: cardiovascular disease | ||||||
| Atrial fibrillation | 1.1 | 1.0 | 0.01 | 1.1 | 1.1 | 0.00 |
| Cerebrovascular disease | 1.0 | 1.0 | 0.00 | 1.0 | 1.1 | 0.00 |
| Coronary arteriosclerosis | 0.3 | 0.1 | 0.03 | 0.3 | 0.3 | 0.00 |
| Heart failure | 0.6 | 0.6 | 0.00 | 0.6 | 0.6 | 0.00 |
| Peripheral vascular disease | 0.4 | 0.3 | 0.03 | 0.4 | 0.4 | 0.00 |
| Pulmonary embolism | 0.2 | 0.1 | 0.02 | 0.2 | 0.2 | − 0.01 |
| Venous thrombosis | 0.9 | 0.7 | 0.02 | 0.9 | 0.9 | 0.00 |
| Medical history: neoplasms | ||||||
| Malignant neoplastic disease | 0.6 | 0.6 | 0.01 | 0.6 | 0.6 | 0.00 |
| Medication use | ||||||
| Antidepressants | 22.1 | 17.1 | 0.13* | 22.1 | 22.4 | − 0.01 |
| Antiepileptic agents | 5.9 | 3.4 | 0.12* | 5.9 | 5.8 | 0.00 |
| Anti-inflammatory and antirheumatic products | 49.1 | 44.6 | 0.09 | 49.1 | 49.3 | 0.00 |
| Antineoplastic agents | 1.4 | 0.9 | 0.05 | 1.4 | 1.4 | 0.00 |
| Antipsoriatic agents | 1.2 | 1.1 | 0.01 | 1.2 | 1.2 | 0.00 |
| Calcium channel blockers | 18.4 | 16.9 | 0.04 | 18.3 | 18.4 | 0.00 |
| Diuretics | 24.3 | 22.3 | 0.05 | 24.3 | 24.1 | 0.00 |
| Drugs for acid-related disorders | 40.4 | 31.3 | 0.19* | 40.3 | 40.8 | − 0.01 |
| Drugs for obstructive airway diseases | 18.1 | 15.2 | 0.08 | 18.1 | 18.2 | 0.00 |
| Drugs used in diabetes | 8.5 | 7.7 | 0.03 | 8.5 | 8.6 | 0.00 |
| Immunosuppressants | 1.6 | 0.9 | 0.06 | 1.6 | 1.6 | 0.00 |
| Lipid-modifying agents | 30.8 | 26.2 | 0.10 | 30.7 | 30.9 | 0.00 |
| Psycholeptic agents | 21.0 | 16.5 | 0.12* | 21.0 | 21.5 | − 0.01 |
| Psychostimulants, agents used for ADHD and nootropics | 0.1 | 0.1 | 0.00 | 0.1 | 0.1 | 0.00 |
ADHD attention-deficit/hyperactivity disorder, C2 comparator cohort 2: codeine (excluding cough, antibiotic, cold and cough medications, and antihistamines in last 30 days), Com. comparator, PS propensity score, Std. diff standardized difference of means, SDM standardized mean difference; SMD >0.1 are highlighted with a *, T2 target cohort 2: tramadol (exclude cough, antibiotic, cold and cough medications, and antihistamines in last 30 days)
Description of Initial Dose
Ensuring that the MME was balanced after PS matching was important to ensure the cohort comparisons were not confounded by differences in exposure. Table 6 presents the first quartile, median, and second quartile for the MME daily dose for both opioids. Before PS matching, the tramadol MME daily dose was higher than the codeine daily dose. However, for the CPRD database, after PS matching, although the tramadol MME dose remained higher, the difference in the median values became smaller. For the US claims data, after PS matching, the median codeine MME daily dose was higher in the MDCR and OPTUM_DOD databases but was lower in the MDCD database.
Table 6.
Initial morphine milligram equivalent daily dose for the target (tramadol) and comparator (codeine) cohorts before and after PS matching
| Before PS matching | After PS matching | ||||
|---|---|---|---|---|---|
| T1 | C1 | T1 | C1 | ||
| CPRD | First quartile | 6.7 | 4.3 | 6.7 | 4.3 |
| Median | 10.7 | 4.8 | 10.7 | 8.0 | |
| Second quartile | 17.9 | 16.1 | 17.9 | 16.1 | |
| T2 | C2 | T2 | C2 | ||
|---|---|---|---|---|---|
| CPRD | First quartile | 7.1 | 4.3 | 7.1 | 4.3 |
| Median | 10.7 | 4.8 | 10.7 | 8.0 | |
| Second quartile | 17.9 | 16.1 | 17.9 | 16.1 | |
| MDCR | First quartile | 15.0 | 12.0 | 15.0 | 13.5 |
| Median | 20.0 | 18.8 | 20.0 | 22.5 | |
| Second quartile | 27.8 | 30.0 | 28.1 | 30.0 | |
| MDCD | First quartile | 15.0 | 9.0 | 15.0 | 12.9 |
| Median | 20.0 | 18.0 | 20.0 | 18.0 | |
| Second quartile | 25.0 | 27.0 | 25.0 | 27.0 | |
| OPTUM_DOD | First quartile | 15.0 | 13.5 | 15.0 | 15.8 |
| Median | 20.0 | 19.3 | 20.0 | 22.5 | |
| Second quartile | 28.6 | 30.0 | 30.0 | 30.0 | |
C1 comparator cohort 1: codeine, C2 comparator cohort 2: codeine (excluding cough, antibiotic, cold and cough medications, and antihistamines in last 30 days), CPRD Clinical Practice Research Datalink, MDCD IBM MarketScan® Multi-State Medicaid Database, MDCR IBM MarketScan® Medicare Supplemental Database, OPTUM_DOD Optum® De-Identified Clinformatics® Data Mart Database - Date of Death, PS propensity score, T1 target cohort 1: tramadol, T2 target cohort 2: tramadol (exclude cough, antibiotic, cold and cough medications, and antihistamines in last 30 days)
For the matched participants, duration of use can be derived from Table 3. By looking at the OT TAR rows by time, the average length of duration can be calculated (). However, there was some censorship of the data (e.g., a subject died, left the database, reached the age of 89 years, reached 365 days after the index date, was exposed to the other opioid of interest, or experienced the outcome of interest). In the CPRD database, both for Analyses 201 and 301, subjects were exposed to tramadol a mean of 52 days and to codeine for 49 days. For Analysis 302, across the US datasets, subjects were exposed to tramadol between 33 and 45 days and to codeine between 19 and 24 days.
Risk of Hip Fracture
The CHRs for the risk of hip fracture after exposure to tramadol or codeine from the CPRD database are presented in Fig. 7, together with the original results from Wei et al. [6]. We observed no significant association between hip fracture and tramadol use in either Analysis 201 (replication assuming some PS model exclusions) or Analysis 301 (replication using best practices). This was regardless of the TAR used.
Fig. 7.

Relative risk of hip fracture for tramadol versus codeine cohorts in the Clinical Practice Research Datalink. The calibrated hazard ratios (HRs), 95% confidence intervals (CI), and p-values are presented for Analyses 201 and 301 and Wei et al. [6]
The CHRs for the risk of hip fracture after exposure to tramadol or codeine for the 3 US claims databases are presented in Fig. 8, together with the original results from Wei et al. [6]. We observed a CHR of 1.10 (95% CCI 0.99–1.21) in the CPRD database, and a pooled estimate across the US databases yielded a CHR of 1.06 (95% CCI 0.97–1.16). These 95% CCI do not rule out a risk ratio of up to 1.16–1.21. In the ITT TAR in Analysis 302 for the MDCR database, we did see a statistically significant calibrated effect of 1.12 (95% CCI 1.01–1.23, p = 0.03). These results did not remain significant in the ITT meta-analysis. In the other analyses, we did not observe a significant association between hip fracture and tramadol use.
Fig. 8.

Relative risk of hip fracture for target (tramadol) and comparator (codeine) cohorts by database (DB: IBM MarketScan® Medicare Supplemental Database [MDCR], IBM Multi-State Medicaid Database [MDCD], Optum’s De-identified Clinformatics® Data Mart—Date of Death [OPTUM_DOD]) and time-at-risk. The calibrated hazard ratios (HRs), 95% confidence intervals (CIs), and p-values are presented for Analysis 302 and Wei et al. [6]
A post hoc analysis was also performed. Although the protocol [18] specified that the results for CPRD would remain separate from those from the US claims databases, a meta-analysis across all the data sources was performed. We observed a CHR of 1.07 (95% CCI 0.99–1.16) when the meta-analysis was performed across all data sources. This 95% CCI do not rule out a risk ratio of up to 1.16.
Discussion
Summary of Results
Hip fractures pose a serious health risk to individuals who experience them [1, 39, 40]. Measures that reduce the risk of hip fracture are therefore important for reducing morbidity and mortality in adult patients. Using real-world data, we conducted three observational studies; a replication study of Wei et al. [6] (Analysis 101, Analysis 102), a second replication that excluded some variables in the PS model (Analysis 201, Analysis 202), and a third analysis that excluded subjects with evidence of a cold and cough in the last 30 days (Analysis 301, Analysis 302). For Analyses 101, 102, and 202, we could not unblind the results because of failed diagnostic tests. For these analyses, the failure was indicative of non-comparable groups. Analyses 201, 301, and 302 passed diagnostics and therefore the results for both TARs could be unblinded. We failed to reject the null hypothesis for all analyses except for 1; in the MDCR ITT analysis, we saw a statistically significant increase in the risk of hip fracture for subjects exposed to tramadol when compared with those exposed to codeine. The meta-analysis, which included this result, did not find a statistically significant increased risk. Additionally, the magnitude of the risk across the unblinded results seems to be less than the previously published work and the OT CCIs even included Wei et al.’s results [6].
While a priori it was not planned to perform a meta-analysis across CPRD and three administrative claims databases from the US results, it was performed as a post hoc analysis. The meta-analysis of the combined data from Analysis 301 (CPRD) and Analysis 302 (US claims) did not reach significance and therefore our interpretation of the results did not change. The forest plot of these results can be found in Fig. 20 of the ESM.
Subject characteristics prior to PS matching suggest that the tramadol group was systematically different from the codeine group (Tables 3A–B, Tables 11A–C of the ESM). These differences may be because anti-inflammatory, antirheumatic, and antiepileptic drugs [41] are often prescribed for severe and/or chronic pain; tramadol, per its indication, is used for moderate to severe chronic pain, while codeine is indicated for mild to moderate pain [42–45]. Psycholeptics, which include anxiolytics, antipsychotics, hypnotics, and sedatives, are used to treat depression, anxiety, and insomnia, all of which are common among patients with chronic moderate to severe pain [46–53]. Thus, higher rates of these medications would be expected in the tramadol cohort as these subjects are more likely to have a higher burden of chronic moderate to severe pain than subjects in the codeine cohort. Gastroesophageal reflux disease is common with long-term exposure to anti-inflammatory medications, which the tramadol cohort had more exposures to, and this could explain why there was more exposure to this drug class [54, 55]. Patients with osteoarthritis are more likely to be prescribed tramadol over codeine as clinical practice guidelines have favored its use for osteoarthritis of the knee [56, 57].
A priori, we expected that before PS matching, the exclusion of cough-related factors prior to the index date would make the tramadol and codeine cohorts more similar; however, within the CPRD database, these exclusions did not lead to substantially different reductions in the two cohorts (the tramadol cohort was reduced by 17% and the codeine cohort was reduced by 20%). By contrast, within the US claims databases, these exclusions caused a 68% decrease in the codeine cohorts with a 30% decrease in the tramadol cohorts. This substantial decrease may be indicative of codeine treatment for a cold and cough.
In addition to performing different analyses of the tramadol and codeine cohorts, we also accounted for unmeasured confounding using negative controls. In our analyses, the negative controls did not show much residual systematic bias, thus suggesting that after PS matching, there was little remaining systematic error to adjust for.
As noted above, we had concerns about whether the extent of exposure to tramadol was similar to codeine. Within the CPRD database, we saw a difference in the total daily dose MMEs. Before PS matching, regardless of the cohort type, the median MME for tramadol was 10.7 mg and 4.8 mg for codeine. After matching, the difference between the doses decreased (10.7 mg for tramadol and 8.0 mg for codeine). Within the US claims data, before PS matching, we observed that the tramadol total daily dose MMEs were slightly higher than the codeine total daily dose MMEs. After PS matching, the codeine MME was slightly higher for the MDCR and OPTUM_DOD databases but remained the same for MDCD. However, for both the CPRD and US claims analysis, the clinical differences before and after PS matching were negligible considering the starting dose of oral morphine ranges from 10 mg to 30 mg every 4 hours in opioid-naïve patients [58]. Thus, our a priori concern that there may be substantial difference between the tramadol and codeine MME was not validated regardless of database or analysis.
Strengths and Limitations
The analyses described in this study employed large-scale PS adjustments with full diagnostics and negative controls. This strategy ensured balance across any baseline confounders. The study protocol and code were published prior to study implementation and the results were kept blinded until after the diagnostics were reviewed. These approaches were implemented to address concerns of reproducibility and transparency.
Though our retrospective observational study sought to address potential confounders with multiple cohort and study designs, PS matching, and calibration through use of negative controls, there is still the potential for residual bias owing to unmeasured and mis-specified confounders. For example, cytochrome P450 2D6 metabolizer status is not captured in the databases and may be imbalanced between the tramadol and codeine cohorts, which could significantly impact the effects of the opioids by altering the degree of exposure to potent metabolites. Another potential limitation is that we did not look for subjects with a specific indication prior to exposure, and therefore there was a potential for residual confounding by indication in the analyses. Additionally, our definition of new users of tramadol or codeine does not guarantee the subjects have never taken these, as the maximum time period before the index date was 365 days. The alternative, require no prior exposure ever, still will not rule out an exposure before the index date as we may not have a subject’s complete history. Further, this requirement would have an additional drawback of applying different criteria to people who joined the practice in the distant past versus people who join recently. A final limitation to consider is that the indication is not provided by the databases and causality between drug exposure and any given event cannot be drawn for an individual case.
There are also specific limitations that apply to our use of the CPRD database. For example, in the UK, it is possible to purchase codeine-containing products over the counter and therefore we may not have an accurate measure of codeine exposure. However, to our knowledge, it is not possible to purchase products containing codeine in the USA, thus this limitation would not impact those data. Additionally, the CPRD is a general practitioner centric database and, though some hospitalization data are recorded by the general practitioner, they are incomplete. We did not request the CPRD Hospital Episode Statistics linkage data for this analysis.
Clinical Implications and Conclusions
Our study did not find a statistically significant increased risk of hip fracture in subjects treated with tramadol compared with codeine. We believe that comparing tramadol with codeine without accounting for differences between the groups would not allow us to accurately compare the two drugs; diagnostic failures of Analyses 101, 102, and 202 support this. We suggest that at least part of the increased risk in the tramadol cohort was related to the different indications of the two opioids, which could significantly affect baseline comparability between the cohorts. In the future, comparisons of tramadol versus another weak opioid with a similar indication should be considered to assess if there is an increased risk of hip fracture associated with the drug. In conclusion, for the outcome hip fracture risk after exposure, our results did not demonstrate a statistically significant difference between subjects treated for pain with tramadol versus codeine. Lack of a statistically significant increase in risk does not preclude an association between tramadol and the risk of hip fracture. As with all opioids, tramadol-containing products should be used with caution and physicians should evaluate their appropriateness based on patients’ needs using the best clinical judgment.
Supplementary Information
Below is the link to the electronic supplementary material.
Acknowledgements
Editorial support was provided by Mary Burder, PhD, of Parexel International.
Declarations
Funding
This study was funded by Janssen Research & Development, LLC.
Conflicts of Interest/Competing Interests
Erica A. Voss, Saberi Rana Ali, Arum Singh, and Martijn J. Schuemie are employees of Janssen Research and Development LLC and shareholders of Johnson & Johnson (J&J) stock. Daniel Fife, at the time of this research, was also an employee Janssen Research and Development LLC and shareholder of J&J stock; however, he has since retired. Peter R. Rijnbeek is an employee of an institution that receives/received research grants from Janssen Research and Development LLC. J&J subsidiary companies market both tramadol-containing and codeine-containing products.
Ethics Approval
This study utilized data from the CPRD obtained under license from the UK Medicines and Healthcare Products Regulatory Agency. However, the interpretation and conclusions contained in this study are those of the authors alone. The protocol for this study (reference # 20_173) was approved by the Independent Scientific Advisory Committee. This protocol was also submitted to the European Network of Centres for Pharmacoepidemiology and Pharmacovigilance (ENCePP) and was approved (ENCePP reference ID, EUPAS36038) [19]. The New England Institutional Review Board determined that studies conducted in MDCR, MDCD, and OPTUM_DOD were exempt from study-specific institutional review board review, as these studies do not qualify as human subject research.
Consent to Participate
Not applicable.
Consent for Publication
Not applicable.
Availability of Data and Material
The data that support the findings of this study are available to license from IBM, Optum, and CPRD. Data are available from IBM at https://www.ibm.com/products/marketscan-research-databases, from Optum at https://www.optum.com/business/solutions/life-sciences/real-world-data.html, and from CPRD at https://www.cprd.com/.
Code Availability
The protocol and code are publicly available on GitHub (https://github.com/ohdsi-studies/TramadolVsCodeineForHipFracture).
Authors’ Contributions
DF was responsible for conceptualization of this work. EAV was responsible for data curation and performing the formal analysis. EAV, SRA, AS, PRR, MJS, and DF contributed to development of the methodology. EAV was the project manager and performed all the programming while SRA, AS, PRR, MJS, and DF supervised the work. EAV generated all images and developed the original draft. EAV, SRA, AS, PRR, MJS, and DF were involved with reviewing and editing the publication. All authors read and approved the final version.
Footnotes
Daniel Fife: Retired.
References
- 1.Ray WA, Griffin MR, Fought RL, et al. Identification of fractures from computerized Medicare files. J Clin Epidemiol. 1992;45(7):703–714. doi: 10.1016/0895-4356(92)90047-q. [DOI] [PubMed] [Google Scholar]
- 2.Bhandari M, Swiontkowski M. Management of acute hip fracture. N Engl J Med. 2017;377(21):2053–2062. doi: 10.1056/NEJMcp1611090. [DOI] [PubMed] [Google Scholar]
- 3.Braithwaite RS, Col NF, Wong JB. Estimating hip fracture morbidity, mortality and costs. J Am Geriatr Soc. 2003;51(3):364–370. doi: 10.1046/j.1532-5415.2003.51110.x. [DOI] [PubMed] [Google Scholar]
- 4.Cooper C, Campion G, Melton LJ., 3rd Hip fractures in the elderly: a world-wide projection. Osteoporos Int. 1992;2(6):285–289. doi: 10.1007/bf01623184. [DOI] [PubMed] [Google Scholar]
- 5.Veronese N, Maggi S. Epidemiology and social costs of hip fracture. Injury. 2018;49(8):1458–1460. doi: 10.1016/j.injury.2018.04.015. [DOI] [PubMed] [Google Scholar]
- 6.Wei J, Lane NE, Bolster MB, et al. Association of tramadol use with risk of hip fracture. J Bone Miner Res. 2020;35(4):631–640. doi: 10.1002/jbmr.3935. [DOI] [PMC free article] [PubMed] [Google Scholar]
- 7.US National Library of Medicine. ULTRAM: tramadol hydrochloride tablet, coated. 2020. https://dailymed.nlm.nih.gov/dailymed/drugInfo.cfm?setid=45f59e6f-1794-40a4-8f8b-3a9415924468. Accessed 16 Dec 2020.
- 8.Trescot AM, Datta S, Lee M, et al. Opioid pharmacology. Pain Physician. 2008;11(2 Suppl.):S133–S153. doi: 10.36076/ppj.2008/11/S133. [DOI] [PubMed] [Google Scholar]
- 9.Gillson A-M. Pulmonary medicine. In: Hui D, Leung AA, Padwal R, editors. Approach to internal medicine: a resource book for clinical practice. Cham: Springer International Publishing; 2016. pp. 1–26. [Google Scholar]
- 10.Hassamal S, Miotto K, Dale W, et al. Tramadol: understanding the risk of serotonin syndrome and seizures. Am J Med. 2018;131(11):1382.e1–6. doi: 10.1016/j.amjmed.2018.04.025. [DOI] [PubMed] [Google Scholar]
- 11.Fricke JR, Jr, Hewitt DJ, Jordan DM, et al. A double-blind placebo-controlled comparison of tramadol/acetaminophen and tramadol in patients with postoperative dental pain. Pain. 2004;109(3):250–257. doi: 10.1016/j.pain.2004.01.004. [DOI] [PubMed] [Google Scholar]
- 12.Altis K, Schmidtko A, Angioni C, et al. Analgesic efficacy of tramadol, pregabalin and ibuprofen in menthol-evoked cold hyperalgesia. Pain. 2009;147(1–3):116–121. doi: 10.1016/j.pain.2009.08.018. [DOI] [PubMed] [Google Scholar]
- 13.Brouquet A, Cudennec T, Benoist S, et al. Impaired mobility, ASA status and administration of tramadol are risk factors for postoperative delirium in patients aged 75 years or more after major abdominal surgery. Ann Surg. 2010;251(4):759–765. doi: 10.1097/SLA.0b013e3181c1cfc9. [DOI] [PubMed] [Google Scholar]
- 14.US Food and Drug Administration. Drugs@FDA: FDA-approved drugs: New Drug Application (NDA): 020281 - ULTRAM. Available from: https://www.accessdata.fda.gov/scripts/cder/daf/index.cfm?event=overview.process&ApplNo=020281. [Accessed 3 Apr 2022].
- 15.US Food and Drug Administration. Drugs@FDA: FDA-approved drugs: Abbreviated New Drug Application (ANDA): 085055-TYLENOL W/CODEINE. 2022. https://www.accessdata.fda.gov/scripts/cder/daf/index.cfm?event=overview.process&ApplNo=085055. Accessed 3 Apr 2022.
- 16.Weinstein RB, Ryan P, Berlin JA, et al. Channeling in the use of nonprescription paracetamol and ibuprofen in an electronic medical records database: evidence and implications. Drug Saf. 2017;40(12):1279–1292. doi: 10.1007/s40264-017-0581-7. [DOI] [PMC free article] [PubMed] [Google Scholar]
- 17.Ryan PB, Schuemie MJ, Gruber S, et al. Empirical performance of a new user cohort method: lessons for developing a risk identification and analysis system. Drug Saf. 2013;36(Suppl. 1):S59–72. doi: 10.1007/s40264-013-0099-6. [DOI] [PubMed] [Google Scholar]
- 18.GitHub. Comparing the estimated risk of hip fracture among subjects exposed to tramadol as compared to subjects exposed to codeine. 2021. https://github.com/ohdsi-studies/TramadolVsCodeineForHipFracture. Accessed 2 Mar 2021.
- 19.EUPAS36038: comparing the estimated risk of hip fracture among subjects exposed to tramadol as compared to subjects exposed to codeine. 2020. http://www.encepp.eu/encepp/viewResource.htm?id=36039. Accessed 29 Jul 2020.
- 20.Hripcsak G, Duke JD, Shah NH, et al. Observational Health Data Sciences and Informatics (OHDSI): opportunities for observational researchers. Stud Health Technol Inform. 2015;216:574–578. [PMC free article] [PubMed] [Google Scholar]
- 21.Voss EA, Makadia R, Matcho A, et al. Feasibility and utility of applications of the common data model to multiple, disparate observational health databases. J Am Med Inform Assoc. 2015;22(3):553–564. doi: 10.1093/jamia/ocu023. [DOI] [PMC free article] [PubMed] [Google Scholar]
- 22.GitHub IO. Janssen CDM documentation. 2021. https://ohdsi.github.io/ETL-LambdaBuilder/. Accessed 24 Jun 2021.
- 23.Berry SD, Zhu Y, Choi H, et al. Diuretic initiation and the acute risk of hip fracture. Osteoporos Int. 2013;24(2):689–695. doi: 10.1007/s00198-012-2053-3. [DOI] [PMC free article] [PubMed] [Google Scholar]
- 24.Nair SS, Lenihan CR, Montez-Rath ME, et al. Temporal trends in the incidence, treatment and outcomes of hip fracture after first kidney transplantation in the United States. Am J Transplant. 2014;14(4):943–951. doi: 10.1111/ajt.12652. [DOI] [PMC free article] [PubMed] [Google Scholar]
- 25.Schuemie MJ, Ryan PB, DuMouchel W, et al. Interpreting observational studies: why empirical calibration is needed to correct p-values. Stat Med. 2014;33(2):209–218. doi: 10.1002/sim.5925. [DOI] [PMC free article] [PubMed] [Google Scholar]
- 26.Voss EA, Boyce RD, Ryan PB, et al. Accuracy of an automated knowledge base for identifying drug adverse reactions. J Biomed Inform. 2017;66:72–81. doi: 10.1016/j.jbi.2016.12.005. [DOI] [PMC free article] [PubMed] [Google Scholar]
- 27.Boyce RD, Ryan PB, Norén GN, et al. Bridging islands of information to establish an integrated knowledge base of drugs and health outcomes of interest. Drug Saf. 2014;37(8):557–567. doi: 10.1007/s40264-014-0189-0. [DOI] [PMC free article] [PubMed] [Google Scholar]
- 28.Schuemie MJ, Hripcsak G, Ryan PB, et al. Empirical confidence interval calibration for population-level effect estimation studies in observational healthcare data. Proc Natl Acad Sci U S A. 2018;115(11):2571–2577. doi: 10.1073/pnas.1708282114. [DOI] [PMC free article] [PubMed] [Google Scholar]
- 29. OHDSI. The book of Observational Health Data Sciences and Informatics (OHDSI). Observational Health Data Sciences and Informatics (OHDSI). 2019.https://ohdsi.github.io/TheBookOfOhdsi/2022.06.22.
- 30.Suchard MA, Simpson SE, Zorych I, et al. Massive parallelization of serial inference algorithms for a complex generalized linear model. ACM Trans Model Comput Simul. 2013;23:1. doi: 10.1145/2414416.2414791. [DOI] [PMC free article] [PubMed] [Google Scholar]
- 31.Tian Y, Schuemie MJ, Suchard MA. Evaluating large-scale propensity score performance through real-world and synthetic data experiments. Int J Epidemiol. 2018;47(6):2005–2014. doi: 10.1093/ije/dyy120. [DOI] [PMC free article] [PubMed] [Google Scholar]
- 32.Austin PC. Optimal caliper widths for propensity-score matching when estimating differences in means and differences in proportions in observational studies. Pharm Stat. 2011;10(2):150–161. doi: 10.1002/pst.433. [DOI] [PMC free article] [PubMed] [Google Scholar]
- 33.Walker A, Patrick A, Lauer M, et al. A tool for assessing the feasibility of comparative effectiveness research. Comp Effect Res. 2013;3:11–12. doi: 10.2147/CER.S40357. [DOI] [Google Scholar]
- 34.Austin PC. Balance diagnostics for comparing the distribution of baseline covariates between treatment groups in propensity-score matched samples. Stat Med. 2009;28(25):3083–3107. doi: 10.1002/sim.3697. [DOI] [PMC free article] [PubMed] [Google Scholar]
- 35.Centers for Medicare & Medicaid Services (CMS). Opioid oral morphine milligram equivalent (MME) conversion factors. 2020. https://www.cms.gov/Medicare/Prescription-Drug-Coverage/PrescriptionDrugCovContra/Downloads/Oral-MME-CFs-vFeb-2018.pdf. Accessed 25 Sep 2020.
- 36.GitHub. Janssen CDM documentation: CDM table name: stem_table: reading from CPRD. Therapy. 2020. https://ohdsi.github.io/ETL-LambdaBuilder/CPRD/CPRD_Therapy_STEM.html. Accessed 11 Oct 2020.
- 37.Matcho A, Ryan P, Fife D, et al. Fidelity assessment of a clinical practice research datalink conversion to the OMOP common data model. Drug Saf. 2014;37(11):945–959. doi: 10.1007/s40264-014-0214-3. [DOI] [PMC free article] [PubMed] [Google Scholar]
- 38.WHO Collaborating Centre for Drug Statistics Methodology. ATC: structure and principles. 2018. https://www.whocc.no/atc/structure_and_principles/. Accessed 17 Jan 2021.
- 39.Wolinsky FD, Fitzgerald JF, Stump TE. The effect of hip fracture on mortality, hospitalization, and functional status: a prospective study. Am J Public Health. 1997;87(3):398–403. doi: 10.2105/ajph.87.3.398. [DOI] [PMC free article] [PubMed] [Google Scholar]
- 40.Bentler SE, Liu L, Obrizan M, et al. The aftermath of hip fracture: discharge placement, functional status change, and mortality. Am J Epidemiol. 2009;170(10):1290–1299. doi: 10.1093/aje/kwp266. [DOI] [PMC free article] [PubMed] [Google Scholar]
- 41.Hepner S, Claxton R. Anti-epileptic drugs for pain #271. J Palliat Med. 2013;16(7):799–800. doi: 10.1089/jpm.2013.9497. [DOI] [PubMed] [Google Scholar]
- 42.Janssen R&D, LLC. ULTRAM® (tramadol hydrochloride) tablets, for oral use, C-IV. 2021. https://www.janssenlabels.com/package-insert/product-monograph/prescribing-information/ULTRAM-pi.pdf. Accessed 21 Feb 2022.
- 43.Electronic Medicines Compendium (emc). Zydol 50 mg capsules. 2021. https://www.medicines.org.uk/emc/product/81/smpc. Accessed 21 Feb 2022.
- 44.US Food and Drug Administration. Butalbital, acetaminophen, caffeine, and codeine phosphate capsules for oral use, CIII. 2019. https://www.accessdata.fda.gov/drugsatfda_docs/label/2019/020232s044lbl.pdf. Accessed 21 Feb 2022.
- 45.Electronic Medicines Compendium (emc). Codeine phosphate 15mg tablets. 2020. https://www.medicines.org.uk/emc/product/11268/smpc. Accessed 21 Feb 2022.
- 46.Ho PT, Li CF, Ng YK, et al. Prevalence of and factors associated with psychiatric morbidity in chronic pain patients. J Psychosom Res. 2011;70(6):541–547. doi: 10.1016/j.jpsychores.2010.10.006. [DOI] [PubMed] [Google Scholar]
- 47.Proctor SL, Estroff TW, Empting LD, et al. Prevalence of substance use and psychiatric disorders in a highly select chronic pain population. J Addict Med. 2013;7(1):17–24. doi: 10.1097/ADM.0b013e3182738655. [DOI] [PubMed] [Google Scholar]
- 48.Poole H, White S, Blake C, et al. Depression in chronic pain patients: prevalence and measurement. Pain Pract. 2009;9(3):173–180. doi: 10.1111/j.1533-2500.2009.00274.x. [DOI] [PubMed] [Google Scholar]
- 49.Sagheer MA, Khan MF, Sharif S. Association between chronic low back pain, anxiety and depression in patients at a tertiary care centre. J Pak Med Assoc. 2013;63(6):688–690. [PubMed] [Google Scholar]
- 50.McWilliams LA, Cox BJ, Enns MW. Mood and anxiety disorders associated with chronic pain: an examination in a nationally representative sample. Pain. 2003;106(1–2):127–133. doi: 10.1016/s0304-3959(03)00301-4. [DOI] [PubMed] [Google Scholar]
- 51.McWilliams LA, Goodwin RD, Cox BJ. Depression and anxiety associated with three pain conditions: results from a nationally representative sample. Pain. 2004;111(1–2):77–83. doi: 10.1016/j.pain.2004.06.002. [DOI] [PubMed] [Google Scholar]
- 52.Taylor DJ, Mallory LJ, Lichstein KL, et al. Comorbidity of chronic insomnia with medical problems. Sleep. 2007;30(2):213–218. doi: 10.1093/sleep/30.2.213. [DOI] [PubMed] [Google Scholar]
- 53.Husak AJ, Bair MJ. Chronic pain and sleep disturbances: a pragmatic review of their relationships, comorbidities, and treatments. Pain Med. 2020;21(6):1142–1152. doi: 10.1093/pm/pnz343. [DOI] [PubMed] [Google Scholar]
- 54.Kwok K, Tejani A. Assessing the need for proton pump inhibitors for patients using long-term nonsteroidal anti-inflammatory drugs without a history of ulcers. Can J Hosp Pharm. 2020;73(3):216–217. [PMC free article] [PubMed] [Google Scholar]
- 55.Gwee KA, Goh V, Lima G, et al. Coprescribing proton-pump inhibitors with nonsteroidal anti-inflammatory drugs: risks versus benefits. J Pain Res. 2018;11:361–374. doi: 10.2147/JPR.S156938. [DOI] [PMC free article] [PubMed] [Google Scholar]
- 56.Hochberg MC, Altman RD, April KT, et al. American College of Rheumatology 2012 recommendations for the use of nonpharmacologic and pharmacologic therapies in osteoarthritis of the hand, hip, and knee. Arthritis Care Res (Hobok) 2012;64(4):465–474. doi: 10.1002/acr.21596. [DOI] [PubMed] [Google Scholar]
- 57.Jevsevar DS. Treatment of osteoarthritis of the knee: evidence-based guideline. J Am Acad Orthop Surg. 2013;21(9):571–576. doi: 10.5435/jaaos-21-09-571. [DOI] [PubMed] [Google Scholar]
- 58.Prescribers' Digital Reference. Morphine sulfate: drug summary. 2020. https://www.pdr.net/drug-summary/Morphine-Sulfate-Oral-Solution-morphine-sulfate-1228.8394. Accessed 9 Dec 2020.
Associated Data
This section collects any data citations, data availability statements, or supplementary materials included in this article.