

Abstract
Recombinant adeno-associated viruses (rAAV) are used extensively as gene delivery vectors in clinical studies, and several rAAV based treatments have already been approved. Significant progress has been made in rAAV manufacturing; however, better and more precise capsid characterization techniques are still needed to guarantee the purity and safety of rAAV preparations. Current analytical techniques used to characterize rAAV preparations are susceptible to background signals, have limited accuracy, or require a large amount of time and material. A recently developed single-molecule technique, mass photometry (MP), measures mass distributions of biomolecules with high resolution and sensitivity. Here we explore applications of MP for the characterization of capsid fractions. We demonstrate that MP is able to resolve and quantify not only empty and full-genome containing capsid populations, but also identify partially packaged capsid impurities. MP data accurately measures full and empty capsid ratios, and can be used to estimate the size of the encapsidated genome. MP distributions provide information on sample heterogeneity and on the presence of aggregates. Sub-picomole quantities of sample are sufficient for MP analysis, and data can be obtained and analyzed within minutes. This method provides a simple, robust, and effective tool to monitor physical attributes of rAAV vectors.
Introduction
Adeno-associated viruses (AAVs) are small viruses that infect humans and non-human primates. Several features make recombinant AAVs (rAAVs) attractive as a tool for gene therapy applications. AAVs lack pathogenicity, their replication depends on coinfection with a helper virus, and they can carry their genetic material to both dividing and quiescent cells [1, 2]. The first rAAV based therapy was approved by the US Food and Drug Administration in 2012, and five viral vector treatments are currently available [3]. There are also over 200 ongoing clinical trials for various rAAV based gene therapies [4]. The increasing demand for rAAVs for both laboratory [5, 6] and clinical applications accelerated the development of new techniques for rAAV production and characterization. Considerable progress has been made in the large-scale production and purification of the rAAV vectors, but there is still a need for new analytical methods to characterize and quantify rAAV preparations. Complex biotherapeutic products are inherently heterogenous and difficult to characterize, but gene therapy vectors pose additional unique challenges. One of them is the high complexity of viral vectors, consisting of the protein capsid assembly and the DNA genome. Particularly challenging is the presence of impurities that closely resemble the desired product, namely: empty capsids, and capsids carrying nucleic acid impurities. An ideal analytical method should be able to overcome those challenges, obtain data quickly and with minimal sample consumption, and deliver robust results that can be validated and standardized to meet biotherapeutic production regulatory requirements.
The wild-type AAV contains a single-stranded DNA (ssDNA) approximately 4.7 kb long, encoding the replication and encapsidation genes, flanked by inverted terminal repeats (ITRs) [7, 8]. The AAV genome is contained within an approximately 26 nm diameter capsid, consisting of 60 protein molecules [9, 10]. rAAVs have the same capsid structure, but the replication and encapsidation genes are removed, and the gene of interest is inserted between the ITRs. During the virion assembly, the DNA genome is inserted into the preassembled capsid. Consequently, besides the properly assembled virions, the final product can also contain non-genome-containing particles (empty capsids) and vectors containing incomplete portions of the genome or nongenomic nucleic acid contaminants [11, 12]. Depending on the particular vector production method and the product type, empty capsids concentration can be over 20-times higher than the genome containing vectors [13]. The effect of empty capsid impurities on the gene therapy clinical outcomes is not fully understood [14, 15], but there is little doubt that the development of reliable methods for precise characterization of all viral product impurities is critically important.
Over the years, several techniques have been applied for rAAV product characterization [16]. Technologies previously validated for other biologics can be used for the analysis of some rAAV impurities, such as the residual host cell protein contamination, but often are not able to detect and quantify the empty and partially filled capsid populations. In particular, diffusion-based methods, such as size exclusion chromatography or dynamic light scattering, are not suitable for vector packing efficiency determination since both the empty capsids and the full vectors have identical geometric size. Typically, the ratio of empty to full virions is assessed by negative-stain transmission electron microscopy (TEM), optical density measurements, or by the combination of quantitative PCR (qPCR) and ELISA [17–19]. Despite their routine use, all three methods tend to be imprecise, and none of the three are able to reliably quantify the partially filled virions. Improved implementations of those methods have been developed: for example, the combination of UV measurements with multi-angle light scattering and size exclusion chromatography (SEC-UV-MALS) reduces background contributions [20], and Cryo-electron microscopy (CryoEM) eliminates negative staining [21]. Neither SEC-UV-MALS nor CryoEM, however, are sensitive to the partially filled virion populations. Ion-exchange chromatography has been successfully applied to separate empty and full vectors [13, 22] and its scalability makes it particularly useful for the empty vector removal in the rAAV production process. However, ion-exchange chromatography does not usually have a high enough resolution to analyze the partially filled populations.
The two currently available methods effective in the detection and quantification of all viral fractions, including the empty, partially filled, and full capsids, are analytical ultracentrifugation (AUC), and charge detection mass spectrometry (CDMS) [16, 23, 24]. AUC provides a high degree of resolution of viral species based on differences in their buoyant masses. Additionally, the optical density and refractive index detection systems of the analytical ultracentrifuge allow for the estimation of the protein to DNA ratio for all viral species. Neither AUC nor CDMS are widely used due to the large amount of sample and long analysis time required by AUC and the lack of commercial instrument availability of CDMS.
Here, we apply mass photometry (MP), a recently developed single-molecule technique [25, 26], to the analysis of the rAAV preparations. MP detects unmodified molecules in solution when they land on the surface of a microscope coverslip. The local contrast changes in the microscope image that originate from the light scattered by individual molecules are measured by the camera (supplementary Fig. S1). This signal is proportional to the molecular masses of the scattering particles. MP analysis yields the particle mass distribution histogram, comprised of hundreds to thousands of data points representing individually detected molecules. To date, MP has been used for the analysis of proteins and their complexes [27–30], as well as larger structures, including protein cages and viral capsids [31–33]. MP can detect molecules in the molecular mass range from approximately 40 kDa to 10 MDa. A typical measurement requires only 10 μl of sample volume at a concentration of approximately 20 nM, and data acquisition and analysis can be completed in less than 5 minutes. This combination of sensitivity and speed makes MP a potentially very attractive tool for the assessment of purity, composition, and homogeneity of the rAAV preparations.
To test MP performance, and to assess the quality of the mass photometry rAAV data, we conducted a detailed study evaluating a variety of rAAV samples and validated the MP results with sedimentation velocity AUC (SV-AUC) analysis. Highly purified rAAVs with different genome sizes and empty capsid preparations were used to test MP resolution, repeatability, and the ability to quantify the sample fractional content. Partially purified commercial rAAV preparations were tested to assess the information content of the MP distributions for more complex, lower purity samples. Overall, this data provides a critical evaluation and validation of MP as a rAAV analysis method.
Materials and Methods
Production and purification of rAAV vectors
The rAAV8 vectors were obtained by the calcium phosphate transfection method as described previously [34]. Briefly, the HEK293 cells (ATCC CRL-1573; ATCC, Manassas, VA, USA) were seeded in vented cap roller bottles (850 cm2; Corning, New York, NY, USA) and transfected with 150 μg each of the three plasmids: ITR-containing vector plasmid, Adenoviral helper plasmid for AAV replication, and the AAV replication/capsid proteins plasmid. The vector-containing cells were harvested after 48 hours and disrupted by microfluidization (model HC 2000; Microfluidics Corporation, Newton, MA, USA). After a series of centrifugation steps to eliminate the tissue debris, the supernatant was digested with Benzonase (100 U/ml). Vector particles were congregated with 8% polyethylene glycol 8000 and dissolved in HEPES buffer with RNase A (50 mM HEPES, 150 mM NaCl, 20 mM EDTA, 1% Sarkosyl, pH 8.0, 10 μg/ml RNase A). A cesium chloride step gradient followed by ultracentrifugation was performed to purify the vector-containing dissolvent. Bands containing vector fractions were identified by visual inspection, drawn using 18-gauge hypodermic needle, diafiltered against Tris-buffered saline (10 mM Tris-Cl, 180 mM NaCl, pH 7.4) with 0.001% Pluronic F68, and stored at −80°C. The vector genome titers were determined by qPCR using primers against the promoters or by the SDS-PAGE with Silver staining. The scAAV5-hSyn-GFP and scAAV5-CMV-GFP vectors were obtained from Virovek (Hayward, CA, USA) and used without further purification.
Concentration determination of the rAAV stocks
To prepare mixtures with precisely defined fractions of the empty and full capsids (rAAV8 and rAAV8-CMV-EGFP, respectively), the UV absorbance of the purified vector stocks was acquired using a NanoDrop-2000 spectrophotometer (Thermofisher, Wattham, MA, USA). The extinction coefficient of AAV capsids is 6.61 ×10⁶ M−1cm−1 at 280 nm (εcap280), and 3.72 ×10⁶ M−1cm−1 at 260 nm (εcap260), respectively. Similarly, the extinction coefficients of DNA molecules is 11.1 g−1cm−1 at 280 nm (εDNA280), and 20 g−1cm−1 at 260 nm (εDNA260), respectively [19]. The observed absorbance values are given by:
where ccap is the capsid molar concentration and wDNA is the w/v concentration of the DNA. The average values of 3.74 MDa for the AAV capsid mass, and 650 Da for the DNA base pair molecular mass, respectively, were used for the vector particle concentration calculations.
Mass Photometry measurements
The MP experiments were performed at room temperature using the OneMP instrument (Refeyn, Oxford, UK) following the standard protocol [35]. The 24×50 mm microscope coverslips (Fisher Scientific, Waltham, MA, USA) were prepared by cleaning with MilliQ water and isopropanol, and drying under a stream of clean nitrogen, as described previously [36]. A piece of clean, precut 2×2-well culturewell gasket (GBL103250, Sigma, MO, USA) was attached to the coverslip. The rAAV stocks’ concentrations were measured by the UV absorbance and diluted in PBS to a concentration of about 1011 virus particles per milliliter. This concentration was high enough to provide a high frequency of landing events without producing a large number of landing event overlaps that would degrade the data quality (Supplementary Table S1) [35]. All samples and stock solutions were carefully re-mixed just before use to assure sample homogeneity. Ten microliters of the filtered PBS buffer were loaded into a well of the culturewell gasket, and, after MP focusing, a 10 μl of rAAV sample was added into the same well. Immediately after the solution was mixed by pipetting, a 2 min video was recorded using the AcquireMP (Refeyn, Oxford, UK) software.
Mass Photometry data analysis
The MP video files were processed using the DiscoverMP software (Refeyn, Oxford, UK), as previously described [35]. The threshold parameter value of 5 was used in the analysis (Supplementary Material, Fig. S2). MP contrast distributions were plotted as Kernel Density Estimates (KDE) or histograms. For all plots, the KDE contrast bandwidth and the histogram bin size were both set to 0.003 contrast units. To obtain information on the contrast distribution species, the MP histograms were fit with Gaussian peaks. For each fitted species, the best fit Gaussian peak position and area represent their average contrast value and their number fraction, respectively. Molecular mass of the empty capsids was estimated from the MP contrast distribution by applying the Contrast-to-Mass (CTM) calibration obtained using an unstained protein ladder sample (LC0725, Thermofisher, Wattham, MA) [35].
Analytical ultracentrifugation analysis
The AUC experiments were performed in the Proteome Lab XLI (Beckman Coulter, Indianapolis, IN, USA), using the 12 mm pathlength, double sector cells with charcoal filled Epon centerpieces and sapphire windows. The rAAV sample concentrations were adjusted to obtain approximately 0.2 OD260 nm absorbance signals at a 1.2 cm pathlength. Sample and reference channels were each loaded with 400 μl of the rAAV solution and the PBS buffer, respectively. Loaded cells were placed in the 4-hole analytical rotor and allowed to equilibrate thermally in the centrifuge at 20°C, under vacuum, for 60 min. After thermal equilibrium was reached, the rotor was accelerated to 10 000 rpm and the Rayleigh interference and 260 nm absorbance scans in the intensity mode were started immediately. Radial scans were collected continuously until the sedimenting boundary cleared the detection window. Data analysis was performed in the SEDFIT software (National Institutes of Health) using the c(s) sedimentation coefficient distribution model [37].
Results
MP analysis of empty and genome-containing rAAV vectors
To test the applicability of MP to rAAV characterization, we started with the analysis of the purified rAAV fractions. Concentrations of the genome-containing viral vectors (rAAV_gc) and the empty viral particle (rAAV_ec) stock solutions were determined by the A260/A280 absorption (see Materials and Methods). For the MP analysis, all final sample concentrations were adjusted to approximately 1 × 10¹¹ particles/ml. The MP contrast distributions of both the rAAV_ec and rAAV_gc show single, distinct distribution peaks (Fig. 1A). The rAAV_ec peak position is shifted to smaller contrast values in respect to the rAAV_gc peak, reflecting a smaller total mass of the empty viral particles. Additionally, the rAAV_ec peak is relatively narrow, whereas the increased width of the rAAV_gc peak indicates higher heterogeneity of the rAAV_gc preparation. Slight deviations of the distribution baselines from the zero value may indicate the presence of a small amount of particle fragments, impurities, or aggregates. The molecular mass of empty capsids calculated from the average contrast of the rAAV_ec peak using the CTM calibration based on the protein mass standards is 3.72 ±0.15 MDa which is in very good agreement with the predicted molecular mass of 3.74 MDa [19]. Replicates of the MP measurements show only small fluctuations of the rAAV_ec peak position, indicating good repeatability of the MP analysis (Fig. 2).
Figure 1.
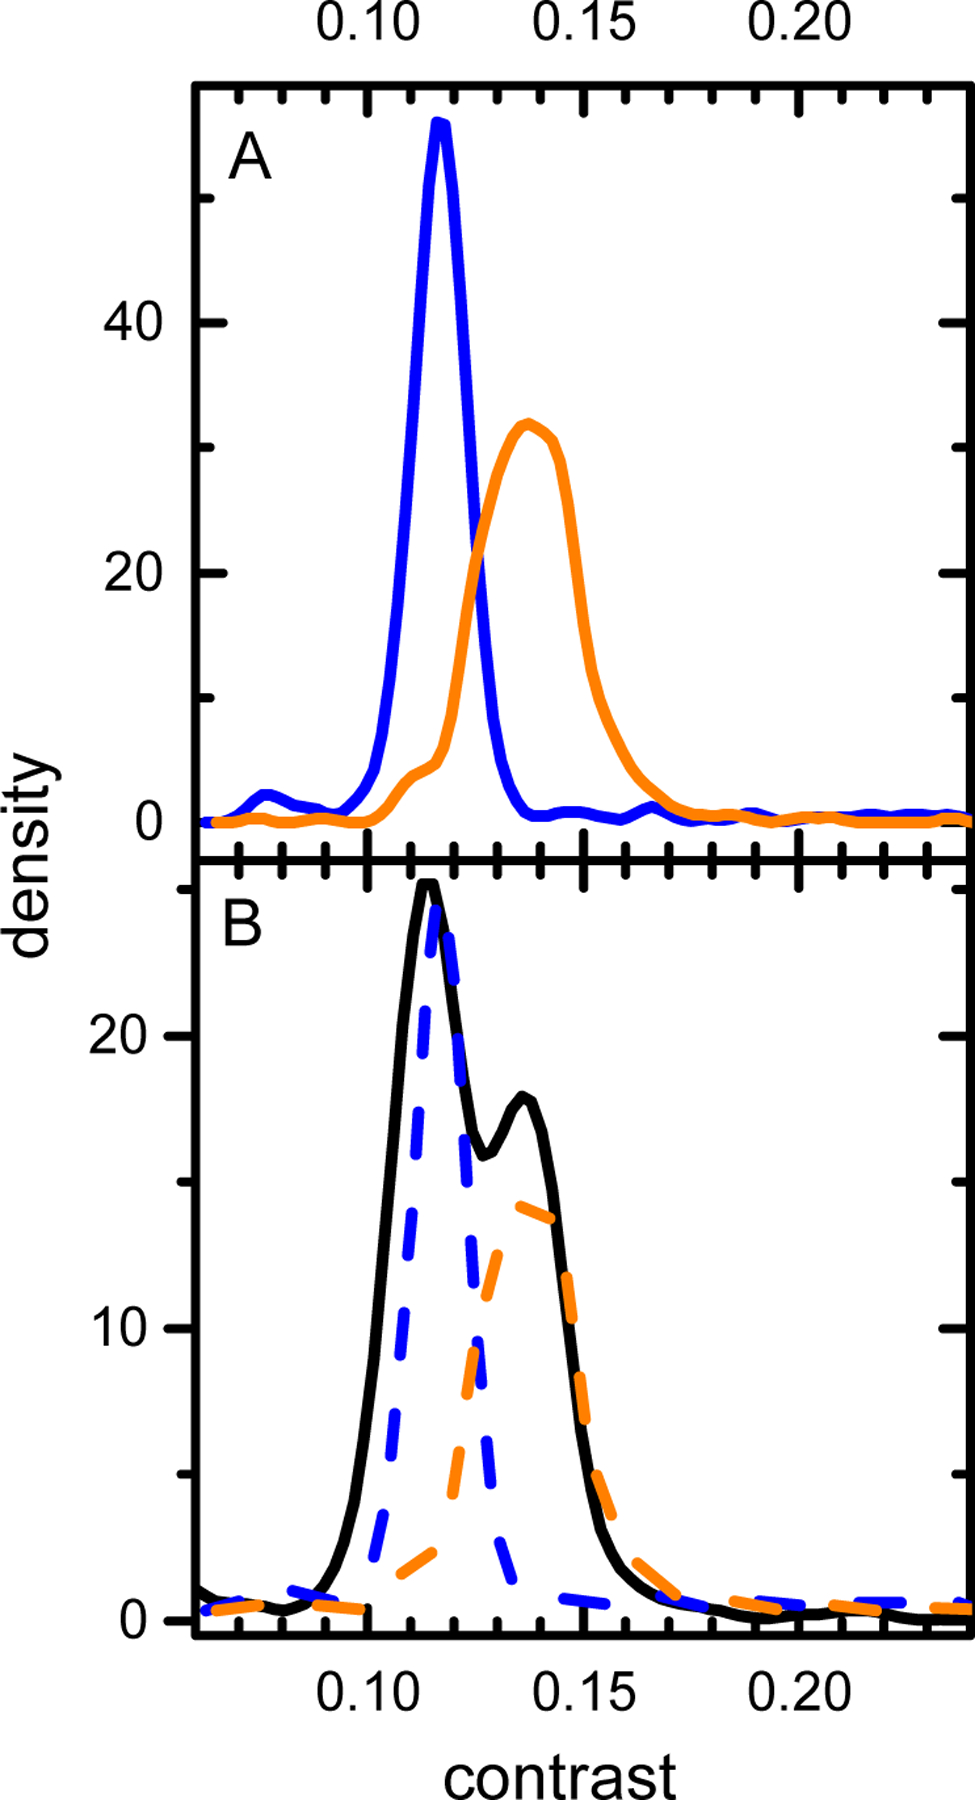
KDE mass distributions of the purified rAAV preparations. (A) Mass distributions of the empty capsids (rAAV8, in blue) and genome containing vectors (rAAV8-CMV-EGFP, in orange). (B) Mass distribution of the empty and genome containing rAAVs mixture. Dashed lines represent the individually measured components shown in panel A, rescaled to account for sample dilution.
Figure 2.
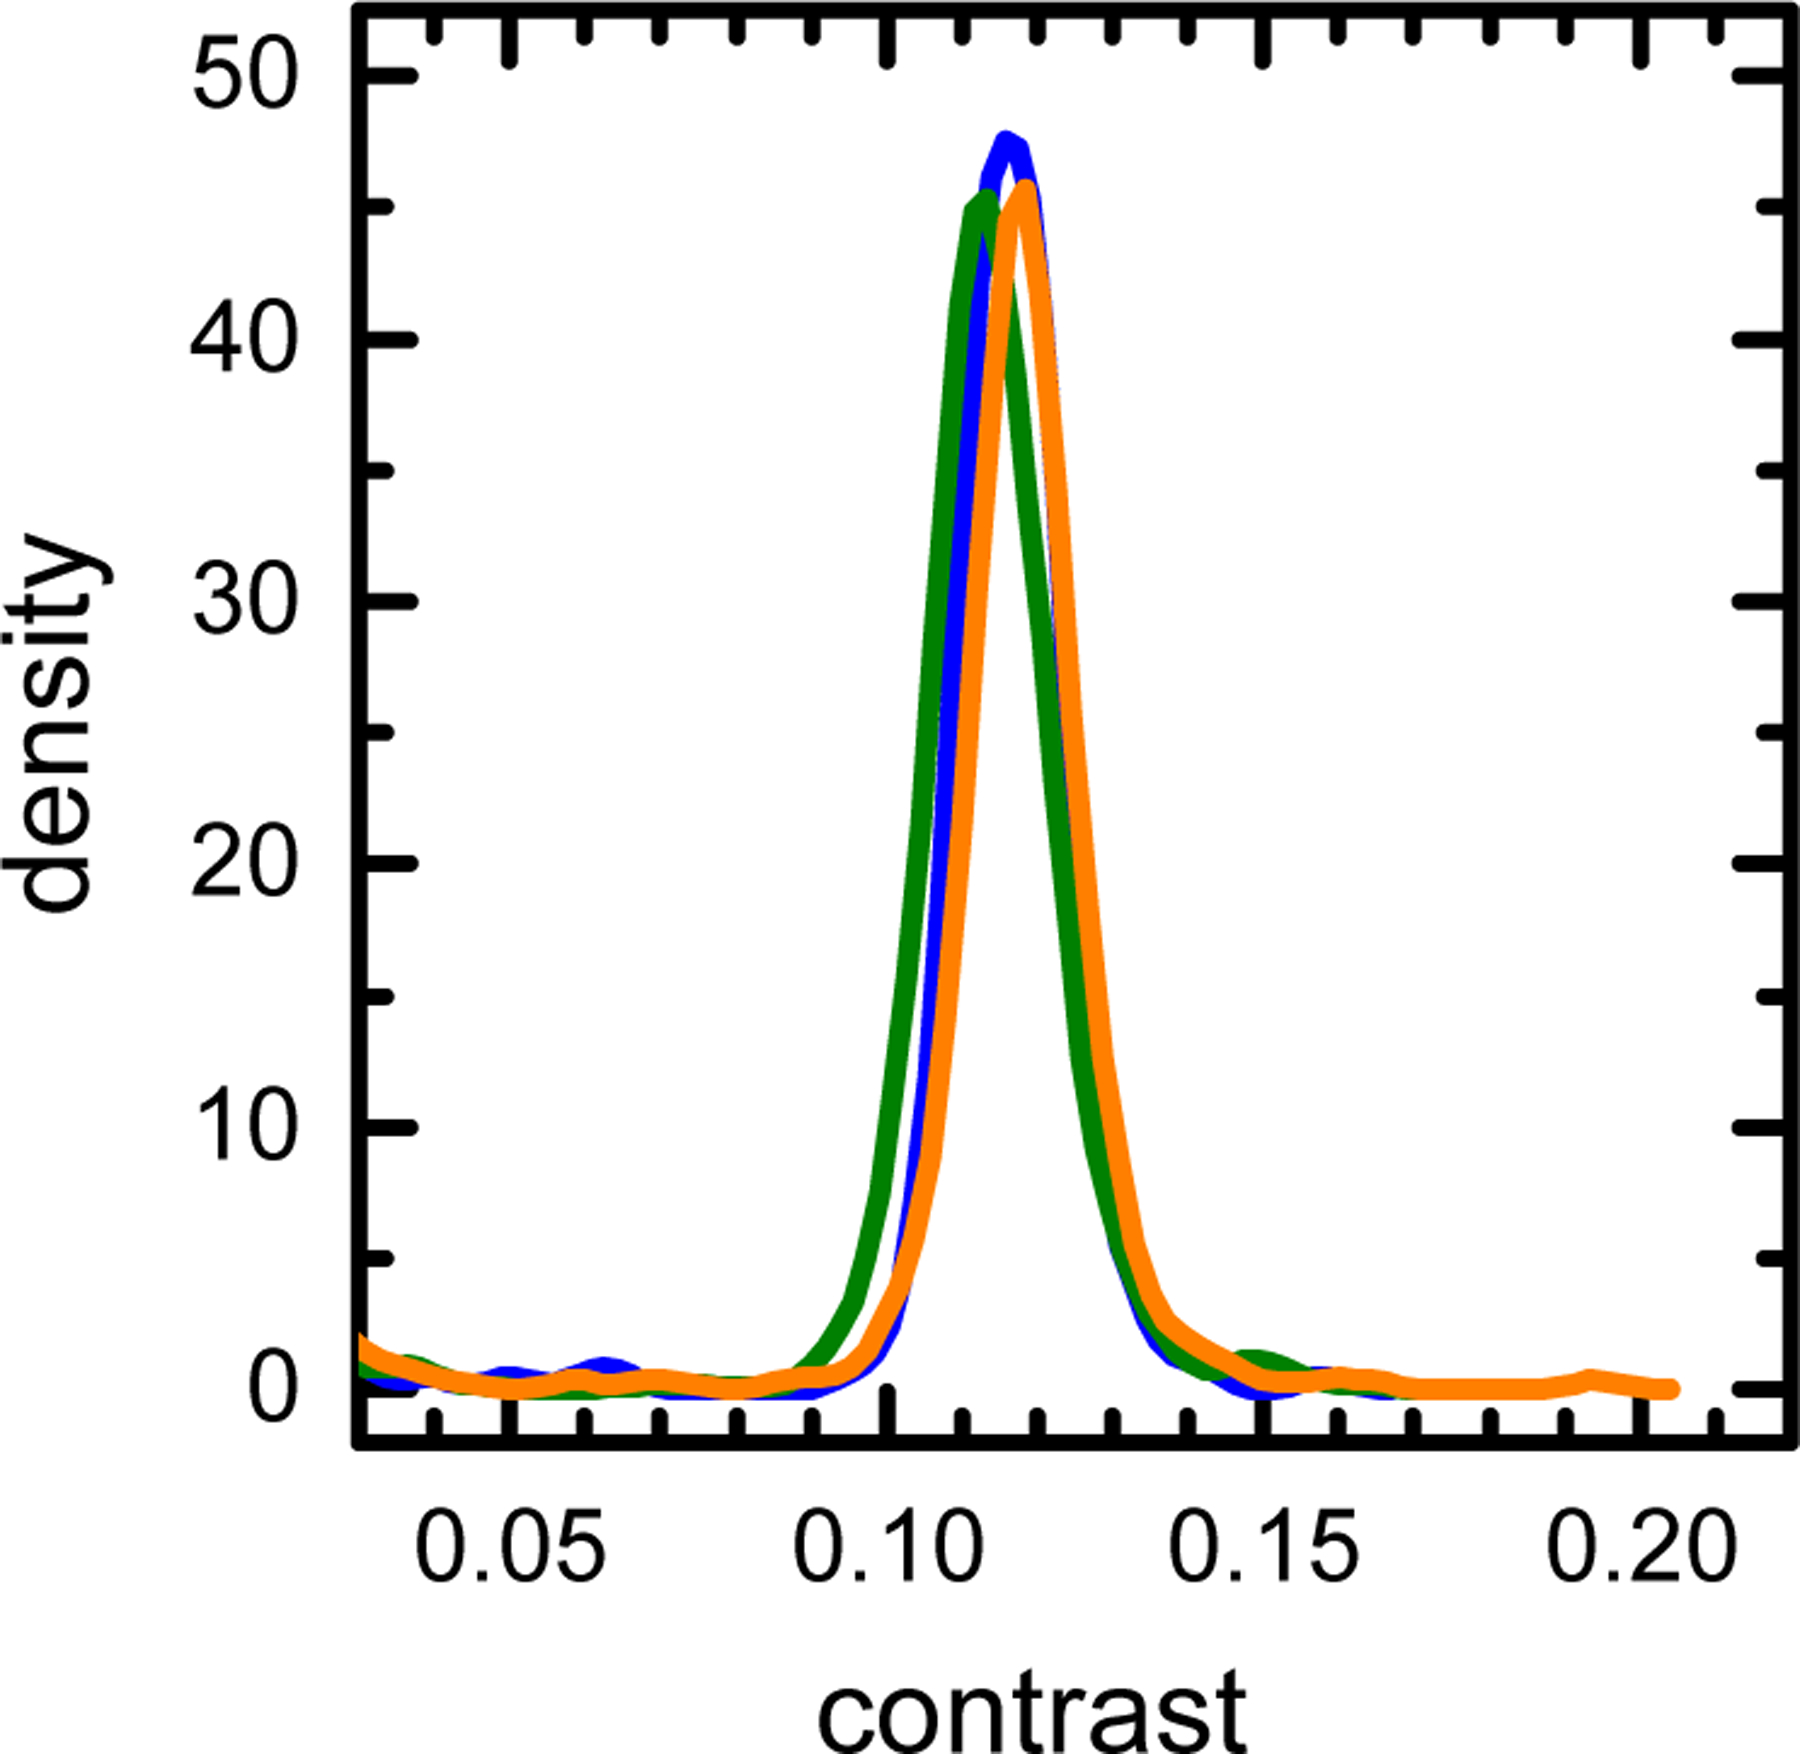
KDE plot of the triplicate MP measurements of the empty rAAV capsid sample shown in Figure 1A.
To evaluate the MP capability to discriminate empty and full capsid populations in a complex sample, equal volumes of the rAAV_ec and rAAV_gc stocks were mixed before dilution for the MP measurement. The MP contrast distribution obtained for the mixed sample shows two distinct peaks representing two rAAV components (Fig. 1B). The position of each peak corresponds to the respective contrast values obtained from the analysis of rAAV_ec and rAAV_gc samples (Fig. 1B, dotted lines). These results show that MP measurements can quickly identify, and assess the quality of, purified AAV fractions. Furthermore, empty and genome containing rAAV particle populations can be effectively discerned from the MP distributions.
Quantification of empty and genome-containing vector fractions
The number of molecules detected for each species in the MP distribution is given by the area of the corresponding distribution peak. Moreover, the protein population ratios obtained from MP distributions faithfully represent the ratios of their solution concentrations [29]. We applied the same strategy to characterize relative populations in the rAAV mixtures. The empty and full vector fractions in a rAAV sample (Fig. 1B) were quantified by fitting the MP distribution histogram with two Gaussian functions (Fig. 3A). The rAAV_ec to rAAV_gc ratio obtained from the Gaussian peak areas is 1.30, in good agreement with the expected ratio of 1.26, calculated from the concentrations of the rAAV stocks. To further verify this finding, we measured the MP distributions of several mixtures of empty and full rAAV samples at different species mixing ratios (Fig. 3B). Six MP measurements were taken for each sample, and the vertical error bars represent the standard deviation of the measurements. The abscissa values were calculated from the known rAAV_ec and rAAV_gc stock concentrations as determined by the UV absorbance. Values obtained from the MP analysis are in excellent agreement with the expected empty to full fraction ratios (slope = 1.01 ±0.01, R2 = 0.999). This indicates that the MP not only detects and identifies the empty and full capsid species in a rAAV sample but can also be used as a powerful tool to quickly determine their relative concentrations.
Figure 3.
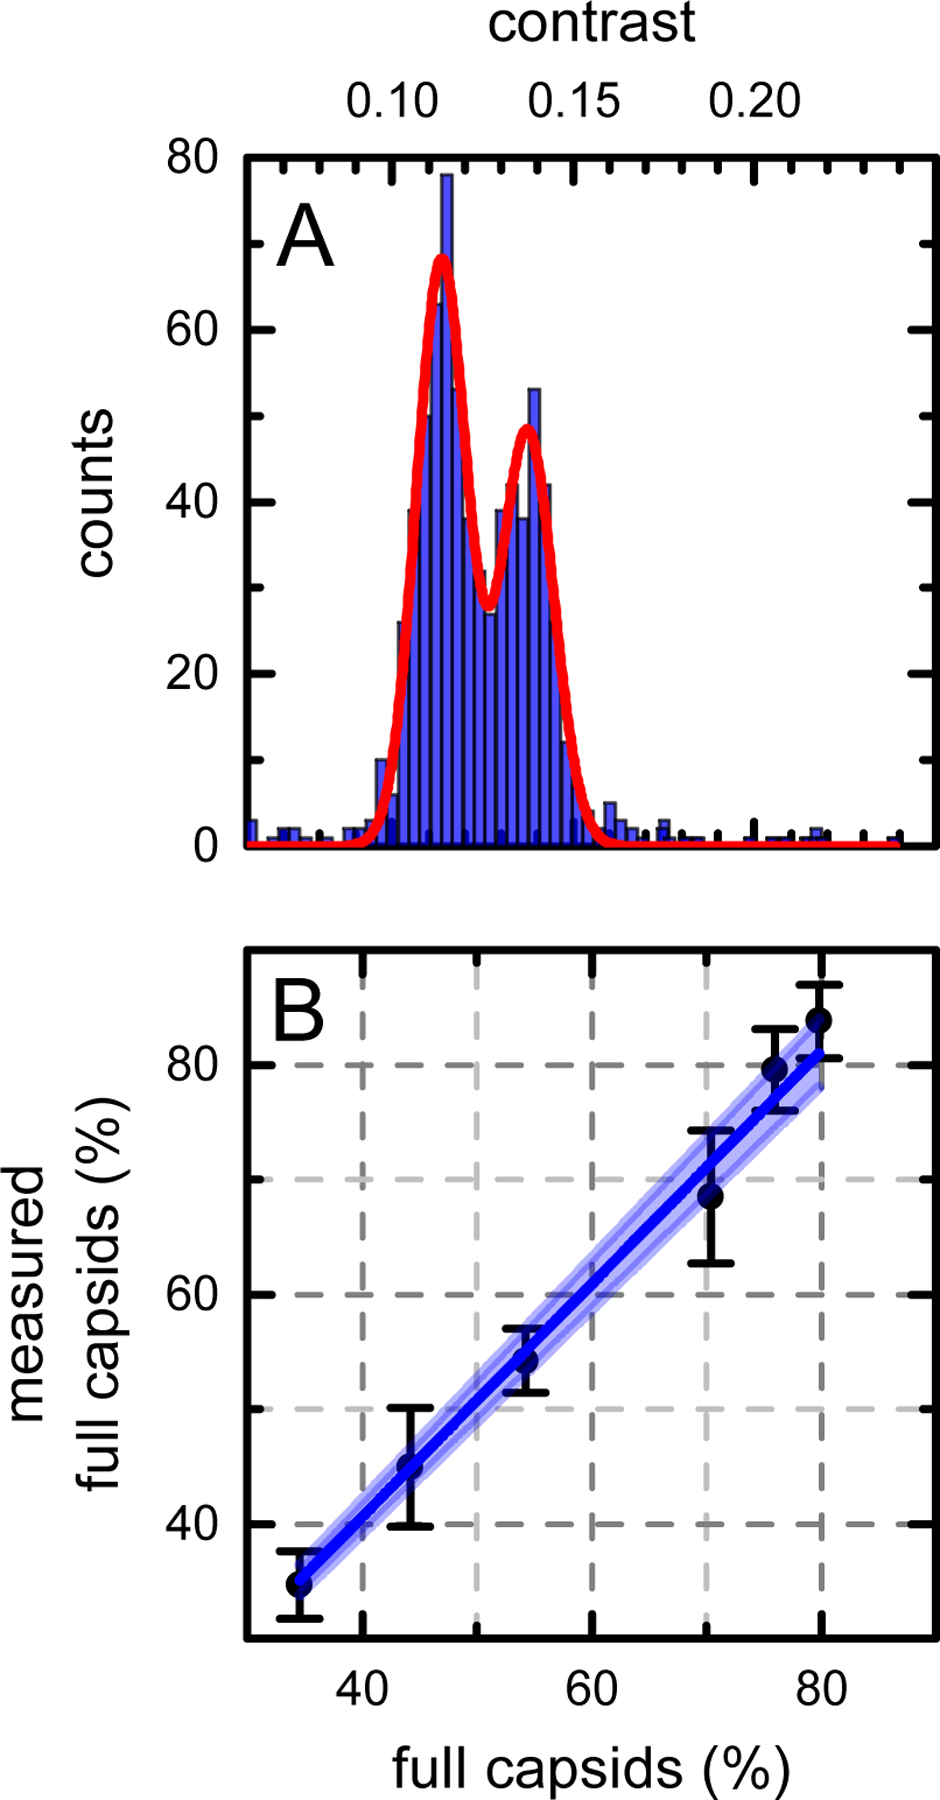
MP determination of the full to empty capsid ratios. (A) MP mass distribution histogram (blue) and the Gaussian fit (red) of the full and empty capsid mixture shown in Fig. 1B. (B) Full capsid fraction determined from the MP measurements plotted against the expected fraction obtained from stocks mixing ratios. Vertical error bars represent the standard deviations of six MP measurements. The dark blue line represents a linear fit (R2 = 0.999), and the shaded area indicates the 95% confidence interval band.
Estimation of the rAAV genome size
The MP signal originates from the interference of the light scattered by molecules binding to the coverslip surface and the light reflected at the glass-water interface. For proteins, the MP signal is directly proportional to their molecular mass. In complex viral particles, protein and nucleic acid components have different refractive indices and contribute to the light scattering signal differently [26, 27]. Since, for the rAAV virions containing genomes of different sizes, the capsid component signal contributions are identical, the differences in the observed MP contrast values should reflect the different sizes of the encapsidated genomes. Here, we tested several rAAV preparations containing different sizes of both single- and double-stranded DNA genomes. Figure 4 shows the experimental contrast values of five rAAVs containing ssDNA (Fig. 4A) and two rAAV constructs with double-stranded self-complementary DNA (dsDNA) genomes (Fig. 4B) plotted as a function of their genome size. Each measurement was repeated seven times, and the vertical error bars represent standard deviations of the average contrast values. Values obtained for empty vectors (zero genome size) were included on both plots. Both data sets show a linear relationship between the MP contrast and the DNA length with R2 of 0.957 and 0.994 for the ssDNA and dsDNA, respectively. The fit parameters define the contrast-to-nucleotide (contrast-to-nt) ratios that can be used as calibration values to determine the rAAV genome size from MP measurements. To compare the contrast-to-nt value obtained for the ssDNA to the contrast-to-base pair value of dsDNA, the former has to be multiplied by 2, resulting in the value of 0.0199 ±0.0018/kb. This value is higher than the 0.0152 ±0.0008/kb obtained for the dsDNA. This observation is consistent with the previous findings [27], where differences were observed for the contrast-to-nt relationships obtained for the isolated ss- and dsDNA. Since slope differences observed here for the ss- and dsDNA containing rAAVs are small, all experimental data points were combined and plotted as a function of the DNA length (Fig. 4C). The linear plot shows a direct proportionality of the experimental MP contrast values and the rAAV genome sizes for the whole range of tested DNA lengths. No outliers were detected, but the R2 value of 0.908 for the combined data plot is lower than that obtained from the individual analysis of the ss- and dsDNA data sets. The linear relationships observed here expand the applicability of MP analysis to the measurements of the sizes of genomes packaged into rAAV vectors.
Figure 4.
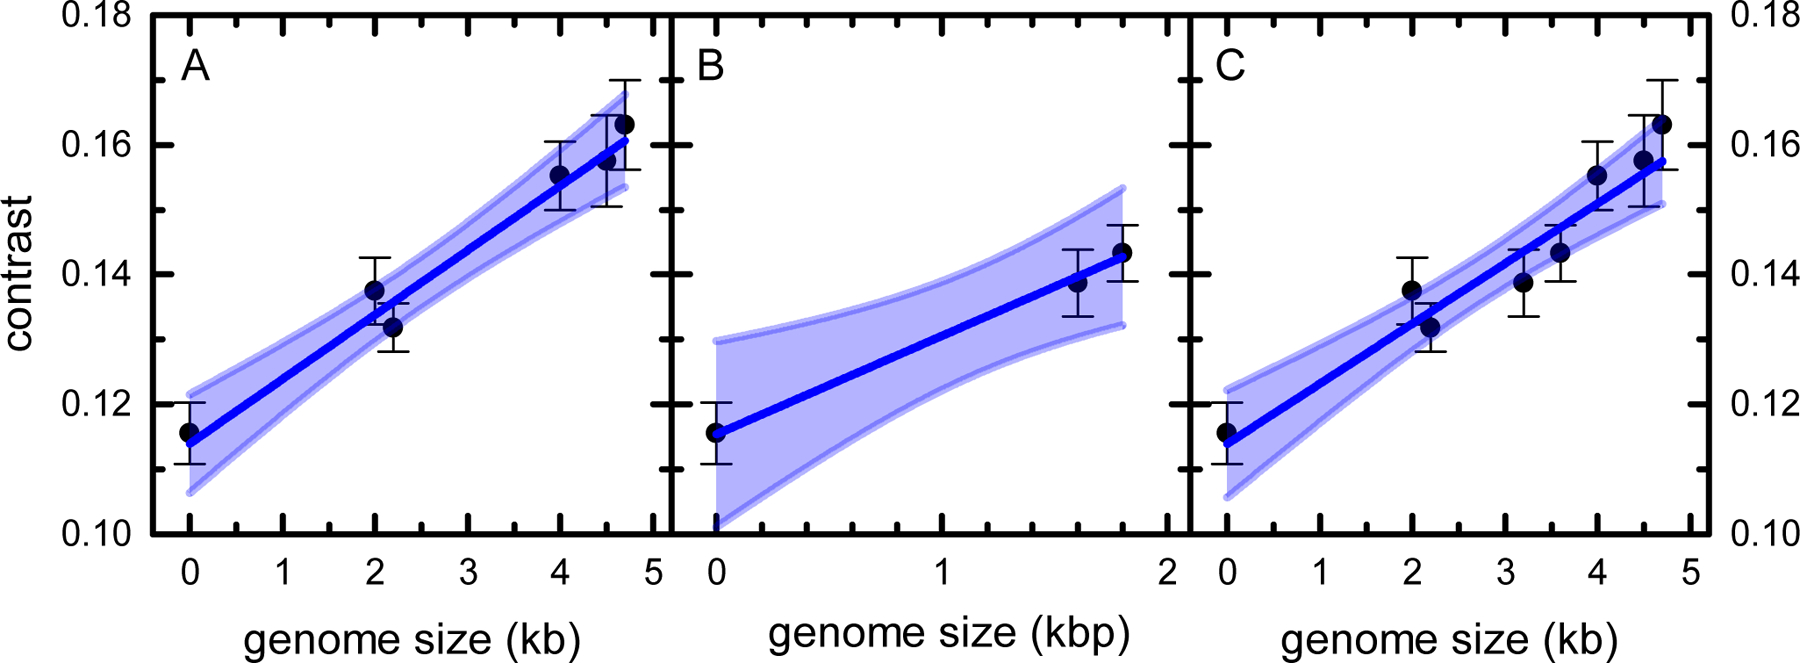
MP distributions peak positions plotted against the sample genome size. (A) ssDNA and (B) dsDNA genome vectors. (C) Combined plot of the ssDNA and dsDNA vector data. Vertical error bars represent the standard deviations of the average. Dark blue lines represent linear fits, with R2 of 0.957, 0.994, 0.908 for lines in panel (A), (B), and (C), respectively. Shaded areas indicate the 95% confidence interval bands.
MP and SV-AUC analysis of partially purified rAAV preparations
To assess the practical performance of MP in the analysis of more complex samples, we compared the results of the SV-AUC and MP analyses of partially purified rAAV preparations. The SV-AUC data obtained for the empty rAAV8 capsids reveal a single narrow c(s) distribution peak at the 64 S position, and a small amount of larger particles with s values in the 80 S to 100 S range (Fig. 5A). The MP histogram of this sample similarly shows a single narrow peak at the 1.19 contrast value with a small amount of particles detected in the higher contrast range (Fig. 5B). The full width at half maximum (FWHM) of the MP capsid peak is approximately 0.015 contrast units. The c(s) distribution of the same rAAV8 stereotype with the encapsidated 4.4 kb ssDNA shows two main species—a dominant fraction at the 80 S position, and a smaller population with an approximate sedimentation coefficient value of 106 S (Fig. 5C). The MP distribution (Fig. 5D) correspondingly contains two well defined peaks with average contrast values of 1.36 and 1.58, and a relative abundance matching that shown by the c(s). Using the previously obtained contrast-to-nt calibration, the encapsidated genome sizes can be estimated at 2.1 ±0.2 kb and 4.3 ±0.2 kb for the left and right MP distribution peak, respectively. This suggests that the more abundant MP distribution peak indicates the presence of a large amount of vectors containing DNA impurities in this preparation, and the lower population peak represents the desired vector product.
Figure 5.
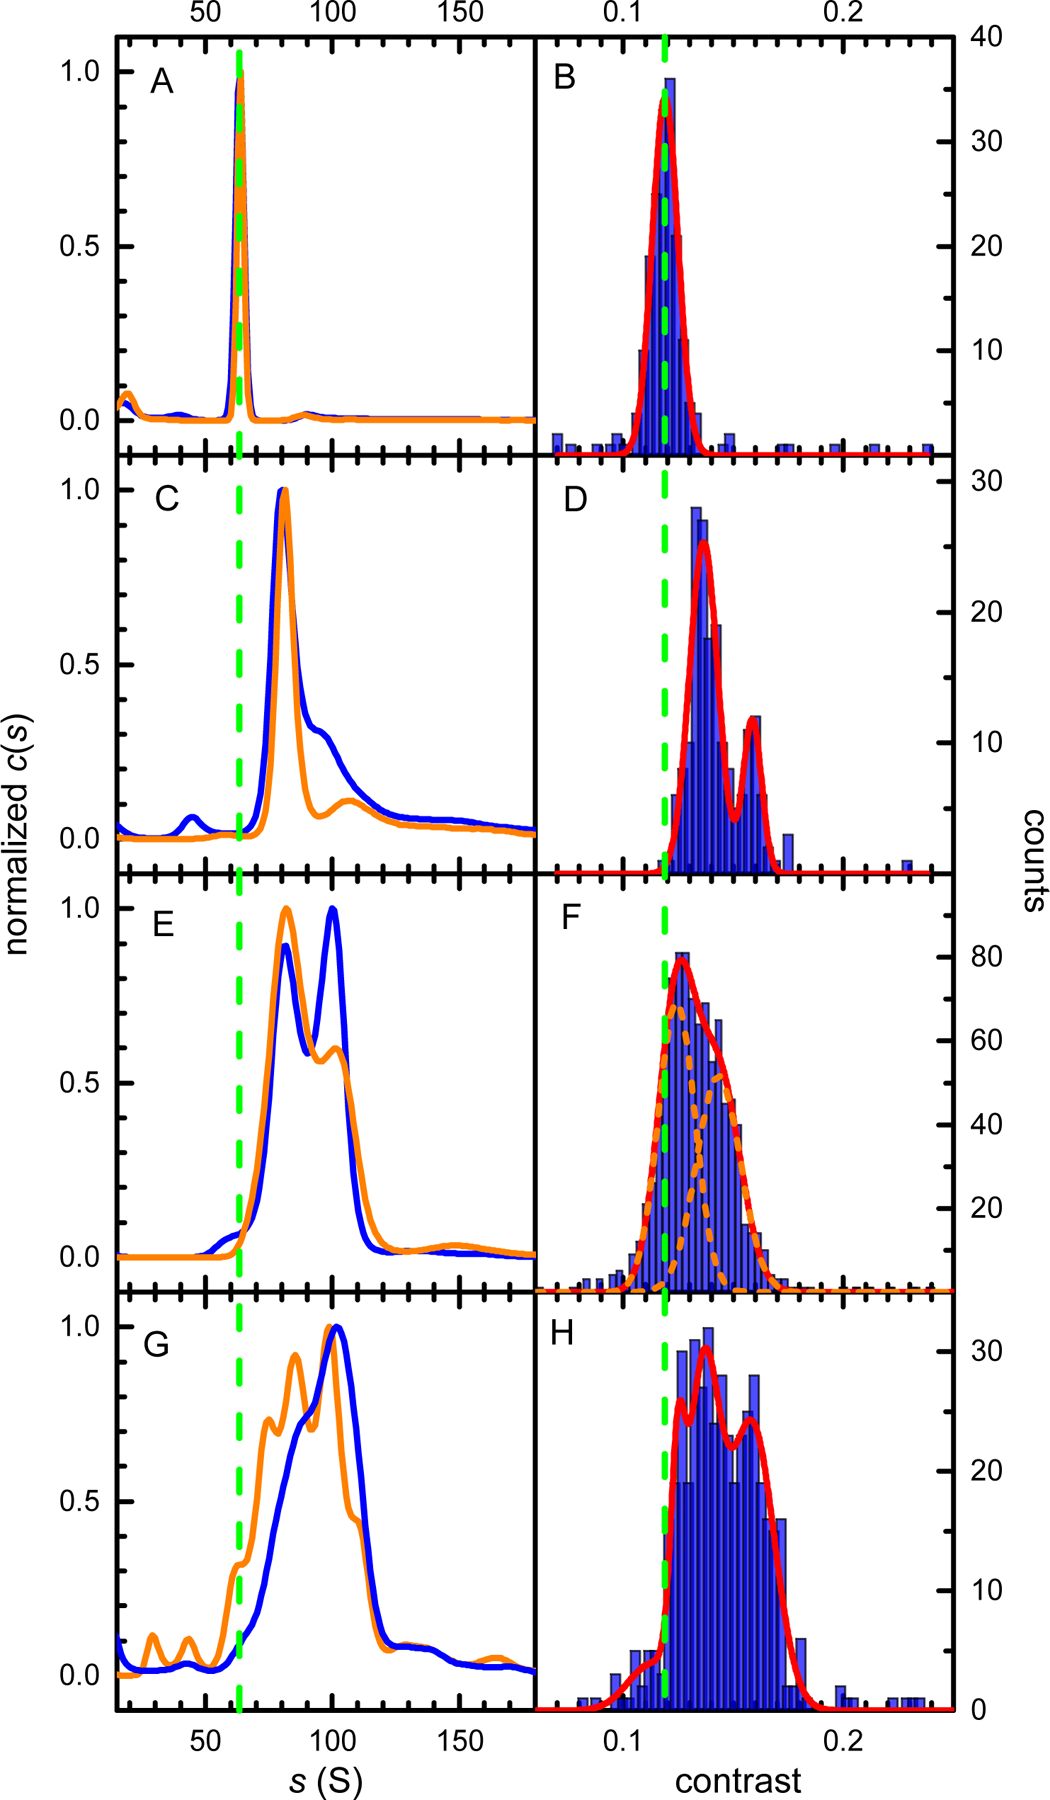
Comparison of the SV-AUC and MP data. (A, B) rAAV8 empty capsids, (C, D) ssAAV84400, (E, F) scAAV5-hSyn-GFP, (G, H) scAAV5-CMV-GFP. The left column shows SV-AUC c(s) distributions obtained from the 260 nm absorbance (blue) or Rayleigh interference (orange) signals, respectively. The right column shows MP contrast distribution histograms (blue) and their best fits with Gaussian distributions (red). Vertical dashed green lines show the position expected for empty capsid species in the c(s) and MP analysis, respectively. For the unresolved scAAV5-hSyn-GFP MP histogram in panel F, the two Gaussian fit components are shown as orange dashed lines.
SV-AUC of the scAAV5-hSyn-GFP vector containing the dsDNA yields a c(s) distribution with two partially resolved peaks (Fig. 5E). The ratios of the interference and 260 nm absorbance signals indicate that the less abundant, higher s-value population contains a genome of a larger size. The MP histogram of the same sample does not completely resolve the peaks observed in the c(s) distribution (Fig. 5F). However, the increased peak width (FWHM approximately 0.04 contrast units), and the well-defined shoulder of the distribution clearly indicate two underlying populations. Consequently, two Gaussian peaks were used to fit the MP distribution, and the sum of the two best-fit peaks describes the overall shape of the histogram very well. Using the previously established linear relationship between MP contrast and the DNA length, the genome size for the two peaks was estimated as 0.7 ±0.2 kbp and 1.8 ±0.1 kbp for the left and right peak, respectively. Based on these results, this scAAV5-hSyn-GFP preparation contains approximately 43% of the desired vector product and 57% of the encapsidated DNA impurities.
The final sample (scAAV5-CMV-GFP) encodes the same gene as the previously analyzed vector but contains a different promoter sequence. Nevertheless, the scAAV5-CMV-GFP SV-AUC data reveal a much more complex sample composition. The c(s) distribution indicates a small amount of empty capsids, represented by a shoulder at the approximately 60 S position and a wide distribution comprising of several species with s values spanning the 60 S to 120 S range (Fig. 5G). The ratio of the 260 nm absorbance to interference increases with the increasing sedimentation coefficient of the c(s) distribution species (see Supplementary Material) [38]. This confirms that the wide SV-AUC distribution is reflecting the presence of several viral species encapsidating genomes of different sizes. The MP histogram reveals a similarly complex picture (Fig. 5H). The conclusions that can be drawn from the analysis of the MP distribution are equivalent to those provided by the SV-AUC data. The low-contrast shoulder of the MP distribution extends over the 1.2 contrast region, where the empty capsids are observed. The overall width of the distribution is larger than that observed for other samples, and the FWHM of approximately 0.05 is more than thrice the FWHM of the empty capsids peak. Consequently, four Gaussian components are required to fit the MP histogram, and their combined envelope provides a good representation of the MP data. The genome sizes estimated from the position of the Gaussian peaks span the 1.1 kbp to 2.6 kbp range. Since the expected genome size of the scAAV5-CMV-GFP construct is 2.3 kbp, the MP analysis suggests that this vector preparation contains, besides the expected product, a small amount of empty capsids, and a large amount of virions encapsidating DNA impurities. Unlike the MP replicates of a highly purified sample (Fig. 2), the MP replicates of the scAAV5-CMV-GFP show more variability in the species populations detected in individual measurements (Fig. 6). This is reflecting both a limited MP resolution of multi-species rAAV samples and the fact that, for complex MP distributions, the particle count for each distribution species is relatively low. Each count represents an individual virion particle detected during the MP analysis. When multiple species are present, the total number of counts in the MP measurement is distributed over an increasing number of peaks, decreasing the accuracy of the measurement. To compensate for this effect, distributions in Fig. 5H and Fig. 6 were collected with an increased number of counts. However, this did not overcome the limited mass resolution of MP (Supplementary Material, Fig. S3 and S4). Nevertheless, all MP replicate measurements show a similar pattern, in particular a comparable width of the distribution and the presence of multiple particle species. Their analysis leads to identical conclusions regarding the sample purity and the presence of the partially packaged capsid populations in the analyzed sample.
Figure 6.
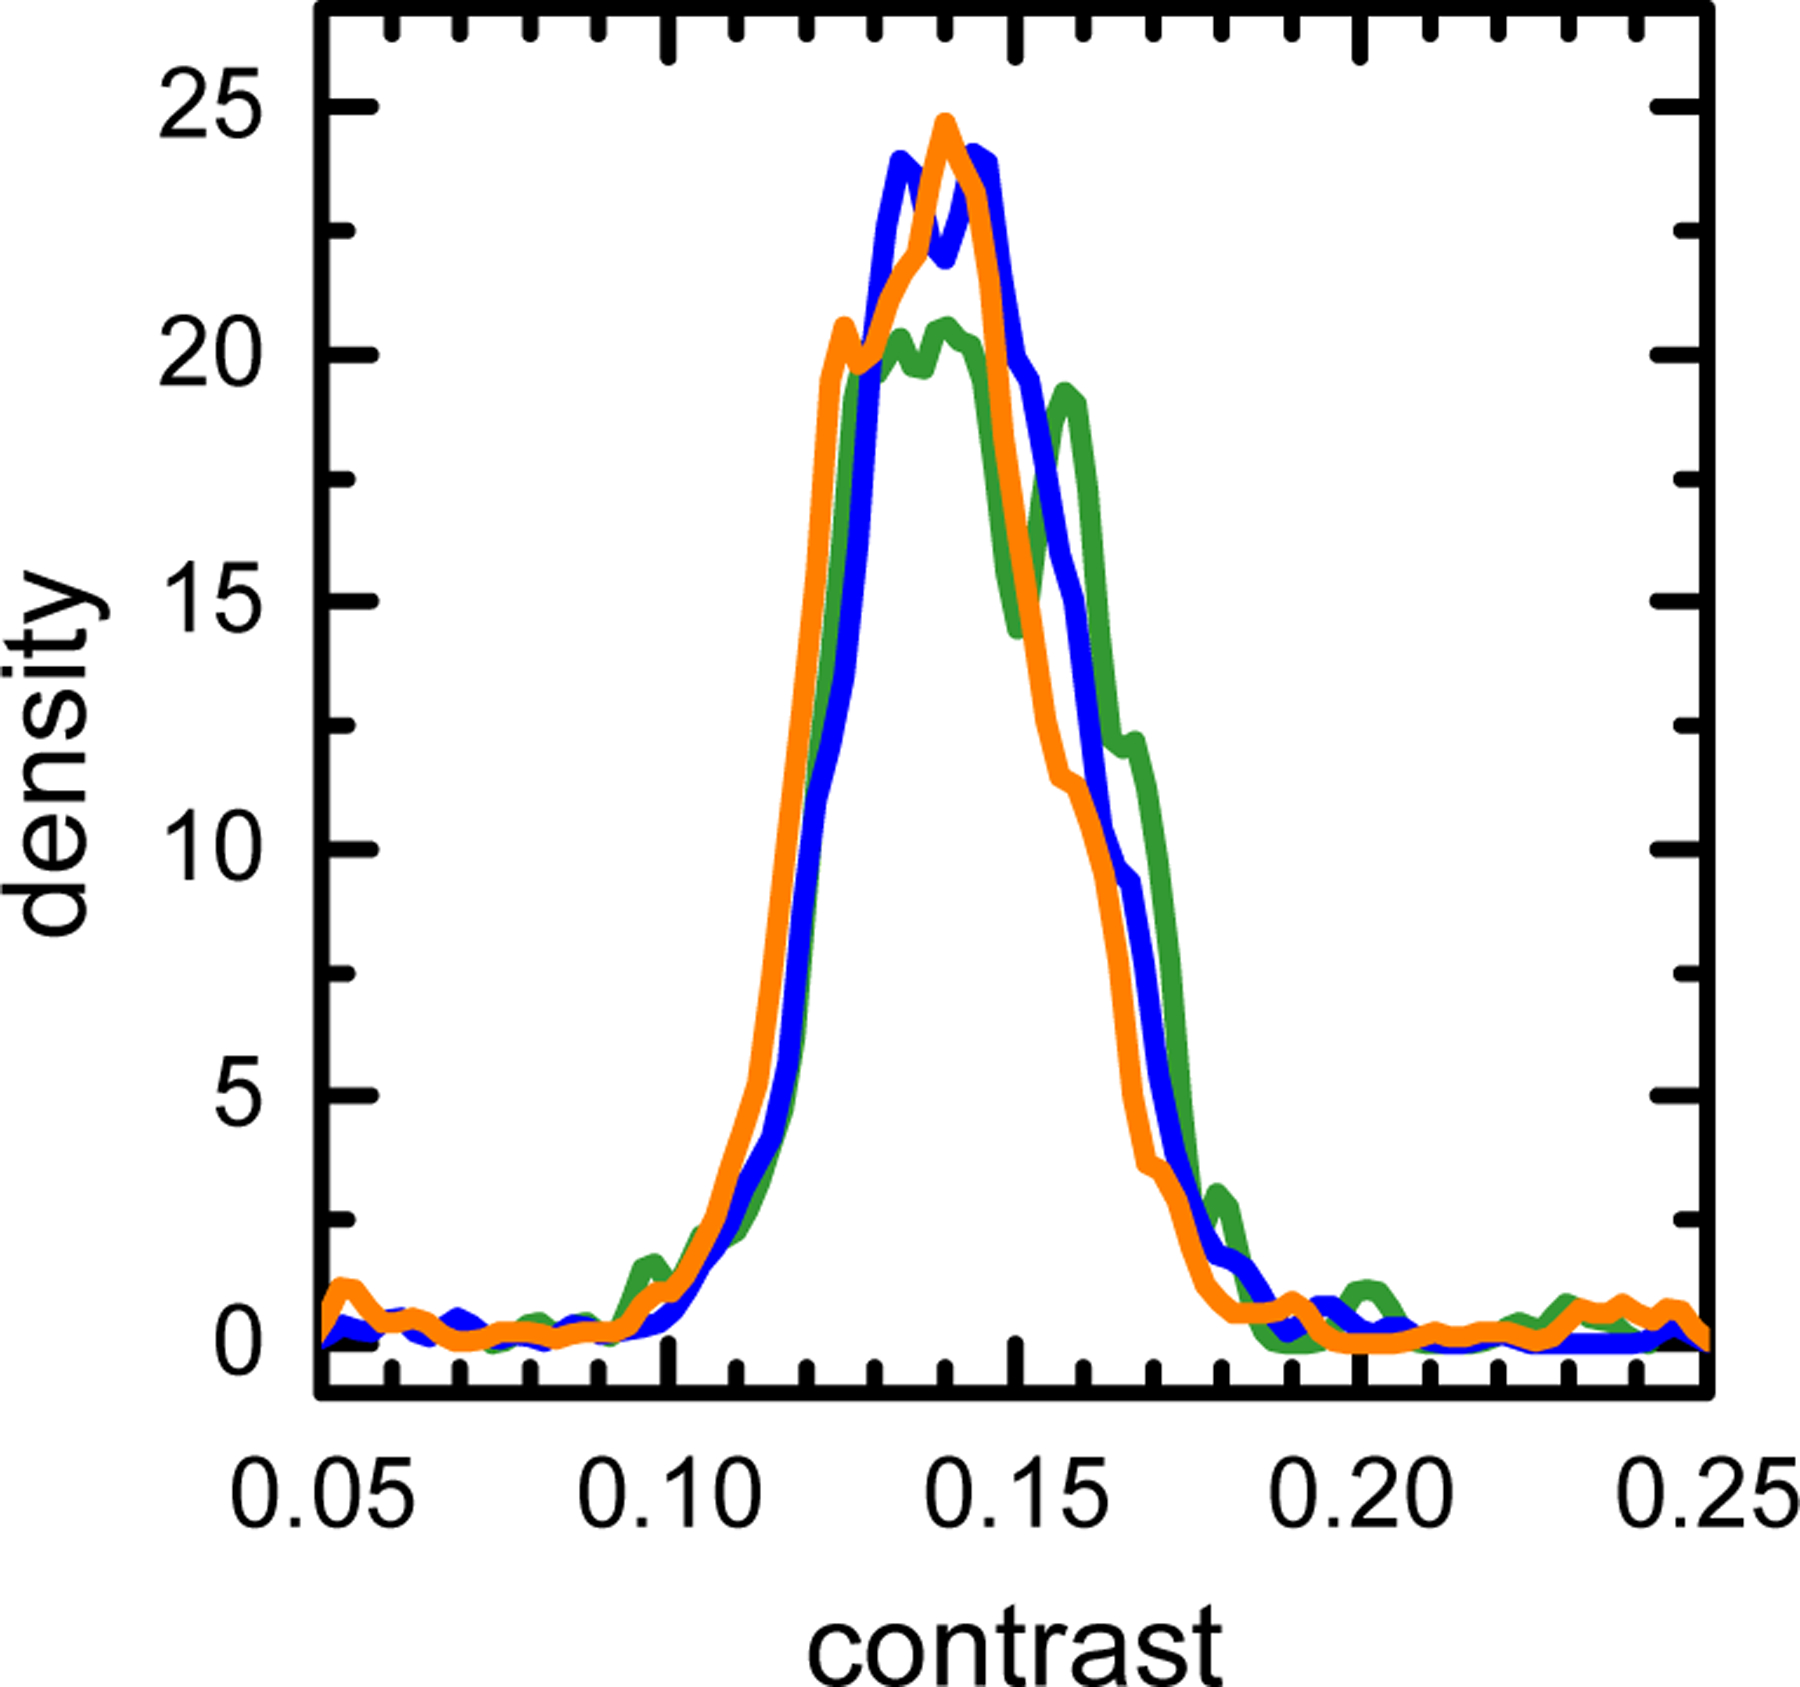
KDE plot of the triplicate MP measurements of the scAAV5-CMV-GFP sample shown in Figure 5H.
Taken together, the data indicate that MP provides extensive information on the heterogeneity of rAAV preparations. The resolution of the MP distributions is slightly lower than that obtained from the SV-AUC c(s) analysis, but MP is able to detect, identify, and characterize all species detectable by the c(s).
Discussion
In this report, we present a comprehensive evaluation of MP as a technique to characterize rAAV vectors. Despite the fact that rAAVs have recently emerged as a powerful new class of biopharmaceutical drugs, adequate methods to measure the purity and homogeneity of rAAV preparations are still lacking. MP has previously been shown to detect viral capsids [31, 39], but this report is, to our knowledge, the first detailed study of MP as an rAAV analysis tool. Importantly, the MP results obtained here were validated by SV-AUC, a sensitive, high-resolution technique, able to quantify rAAV impurities not always detectable by other analytical methods.
Since MP is a relatively new technology, it is important to discuss the advantages and limitations of MP detection relevant to rAAV characterization. The light scattering derived MP signal is generated by every particle in solution with molecular mass within the MP detection range. This lack of signal source discrimination precludes the MP analysis of samples with a very large amount of impurities, particularly when the molecular mass of the impurities is similar to that of the species of interest. However, this MP attribute is advantageous for sample quality assessment applications. For the same reason, best MP results are obtained from the analysis of fresh vector preparations. We have observed that repeated freeze-thaw cycles substantially increase the amount of vector debris and degradation products in the sample solution. Light scattering generated by those impurities can quickly dominate the MP signal.
The MP data analysis parameter used in this work suppresses the detection of impurities in the sub-MDa range without affecting detection of the viral particles (see Materials and Methods and Supplementary Material). However, the raw MP data contain complete information on all detected particles. If the small molecular mass impurities are of interest, threshold parameter can be adjusted and MP data reanalyzed to include all molecules detected in the full MP sensitivity range.
The most straightforward MP application for rAAV analysis is the assessment of rAAV sample heterogeneity. Figure 5 illustrates the information content of MP contrast distributions for increasingly complex rAAV samples. Clearly, when relatively pure samples are analyzed, MP can quickly confirm their homogeneity (Fig. 5B) or identify the nature and the fractional content of the molecular components (Fig. 5D, 5F). Obtaining precise component information for a more complex, heterogenous sample is difficult (Fig. 5H), but, nevertheless, the MP data matches the information obtained from AUC (Fig. 5G).
Besides the assessment of sample homogeneity, the relative numerical ratios of sample populations can also be easily obtained by Gaussian fitting of the MP contrast distributions. For samples with empty and full capsid populations, this allows for quick and accurate packing efficiency determination (Fig. 3). These calculations are unambiguous for samples with limited heterogeneity (Fig. 3A, 5D) but become increasingly more difficult for data with partially resolved species (Fig. 5F) and with multiple species populations (Fig. 5H). From our data, we estimate that MP can typically resolve rAAV species with genome size differences of approximately 0.7 kb. The resolution will also be affected by the relative size of the MP distribution peaks—populations with a relatively low particle count can be detected by MP, but their precise numerical analysis will be limited. Finally, the genome size can be estimated from the species’ Gaussian peak position. However, this requires obtaining the contrast-to-nt calibration information from separate measurements of standard samples.
The area under the MP distribution plots is equal to the total number of detected virions. This number will correspond to the concentration of virions in solution, and could potentially be used for titer estimations by comparing the sample particle count with that of an appropriate concentration standard. There are, however, two factors that can influence the accuracy of this measurement. The mass photometry optimum concentration range is relatively narrow (less than one decade), and the concentration of the analyzed sample will typically have to be adjusted to obtain best results. The strong negative charge of viral DNA genomes could also potentially affect the virion’s propensity to land on the surface of the glass coverslip, especially in low ionic-strength buffers. Both factors would have to be carefully explored, but it is feasible that a reliable mass photometry protocol for vector titer estimation could be developed.
Our results show that MP contrast distributions provide information comparable to the c(s) SV-AUC data, but the data can be obtained faster and with minimal sample consumption. In contrast to AUC, a typical MP measurement requires a sub-picomole amount of sample and can be completed and analyzed within 5 minutes. This equals to approximately 1/600 of the sample and 1/40 of the time required by AUC. MP experiments are easy to execute—in our facility, using the commercial MP system, new users are typically able to independently collect and analyze MP data after approximately 30 minutes of training. Importantly, MP sample analysis is straightforward and easy to standardize. This guarantees that results obtained in separate experiments are comparable and not affected by arbitrary adjustments introduced by the operator.
MP applications for rAAV characterization explored in this study can be compared not only with AUC, but also with other currently used techniques. MP can reliably identify and quantify full, empty, end partially filled capsid populations, and packing efficiency can be easily calculated from the MP data. MP is a robust method, and results are not affected by impurities, unless their very high concentration precludes the MP data acquisition. In contrast, impurities will not only affect similar calculations based on optical density and qPCR-ELISA data [17–19], but the presence of background artefacts will not be easily detectable by those methods [40]. High concentration of impurities will also impede TEM and, to some extent, SEC-UV-MALS analysis [20]. Results of qPCR and ELISA analysis rely on the applied primers and antibodies, respectively. Similarly, TEM results depend on the effectiveness of negative staining [41]. In contrast, MP does not use any specific reagents. Additionally, unlike TEM and cryoEM, MP does not require any sample manipulation. MP measurements are very fast, comparable in speed only with the optical density measurements, but require specialized equipment—a mass photometer. Spectrophotometers and instrumentation for the qPCR-ELISA analysis are more readily available. Furthermore, ELISA can identify specific rAAV stereotypes, and both qPCR-ELISA and optical density measurements can determine viral titer while reliable protocols for titer determination from MP data still have to be developed. When compared with the ion-exchange chromatography [42], MP provides higher resolution. MP however, is a strictly analytical method, while Ion-exchange columns can also be used to collect the purified viral fractions.
This study shows that MP can measure heterogeneity, relative species content, packing efficiency, and other attributes of AAVs accurately and reproducibly. MP measurements are fast, sensitive, inexpensive, and typically require no sample preparation other than the concentration adjustment. Those attributes make MP an attractive tool for the biophysical characterization of viral vectors in industry and academic applications.
Supplementary Material
Acknowledgements
This work was supported by the intramural program of the NHLBI, NIH. We thank Suja Hiriyanna (Ocular Gene Therapy Core, NEI, NIH) for generating the virus constructs.
Funding
This work was supported by the Intramural Research Program of the NHLBI, NIH (HL000338).
Footnotes
Conflict of Interest
The authors declare that there is no conflict of interest.
References
- 1.Kotin RM, Siniscalco M, Samulski RJ, Zhu XD, Hunter L, Laughlin CA, et al. Site-specific integration by adeno-associated virus. Proc Natl Acad Sci U S A 1990; 87: 2211–5. [DOI] [PMC free article] [PubMed] [Google Scholar]
- 2.Surosky RT, Urabe M, Godwin SG, McQuiston SA, Kurtzman GJ, Ozawa K, et al. Adeno-associated virus Rep proteins target DNA sequences to a unique locus in the human genome. J Virol 1997; 71: 7951–9. [DOI] [PMC free article] [PubMed] [Google Scholar]
- 3.Mendell JR, Al-Zaidy SA, Rodino-Klapac LR, Goodspeed K, Gray SJ, Kay CN, et al. Current Clinical Applications of In Vivo Gene Therapy with AAVs. Mol Ther 2021; 29: 464–488. [DOI] [PMC free article] [PubMed] [Google Scholar]
- 4.Bastola P, Song L, Gilger BC, Hirsch ML. Adeno-Associated Virus Mediated Gene Therapy for Corneal Diseases. Pharmaceutics 2020; 12. [DOI] [PMC free article] [PubMed] [Google Scholar]
- 5.Fu YW, Dai XY, Wang WT, Yang ZX, Zhao JJ, Zhang JP, et al. Dynamics and competition of CRISPR-Cas9 ribonucleoproteins and AAV donor-mediated NHEJ, MMEJ and HDR editing. Nucleic Acids Res 2021; 49: 969–985. [DOI] [PMC free article] [PubMed] [Google Scholar]
- 6.Hana S, Peterson M, McLaughlin H, Marshall E, Fabian AJ, McKissick O, et al. Highly efficient neuronal gene knockout in vivo by CRISPR-Cas9 via neonatal intracerebroventricular injection of AAV in mice. Gene Ther 2021; 10.1038/s41434-021-00224-2. [DOI] [PMC free article] [PubMed] [Google Scholar]
- 7.Sonntag F, Schmidt K, Kleinschmidt JA. A viral assembly factor promotes AAV2 capsid formation in the nucleolus. Proc Natl Acad Sci U S A 2010; 107: 10220–5. [DOI] [PMC free article] [PubMed] [Google Scholar]
- 8.Srivastava A, Lusby EW, Berns KI. Nucleotide sequence and organization of the adeno-associated virus 2 genome. J Virol 1983; 45: 555–64. [DOI] [PMC free article] [PubMed] [Google Scholar]
- 9.Trempe JP, Carter BJ. Alternate mRNA splicing is required for synthesis of adeno-associated virus VP1 capsid protein. J Virol 1988; 62: 3356–63. [DOI] [PMC free article] [PubMed] [Google Scholar]
- 10.Xie Q, Bu W, Bhatia S, Hare J, Somasundaram T, Azzi A, et al. The atomic structure of adeno-associated virus (AAV-2), a vector for human gene therapy. Proc Natl Acad Sci U S A 2002; 99: 10405–10. [DOI] [PMC free article] [PubMed] [Google Scholar]
- 11.de la Maza LM, Carter BJ. Molecular structure of adeno-associated virus variant DNA. J Biol Chem 1980; 255: 3194–203. [PubMed] [Google Scholar]
- 12.Lipps BV, Mayor HD. Characterization of heavy particles of adeno-associated virus type 1. J Gen Virol 1982; 58 Pt 1: 63–72. [DOI] [PubMed] [Google Scholar]
- 13.Lock M, Alvira MR, Wilson JM. Analysis of particle content of recombinant adeno-associated virus serotype 8 vectors by ion-exchange chromatography. Hum Gene Ther Methods 2012; 23: 56–64. [DOI] [PMC free article] [PubMed] [Google Scholar]
- 14.Gao K, Li M, Zhong L, Su Q, Li J, Li S, et al. Empty Virions In AAV8 Vector Preparations Reduce Transduction Efficiency And May Cause Total Viral Particle Dose-Limiting Side-Effects. Mol Ther Methods Clin Dev 2014; 1: 20139. [DOI] [PMC free article] [PubMed] [Google Scholar]
- 15.Wright JF. AAV empty capsids: for better or for worse? Mol Ther 2014; 22: 1–2. [DOI] [PMC free article] [PubMed] [Google Scholar]
- 16.Gimpel AL, Katsidis G, Sha S, Maloney AJ, Hong MS, Nguyen TTN, et al. Analytical Methods for Process and Product Characterization of Recombinant Adeno-Associated Virus-based Gene Therapies. Molecular Therapy 2021; 20: 740–54. [DOI] [PMC free article] [PubMed] [Google Scholar]
- 17.Dobnik D, Kogovsek P, Jakomin T, Kosir N, Tusek Znidaric M, Leskovec M, et al. Accurate Quantification and Characterization of Adeno-Associated Viral Vectors. Front Microbiol 2019; 10: 1570. [DOI] [PMC free article] [PubMed] [Google Scholar]
- 18.Kuck D, Kern A, Kleinschmidt JA. Development of AAV serotype-specific ELISAs using novel monoclonal antibodies. J Virol Methods 2007; 140: 17–24. [DOI] [PubMed] [Google Scholar]
- 19.Sommer JM, Smith PH, Parthasarathy S, Isaacs J, Vijay S, Kieran J, et al. Quantification of adeno-associated virus particles and empty capsids by optical density measurement. Mol Ther 2003; 7: 122–8. [DOI] [PubMed] [Google Scholar]
- 20.McIntosh NL, Berguig GY, Karim OA, Cortesio CL, De Angelis R, Khan AA, et al. Comprehensive characterization and quantification of adeno associated vectors by size exclusion chromatography and multi angle light scattering. Sci Rep 2021; 11: 3012. [DOI] [PMC free article] [PubMed] [Google Scholar]
- 21.Subramanian S, Maurer AC, Bator CM, Makhov AM, Conway JF, Turner KB, et al. Filling Adeno-Associated Virus Capsids: Estimating Success by Cryo-Electron Microscopy. Hum Gene Ther 2019; 30: 1449–1460. [DOI] [PMC free article] [PubMed] [Google Scholar]
- 22.Urabe M, Xin KQ, Obara Y, Nakakura T, Mizukami H, Kume A, et al. Removal of empty capsids from type 1 adeno-associated virus vector stocks by anion-exchange chromatography potentiates transgene expression. Mol Ther 2006; 13: 823–8. [DOI] [PubMed] [Google Scholar]
- 23.Pierson EE, Keifer DZ, Asokan A, Jarrold MF. Resolving Adeno-Associated Viral Particle Diversity With Charge Detection Mass Spectrometry. Anal Chem 2016; 88: 6718–25. [DOI] [PMC free article] [PubMed] [Google Scholar]
- 24.Burnham B, Nass S, Kong E, Mattingly M, Woodcock D, Song A, et al. Analytical Ultracentrifugation as an Approach to Characterize Recombinant Adeno-Associated Viral Vectors. Hum Gene Ther Methods 2015; 26: 228–42. [DOI] [PubMed] [Google Scholar]
- 25.Cole D, Young G, Weigel A, Sebesta A, Kukura P. Label-Free Single-Molecule Imaging with Numerical-Aperture-Shaped Interferometric Scattering Microscopy. ACS Photonics 2017; 4: 211–216. [DOI] [PMC free article] [PubMed] [Google Scholar]
- 26.Young G, Hundt N, Cole D, Fineberg A, Andrecka J, Tyler A, et al. Quantitative mass imaging of single biological macromolecules. Science 2018; 360: 423–427. [DOI] [PMC free article] [PubMed] [Google Scholar]
- 27.Li Y, Struwe WB, Kukura P. Single molecule mass photometry of nucleic acids. Nucleic Acids Res 2020; 48: e97. [DOI] [PMC free article] [PubMed] [Google Scholar]
- 28.Olerinyova A, Sonn-Segev A, Gault J, Eichmann C, Schimpf J, Kopf AH, et al. Mass Photometry of Membrane Proteins Chem 2021; 7: 2. [DOI] [PMC free article] [PubMed] [Google Scholar]
- 29.Wu D, Piszczek G. Measuring the affinity of protein-protein interactions on a single-molecule level by mass photometry. Anal Biochem 2020; 592: 113575. [DOI] [PMC free article] [PubMed] [Google Scholar]
- 30.Hickman AB, Kailasan S, Genzor P, Haase AD, Dyda F. Casposase structure and the mechanistic link between DNA transposition and spacer acquisition by CRISPR-Cas. Elife 2020; 9. [DOI] [PMC free article] [PubMed] [Google Scholar]
- 31.Garmann RF, Goldfain AM, Manoharan VN. Measurements of the self-assembly kinetics of individual viral capsids around their RNA genome. Proc Natl Acad Sci U S A 2019; 116: 22485–22490. [DOI] [PMC free article] [PubMed] [Google Scholar]
- 32.Malay AD, Miyazaki N, Biela A, Chakraborti S, Majsterkiewicz K, Stupka I, et al. An ultra-stable gold-coordinated protein cage displaying reversible assembly. Nature 2019; 569: 438–442. [DOI] [PubMed] [Google Scholar]
- 33.Sonn-Segev A, Belacic K, Bodrug T, Young G, VanderLinden RT, Schulman BA, et al. Quantifying the heterogeneity of macromolecular machines by mass photometry. Nat Commun 2020; 11: 1772. [DOI] [PMC free article] [PubMed] [Google Scholar]
- 34.Yu W, Mookherjee S, Chaitankar V, Hiriyanna S, Kim JW, Brooks M, et al. Nrl knockdown by AAV-delivered CRISPR/Cas9 prevents retinal degeneration in mice. Nat Commun 2017; 8: 14716. [DOI] [PMC free article] [PubMed] [Google Scholar]
- 35.Wu D, Piszczek G. Standard protocol for mass photometry experiments. Eur Biophys J 2021; 50: 403–409. [DOI] [PMC free article] [PubMed] [Google Scholar]
- 36.Wu D, Piszczek G. Rapid Determination of Antibody-Antigen Affinity by Mass Photometry. JoVE 2021; 10.3791/61784. [DOI] [PMC free article] [PubMed] [Google Scholar]
- 37.Schuck P Sedimentation Velocity Analytical Ultracentrifugation: Discrete Species and Size-Distributions of Macromolecules and Particles, CRC Press: Boca Raton, FL, 2016. [Google Scholar]
- 38.Berkowitz SA, Philo JS. Monitoring the homogeneity of adenovirus preparations (a gene therapy delivery system) using analytical ultracentrifugation. Anal Biochem 2007; 362: 16–37. [DOI] [PubMed] [Google Scholar]
- 39.Mass photometry of AAVs. Refeyn Application Note 2020. [Google Scholar]
- 40.Lock M, McGorray S, Auricchio A, Ayuso E, Beecham EJ, Blouin-Tavel V, et al. Characterization of a recombinant adeno-associated virus type 2 Reference Standard Material. Hum Gene Ther 2010; 21: 1273–85. [DOI] [PMC free article] [PubMed] [Google Scholar]
- 41.Fu X, Chen WC, Argento C, Clarner P, Bhatt V, Dickerson R, et al. Analytical Strategies for Quantification of Adeno-Associated Virus Empty Capsids to Support Process Development. Hum Gene Ther Methods 2019; 30: 144–152. [DOI] [PubMed] [Google Scholar]
- 42.Wang C, Mulagapati SHR, Chen Z, Du J, Zhao X, Xi G, et al. Developing an Anion Exchange Chromatography Assay for Determining Empty and Full Capsid Contents in AAV6.2. Mol Ther Methods Clin Dev 2019; 15: 257–263. [DOI] [PMC free article] [PubMed] [Google Scholar]
Associated Data
This section collects any data citations, data availability statements, or supplementary materials included in this article.