

Abstract
Microbial proliferation and biofilm formation on biologic or inert substrates are characteristics of invasive Staphylococcus aureus infections and is associated with phenotypic alterations such as reduced antimicrobial susceptibility. To identify genes which are typically expressed in biofilms, a micro-representational-difference analysis (micro-RDA) was adapted for gram-positive bacteria and used with cDNA derived from populations of S. aureus DSM 20231 growing in a biofilm or plankonically. In comparison to previously described cDNA RDA protocols, micro-RDA has the advantages that only minimal quantities of total RNA are needed and, most importantly, that total RNA can be used since the large amount of rRNA in total RNA does not interfere with the micro-RDA procedure. Using a series of spiked controls with various amounts of MS2 RNA in a background of total RNA from S. aureus, the equivalent of five copies of MS2 per cell were detectable after three rounds of subtractive enrichment. Five genes were identified as being differentially expressed in biofilm versus planktonic cultures. These genes revealed homology to a threonyl-tRNA synthetase, a phosphoglycerate mutase, a triosephosphate isomerase, an alcohol dehydrogenase I, and a ClpC ATPase. Differential levels of expression were subsequently confirmed by standard Northern blotting. In conclusion, micro-RDA is a sensitive and specific method to detect transcripts differentially expressed as a function of different S. aureus growth conditions.
Staphylococcus aureus has been recognized as an important pathogen in human disease. S. aureus is a common cause of community-acquired infections, including endocarditis, osteomyelitis, septic arthritis, pneumonia, and abscesses (26, 51). One reason for the occurrence of the ubiquitous infections caused by this pathogen is its ability to adhere to inert surfaces of medical implantable devices through interaction with deposited host factors (13, 17, 19, 20). Another reason is that the organism colonizes biologic substrates, as in endocarditis. On these inert or physiologic surfaces, S. aureus may proliferate as a structured community of bacterial cells enclosed in a self-produced polymeric matrix (10).
Microorganisms like S. aureus living in a biofilm are phenotypically resistant to a large variety of antimicrobial agents (9, 30). Several mechanisms have been put forward to explain antimicrobial resistance and the marked tendency for persistent infection in these settings. (i) Phenotypical resistance of biofilm microbes to antibiotics may be a result of the failure of an agent to penetrate the full depth of the biofilm (30); however, certain compounds have been shown to readily penetrate biofilms (10, 31). (ii) Some of the cells in a biofilm may experience nutrient limitation and therefore exist in a slow-growing or starved state; slow-growing or nongrowing cells display reduced susceptibilities to many antimicrobial agents (3, 4, 9, 11). (iii) In response to growth on a surface, adherent bacteria may express a pattern of genes different from that of their planktonic counterparts (10). It has been demonstrated with Escherichia coli that the levels of gene expression between biofilm and planktonic populations differ markedly (40). Currently, it is unclear whether these differences are a result of a programmed response to growth on a surface, a consequence of altered requirements of nutrients or metabolic product accumulation, and/or a reflection of quorum-sensing mechanisms due to autoregulatory peptide function (22).
The aim of this study was to identify genes in adherent S. aureus populations that are differentially expressed compared to those in their planktonic counterparts. A variety of methods to study differential levels of gene expression in prokaryotes have been described previously (16, 46, 48). These include differential-display PCR, arbitrarily primed PCR, gene fusion, and subtractive and differential hybridization. Furthermore, a number of microarray-based methods for the detection of differentially expressed genes have been described (12, 43). Most of these methods have the disadvantage that large quantities of mRNA are required. Some of these methods, like differential-display PCR, arbitrarily primed PCR, and gene fusion, do not eliminate sequences common to both, a feature that complicates the interpretation of the results and the identification of the differentially expressed genes. Other methods, like the previously described subtractive and differential hybridization techniques, are not capable of eliminating the large amount of rRNA from the total RNA, and complicated steps for mRNA enrichment have to be performed (15, 38, 50). Methods for mRNA enrichment are time-consuming, may result in the loss of some mRNAs, and therefore may reduce the overall sensitivity of the subsequent subtractive technique to detect differences in genes of limited expression and regulatory genes. Microarray methods present an attractive option for investigating differential levels of gene expression of staphylococci in the future (12, 43). However, whole-genome arrays for S. aureus are not yet available and their application is not yet standardized or validated.
In this study a micro-representational difference analysis of cDNA (cDNA micro-RDA) was performed. The protocol is an adaptation of the RDA method first described for applications to eukaryotic genomes by Lisitsyn et al. (25), combined with a phenol emulsion reassociation technique (23, 27). Unlike with previously described cDNA RDA protocols, the method described herein has been successfully applied to gram-positive bacteria and has the advantages that only minimal quantities of RNA are needed and, most importantly, that total RNA can be used. The large amount of rRNA in total RNA does not interfere with the micro-RDA procedure, so an mRNA enrichment prior to subtractive hybridization is not necessary.
MATERIALS AND METHODS
Bacterial strains.
In order to appropriately test the study question, we needed to use an S. aureus isolate forming a macroscopically visible and stable biofilm. For this purpose, a quantitative assay for biofilm formation (8, 37) with modifications described by Heilmann et al. (18) was employed. After the screening of 20 strains or isolates, S. aureus DSM 20231 was selected.
Culture conditions for S. aureus
DSM 20231 was cultured overnight in tryptic soy broth (TSB) supplemented with 0.25% glucose. The threonine-supplemented TSB-glucose medium contained 1% l-threonine. To prepare biofilm cultures, 100 μl of a fresh overnight culture was used to inoculate 50 ml of TSB-glucose in a 100-ml Erlenmeyer flask. The flask was incubated at 37°C for 24 h without agitation. For preparation of a planktonic culture, 80 μl of the same overnight culture used for biofilm cultivation was incubated in 40 ml of TSB-glucose at 37°C for 24 h under constant agitation (150 rpm) in a 100-ml Erlenmeyer flask.
RNA isolation.
After 24 h of cultivation, the S. aureus biofilm was carefully washed with 4°C sterile double-distilled water to remove all cells not adhering to the flask. Subsequently, biofilm cells were resuspended in cold sterile double-distilled water by rapidly flushing the flask with water by using a pipette until no visible biofilm was left on the glass surface. During the whole procedure, the cells were put on ice to prevent RNA degradation. Both the planktonic culture and biofilm cells were centrifuged for 5 min at 3,345 × g at 4°C. Both pellets were resuspended in RLT buffer (Qiagen GmbH, Hilden, Germany) and then mechanically disrupted with 0.1-mm-diameter zirconia-silica beads in a Fast Prep FP120 instrument (Qbiogene, Heidelberg, Germany) at maximum speed for 20 s. RNA isolation from this lysate was performed with an RNeasy mini kit (Qiagen) according to the instructions of the supplier. The isolated total RNA was treated with DNase (Oncor Appligene, Heidelberg, Germany).
cDNA synthesis.
cDNA synthesis was performed by random priming with the SuperScript choice system for cDNA synthesis (Life Technologies GmbH, Karlsruhe, Germany). The protocol was performed according to the manufacturer's instructions with the following exceptions. The first-strand synthesis was continued up to 2 h, and the second-strand synthesis was incubated overnight. The double-stranded cDNA was subsequently isolated using a PCR purification kit (Qiagen).
Oligonucleotides.
Sequences of adapters and primers used for the micro-RDA were as follows: that of R-Bgl 12 was 5′-GATCTGCGGTGA-3′, that of R-Bgl 24 was 5′-AGCACTCTCCAGCCTCTCACCGCA-3′, that of J-Bgl 12 was 5′-GATCTGTTCATG-3′, that of J-Bgl 24 was 5′-ACCGACGTCGACTATCCATGAAC-A-3′, that of N-Bgl 12 was 5′-GATCTTCCCTCG-3′, and that of N-Bgl 24 was 5′-AGGCAACTGTGCTATCCGAGGGAA-3′ (25). Primer set 1 (R series) was used for amplicon preparation, and primer sets 2 (J series) and 3 (N series) were used alternately for the selective amplifications.
RDA.
For amplicon synthesis, both tester and driver cDNAs were digested with DpnII (New England Biolabs GmbH, Frankfurt am Main, Germany). Subsequently, 100 ng of each restricted cDNA population was ligated to 0.5 nmol of the adapter R-BglI2 and 0.5 nmol of the adapter R-Bgl 24. After ligation, tester and driver populations were PCR amplified. Fifty nanometers of template DNA was used for each amplicon PCR. In addition, the PCR mixture contained 67 mM Tris-HCl (pH 8.8), 4 mM MgCl2, 16 mM (NH4)2SO4, 10 mM β-mercaptoethanol, 100 μg of bovine serum albumin per ml, 300 μM deoxynucleoside triphosphate mix, and 15 U of Taq polymerase (Roche Diagnostics GmbH, Mannheim, Germany) (25). For priming, oligonucleotide R-Bgl 24 was used. The reaction mixtures (containing DNA, buffer, and the deoxynucleoside triphosphate mix) were preheated to 72°C, and then the Taq polymerase was added and the fill-in reaction was started. After an incubation period of 10 min, the PCR was started by adding 1.75 μM R-Bgl 24 to the reaction mix (17 cycles of 95°C for 50 s and 72°C for 3 min; the last cycle was followed by an extension at 72°C for 10 min). After amplification, both tester and driver amplicons were redigested with DpnII to cleave the adapters. Digested adapters were always removed with the PCR purification kit (Qiagen). Subsequently, only tester fragments were ligated to J-Bgl oligonucleotides.
The next step in micro-RDA is subtractive hybridization. To enhance the stringency and efficiency of the subsequent hybridization conditions, a vast excess of the driver was used. The tester/driver ratios were 1:100, 1:1,000, and 1:10,000 to generate difference product 1 (DP 1), DP 2, and DP 3, respectively. In order to achieve this high excess of driver DNA, the amount of tester DNA used for the hybridization step had to be very low. Since small concentrations of tester cDNA in the hybridization mix require enhanced efficiency of reassociation in the subsequent hybridization step, the phenol emulsion reassociation technique (PERT) (27) was adapted to this system (35). In the PERT, the acceleration of DNA reassociation is accomplished through the establishment and maintenance of a phenol emulsion. It has been shown that the PERT may enhance the reassociation rate up to 25,000-fold (23). In micro-RDA, a stable phenol emulsion was maintained by thermal cycling (27). Above 55°C, phenol is soluble in aqueous solutions; however, it becomes less soluble as the temperature is lowered, forming a fine emulsion. This emulsion eventually dissipates as the aqueous and organic phases separate. When this separation begins to occur, the emulsion is reestablished by raising and lowering the temperature of the solution. Since phenol depresses the melting temperatures (Tm) of DNA duplexes, raising the temperature to 65°C not only enables the formation and maintenance of the phenolic emulsion but also allows nonhomologous DNA duplexes to disassociate, and therefore the number of false-positive DPs is reduced.
PERT reactions were set up using conditions similar to those described by others (23, 27). In a total volume of 50 μl, 1 ng of tester DNA was hybridized to an excess of driver DNA in the presence of an emulsion containing 1.5 M sodium thiocyanate, 120 mM sodium phosphate, 10 mM EDTA, and 8% phenol. Next, the reaction mixtures were subjected to three cycles of 15 min at 25°C and 2 min at 65°C; the last cycle was followed by a final incubation at 25°C for 15 min. Thereafter, the phenol was removed by chloroform extraction.
Following subtractive hybridization, a selective amplification step was performed. First, the single-stranded ends of the hybridized DNAs were filled in, and then the amplification was started by adding the primer J-Bgl 24 (15 cycles of 95°C for 50 s and 70°C for 3 min; the last cycle was followed by an extension at 72°C for 10 min). The amplified hybridization products were treated with 20 U of mung bean nuclease (New England Biolabs) for 30 min to remove single-stranded DNA molecules. Half of the mung bean nuclease-treated DNA was amplified for 15 cycles by using the same conditions as those used before the mung bean nuclease treatment to yield the first-round DP (DP 1). During these PCR steps, only tester-tester fragments are amplified exponentially. Tester-driver hybrid molecules are amplified linearly, while the single- and double-stranded driver fragments and the single-stranded tester molecules do not amplify (Fig. 1).
FIG. 1.

Schematic illustration of the micro-RDA protocol. Broken lines represent the driver population, and solid lines represent the tester fraction. Small solid boxes symbolize the Bgl adapter series. This diagram illustrates cDNA synthesis, amplicon synthesis (A), and the synthesis of DP 1 via subtractive hybridization and selective amplification (B). To generate DP 2 and DP 3, the adapters have to be changed and subtractive hybridization and selective amplification have to be repeated. ss, single stranded; ds, double stranded.
Next, the adapters of DP 1 were cleaved by DpnII digestion and a new set of adapters was ligated to DP 1. This modified DP 1 was used in the second round of subtractive hybridization and selective amplification as tester DNA. Two or three rounds of subtractive hybridization and selective amplification were performed. Eighteen cycles of PCR were performed after the mung bean nuclease treatment for rounds two and three.
To check the success of each round of micro-RDA, the DPs were electrophoresed through a 2% agarose gel. The separated DNA fragments were stained with ethidium bromide.
Micro-RDA sensitivity test.
To evaluate the sensitivity of micro-RDA, a series of spiked controls containing various amounts of MS2 bacteriophage RNA (Roche Diagnostics) added to a fixed amount of S. aureus driver RNA was used as the tester fraction against driver RNA in the micro-RDA procedure. To prepare a sample containing one copy of the MS2 RNA spike per S. aureus cell, 98 pg of MS2 RNA was added to 5 μg of total S. aureus RNA. This ratio takes into account the molecular weight of MS2 RNA (1.18 × 10⁶ g/mol) and assumes that there is 0.1 pg of total RNA per S. aureus cell. Additional concentration ratios of 5, 10, 50, and 100 copies/cell were prepared accordingly.
Cloning and sequencing of the DPs.
The DPs were cloned into the pCRII or pCR2.1 vector (Invitrogen BV/Novex, Groningen, The Netherlands), and the plasmids were transformed into E. coli InvαF′ cells (Invitrogen BV/Novex). For plasmid isolation E. coli InvαF′ cells containing the pCRII or the pCR2.1 vector were grown overnight in 5 ml of Luria-Bertani medium supplemented with 100 μg of ampicillin per ml at 37°C with constant agitation. The inserts were sequenced using the T7 or M13 reverse primer on a Li-Cor 4000 sequencer (MWG-Biotech GmbH, Ebersberg, Germany). Resulting sequences were compared to the S. aureus genome at The Institute for Genomic Research Microbial Database and at the Sanger Center using the BLAST program (1) and to sequences in the EMBL procaryote library using the Fasta program (36).
Northern blot analysis.
The RNA was electrophoresed through 1.5% agarose–0.66 M formaldehyde gel in MOPS (morpholinepropanesulfonic acid) running buffer and transferred to a nylon membrane (Nytran N; Schleicher & Schuell GmbH, Dassel, Germany) by alkaline downward blotting (7). Gene-specific DNA probes were amplified using the Bgl 24 oligonucleotide ligated to the DP (N-Bgl 24, DP 2; J-Bgl 24, DP 3). Nonradioactive labeling was carried out using a PCR DIG Probe Synthesis Kit (Roche Diagnostics) for the synthesis of DNA probes and a DIG RNA Labeling Kit (SP6/T7; Roche Diagnostics) for RNA probes. Hybridization and detection conditions were according to information from the supplier (Boehringer Mannheim).
RESULTS
The micro-RDA technique.
As a first step, the RDA protocol first described by Lisitsyn et al. (25) had to be modified and validated for the S. aureus system. The micro-RDA technique consists of five major elements: isolation of total RNA, cDNA synthesis, amplicon synthesis, subtractive hybridization, and selective amplification (Fig. 1).
The first important and limiting step was the isolation of high-quality RNA. Because of the short half-lives of mRNAs of many bacterial species (1.5 to 2.5 min at 37°C), time is an important factor in obtaining high-quality RNA (6, 44, 45). A fast and simple method for the lysis of gram-positive bacteria was found to be cell disruption using 0.1-mm-diameter zirconia-silica beads and a reciprocating high-speed shaking device (Fast Prep FP120 instrument; Qbiogene). In contrast to enzymatic lysis methods, which require a longer incubation period prior to RNase inactivation, this method requires only 0.5 min for cell disruption and inactivation of RNA-degrading enzymes. The RNA extracted using this method of cell disruption was of high quality, with no visible degradation of rRNA and no visible DNA contamination (data not shown).
The first-strand cDNA synthesis of eukaryotic mRNA is commonly primed using the oligo(dT) primer for separation of the polyadenylated mRNA from the highly abundant rRNA (about 90% of total RNA). However, only a relatively small fraction of prokaryotic mRNA molecules (1 to 40%, depending on the source and method of RNA analysis) is polyadenylated and these poly(A) tails consist of only a few residues ranging between 14 and 60 nucleotides (47). Therefore, polyadenylated RNA tails are not used for the separation of bacterial mRNA from other RNA species. To avoid the potential loss of rare mRNA transcripts during cDNA synthesis, total RNA was reverse transcribed using random hexamer primers (Life Technologies).
Compared to standard conditions, the stringency and efficiency of the subsequent hybridization conditions had to be increased in order to reduce the interference of rRNA during the micro-RDA procedure. To achieve this high stringency, we incorporated a PERT in addition to using a vast excess of driver DNA in the hybridization step. To prevent the amplification of cDNA species other than typical tester fragments, tester/driver ratios employed in our micro-RDA experiments were selected to range from 1:100 (DP 1) up to 1:10,000 (DP 3).
Despite the high stringency of the subtractive hybridization conditions, micro-RDA was a very sensitive technique and allowed us to isolate even cDNA fragments in low abundance in the tester fraction. To determine the ability of the micro-RDA method to specifically enrich rare differentially expressed gene fragments, a series of experiments was conducted using driver spiked with various amounts of MS2 bacteriophage RNA (Roche Diagnostics). The MS2 spike concentration ranged from 1 to 100 copies per cell as described in Materials and Methods. After three rounds of micro-RDA, a 400-bp fragment, typical of the MS2 RNA amplicon (Fig. 2, lane 7) was detected in DP 3 containing five copies of the MS2 spike per cell (Fig. 2, lane 3). Thus, the use of the micro-RDA technique enabled highly specific isolation of low-copy-number mRNAs from total RNA.
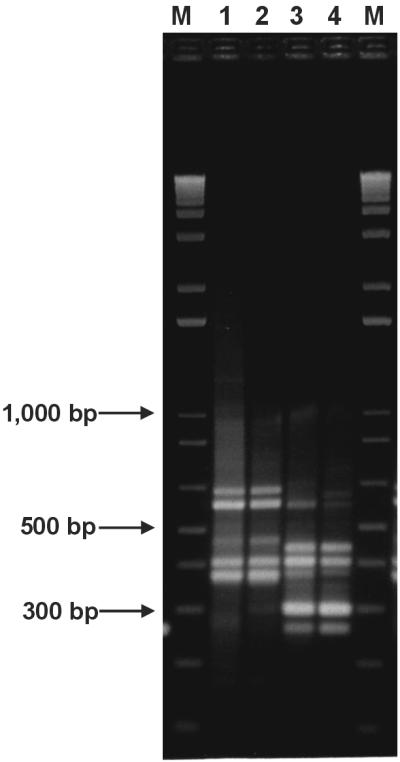
FIG. 2.

Micro-RDA sensitivity test. Different amounts, ranging from 1 copy per cell up to 100 copies per cell, of a known RNA species (MS2 RNA) was mixed with total RNA of S. aureus. In the subsequent micro-RDA, this mixture was used as the tester and total S. aureus RNA was used as the driver. DP 3 was electrophoresed through a 2% agarose gel and stained with ethidium bromide. Fragments typical of the MS2 amplicon could be detected in the spike with a ratio of minimally 5 copies per cell. Lane 1, the S. aureus amplicon (MS2 RNA) at 100 copies/cell in RNA (3-h culture); lanes 2 to 6, DP 3 (MS2 RNA spike in RNA [3-h culture]) at 1 copy of MS2/cell and 5, 10, 50, and 100 copies of MS2/cell, respectively; lane 7, the MS 2 amplicon; lanes M, molecular size markers.
Figure 2 also shows that fragments of about 400 bp were favored during the selective-amplification PCRs and that larger fragments were generally discriminated against. Thus, DPs in the range of ≈200 to 500 bp were enriched most effectively.
RDA of biofilm versus growing planktonic populations.
Using the modified cDNA micro-RDA technique described here, biofilm RNA was used as the tester and planktonic RNA from S. aureus cells cultivated in TSB-glucose medium was used as the driver (Fig. 3, lanes 1 to 3). Subsequently, tester and driver assignment of the amplicons was reversed (Fig. 3, lanes 4 to 6). Amplicons as well as DPs 1 and 2 were separated in an agarose gel. After one round of micro-RDA, no significant differences between the banding patterns of the amplicon and DP 1 could be detected in either subtraction; only bands corresponding to rRNA were visible (Fig. 3, lanes 1 and 2 and lanes 4 and 5). To amplify fragments of differentially expressed genes, a second round of micro-RDA was needed. As was observed in the micro-RDA sensitivity test, smaller fragments were favored during the selective PCR cycles: fragments ranging in size from 100 to 450 bp were selectively enriched. Shotgun cloning and sequencing of DP 2 obtained by subtraction using biofilm-derived RNA as the tester and planktonic-population-derived RNA as the driver population allowed us to identify multiple fragments of a threonyl-tRNA synthetase, a triosephosphate isomerase, and the 23S rRNA from S. aureus, as well as a single fragment with 60% homology to the phosphoglycerate mutase of Bacillus subtilis (Table 1). Northern blot analysis confirmed that the threonyl-tRNA synthetase (Fig. 4A), the phosphoglycerate mutase (Fig. 4B), and the triosephosphate isomerase (Fig. 4C) were differentially expressed in biofilm and planktonic cultures of S. aureus.
FIG. 3.

Micro-RDA of sessile versus planktonic S. aureus populations grown in unsupplemented medium. The biofilm-forming and planktonic populations were grown in TSB-glucose medium. The amplicons and DPs were electrophoresed through a 2% agarose gel and stained with ethidium bromide. Lanes 1 to 3, amplicon and DPs of micro-RDA using biofilm-derived RNA as the tester and plankton-derived RNA as the driver; lanes 4 to 6, amplicon and DPs of micro-RDA using plankton-derived RNA as the tester and biofilm-derived RNA as the driver; lane 1, amplicon biofilm; lane 4, amplicon planktonic culture; lanes 2 and 5, DP 1; lanes 3 and 6, DP 2; lane M, molecular size markers.
TABLE 1.
Homology of nucleotide sequences obtained by shotgun cloning of DP 2 generated by cDNA micro-RDAa
| Homologous sequence (% of homology) | Organism | No. of DP 2 gene fragments |
|---|---|---|
| Threonyl-tRNA synthetase (98) | S. aureus | 12 |
| Phosphoglycerate mutase (60) | B. subtilis | 14 |
| Triosephosphate isomerase (98) | S. aureus | 2 |
| 23S rRNA (98) | S. aureus | 4 |
Micro-RDA was performed to compare biofilm (tester) and planktonic (driver) populations. Tester and driver populations were cultivated in TSB-glucose medium.
Homology was determined by comparison to sequences in the EMBL procaryote library using the Fasta program (36).
FIG. 4.
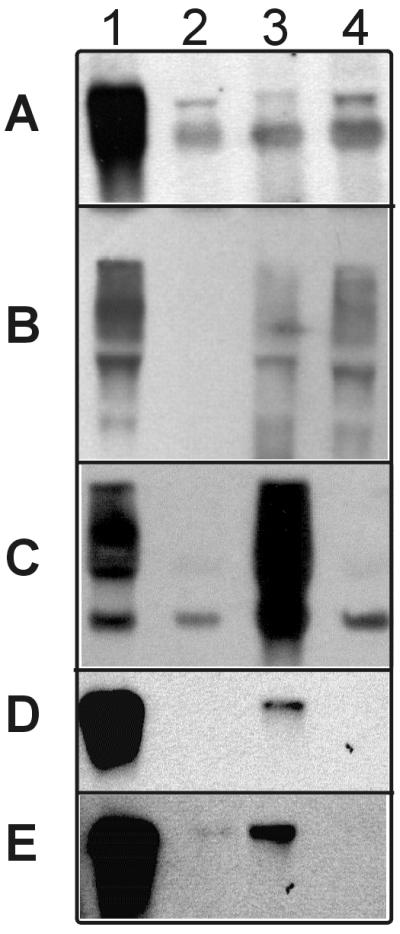
Northern blot analysis of S. aureus DSM 20231 RNA derived from biofilm (lanes 1 and 3) and planktonic (lanes 2 and 4) cultures probed with digoxigenin-labeled DPs (A to E) obtained by micro-RDA. Lanes 1 and 2, RNAs derived from cells cultivated in TSB-glucose medium; lanes 3 and 4, RNA derived from cells cultivated in TSB-glucose medium supplemented with 1% threonine. (A) DP 11/10 (fragment of the threonyl-tRNA synthetase); (B) DP P4 (with homology to the phosphoglycerate mutase of B. subtilis); (C) DP P9 (fragment of the triosephosphate isomerase); (D) DP 11/6 (with homology to the alcohol dehydrogenase of Zymomonas mobilis); (E) DP 11/1 (homology to clpC of B. subtilis).
Since threonine starvation simultaneously induces two threonyl-tRNA synthetase genes (thrS and thrZ) in B. subtilis (41, 42) and since the thrZ gene has high homology to the threonyl-tRNA synthetase of S. aureus, we investigated whether the threonine concentration in the culture medium also has an influence on the level of expression of this enzyme in S. aureus. Figure 4A shows that the level of threonine-tRNA synthetase in the threonine-supplemented medium was greatly reduced in comparison to the level of threonyl-tRNA synthetase observed in biofilms of S. aureus in unsupplemented medium. Thus, the threonine concentration in the medium also affects the expression of the threonyl-tRNA synthetase in S. aureus. The threonine concentration in the culture medium not only affects the expression level of the threonyl-tRNA synthetase but also affects the expression of the phosphoglycerate mutase. After threonine supplementation, the biofilm-specific change in the level of expression of this enzyme could no longer be detected.
Because the threonyl-tRNA synthetase seemed to be one of the predominant differentially expressed genes and since the expression of this enzyme is reduced after threonine supplementation, a second subtraction assay was performed. In this experiment, biofilm and planktonic populations were grown in TSB-glucose medium supplemented with 1% threonine. This time, three rounds of micro-RDA were performed with biofilm-derived RNA as the tester and RNA from the planktonic culture as the driver. Again, the banding pattern on an agarose gel of DP 1 was indistinguishable from that of the amplicon (Fig. 5). After two rounds of micro-RDA, fragments corresponding to differentially expressed genes were evident, and after three rounds of subtractive hybridization, there was little change in the banding pattern of DP 3 compared to that of DP 2. In comparison to DP 2 from the first experiment, where the culture medium contained no threonine supplementation (Fig. 3), the banding patterns of DP 2 and DP 3 appeared to contain fewer fragments overall.
FIG. 5.
Micro-RDA of sessile versus planktonic S. aureus populations grown in threonine-supplemented medium. Lanes 1 to 4, amplicon and DPs of micro-RDA using biofilm-derived RNA as the tester and planktonic-culture-derived RNA as the driver. The amplicon and DPs were electrophoresed through a 2% agarose gel and stained with ethidium bromide. Lane 1, biofilm amplicon; lane 2, DP 1; lane 3, DP 2; lane 4, DP 3; lanes M, molecular size markers.
In these experiments, rather than cloning the entire DP 3 mixture into the pCRII vector, the agarose gel containing DP 3 was cut with respect to visible bands and the DNAs were extracted and amplified by PCR. Subsequently, these isolated fragments were cloned and sequenced. This procedure enriched for fragments of low abundance in DP 3 and reduced the probability of identifying only clones of the predominant fragments in DP 3. However, by using this method to analyze the DPs, it is not possible to calculate the rate of occurrence of false-positive DPs. By this modified approach, two additional differentially expressed genes were identified. One showed high homology to the clpC gene (presumably identical to the clpC homologue recently localized in the genome of S. aureus in The Institute for Genomic Research database [14]), and the other showed high homology to an alcohol dehydrogenase analog (Table 2). Northern blot analysis confirmed that both the alcohol dehydrogenase (Fig. 4D) and the ClpC ATPase (Fig. 4E) were differentially expressed with and without threonine supplementation in the culture medium. Fragments of the threonyl-tRNA synthetase were also identified in DP 3, but upon threonine supplementation, this difference was not large enough to be confirmed by Northern blot analysis.
TABLE 2.
Homology of nucleotide sequences obtained by isolating and cloning specific bands of DP 3a
| Homologous sequence (% of homology) |
Organism |
|---|---|
| Threonyl-tRNA synthetase (98) | S. aureus |
| Threonyl-tRNA synthetase (98) | S. aureus |
| clpC ATPase (76) | L. lactis |
| clpC ATPase (66) | L. monocytogenes |
| Alcohol dehydrogenase I (64) | Z. mobilis |
| Alcohol dehydrogenase I (65) | E. coli |
| Alcohol dehydrogenase I (65) | Z. mobilis |
DPs 3 were generated by cDNA micro-RDA to compare biofilm (tester) and planktonic (driver) populations. Tester and driver populations were cultivated in TSB-glucose medium supplemented with 1% threonine.
Homology determined by comparison to sequences in the EMBL procaryote library using the Fasta program (36).
DISCUSSION
The aim of this study was to identify genes which are typically expressed in sessile S. aureus populations in contrast to the genes expressed in their planktonic counterparts. To achieve this goal, a positive-selection RDA method was chosen. Hitherto, adaptations of this method were used only for genomic subtractions (25), for eukaryotic cDNA subtractions (21, 34), and for cDNA subtraction of the gram-negative bacteria Neisseria meningitidis (2) and Pseudomonas aeruginosa (52). In this study we have further developed a cDNA micro-RDA (35) for use with gram-positive bacteria. In contrast to the previously described cDNA subtraction methods, the micro-RDA technique described here eliminates most of the highly abundant rRNAs without the use of methods for enriching for transcribed gene fragments in total RNA or total cDNA (15, 38, 50) or removing the rRNA by spiking the driver fraction with rRNA molecules with its inherent difficulty to adapt this method to other bacterial species (2). This marks significant progress in the feasibility, sensitivity, and ease of subtractive methods for the analysis of prokaryotic gene expression.
To achieve the high stringency necessary for the removal of all rRNA molecules, two modifications to the original method were critical. First, the amount of driver DNA in the hybridization reaction mixture was increased 10-fold after each subsequent selective enrichment. Second, to ensure complete hybridization, a phenol emulsion reassociation step was introduced. The PERT increases the rate of hybridization by decreasing the aqueous volume (46). The reduction of the aqueous volume also allows a significant reduction in the amount of tester cDNA required: only 1 ng of tester DNA was used during subtractive hybridization. Stable phenol emulsion was maintained by thermal cycling (27). Since phenol depresses the Tm of DNA duplexes (23), raising the temperature to 65°C not only allows one to maintain the phenolic emulsion but also causes nonhomologous DNA duplexes to disassociate, thereby reducing the number of false-positive DPs.
In the RDA technique described earlier (2), four rounds of conventional RDA had to be performed. In micro-RDA, only two rounds of subtractive hybridization and selective amplification appear to be sufficient for generation of specific DPs. A third round of micro-RDA may lead to a further reduction in the number of false-positive fragments, but on the other hand, this may increase the loss of rare transcripts during the steps of adapter changes.
Despite the stringent conditions, micro-RDA is as sensitive as conventional RDA (34). The micro-RDA sensitivity test confirmed that even low-copy-number mRNAs could be detected (Fig. 2). Smaller fragments hybridize more efficiently and are amplified more efficiently by PCR. The amplification efficiencies of PCR products are also affected by the nucleotide sequence of the DNA fragment (49). Thus, the probability of identifying differentially expressed genes depends also on the chosen restriction enzyme. A frequently cutting restriction enzyme like the 4-base cutter DpnII should be used during amplicon synthesis. Another possibility for identifying rare transcripts would be the spiking of the driver fraction with highly abundant tester fragments. Apart from high-stringency subtraction conditions, in our study additional factors may have contributed to a limited number of detected differentially expressed transcripts. Planktonic or biofilm populations may consist of subpopulations with variant expression phenotypes as a result of the localization of the bacteria or environmental factors such as pH and oxygen levels, resulting in microheterogeneity of the subpopulations. Furthermore, despite the preparative precautions, some cross-contamination of the biofilm population with bacteria from the planktonic population might have occurred during the harvest and might suffice for removal of different transcripts under high-stringency conditions. Therefore, the five genes identified in our study do not necessarily or likely comprise all genes differently expressed in an S. aureus biofilm population. However, our analysis allows recognition of differently expressed transcripts whose identification would have been difficult to achieve using targeted expression analysis approaches.
In this study we identified five genes which are differentially expressed in biofilm and planktonic populations of S. aureus. Three of the upregulated genes, those for phosphoglycerate mutase, triosephosphate isomerase, and alcohol dehydrogenase, encode enzymes of the glycolysis or fermentation pathway. It is known that oxygen is limited in deeper layers of biofilm (53), and it has been shown for E. coli that the gene expression pattern within a biofilm is altered due to oxygen limitation (40). Thus, the upregulation of these three enzymes may be a consequence of oxygen limitation within the biofilm. On the other hand, it has been shown that glycolytic enzymes possess additional properties when they are located on the cell surface. For example the α-enolase of streptococci display a strong plasmin(ogen) binding activity on a streptococcal surface (33). In S. aureus, a surface-associated transferrin-binding protein was identified as the glycolytic enzyme glyceraldehyde-3-phosphate dehydrogenase (GAPDH) (28, 29). Thus, it is intriguing to speculate that, in biofilms, the expression of the glycolytic enzymes may be regulated by stimuli other than oxygen tension and may reflect their putative roles in a complex microbial population. Previously, it was shown that the glycolytic enzymes, including the triosephosphate isomerase, the phosphoglycerate mutase, and the α-enolase, are clustered in an operon. This operon is conserved in Staphylococcus, Bacillus, and Lactobacillus spp., and Northern blot analysis indicated the existence of multiple mRNA species (B. Modun, J. Morrissey, A. Cockayne, and P. Williams, Abstr. 9th Int. Symp. Staphylococci Staphylococcal Infect., abstr. 155, 2000). Despite highly stringent conditions (68°C, buffer containing 50% formamide), Northern analysis of the triosephosphate isomerase showed several hybridization products in the biofilm RNA but not in the planktonic culture (Fig. 4C). This finding may indicate the existence of multiple mRNA species of this gene during biofilm formation.
Furthermore, it was shown that threonyl-tRNA synthetase is upregulated in an S. aureus biofilm. It has been proposed that at least some of the cells in a biofilm may experience nutrient limitation and therefore exist in a slow-growing or starved state (3, 4, 9). Since the expression of this aminoacyl-tRNA synthetase is downregulated in biofilms after threonine supplementation, it seems to be possible that threonine starvation is the reason for this finding.
The fifth gene that is upregulated in S. aureus biofilms is the clpC homologue. It encodes the ClpC ATPase, a general stress protein, and can be found in a large variety of prokaryotic and eukaryotic organisms. It has multiple functions, e.g., it participates in the degradation of misfolded proteins and is involved in sporulation, cell division, and the regulation of the competence genes and several virulence factors (5, 24, 39). In degradation, ClpC acts as the ATPase partner of ClpP protease. Since it has been shown that clpP is essential for biofilm formation in Pseudomonas fluorescens (32), it is plausible that this gene also plays an important role in the biofilm formation of S. aureus.
In conclusion, this study details an adaptation of RDA that enables highly specific detection of differentially expressed mRNA species in two different S. aureus populations. Five genes specifically expressed in an S. aureus biofilm were identified. Further analysis of the functions of these genes may provide insights into environmental sensing and metabolism within staphylococcal biofilms. Micro-RDA proved to be a valuable method for detection of differentially expressed genes in complex microbial systems.
ACKNOWLEDGMENT
This study was supported by a grant from the Deutsche Forschungsgemeinschaft (Priority Programme grant 1047).
REFERENCES
- 1.Altschul S F, Madden T L, Schaffer A A, Zhang J, Zhang Z, Miller W, Lipman D J. Gapped BLAST and PSI-BLAST: a new generation of protein database search programs. Nucleic Acids Res. 1997;25:3389–3402. doi: 10.1093/nar/25.17.3389. [DOI] [PMC free article] [PubMed] [Google Scholar]
- 2.Bowler L D, Hubank M, Spratt B G. Representational difference analysis of cDNA for the detection of differential gene expression in bacteria: development using a model of iron-regulated gene expression in Neisseria meningitidis. Microbiology. 1999;145:3529–3537. doi: 10.1099/00221287-145-12-3529. [DOI] [PubMed] [Google Scholar]
- 3.Brown M R, Allison D G, Gilbert P. Resistance of bacterial biofilms to antibiotics: a growth-rate related effect? J Antimicrob Chemother. 1988;22:777–780. doi: 10.1093/jac/22.6.777. [DOI] [PubMed] [Google Scholar]
- 4.Brown M R, Williams P. Influence of substrate limitation and growth phase on sensitivity to antimicrobial agents. J Antimicrob Chemother. 1985;15(Suppl. A):7–14. doi: 10.1093/jac/15.suppl_a.7. [DOI] [PubMed] [Google Scholar]
- 5.Charpentier E, Novak R, Tuomanen E. Regulation of growth inhibition at high temperature, autolysis, transformation and adherence in Streptococcus pneumoniae by clpC. Mol Microbiol. 2000;37:717–726. doi: 10.1046/j.1365-2958.2000.02011.x. [DOI] [PubMed] [Google Scholar]
- 6.Cheung A L, Eberhardt K J, Fischetti V A. A method to isolate RNA from gram-positive bacteria and mycobacteria. Anal Biochem. 1994;222:511–514. doi: 10.1006/abio.1994.1528. [DOI] [PubMed] [Google Scholar]
- 7.Chomczynski P. One-hour downward alkaline capillary transfer for blotting of DNA and RNA. Anal Biochem. 1992;201:134–139. doi: 10.1016/0003-2697(92)90185-a. [DOI] [PubMed] [Google Scholar]
- 8.Christensen G D, Simpson W A, Younger J J, Baddour L M, Barrett F F, Melton D M, Beachey E H. Adherence of coagulase-negative staphylococci to plastic tissue culture plates: a quantitative model for the adherence of staphylococci to medical devices. J Clin Microbiol. 1985;22:996–1006. doi: 10.1128/jcm.22.6.996-1006.1985. [DOI] [PMC free article] [PubMed] [Google Scholar]
- 9.Chuard C, Lucet J-C, Rohner P, Herrmann M, Auckenthaler R, Waldvogel F A, Lew D. Resistance of Staphylococcus aureus recovered from infected foreign body in vivo to killing by antimicrobials. J Infect Dis. 1991;163:1369–1373. [PubMed] [Google Scholar]
- 10.Costerton J W, Stewart P S, Greenberg E P. Bacterial biofilms: a common cause of persistent infections. Science. 1999;284:1318–1322. doi: 10.1126/science.284.5418.1318. [DOI] [PubMed] [Google Scholar]
- 11.Cozens R M, Tuomanen E, Tosch W, Zak O, Suter J, Tomasz A. Evaluation of the bactericidal activity of β-lactam antibiotics on slowly growing bacteria cultured in the chemostat. Antimicrob Agents Chemother. 1986;29:797–802. doi: 10.1128/aac.29.5.797. [DOI] [PMC free article] [PubMed] [Google Scholar]
- 12.de Saizieu A, Certa U, Warrington J, Gray C, Keck W, Mous J. Bacterial transcript imaging by hybridization of total RNA to oligonucleotide arrays. Nat Biotechnol. 1998;16:45–48. doi: 10.1038/nbt0198-45. [DOI] [PubMed] [Google Scholar]
- 13.Foster T J, Höök M. Surface protein adhesions of Staphylococcus aureus. Trends Microbiol. 1998;6:484–488. doi: 10.1016/s0966-842x(98)01400-0. [DOI] [PubMed] [Google Scholar]
- 14.Gertz S, Engelmann S, Schmid R, Ziebandt A K, Tischer K, Scharf C, Hacker J, Hecker M. Characterization of the sigmaB regulon in Staphylococcus aureus. J Bacteriol. 2000;182:6983–6991. doi: 10.1128/jb.182.24.6983-6991.2000. [DOI] [PMC free article] [PubMed] [Google Scholar]
- 15.Graham J E, Clark-Curtiss J E. Identification of Mycobacterium tuberculosis RNAs synthesized in response to phagocytosis by human macrophages by selective capture of transcribed sequences (SCOTS) Proc Natl Acad Sci USA. 1999;96:11554–11559. doi: 10.1073/pnas.96.20.11554. [DOI] [PMC free article] [PubMed] [Google Scholar]
- 16.Handfield M, Levesque R C. Strategies for isolation of in vivo expressed genes from bacteria. FEMS Microbiol Rev. 1999;23:69–91. doi: 10.1111/j.1574-6976.1999.tb00392.x. [DOI] [PubMed] [Google Scholar]
- 17.Hartleib J, Köhler N, Dickinson R B, Chhatwal G S, Sixma J J, Hartford O M, Foster T J, Peters G, Kehrel B E, Herrmann M. Protein A is the von Willebrand factor binding protein on Staphylococcus aureus. Blood. 2000;96:2149–2156. [PubMed] [Google Scholar]
- 18.Heilmann C, Gerke C, Perdreau-Remington F, Götz F. Characterization of Tn917 insertion mutants of Staphylococcus epidermidis affected in biofilm formation. Infect Immun. 1996;64:277–282. doi: 10.1128/iai.64.1.277-282.1996. [DOI] [PMC free article] [PubMed] [Google Scholar]
- 19.Herrmann M, Hartleib J, Kehrel B, Montgomery R R, Sixma J J, Peters G. Interaction of von Willebrand factor with Staphylococcus aureus. J Infect Dis. 1997;176:984–991. doi: 10.1086/516502. [DOI] [PubMed] [Google Scholar]
- 20.Herrmann M, Lai Q J, Albrecht R M, Mosher D F, Proctor R A. Adhesion of Staphylococcus aureus to surface-bound platelets: role of fibrinogen/fibrin and platelet integrins. J Infect Dis. 1993;167:312–322. doi: 10.1093/infdis/167.2.312. [DOI] [PubMed] [Google Scholar]
- 21.Hubank M, Schatz D G. Identifying differences in mRNA expression by representational difference analysis of cDNA. Nucleic Acids Res. 1994;22:5640–5648. doi: 10.1093/nar/22.25.5640. [DOI] [PMC free article] [PubMed] [Google Scholar]
- 22.Ji G, Beavis R, Novick R P. Bacterial interference caused by autoinducing peptide variants. Science. 1997;276:2027–2030. doi: 10.1126/science.276.5321.2027. [DOI] [PubMed] [Google Scholar]
- 23.Kohne D E, Levison S A, Byers M J. Room temperature method for increasing the rate of DNA reassociation by many thousandfold: the phenol emulsion reassociation technique. Biochemistry. 1977;16:5329–5341. doi: 10.1021/bi00643a026. [DOI] [PubMed] [Google Scholar]
- 24.Krüger E, Hecker M. The first gene of the Bacillus subtilis clpC operon, ctsR, encodes a negative regulator of its own operon and other class III heat shock genes. J Bacteriol. 1998;180:6681–6688. doi: 10.1128/jb.180.24.6681-6688.1998. [DOI] [PMC free article] [PubMed] [Google Scholar]
- 25.Lisitsyn N, Lisitsyn N, Wigler M. Cloning the differences between two complex genomes. Science. 1993;259:946–951. doi: 10.1126/science.8438152. [DOI] [PubMed] [Google Scholar]
- 26.McKenney D, Pouliot K L, Wang Y, Murthy V, Ulrich M, Doring G, Lee J C, Goldmann D A, Pier G B. Broadly protective vaccine for Staphylococcus aureus based on an in vivo-expressed antigen. Science. 1999;284:1523–1527. doi: 10.1126/science.284.5419.1523. [DOI] [PubMed] [Google Scholar]
- 27.Miller R D, Riblet R. Improved phenol emulsion DNA reassociation technique (PERT) using thermal cycling. Nucleic Acids Res. 1995;23:2339–2340. doi: 10.1093/nar/23.12.2339. [DOI] [PMC free article] [PubMed] [Google Scholar]
- 28.Modun B, Morrissey J, Williams P. The staphylococcal transferrin receptor: a glycolytic enzyme with novel functions. Trends Microbiol. 2000;8:231–237. doi: 10.1016/s0966-842x(00)01728-5. [DOI] [PubMed] [Google Scholar]
- 29.Modun B, Williams P. The staphylococcal transferrin-binding protein is a cell wall glyceraldehyde-3-phosphate dehydrogenase. Infect Immun. 1999;67:1086–1092. doi: 10.1128/iai.67.3.1086-1092.1999. [DOI] [PMC free article] [PubMed] [Google Scholar]
- 30.Nichols W W. Susceptibility of biofilms to toxic compounds. In: Characklis W G, Wilderer P A, editors. Structure and function of biofilms. New York, N.Y: John Wiley & Sons Ltd.; 1989. pp. 321–331. [Google Scholar]
- 31.Nichols W W, Dorrington S M, Slack M P, Walmsley H L. Inhibition of tobramycin diffusion by binding to alginate. Antimicrob Agents Chemother. 1988;32:518–523. doi: 10.1128/aac.32.4.518. [DOI] [PMC free article] [PubMed] [Google Scholar]
- 32.O'Toole G A, Kolter R. Initiation of biofilm formation in Pseudomonas fluorescens WCS365 proceeds via multiple, convergent signalling pathways: a genetic analysis. Mol Microbiol. 1998;28:449–461. doi: 10.1046/j.1365-2958.1998.00797.x. [DOI] [PubMed] [Google Scholar]
- 33.Pancholi V, Fischetti V A. α-Enolase, a novel strong plasmin(ogen) binding protein on the surface of pathogenic streptococci. J Biol Chem. 1998;273:14503–14515. doi: 10.1074/jbc.273.23.14503. [DOI] [PubMed] [Google Scholar]
- 34.Pastorian K, Hawel L I I I, Byus C V. Optimization of cDNA representational difference analysis for the identification of differentially expressed mRNAs. Anal Biochem. 2000;283:89–98. doi: 10.1006/abio.2000.4622. [DOI] [PubMed] [Google Scholar]
- 35.PathoGenesis Corporation. June 1998. U.S. patent 5,759,780. Methods for enriching target nucleic acid sequences. (Inventors: J. D. Parker, K. T. Smith, and P. B. Challoner.)
- 36.Pearson W R, Lipman D J. Improved tools for biological sequence comparison. Proc Natl Acad Sci USA. 1988;85:2444–2448. doi: 10.1073/pnas.85.8.2444. [DOI] [PMC free article] [PubMed] [Google Scholar]
- 37.Pfaller M, Davenport D, Bale M, Barrett M, Koontz F, Massanari R M. Development of the quantitative micro-test for slime production by coagulase-negative staphylococci. Eur J Clin Microbiol Infect Dis. 1988;7:30–33. doi: 10.1007/BF01962167. [DOI] [PubMed] [Google Scholar]
- 38.Plum G, Clark-Curtiss J E. Induction of Mycobacterium avium gene expression following phagocytosis by human macrophages. Infect Immun. 1994;62:476–483. doi: 10.1128/iai.62.2.476-483.1994. [DOI] [PMC free article] [PubMed] [Google Scholar]
- 39.Porankiewicz J, Wang J, Clarke A K. New insights into the ATP-dependent Clp protease: Escherichia coli and beyond. Mol Microbiol. 1999;32:449–458. doi: 10.1046/j.1365-2958.1999.01357.x. [DOI] [PubMed] [Google Scholar]
- 40.Prigent-Combaret C, Vidal O, Dorel C, Lejeune P. Abiotic surface sensing and biofilm-dependent regulation of gene expression in Escherichia coli. J Bacteriol. 1999;181:5993–6002. doi: 10.1128/jb.181.19.5993-6002.1999. [DOI] [PMC free article] [PubMed] [Google Scholar]
- 41.Putzer H, Gendron N, Grunberg-Manago M. Co-ordinate expression of the two threonyl-tRNA synthetase genes in Bacillus subtilis: control by transcriptional antitermination involving a conserved regulatory sequence. EMBO J. 1992;11:3117–3127. doi: 10.1002/j.1460-2075.1992.tb05384.x. [DOI] [PMC free article] [PubMed] [Google Scholar]
- 42.Putzer H, Laalami S, Brakhage A A, Condon C, Grunberg-Manago M. Aminoacyl-tRNA synthetase gene regulation in Bacillus subtilis: induction, repression and growth-rate regulation. Mol Microbiol. 1995;16:709–718. doi: 10.1111/j.1365-2958.1995.tb02432.x. [DOI] [PubMed] [Google Scholar]
- 43.Ramsay G. DNA chips: state-of-the art. Nat Biotechnol. 1998;16:40–44. doi: 10.1038/nbt0198-40. [DOI] [PubMed] [Google Scholar]
- 44.Rauhut R, Klug G. mRNA degradation in bacteria. FEMS Microbiol Rev. 1999;23:353–370. doi: 10.1111/j.1574-6976.1999.tb00404.x. [DOI] [PubMed] [Google Scholar]
- 45.Regnier P, Arraiano C M. Degradation of mRNA in bacteria: emergence of ubiquitous features. Bioessays. 2000;22:235–244. doi: 10.1002/(SICI)1521-1878(200003)22:3<235::AID-BIES5>3.0.CO;2-2. [DOI] [PubMed] [Google Scholar]
- 46.Sagerstrom C G, Sun B I, Sive H L. Subtractive cloning: past, present, and future. Annu Rev Biochem. 1997;66:751–783. doi: 10.1146/annurev.biochem.66.1.751. [DOI] [PubMed] [Google Scholar]
- 47.Sarkar N. Polyadenylation of mRNA in prokaryotes. Annu Rev Biochem. 1997;66:173–197. doi: 10.1146/annurev.biochem.66.1.173. [DOI] [PubMed] [Google Scholar]
- 48.Soares M B. Identification and cloning of differentially expressed genes. Curr Opin Biotechnol. 1997;8:542–546. doi: 10.1016/s0958-1669(97)80026-2. [DOI] [PubMed] [Google Scholar]
- 49.Spinella D G, Bernardino A K, Redding A C, Koutz P, Wei Y, Pratt E K, Myers K K, Chappell G, Gerken S, McConnell S J. Tandem arrayed ligation of expressed sequence tags (TALEST): a new method for generating global gene expression profiles. Nucleic Acids Res. 1999;27:22. doi: 10.1093/nar/27.18.e22. [DOI] [PMC free article] [PubMed] [Google Scholar]
- 50.Su C, Sordillo L M. A simple method to enrich mRNA from total prokaryotic RNA. Mol Biotechnol. 1998;10:83–85. doi: 10.1007/BF02745865. [DOI] [PubMed] [Google Scholar]
- 51.Van den Bergh M F, Verbrugh H A. Carriage of Staphylococcus aureus: epidemiology and clinical relevance. J Lab Clin Med. 1999;133:525–534. doi: 10.1016/s0022-2143(99)90181-6. [DOI] [PubMed] [Google Scholar]
- 52.Westbrock-Wadman S, Sherman D R, Hickey M J, Coulter S N, Zhu Y Q, Warrener P, Nguyen L Y, Shawar R M, Folger K R, Stover C K. Characterization of a Pseudomonas aeruginosa efflux pump contributing to aminoglycoside impermeability. Antimicrob Agents Chemother. 1999;43:2975–2983. doi: 10.1128/aac.43.12.2975. [DOI] [PMC free article] [PubMed] [Google Scholar]
- 53.Xu K D, Stewart P S, Xia F, Huang C T, McFeters G A. Spatial physiological heterogeneity in Pseudomonas aeruginosa biofilm is determined by oxygen availability. Appl Environ Microbiol. 1998;64:4035–4039. doi: 10.1128/aem.64.10.4035-4039.1998. [DOI] [PMC free article] [PubMed] [Google Scholar]