

Abstract
Depression recurrence is debilitating, and there is a pressing need to develop clinical tools that detect the re-emergence of symptoms with the aim of bridging patients to treatment before recurrences. At baseline, remitted depressed adults (n=22) and healthy controls (n=24) were administered clinical interviews and completed self-report symptom measures. Then, smartphone apps were installed on personal smartphones to acquire geolocation data over 21 days and ecological momentary assessment of positive and negative affect during the initial 14-day period. Compared with healthy controls, remitted depressed adults exhibited reduced circadian routine (regularity of one’s daily routine) and lower average daily distance traveled. Further, reduced distance traveled associated with greater daily negative affect after controlling for depression severity; however, this effect was not more pronounced among remitted adults. A LASSO regression indicated that a linear combination of circadian routine, average distance traveled, and baseline depression severity classified remitted depressed individuals with 72% accuracy; outperforming models restricted to either geolocation or clinical measures alone. Mobile sensing approaches hold enormous promise to improve clinical care for depressive disorders. Although barriers remain, leveraging technological advancements related to real-time monitoring can improve treatment for depressed patients and potentially, reduce high rates of recurrence.
Keywords: Major Depression, Remission, Recurrence, Mobile Sensing, Real-Time Monitoring
General Scientific Summary
Given that MDD frequently recurs, there is a critical need to develop clinical tools that detect the re-emergence of depressive symptoms. Our findings suggest that diminished activity levels—assessed continuously through smartphone-based mobile sensor approaches—continue into remission among depressed adults. Specifically, remitted depressed adults were characterized by reduced circadian routine (i.e., regularity of one’s daily routine) and lower average daily distance traveled over a 3-week period.
Introduction
Major depressive disorder (MDD) is a leading cause of disability worldwide, and at least one in five US adults will experience a depressive episode in their lifetime (Hasin & Grant, 2015). MDD is highly recurrent: nearly 60% of people with a first lifetime episode will experience another depressive episode, 70% of those reporting 2 episodes experience a third, and 90% of cases with three or more episodes experience additional recurrences (Monroe & Harkness, 2011; Solomon et al., 2000). Recurrence is associated with increased suicide risk (Lee, 2003; Sokero et al., 2005), and thus, there is a pressing need to develop clinical tools that detect the re-emergence of depression, particularly tracking residual symptoms persisting into remission that can predict subsequent episodes (Judd et al., 1998).
Despite effective treatments for depression, incomplete remission is common (Conradi, Ormel, & De Jonge, 2011; Fava, Rafanelli, Grandi, Conti, & Belluardo, 1998; Thase et al., 1992), and residual symptoms are a robust predictor of recurrence (Judd et al., 1998; Stewart A Shankman et al., 2009). Symptoms related to inactivity appear to be particularly prevalent in remitted depression and potentially related to future depression recurrence. One 3-year prospective study followed adults both during a depressive episode and throughout remission and found that a lack of energy (i.e., fatigue) as well as psychomotor slowing commonly persisted during remission (Conradi et al., 2011). Studies also have shown bidirectional associations between physical activity and mood (Mac Giollabhui, Alloy, & Hartman, 2021; Smith et al., 2021), suggesting that insufficient energy or drive to engage in activities can, for some, negatively affect quality of life and risk for recurrence.
Tools to track patients’ day-to-day activity levels are now available. Mobile sensing approaches—data that are continuously collected through naturalistic smartphone use—can passively monitor changes in mood states and behaviors (e.g., (Allen, Nelson, Brent, & Auerbach, 2019; J. Torous, Staples, & Onnela, 2015). The moment-by-moment assessment in situ has the potential to detect risk states in a person’s natural environment, and accordingly, affords insight about patterns of behavior that may contribute to and/or be a consequence of one’s depression severity. Although not all symptoms are easily observable through mobile sensing data acquisition, geolocation sensors are ideally suited to capture features associated with inactivity (Canzian & Musolesi, 2015; Masud et al., 2020; Moshe et al., 2021; Opoku Asare, Visuri, & Ferreira, 2019). In a non-clinical sample of adults, depression symptom severity correlated with a range of geolocation features including, reduced normalized entropy (i.e., number of places visited per day) and circadian routine (i.e., regularity of one’s daily routine) as well as greater home stay (i.e., total time spent at home) (Saeb et al., 2015). Interestingly, classification models designed to distinguish asymptomatic and mildly symptomatic individuals also showed that specific geolocation features—namely, an ensemble of normalized entropy, circadian routine, and home stay—could accurately classify symptomatic adults (Saeb et al., 2015). Converging evidence from a recent review also highlighted that entropy, circadian routine, and home stay were among the most consistent features associating with depressive symptoms (Rohani, Faurholt-Jepsen, Kessing, & Bardram, 2018). Nevertheless, a substantial portion of these findings were conducted within non-clinical samples, which limits the ability to extrapolate the utility of this approach to patients with MDD.
Although the use of mobile sensing in clinical research has become more commonplace (Torous, Kiang, Lorme, & Onnela, 2016; Torous et al., 2015), the ideal use case for this approach remains an open question. Prior research has highlighted the enormous potential to detect acute clinical phenomena, including the emergence of suicidal behaviors (Allen et al., 2019). Less research, however, has focused on utilizing mobile sensing to monitor patients outside periods of clinical acuity. Given the high rates of recurrence in MDD (Monroe & Harkness, 2011; Solomon et al., 2000), and the clinical significance of inactivity levels (Hiles, Lamers, Milaneschi, & Penninx, 2017), detecting aberrant mobility patterns which commonly occur in depression may afford an opportunity to engage patients in clinical services when symptoms are mild or moderate, when psychotherapeutic interventions may be more effective (Jarrett, Eaves, Grannemann, & Rush, 1991; Persons, Burns, & Perloff, 1988; Thase, Reynolds, Frank, & Simons, 1994). As a preliminary step towards addressing this issue, real-time monitoring data—both mobile sensing and ecological momentary assessment data (EMA)—were acquired from adults with remitted depression and healthy controls to test the following hypotheses. First, we hypothesized that compared to healthy controls, remitted depressed adults would exhibit geolocation disturbances—characterized by greater home stay as well as reduced average distance traveled, circadian routine, and entropy. Second, we tested whether geolocation features related to daily positive and negative affect assessed via EMA. We hypothesized that geolocation disturbances would associate with greater daily negative affect and reduced positive affect, with this effect being more pronounced in remitted depressed individuals. Last, using a least absolute shrinkage and selection operator (LASSO) regression, we tested whether an ensemble of geolocation and clinical features would classify remitted versus healthy individuals. We hypothesized that geolocation features assessed continuously would outperform clinical features assessed at baseline (i.e., self-report measures of depression and anxiety symptoms) in accurately classifying remitted depressed adults. Effective classification would underscore the utility of using mobile sensing approaches, particularly in the service of detecting risk outside periods of clinical acuity when differences in mobility patterns are more pronounced.
Methods
Participants
Participants were recruited from a parent project focused familial risk markers related to depression and anxiety (Weinberg, Liu, Hajcak, & Shankman, 2015). Remitted depressed adults had to report a past major depressive episode; however, this could not have occurred in the 2 months prior to the assessment. Healthy controls reported no lifetime mental disorders. For both groups, additional exclusion criteria included a history of a current major depressive episode and substance use disorders (see Funkhouser et al., 2021). One hundred and four participants from the parent study were re-contacted. Thirty-six participants were ineligible due to a current MDD episode (n=9) or declined to participate (n=27). Additional participants (n=22) were removed due to insufficient geolocation data (i.e., fewer than 7 days). The final sample included 46 participants (Healthy Controls, n=24; Remitted MDD, n=22) who provided geolocation data between 7–20 days (M=16.54, SD=5.70). Three depressed participants reported using antidepressant medication, and the remainder of sample characteristics are summarized in Table 1.
Table 1.
Descriptive Statistics Stratified by Healthy Controls and Remitted Depressed Adults
| HC (n=24) | remMDD (n=22) | t/ χ2 (df) | p | d/ϕ | ||
|---|---|---|---|---|---|---|
| Sex | Women | 18 (75%) | 16 (72.7%) | 0.03 (1) | 0.86 | 0.29 |
| Men | 6 (25%) | 6 (27.3%) | ||||
| Age | 21.8 (3.37) | 22.2 (3.45) | 0.78 (42) | 0.32 | 0.27 | |
| Ethnicity | Caucasian | 8 (33.3%) | 9 (40.9%) | 7.3 (5) | 0.19 | .86 |
| African American | 2 (8.3%) | 4 (18.2%) | ||||
| Hispanic | 6 (25.0%) | 7 (31.8%) | ||||
| Asian | 6 (25%) | 1 (4.5%) | ||||
| Middle Eastern | 2 (8.3%) | 0 (0%) | ||||
| Multiple Races | 0 (0%) | 1 (4.5%) | ||||
| Marital Status | Married or partnered | 0 (0%) | 1 (4.5%) | 2.00 (2) | 0.36 | 0.30 |
| Widowed | 1 (4.2%) | 0 (0%) | ||||
| Never Married | 23 (95.8%) | 21 (95.5%) | ||||
| Highest Education | Less than high school degree | 1 (4.2%) | 0 (0%) | 4.25 (6) | 0.64 | 0.45 |
| High school graduate (or equivalent) | 1 (4.2%) | 4 (18.2%) | ||||
| Some college or current student | 11 (45.8%) | 9 (40.9%) | ||||
| Two- or-four-year-degree | 6 (25%) | 5 (22.7%) | ||||
| Some graduate school or graduate degree | 5 (20.9%) | 4 (18.2%) | ||||
| Employment | Part Time | 5 (20.8%) | 6 (27.3%) | 2.11 (3) | 0.54 | 0.30 |
| Full Time | 4 (16.7%) | 5 (22.7%) | ||||
| Student | 15 (62.5%) | 10 (45.5%) | ||||
| Unemployment | 0 (0%) | 1 (4.5%) | ||||
| IDAS | Baseline Depression | 28.71 (5.54) | 38.23 (9.78) | 4.01 (32.59) | <0.001 | 7.85 |
| Social Anxiety | 6.83 (1.81) | 8.70 (3.92) | 2.07 (29.00) | 0.047 | 3.01 | |
| Geolocation Days | 15.37 (6.57) | 17.81 (4.57) | 1.47 (41) | 0.148 | 0.43 |
Note HC = Healthy Control Subjects; remMDD = Remitted Depressed Subjects; Values are [n (%) or M (SD)] as appropriate; t/χ2 = t-values or /χ2 values; (df) = degrees of freedom; p = significance values; d/φ = effect sizes for t-test or χ2; Days = Number of days with geolocation data.
Procedure
The University of Illinois at Chicago institutional review board approved the study procedures, and participants provided written informed consent. Data were collected from May 2017 through May 2019. At baseline, participants were administered clinical interviews as well as self-report measures assessing demographic information and current symptoms. Following the baseline assessment, Beiwe, a smartphone app designed to acquire mobile sensor features, was installed on each participant’s personal smartphone. Additionally, Metricwire (Metricwire Inc., Kitchener, Canada), a smartphone app that collects EMA data, was installed. In the present study, we focused on features extracted from geolocation data as well as the EMA-based items of positive and negative affect.
Clinical Assessment
Structured Clinical Interview for DSM-5
(SCID-5; First, Williams, Karg, & Spitzer, 2015). Lifetime mental disorders were assessed by interviewers using the SCID-5. The SCID-5 is a semi-structured interview that assesses DSM-5 diagnoses for adults over the age of 18. Prior research has demonstrated strong reliability and validity (Shankman et al., 2018), particularly as it relates to assessing current or past MDD (Osório et al., 2019).
Inventory of Depression and Anxiety Symptoms
(IDAS; Watson et al., 2007). The IDAS is a 99-item self-report measure that assesses symptoms of depression and anxiety over a two-week period on a 5-point Likert-type scale ranging from 1 (Not at All) to (5 Extremely). Analyses focused on the 20-item General Depression subscale, which provides a measure of depression symptoms (Watson et al., 2008; Watson et al., 2007). Research suggests that a score of ≥ 56 within the General Depression subscale may reflect current MDD, and to maximize sensitivity, a score ≥ 47 is the recommended as a cutoff to screen for a potential depressive episode (Stasik-O’Brien et al., 2019). The 24-item Social Anxiety subscale also was included, as depression and anxiety symptoms commonly co-occur (Kessler, Chiu, Demler, & Walters, 2005). Both scales exhibited excellent internal consistency (General Depression α=.89; Social Anxiety α=.92).
Mobile Sensing Data
Geolocation Data.
Beiwe is an open‐source encrypted platform that includes Android and iOS smartphone applications. Raw global positioning system (GPS) data were sampled from smartphones by alternating between on-cycles (GPS data sampled) and off-cycles (no GPS data sampled). The duration of the on-cycle was set to 2 minutes and the duration of the off-cycle to 10 minutes. This simple sampling scheme enables the collection of sufficient data to infer mobility patterns while minimizing smartphone battery drainage (Torous et al., 2016). This approach also enables quantification of the extent of missingness that is not due to design, but due to behavioral or other factors (e.g., participants turning off their phones).
Using methods previously described (Barnett & Onnela, 2020), each sample of GPS data recorded participants’ latitude and longitude that were converted into a mobility trace defined by a sequence of flights and pauses. Flights were defined as segments of linear movement and pauses were defined as periods of time when a person did not move. The curved movement was approximated by multiple sequential flights. If a missing interval was flanked by two pauses at the same location (situated within 50 meters of one another), the missing interval was assumed to be a longer pause at the same location. As the data stream has long periods of structured missingness, we next used a resampling method to estimate a complete connected path of flights and pauses. Each missing period was filled with random draws from the subjects’ empirical distributions of observed flights and pauses to create complete paths that reflected individuals’ observed mobility patterns.
These resulting trajectories were summarized into fifteen daily summary statistics, including: distance travelled (km), radius of gyration (km), maximum diameter between two pause locations in a day (km), significant locations visited, time at home (mins), maximum distance from home (km), average flight length (km), standard deviation of flight length, average flight duration (mins), standard deviation of flight duration (mins), fraction of time stationary, normalized entropy, minutes with missing data, weekday circadian routine, weekday circadian routine. This allowed us to estimate our primary variables of interest: (a) home stay, (b) average distance traveled, (c) circadian routine, and (d) entropy. Homestay was operationalized as the amount of consecutive time spent in one’s home, which was determined based on: (i) location in which a participant spent the longest amount of time between 9PM and 6AM over the course of the study period and (ii) consecutive time spent within a 200-meter radius of home. Average distance traveled reflected the daily distance (meters) each participant traveled.
Circadian routine indexed the regularity of one’s daily routine. This feature measured the extent to which a participants’ sequence of locations followed a similar 24-hour routine. For example, if a given participant left home and returned home around the same time each day, circadian routine would be a higher score. If a participant’s pattern of movement was more irregular, then a circadian routine would be a lower score. Circadian routine was operationalized using the following approach. For two different days, Di and Dj, d(Di, Dj) reflects the fraction of time a person is in the same place (within a 200-meter radius) at the same time of day. This is approximated by using the location of a person at 12:30AM on day Di, and then, determining whether the person is within 200 meters of that location between the hours of 12:00AM and 1:00AM on a given day Dj. Importantly, this is repeated for each 24 one-hour period of the day, and d(Di,Dj) is reported as the fraction of those one-hour periods that a person’s location was in sync, using 200 meters as a buffer. Given m days of geolocation data collected, for a given day, D, lower circadian routine variable reflects a more irregular routine on day D whereas higher values reflect a more consistent circadian routine on day D.
Entropy captured how many locations a person visited as well as the variability of time spent at these locations. For example, suppose there are K significant locations. Let tsk be the time spent on a given day within a 200-meter radius of the kth significant location and let i.e pk be the fraction of time spent at kth location. Then, the entropy for that day is reflected by , with larger values indicating that a person spread their time across many different locations for that day, and small values reflecting fewer significant locations.
Ecological Momentary Assessment
Following the baseline assessment, participants received EMA prompts six times daily via Metricwire (Metricwire Inc., Kitchener, Canada) at random times within stratified 90-min windows between 8:30AM and 10:30PM for 14 consecutive days (occurring during the initial 14-day period of the 21-day mobile sensing data collection). During each prompt, participants received the 10-item Positive and Negative Affect Schedule-Short Form (Kercher, 1992). Positive affect (PA; excited, enthusiastic, alert, inspired, and determined) and negative affect (NA; distressed, upset, scared, nervous, and afraid) items were rated on a 5-point Likert scale ranging from 1 (very slightly or not at all) to 5 (extremely), and item order was randomized each day. Participants had 20 minutes to complete each prompt, after which it was no longer available. Of the forty-six participants with geolocation data, 6 individuals were excluded for providing fewer than 10 responses to EMA prompts, leaving a total of forty participants (Healthy Controls=21, Remitted MDD=19) for EMA-related analyses. Participants completed an average of 46.9 surveys over the 14-day period, corresponding to a response rate of 55.8%.
Data Analysis
Analyses were performed in Rv4.0.3. To test group differences in geolocation features, we performed a preliminary analysis comparing group means (two-sample t-tests) and medians (Wilcoxon tests). To investigate group differences in daily mobility metrics (i.e., daily differences in geolocation indices), we used generalized estimating equations (GEE), accounting for baseline depressive symptoms and included random intercepts and slopes. Identity link was used to model the response variable, and an auto-regressive correlation structure modeled the time-varying effects. Positive and negative skewed outcome variables were log transformed.
To examine relationships between geolocation features and mean levels of momentary PA and NA over the duration of the EMA period, separate multilevel models were estimated for each geolocation feature that showed significance within GEE models. Significant geolocation features were included as a fixed effect predictor of PA or NA with and without the group interaction. Current depression symptoms were included as a covariate in these models.
Using the R tidymodels package (Kuhn & Wickham, 2020), LASSO regression tested which combination of the geolocation variables (i.e., home stay, average distance traveled, circadian routine, and entropy) and clinical features (i.e., baseline depression and social anxiety symptoms) predicted group membership. To evaluate the classification model, we created 1000 bootstrapped sets of features and their corresponding group membership. We then trained and cross-validated the models on each set using 10-fold cross-validation. We selected the tuning parameters for LASSO through an area under the receiver-operating curve (ROC) maximization process. Specifically, data were split between train (75%) and test (25%) sets, stratified by group. A full LASSO was employed, where α = 1. Given α = 1, the only tuning parameter that needed to be tuned was λ. This was accomplished by generating a grid of 50 possible λs, which was then applied to the bootstrapped training set. The λ associated with the highest accuracy was selected for variable selection. The test set was used to evaluate specificity and sensitivity metrics. To evaluate the performance of the classification model, we estimated accuracy, sensitivity, and specificity for models containing: (i) geolocation variables, (ii) clinical variables, and (iii) both geolocation and clinical variables.
Results
Descriptive Statistics
The groups did not differ in age, ethnicity, education level, employment, marital status, or days of geolocation data collected (ps>0.19). However, compared to controls, the remitted group reported greater depression severity, t(54)=5.36, p=.00001, which was included as a covariate in our analyses to rule-out that group differences in geolocation variables were due to residual depressive symptoms (Table 1). Figure S1 summarizes correlations among the four geolocation features. Not surprisingly, home stay was strongly associated with circadian routine. The longer time spent at home was reflected in higher circadian routine scores (i.e., greater regularity in one’s day). Similarly, greater average daily distance traveled and increased entropy were inversely correlated with home stay, reflecting that the less time participants stayed at home the more they moved around each day and visited a greater number of locations (above a set threshold).
Group Comparisons on Geolocation Features
No group differences emerged for home stay, t(755)=1.60, p=0.11, d=0.12, or entropy, t(756)=−0.46, p=.64, d=0.03. By contrast, compared to controls, remitted depressed participants reported a lower circadian routine on average (0.38±0.25 vs. 0.33±0.19; t(699)=−3.19, p=0.001, d=0.23; Figure 1A) and reduced average daily distance traveled (395m±29 vs. 351m±25; t(737)=−2.19, p=0.03, d=0.16; Figure 1B). A nonparametric test, the Wilcox signed-rank test, confirmed that remitted participants reported a lower circadian routine compared to healthy controls, W=78958, p=0.03, d=0.08, as well as reduced average daily distance traveled, W=78673, p=0.04, d=0.075).
Figure 1.
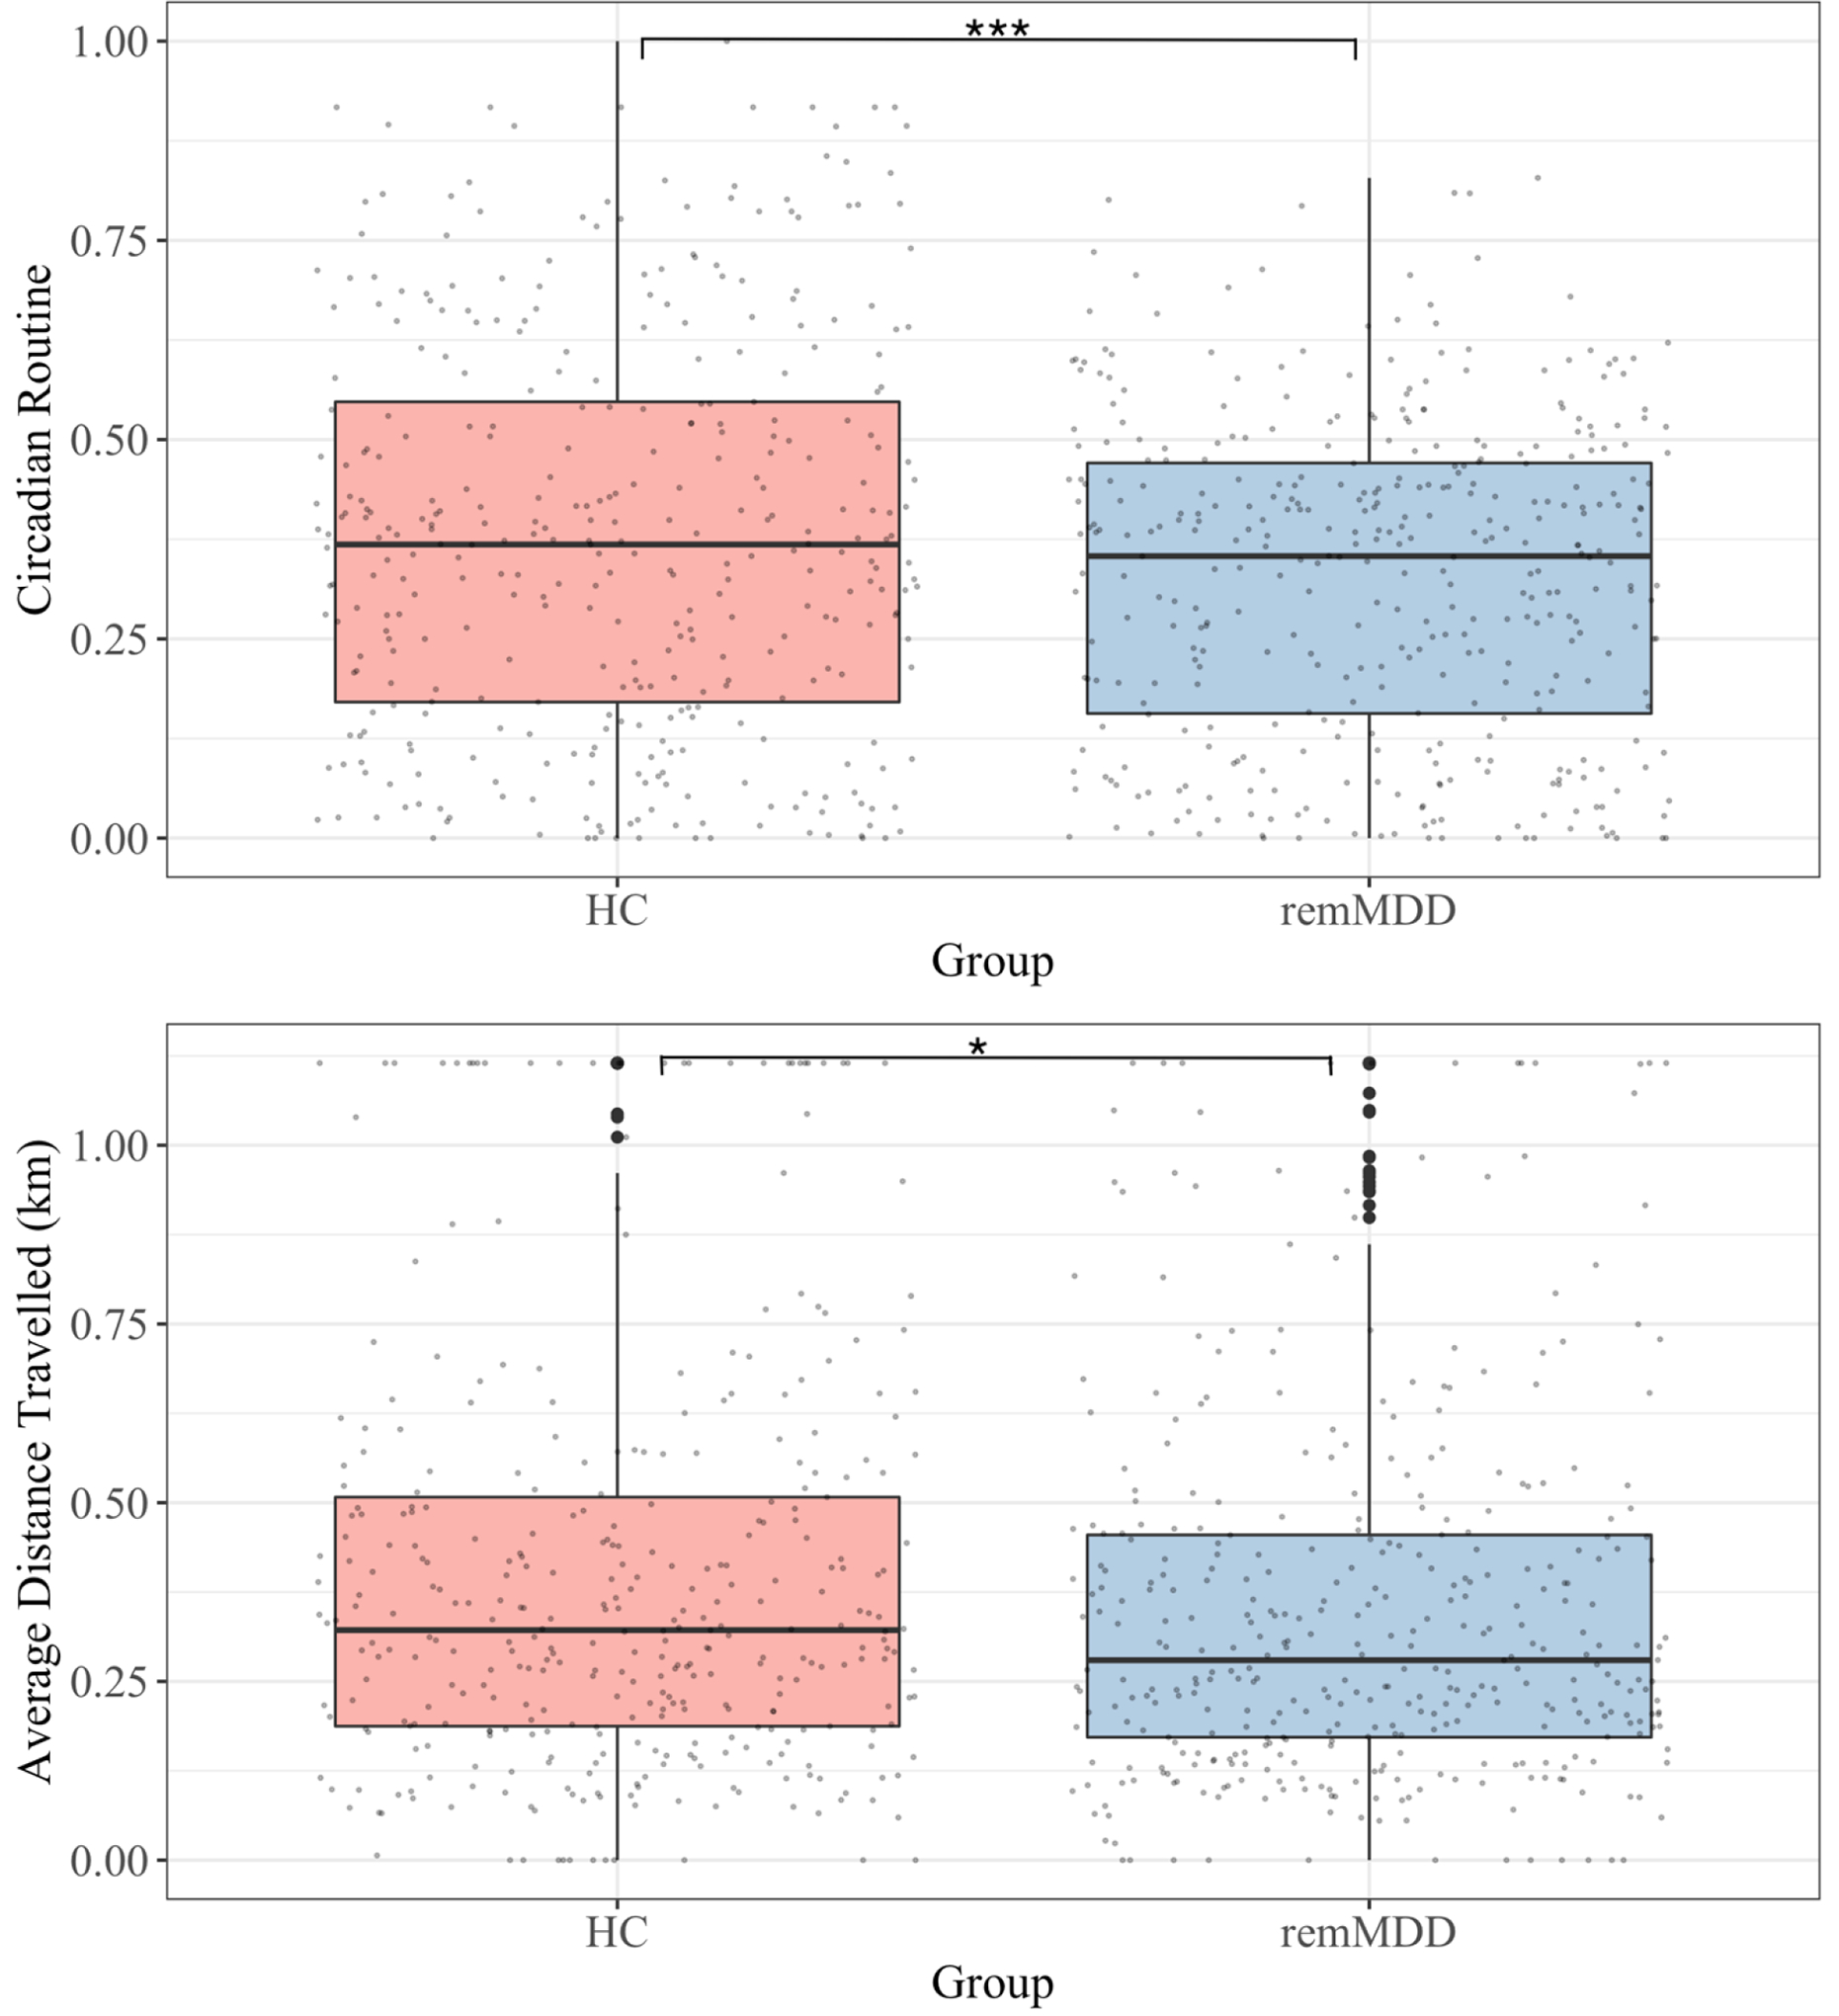
Boxplot Comparison of Circadian Routine and Average Distance Traveled
Note. Top panel shows boxplot comparison of circadian routine between groups across the 20-day study period; Bottom panel displays boxplot comparison of average daily distance traveled across the study period.
*p<.05
***p≤.0001
GEE models tested group differences in averaged geolocation features per day over the 21-day period, controlling for baseline depression symptoms. Relative to healthy controls, remitted MDD participants exhibited reduced average distance traveled per day, mean difference=0.008 km (0.004), p = 0.048) over time (Table 2; Figure 2). No significant effects emerged for home stay, entropy, or circadian routine (ps>.375).
Table 2.
Group Differences in Average Daily Distance Traveled
| Predictor | Beta | 95% CI | Wald | p-value |
|---|---|---|---|---|
| Intercept | 0.37 | [0.28, 0.46] | 15.31 | <.001 |
| Days | 0 | [0, 0] | 0.05 | 0.824 |
| Group | −0.13 | [−0.19, 0.07] | 3.65 | 0.056 |
| Depression Symptoms | 0 | [0, 0] | 0.13 | 0.720 |
| Group × Days | 0.008 | [0.005, 0.013] | 3.95 | 0.047 |
Note. Model results from GEE comparing trends in average distance traveled between healthy controls (n=24) and remitted depressed (n=22) over the 20-day study period; Days=Number of days geolocation data were collected; Beta estimate is unstandardized.
Figure 2.

Group Comparison of Average Distance Traveled During Study Period
Note. HC=Healthy Control; remMDD=Remitted Depressed; Comparing daily average distance traveled over 20-day study period
Ecological Momentary Assessment of Positive and Negative Affect
Preliminary analyses showed no group differences in PA, β=0.27 (0.23), p=0.236, or NA, β=0.07 (0.09), p=0.433. Interestingly, average distance traveled was significantly related to NA, β=−0.21 (0.06), p=0.02, as individuals who traveled less per day reported greater NA over the 14-day period, controlling for baselines depression symptoms (Table 3). This effect, however, did not vary as a function of whether a participant was in the healthy or remitted depressed group, β=0.10 (0.18), p=0.579. Average distance traveled was not related to mean PA, β=0.12 (0.15), p=0.397.
Table 3.
Relationship between Average Daily Distance Traveled and Negative Affect
| Predictor | Beta | 95% CI | df | t-value | p-value |
|---|---|---|---|---|---|
| Intercept | 1.22 | [1.05, 1.37] | 37.56 | 7.33 | <.001 |
| Average Distance Traveled | −0.21 | [−0.27, −0.15] | 450.43 | −3.06 | 0.002 |
| General Depression | 0.004 | [0, 0.08] | 34.96 | 0.95 | 0.340 |
| Group × Average Distance Traveled | 0.10 | [−0.08, 0.28] | 478.75 | 0.55 | 0.579 |
Note. Mixed-effect model testing whether average distance traveled predicts daily negative affect over a 14-day period; Beta estimate is unstandardized.
Regularized Regression Analyses
Using a model including geolocation (i.e., entropy, circadian routine, average distance traveled, and home stay) and clinical features (i.e., depression and social anxiety symptoms), LASSO classification had a superior performance on accuracy and ROC AUC compared to LASSO classification using either geolocation features or clinical variables alone (Table 4). Interestingly, the main predictors of classifying group membership—in the order of strongest to weakest predictor—were circadian routine (coefficient=1.57), average distance traveled (coefficient=0.48), followed by baseline depression symptoms (coefficient=0.146).
Table 4.
Regularized Classification between Adults with Remitted Depression and Healthy Controls
| Model | Accuracy | ROC AUC | Sensitivity | SPecificity |
|---|---|---|---|---|
| LASSO (Geolocation variables) | 0.576 | 0.526 | 0.522 | 0.622 |
| LASSO (Clinical variables) | 0.625 | 0.729 | 0.875 | 0.375 |
| LASSO (Geolocation and Clinical variables) | 0.716 | 0.776 | 0.761 | 0.714 |
Note. Classification results from regularized regression on select geolocation variables (entropy, circadian routine, average distance traveled, and home stay) and clinical variables (depression and social anxiety symptoms).
Discussion
There is a pressing need to develop scalable clinical tools that detect aberrant behavioral patterns in remitted MDD that may lead to recurrence. Compared to healthy adults, remitted depressed individuals exhibited a more irregular circadian routine and reported less average distance traveled, this latter effect accounting for current depression symptoms. Although previous work has shown associations between current depression and mobility features (Saeb et al., 2015), the present study suggests that inactivity may continue into remission. Further, reduced average distance travel associated with greater daily negative affect assessed over a 14-day period, again controlling for baseline depression severity. This effect, however, was not more pronounced among remitted depressed individuals. Highlighting the potential clinical utility of mobile sensing approaches as a complementary clinical tool, results indicated that an ensemble of geolocation disturbances (i.e., circadian routine, average distance traveled) and clinical assessments classified remitted depressed individuals with 72% accuracy; outperforming models restricted to either geolocation features or clinical symptom measures alone (Table 4). Collectively, these findings underscore the potential value of utilizing real-time monitoring approaches with remitted adults, particularly with the goal of continuously monitoring residual symptoms that frequently contribute to recurrence.
Although our results underscore the value-add of tracking discrete geolocation disturbances during remission, these data are not directly monitoring depressive symptoms. This is a critical distinction, as it is tempting to blur the lines as to what we hope to capture versus what we do capture with geolocation features. The inherent strengths and limitations of mobile sensing necessarily shape the clinical scenarios that are optimal for deployment, and given their ease of use and scalability, one potential use is following termination from treatment.
Temporally sensitive geolocation data acquired from smartphones are ideally suited to track within-person changes following treatment, and perhaps, when there are notable deviations in discrete features—for example, reductions in circadian routine and/or average distance traveled which has previously been linked to depression symptom severity (Saeb et al., 2015)—it may signal the need to reconnect with clinical services. It also is noteworthy that specific features may be more state dependent. For example, Saeb and colleagues (2015) found that entropy associated with depression symptom severity. Our results showed no group differences in entropy, suggesting that perhaps it may normalize during periods of remission. Despite the potential upside, there remain barriers to integrating mobile sensing approaches within the typical clinical practice, including patient privacy concerns (e.g., continuously tracking movement each day; (Carter, Liddle, Hall, & Chenery, 2015; John Torous & Roberts, 2017) as well as computational limitations given there are few platforms that process data in real-time and provide accessible information for therapists and clients with interpretable metrics. Ultimately, for mobile sensing approaches to scale in clinical settings these core issues will need to be sufficiently addressed.
Results should be considered in the context of limitations. First, although we utilized a well-characterized sample assessed with gold-standard clinical assessment tools, each group was relatively small, which limits the generalizability. Second, mobile sensing data were acquired for approximately 3 weeks, and data collection was not aligned to a specific clinical event. Future research anchoring real-time monitoring to discrete clinical events (e.g., inpatient discharge, treatment termination) may shed insights about geolocation patterns that covary with depression severity during clinically sensitive periods. Last, mobile sensing has the capacity to collect data across a wide range of smartphone sensors. Accordingly, future research should explore the benefit of integrating multiple features (e.g., accelerometry to measure sleep, sentiment analysis of SMS texting data) to more accurately detect the re-emergence of depression symptoms. Additionally, research focusing on whether specific mobile sensor features map onto discrete clinical features (e.g., anhedonia) as well as complex affective dynamics assessed with intensive EMA (e.g., inertia, instability) may assist with early detection and intervention efforts.
Mobile sensing approaches have enormous promise to improve clinical care for depressive disorders. Our findings highlight the value of focusing on discrete features related to the regularity and structure of one’s daily schedule (i.e., circadian routine) as well as the amount of activity in a given day (i.e., average distance traveled). Neither metric directly reflects depression symptoms but may associate with residual symptoms that predict depression recurrence. Leveraging this known association may provide an opportunity to develop clinical tools that continuously monitor patients with the aim of enhancing prevention and treatment approaches for depressed individuals.
Supplementary Material
Acknowledgements
RPA (R01 MH119771, R21 MH112330, P50 MH090964), SAS (R01 MH119771, R21 MH112330), and JJM (P50 MH090964) were partially supported through funding from NIH/NIMH. The content is solely the responsibility of the authors and does not necessarily represent the official views of the NIH. The funding organization had no role in the design and conduct of the study; collection, management, analysis, and interpretation of the data; preparation, review, or approval of the manuscript; and decision to submit the manuscript for publication.
Footnotes
Conflict of Interest Disclosures
Dr. Auerbach is an unpaid scientific advisor for Ksana Health. Dr. Mann receives royalties from the Research Foundation for Mental Hygiene for commercial use of the C-SSRS. All other authors report no biomedical financial interests or potential conflicts of interest.
To highlight the utility of mobile sensing data, select findings were presented as part of a NIMH-sponsored round table series, Risk, Resilience, and Trajectories of Preteen Suicide. No data were presented at conferences or disseminated elsewhere.
References
- Allen NB, Nelson BW, Brent D, & Auerbach RP (2019). Short-term prediction of suicidal thoughts and behaviors in adolescents: Can recent developments in technology and computational science provide a breakthrough? Journal of affective disorders, 250, 163–169. [DOI] [PMC free article] [PubMed] [Google Scholar]
- Barnett I, & Onnela J-P (2020). Inferring mobility measures from GPS traces with missing data. Biostatistics, 21(2), e98–e112. [DOI] [PMC free article] [PubMed] [Google Scholar]
- Canzian L, & Musolesi M (2015). Trajectories of depression: unobtrusive monitoring of depressive states by means of smartphone mobility traces analysis. Paper presented at the Proceedings of the 2015 ACM international joint conference on pervasive and ubiquitous computing. [Google Scholar]
- Carter A, Liddle J, Hall W, & Chenery H (2015). Mobile phones in research and treatment: ethical guidelines and future directions. JMIR mHealth and uHealth, 3(4), e4538. [DOI] [PMC free article] [PubMed] [Google Scholar]
- Conradi H, Ormel J, & De Jonge P (2011). Presence of individual (residual) symptoms during depressive episodes and periods of remission: a 3-year prospective study. Psychological medicine, 41(6), 1165. [DOI] [PubMed] [Google Scholar]
- Fava GA, Rafanelli C, Grandi S, Conti S, & Belluardo P (1998). Prevention of recurrent depression with cognitive behavioral therapy: preliminary findings. Archives of general psychiatry, 55(9), 816–820. [DOI] [PubMed] [Google Scholar]
- First MB, Williams JBW, Karg RS, & Spitzer RL (2015). Structure Clinical Interview for DSM-5, Research Version (SCID-5-RV). American Psychological Association. Arlington, VA. [Google Scholar]
- Funkhouser CJ, Kaiser AJ, Alqueza KL, Carrillo VL, Hoffman LM, Nabb CB, … Shankman SA (2021). Depression Risk Factors and Affect Dynamics: An Experience Sampling Study. Journal of psychiatric research. [DOI] [PMC free article] [PubMed] [Google Scholar]
- Hasin DS, & Grant BF (2015). The National Epidemiologic Survey on Alcohol and Related Conditions (NESARC) Waves 1 and 2: review and summary of findings. Social psychiatry and psychiatric epidemiology, 50(11), 1609–1640. [DOI] [PMC free article] [PubMed] [Google Scholar]
- Hiles S, Lamers F, Milaneschi Y, & Penninx B (2017). Sit, step, sweat: longitudinal associations between physical activity patterns, anxiety and depression. Psychological medicine, 47(8), 1466–1477. [DOI] [PubMed] [Google Scholar]
- Jarrett RB, Eaves GG, Grannemann BD, & Rush AJ (1991). Clinical, cognitive, and demographic predictors of response to cognitive therapy for depression: a preliminary report. Psychiatry research, 37(3), 245–260. [DOI] [PubMed] [Google Scholar]
- Judd LL, Akiskal HS, Maser JD, Zeller PJ, Endicott J, Coryell W, … Mueller TI (1998). Major depressive disorder: a prospective study of residual subthreshold depressive symptoms as predictor of rapid relapse. Journal of affective disorders, 50(2–3), 97–108. [DOI] [PubMed] [Google Scholar]
- Kercher K (1992). Assessing subjective well-being in the old-old: The PANAS as a measure of orthogonal dimensions of positive and negative affect. Research on Aging, 14(2), 131–168. [Google Scholar]
- Kessler RC, Chiu WT, Demler O, & Walters EE (2005). Prevalence, severity, and comorbidity of 12-month DSM-IV disorders in the National Comorbidity Survey Replication. Archives of general psychiatry, 62(6), 617–627. [DOI] [PMC free article] [PubMed] [Google Scholar]
- Kuhn M, & Wickham H (2020). Tidymodels: a collection of packages for modeling and machine learning using tidyverse principles. Retrieved from https://www.tidymodels.org
- Lee AS (2003). Better outcomes for depressive disorders? Psychological medicine, 33(5), 769–774. [DOI] [PubMed] [Google Scholar]
- Mac Giollabhui N, Alloy LB, & Hartman CA (2021). Investigating whether depressed youth exhibiting elevated C reactive protein perform worse on measures of executive functioning, verbal fluency and episodic memory in a large, population based sample of Dutch adolescents. Brain, Behavior, and Immunity, 94, 369–380. [DOI] [PMC free article] [PubMed] [Google Scholar]
- Masud MT, Mamun MA, Thapa K, Lee D, Griffiths MD, & Yang S-H (2020). Unobtrusive monitoring of behavior and movement patterns to detect clinical depression severity level via smartphone. Journal of biomedical informatics, 103, 103371. [DOI] [PubMed] [Google Scholar]
- Monroe SM, & Harkness KL (2011). Recurrence in major depression: a conceptual analysis. Psychological review, 118(4), 655. [DOI] [PubMed] [Google Scholar]
- Moshe I, Terhorst Y, Asare KO, Sander LB, Ferreira D, Baumeister H, … Pulkki-Råback L (2021). Predicting Symptoms of Depression and Anxiety Using Smartphone and Wearable Data. Frontiers in psychiatry, 12. [DOI] [PMC free article] [PubMed] [Google Scholar]
- Opoku Asare K, Visuri A, & Ferreira DS (2019). Towards early detection of depression through smartphone sensing. Paper presented at the Adjunct Proceedings of the 2019 ACM International Joint Conference on Pervasive and Ubiquitous Computing and Proceedings of the 2019 ACM International Symposium on Wearable Computers. [Google Scholar]
- Osório FL, Loureiro SR, Hallak JEC, Machado-De‐Sousa JP, Ushirohira JM, Baes CVW, … Crippa JAS (2019). Clinical validity and intrarater and test–retest reliability of the Structured Clinical Interview for DSM‐5 – Clinician Version (SCID-5-CV). Psychiatry and Clinical Neurosciences. doi: 10.1111/pcn.12931 [DOI] [PubMed] [Google Scholar]
- Persons JB, Burns DD, & Perloff JM (1988). Predictors of dropout and outcome in cognitive therapy for depression in a private practice setting. Cognitive Therapy and Research, 12(6), 557–575. [Google Scholar]
- Rohani DA, Faurholt-Jepsen M, Kessing LV, & Bardram JE (2018). Correlations between objective behavioral features collected from mobile and wearable devices and depressive mood symptoms in patients with affective disorders: systematic review. JMIR mHealth and uHealth, 6(8), e165. [DOI] [PMC free article] [PubMed] [Google Scholar]
- Saeb S, Zhang M, Karr CJ, Schueller SM, Corden ME, Kording KP, & Mohr DC (2015). Mobile phone sensor correlates of depressive symptom severity in daily-life behavior: an exploratory study. Journal of medical Internet research, 17(7), e175. [DOI] [PMC free article] [PubMed] [Google Scholar]
- Shankman SA, Funkhouser CJ, Klein DN, Davila J, Lerner D, & Hee D (2018). Reliability and validity of severity dimensions of psychopathology assessed using the Structured Clinical Interview for DSM-5 (SCID). International Journal of Methods in Psychiatric Research, 27(1). doi: 10.1002/mpr.1590 [DOI] [PMC free article] [PubMed] [Google Scholar]
- Shankman SA, Lewinsohn PM, Klein DN, Small JW, Seeley JR, & Altman SE (2009). Subthreshold conditions as precursors for full syndrome disorders: a 15 year longitudinal study of multiple diagnostic classes. Journal of Child Psychology and Psychiatry, 50(12), 1485–1494. [DOI] [PMC free article] [PubMed] [Google Scholar]
- Smith KE, Mason TB, O’Connor SM, Wang S, Dzubur E, Crosby RD, … Roemmich JN (2021). Bi-Directional Associations Between Real-Time Affect and Physical Activity in Weight-Discordant Siblings. Journal of Pediatric Psychology, 46(4), 443–453. [DOI] [PMC free article] [PubMed] [Google Scholar]
- Sokero TP, Melartin TK, Rytsälä HJ, Leskelä US, Lestelä-Mielonen PS, & Isometsä ET (2005). Prospective study of risk factors for attempted suicide among patients with DSM–IV major depressive disorder. The British Journal of Psychiatry, 186(4), 314–318. [DOI] [PubMed] [Google Scholar]
- Solomon DA, Keller MB, Leon AC, Mueller TI, Lavori PW, Shea MT, … Maser JD (2000). Multiple recurrences of major depressive disorder. American Journal of Psychiatry, 157(2), 229–233. [DOI] [PubMed] [Google Scholar]
- Stasik-O’Brien SM, Brock RL, Chmielewski M, Naragon-Gainey K, Koffel E, McDade-Montez E, … Watson D (2019). Clinical utility of the Inventory of Depression and Anxiety Symptoms (IDAS). Assessment, 26(5), 944–960. [DOI] [PubMed] [Google Scholar]
- Thase ME, Reynolds CF, Frank E, & Simons AD (1994). Response to cognitive-behavioral therapy in chronic depression. Journal of Psychotherapy Practice & Research. [Google Scholar]
- Thase ME, Simons AD, McGeary J, Cahalane JF, Hughes C, Harden T, & Friedman E (1992). Relapse after cognitive behavior therapy of depression: potential implications for longer courses of treatment. The American journal of psychiatry, 149(8), 1046–1052. [DOI] [PubMed] [Google Scholar]
- Torous J, Kiang MV, Lorme J, & Onnela J-P (2016). New tools for new research in psychiatry: a scalable and customizable platform to empower data driven smartphone research. JMIR Mental Health, 3(2), e16. [DOI] [PMC free article] [PubMed] [Google Scholar]
- Torous J, & Roberts LW (2017). The ethical use of mobile health technology in clinical psychiatry. The Journal of nervous and mental disease, 205(1), 4–8. [DOI] [PubMed] [Google Scholar]
- Torous J, Staples P, & Onnela JP (2015). Realizing the potential of mobile mental health: new methods for new data in psychiatry. Curr Psychiatry Rep, 17(8), 602. doi: 10.1007/s11920-015-0602-0 [DOI] [PMC free article] [PubMed] [Google Scholar]
- Watson D, O’Hara MW, Chmielewski M, McDade-Montez EA, Koffel E, Naragon K, & Stuart S (2008). Further validation of the IDAS: evidence of convergent, discriminant, criterion, and incremental validity. Psychol Assess, 20(3), 248–259. doi: 10.1037/a0012570 [DOI] [PubMed] [Google Scholar]
- Watson D, O’Hara MW, Simms LJ, Kotov R, Chmielewski M, McDade-Montez EA, … Stuart S (2007). Development and Validation of the Inventory of Depression and Anxiety Symptoms (IDAS). Psychological Assessment, 19(3), 253–268. doi: 10.1037/1040-3590/19.3.253 [DOI] [PubMed] [Google Scholar]
- Weinberg A, Liu H, Hajcak G, & Shankman SA (2015). Blunted neural response to rewards as a vulnerability factor for depression: Results from a family study. Journal of abnormal psychology, 124(4), 878. [DOI] [PMC free article] [PubMed] [Google Scholar]
Associated Data
This section collects any data citations, data availability statements, or supplementary materials included in this article.