

Abstract
Understanding the joint impact of vaccination and non-pharmaceutical interventions on COVID-19 development is important for making public health decisions that control the pandemic. Recently, we created a method in forecasting the daily number of confirmed cases of infectious diseases by combining a mechanistic ordinary differential equation (ODE) model for infectious classes and a generalized boosting machine learning model (GBM) for predicting how public health policies and mobility data affect the transmission rate in the ODE model (Wang et al. in Bull Math Biol 84:57, 2022). In this paper, we extend the method to the post-vaccination period, accordingly obtain a retrospective forecast of COVID-19 daily confirmed cases in the US, and identify the relative influence of the policies used as the predictor variables. In particular, our ODE model contains both partially and fully vaccinated compartments and accounts for the breakthrough cases, that is, vaccinated individuals can still get infected. Our results indicate that the inclusion of data on non-pharmaceutical interventions can significantly improve the accuracy of the predictions. With the use of policy data, the model predicts the number of daily infected cases up to 35 days in the future, with an average mean absolute percentage error of , which is further improved to if combined with human mobility data. Moreover, the most influential predictor variables are the policies of restrictions on gatherings, testing and school closing. The modeling approach used in this work can help policymakers design control measures as variant strains threaten public health in the future.
Supplementary Information
The online version contains supplementary material available at 10.1007/s11538-022-01047-x.
Keywords: Inverse method, COVID-19 modeling, Vaccination, Non-pharmaceutical interventions, Generalized boosting machine learning model
Introduction
Since COVID-19 was characterized as a pandemic by World Health Organization (WHO) on March 11, 2020, it has spread to 224 countries and territories. The United States is the country most affected by COVID-19, with 20,629,998 confirmed cases and 369,897 deaths by the end of December 2020 (https://www.worldometers.info/coronavirus/country/us/). Mass vaccination against COVID-19 started on December 20, 2020, in the US. As of December 13, 2021, of the US population have received at least one dose of vaccine, have been fully vaccinated, and have been given a booster shot (Ritchie et al. 2020). Except another small peak in April, the weekly number of new cases kept decreasing nearly monotonically, since mid-January 2021 until June 2021 (Ritchie et al. 2020), which brought a faint hope that the COVID-19 pandemic might be brought under control soon, although this hope has been dashed by the emergence of new COVID-19 variants. Indeed, even when vaccines are available, control of COVID-19 indispensably relies on some non-pharmaceutical interventions (NPIs), such as testing, contact tracing, facial coverings, protection of elderly people, school closing, workplace closing, cancellation of public events, restrictions on gatherings, public transport closing, stay at home requirements (Ritchie et al. 2020). Thus, it is necessary and urgent to understand the joint impact of vaccination and NPIs on COVID-19 spread in order to provide guidance for policymakers to control the pandemic.
Transmission dynamics is a useful tool to serve this purpose, as it can assess both the direct and indirect impact of vaccinations on the disease spread (Eichner et al. 2017; Halloran et al. 1991). Dynamical models have been used in studying COVID-19 vaccine prioritization, hypothetical vaccination strategies or the resource allocation, such as the intensity of NPIs needed to balance with a restricted number of vaccines available (Bubar et al. 2021; Brett and Rohani 2020; Buckner et al. 2021; Saad-Roy et al. 2020; MacIntyre et al. 2021; Matrajt et al. 2021; Han et al. 2021; Li et al. 2020). In terms of the future projection, the majority of studies provide only qualitative insights rather than quantitative estimates. Quantitative forecasting of the future transmission in the post-vaccination era can be realized only if we predict the number of COVID-19 confirmed cases based on vaccination and NPI policy data.
In our recent pre-vaccination modeling work (Wang et al. 2022), we employed a hypothesis-free machine-learning algorithm to estimate the transmission rate based on NPI data, and in turn forecast the daily number of confirmed cases in the US for the pre-vaccination period using a mechanistic disease model. We also investigated the impact of different types of policy and mobility data on the predictions and found that restrictions on gatherings is the most influential variable (Wang et al. 2022). In this paper, we use the same method as in Wang et al. (2022) to make a retrospective forecast of the daily number of confirmed cases in the US for the post-vaccination period and investigate the joint impact of vaccination and NPIs. More specifically, we build a hybrid model consisting of a mechanistic ordinary differential equation (ODE) and a generalized boosting machine learning model (GBM). The ODE model contains two vaccinated compartments: partially vaccinated and fully vaccinated, and it accounts for the case that vaccinated individuals can still get infected. Then, the impact of vaccination is reflected implicitly when the ODE model gives simulation results. The NPIs serve as predictor variables of the GBM to predict the transmission rate. Before we run GBM to make predictions, we use the inverse method that we created in Wang et al. (2022) to obtain a time series of daily transmission rates which are fed into GBM as the response variable. The GBM is trained based on these predictor and response variable data and produces predictions of future transmission rates given future NPIs. Using the predicted transmission rates from the GBM, the ODE model gives the predicted number of daily confirmed cases. In Wang et al. (2022), we have shown that including NPI policy data can greatly improve the accuracy of the predictions. We were curious to see whether this is also the case for the post-vaccination period. To this end, in addition to the scenario where only policies are used as the predictors of the GBM, we have considered two other scenarios where human mobility is also used. This forecasting approach capturing the joint impact of vaccination and NPIs can hopefully be applied to other countries that are suffering terrible situations caused by SARS-CoV-2 and its variant strains as well as other infectious diseases.
The remaining paper is organized as follows. In Sect. 2, we present data collection, model formulation, parameter estimation, and prediction methodology. In Sect. 3, we present the results. In Sect. 4, we provide concluding remarks and propose possible future work.
Methods
Data Collection
In this study, we collected daily data from April 4, 2020, to April 5, 2021, that cover part of both pre-vaccination and post-vaccination periods in the US. We obtained the number of confirmed cases of COVID-19, the number of partially vaccinated and fully vaccinated individuals in the US and policy indices in each state of the US from the website of Our World in Data (Ritchie et al. 2020) (https://ourworldindata.org/coronavirus), the six categories of human mobility data in the US from the official website of Google (https://www.google.com/covid19/mobility/), and deaths, recovered and active cases in the US from the worldometer website (https://www.worldometers.info/coronavirus/country/us/). All data used in this study are metric. In order to mitigate the inaccuracy induced by under-reporting, etc. (for example, during weekends the number of daily confirmed cases is usually under-reported), we used the 7-day averaged epidemiological data (i.e., the average of the current day and the last 6 days) in the simulation.
We derived the nationwide time-series index data for containment policies (beginning with “C") and health policies (beginning with “H") by taking an average of the corresponding policy indices over all the 50 US states as well as Washington D.C., weighted by their populations. The containment policies included school closing (denoted by C1), workplace closing (C2), cancel public events (C3), restrictions on gatherings (C4), close public transport (C5), stay at home requirements (C6), restrictions on internal movement (C7), and international travel controls (C8). The health policies included public information campaigns (H1), testing policies (H2), contact tracing (H3), facial coverings (H6), vaccination delivery policy (H7), and protection of elderly people (H8). The labels H4 and H5 represent emergency investment in healthcare and investment in vaccines, respectively, which are not available (Ritchie et al. 2020). Note that in addition to those policy data in our pre-vaccination work (Wang et al. 2022), here we take into account the vaccination delivery policy (H7) as well since we focus on the post-vaccination case in the current paper. Human mobility data included changes of mobility trends (), compared to the baseline level 0, in retail and recreation (M1), grocery and pharmacy (M2), parks (M3), transit stations (M4), workplaces (M5), and residential (M6). The time series of these 14 policy indices and human mobility data are shown in Fig. 1.
Fig. 1.

Policy and mobility data in the US from April 4, 2020, to April 5, 2021
Model Formulation
Our model extends the SEIAR (Susceptibles, Exposed, symptomatic Infected, Asymptomatic infected, Removed) model in Wang et al. (2022) by incorporating two new compartments: the individuals who are partially vaccinated (denoted by ), and the individuals who are fully vaccinated () (see Fig. 2).
Fig. 2.
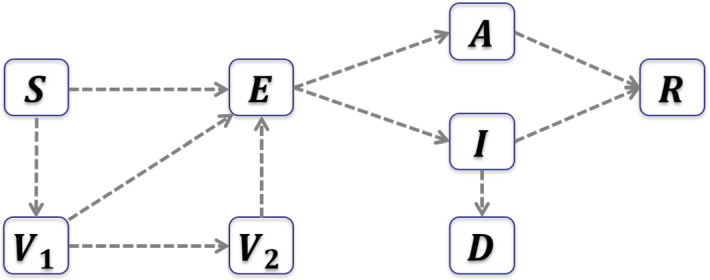
Flowchart of the transmission dynamics with vaccination
The susceptible individuals getting their first dose of vaccines will enter the compartment, and the individuals in the compartment will enter the compartment if they are fully vaccinated. According to CDC statistics, a small part of vaccinated individuals can still get infected, which is the so-called breakthrough cases (https://www.cdc.gov/vaccines/covid-19/health-departments/breakthrough-cases.html). We describe such breakthrough cases by incorporating incidence terms in the equations of and , with relative risks of infection being and , respectively, for partially vaccinated and fully vaccinated individuals, due to imperfect vaccination protection. Therefore, the susceptible individuals (S), the partially vaccinated individuals (), and the fully vaccinated individuals () will all enter the exposed compartment (E) if they are infected by symptomatic infected individuals (I), asymptomatic infected individuals (A), or the exposed individuals (E). The transmission rate is , and the relative transmissibility of asymptomatic infected and exposed individuals compared to symptomatic infected individuals are and , respectively. The average incubation period is days. Once the incubation period ends, a proportion p of the exposed individuals become asymptomatic infected and the rest proportion become symptomatic infected. The disease induced death rate is . It takes an average of days and days for symptomatic and asymptomatic infected individuals to recover, respectively. The model is given by the following system of differential equations:
| 1 |
Parameter Estimation
The constant parameter values are taken from the literature. The total US population N is expected to be 331, 449, 281 by US Census Bureau on April 1, 2020 (US Census Bureau 2021). Since the incubation period ranges from 2 to 14 days and has a mean of about 5 days (Linton et al. 2020), we assume that per day. According to Byrne et al. (2020), asymptomatic individuals has an approximate median infectious period of 6.5 to 9.5 days, and the average duration from symptom onset to clearance is about 13.4 days based on a meta-analysis of serial testing. Then it is reasonable to assume that per day and per day. Gao et al. (2021) discovered that of seropositive infections were accompanied by no symptoms based on a study among 34857 participants in China. In addition, they found that the relative transmissibility varied from 0.35 to 0.58 for asymptomatic cases and was 0.63 for pre-symptomatic cases. Thus, we assume that , , . The two new constant parameters and were estimated according to vaccine efficacy, which is generally reported as a relative risk reduction (RRR). Our method used the relative risk (RR), i.e., the ratio of attack rates with and without vaccination to get RRR, which equals 1-RR (Olliaro et al. 2021). The RRR of the Pfizer–BioNTech BNT162b2 mRNA vaccine beginning 7 days after the first dose to before the second dose is , and the RRR of Pfizer after 7 days of the second dose is (Skowronski and De Serres 2021). Since most people in the US take the Pfizer and Moderna vaccines which have similar efficacy (Olliaro et al. 2021), we use the RRR of first- and second-dose Pfizer vaccine to approximate the values of and , which leads to and .
The death rate on day i (denoted by ) is estimated using the following formula:
The first-dose vaccination rate on day i (denoted by ) is estimated by the following formula:
where the number of susceptible individuals on day i equals the total population N minus the number of all infected individuals on and before day i (regardless of whether recovered or not) and then minus the number of individuals who have been vaccinated before day i.
The second-dose vaccination rate on day i (denoted by ) is given by
To estimate the time-varying transmission rate, we used the inverse method that we created in Wang et al. (2022) which is motivated by Kong et al. (2015) and Pollicott et al. (2012). We started by obtaining the time series of E(t) from the term which can be approximated by the notification data. We use S[k], E[k], I[k], A[k], R[k], , to represent the values of variables in model (1), D[k] to represent the cumulative deaths, and y[k] to be the notification data, on the k-th day of study. Then we have
where K is the length of the vector of notification data. We can obtain the time series data of and , , and the initial values S[1], I[1], R[1], D[1] from reporting (Ritchie et al. 2020) (https://www.worldometers.info/coronavirus/country/us/). We assume that according to Gao et al. (2021). It follows that
for .
Next we add up the S-equation, -equation and -equation to obtain
Substituting the time series of S(t), , , I(t), E(t) and A(t) into the above equation, we can solve for :
and we can approximate by the value of . The interpretations and values of all the parameters are given in Table 1.
Table 1.
Parameter interpretation and values
| Parameter | Interpretation | Value |
|---|---|---|
| Transmission rate | See Fig. 4 | |
| N | Total population of US | 331,449,281 |
| Relative transmissibility of exposed individuals | 0.63 | |
| Relative transmissibility of asymptomatic individuals | 0.47 | |
| First dose vaccination rate | See Fig. 3 (a) | |
| Second dose vaccination rate | See Fig. 3 (b) | |
| Incubation period | 5 days | |
| p | Proportion of asymptomatic infections | 0.76 |
| Death rate of symptomatic infected individuals | See Fig. 5 | |
| Recovery rate of symptomatic infected individuals | 1/13.4 day | |
| Recovery rate of asymptomatic infected individuals | 1/8 day | |
| Relative risk of infection for partially vaccinated individuals | 0.315 | |
| Relative risk of infection for fully vaccinated individuals | 0.052 |
Prediction
We implemented three GBMs with different predictor variables to explore the relationship between the transmission rate and policy and/or mobility variables, and determine which factors mostly affect the transmission rate according to their relative importance. Our main interest was in the GBM with all the 14 types of policy data (C1–C8, H1–H3, H6–H8) as predictor variables since the model with policy only has the power of prediction. The second GBM involves the mobility variables (M1–M6) only and it is used to explore the direct impact of human mobility on the prediction of the transmission rate. The last GBM incorporates all the mobility variables (M1–M6) together with four policy variables (H2, H3, H6, H7), aiming to investigate the joint impact of human mobility and policy on the prediction. Note that for the last GBM, we did not include the other policies since they are considered to have direct impact on human mobility and hence it may be unreasonable to put them together with the mobility as predictor variables when we want to change some of the policies, whereas we do not know how the mobility varies accordingly. By comparing the simulation results of these different GBMs, we were also able to see whether better predictions occur when mobility data are included.
The gbm package and predict function in R were used in the implementation of the gradient boosting machine learning. To evaluate model performance in making future predictions, we divided the dataset into a training and test dataset, where the model is calibrated using the training dataset and is then evaluated based on its predictions over the test dataset. As this is a time-series prediction task, the division was done temporally, where the beginning “chunk” of the data is taken as the training and the remaining chunk as the test dataset (Ramazi et al. 2021b, a). Moreover, to increase evaluation reliability, several training and test durations were considered. Focusing on the effect of vaccination on the COVID-19 dynamics, we needed all the test durations to cover a part of post-vaccination period. To this end, we fixed the start data of training at April 4, 2020, and let the training duration vary from 231 days to 329 days by an increment of 7 days, and meanwhile fix each test duration at 35 days. Then the earliest test duration was from November 21, 2020, to December 25, 2020, which covers 6 days of the post-vaccination period, and the latest test duration consists of post-vaccination days from February 27, 2021, to April 2, 2021, as shown in Table 2.
Table 2.
Training and testing durations
| Train length (days) | Train duration | Test duration |
|---|---|---|
| 231 | April 4, 2020, to November 20, 2020 | November 21, 2020, to December 25, 2020 |
| 238 | April 4, 2020, to November 27, 2020 | November 28, 2020, to January 1, 2021 |
| 245 | April 4, 2020, to December 4, 2020 | December 5, 2020, to January 8, 2021 |
| 252 | April 4, 2020, to December 11, 2020 | December 12, 2020, to January 15, 2021 |
| 259 | April 4, 2020, to December 18, 2020 | December 19, 2020, to January 22, 2021 |
| 266 | April 4, 2020, to December 25, 2020 | December 26, 2020, to January 29, 2021 |
| 273 | April 4, 2020, to January 1, 2021 | January 2, 2021, to February 5, 2021 |
| 280 | April 4, 2020, to January 8, 2021 | January 9, 2021, to February 12, 2021 |
| 287 | April 4, 2020, to January 15, 2021 | January 16, 2021, to February 19, 2021 |
| 294 | April 4, 2020, to January 22, 2021 | January 23, 2021, to February 26, 2021 |
| 301 | April 4, 2020, to January 29, 2021 | January 30, 2021, to March 5, 2021 |
| 308 | April 4, 2020, to February 5, 2021 | February 6, 2021, to March 12, 2021 |
| 315 | April 4, 2020, to February 12, 2021 | February 13, 2021, to March 19, 2021 |
| 322 | April 4, 2020, to February 19, 2021 | February 20, 2021, to March 26, 2021 |
| 329 | April 4, 2020, to February 26, 2021 | February 27, 2021, to April 2, 2021 |
The training dataset consisted of the transmission rate on each day obtained by the inverse method as the response variable and policy and/or mobility daily data as the predictor variables. For the first GBM, all the 14 types of policy data (C1–C8, H1–H3, H6–H8) on each day were provided as the predictor variables. For the second GBM, all the 6 types of mobility daily data (M1–M6) acted as the predictor variables. The training dataset of the third GBM contained all the mobility data (M1–M6) and the policy data H2, H3, H6, H7 as the predictor variables. For the testing dataset, we provided the trained GBMs with policy and/or mobility data to get the predicted transmission rate on each day of the test duration. Using the trained and tested transmission rate time series, we plotted the curve of the SEIARVV model (1) and compared the simulated results with notification data of daily COVID-19 confirmed cases.
The performance evaluation measures MAE (i.e., mean absolute error) and MAPE (i.e., mean absolute percentage error) were utilized to evaluate the differences between the predicted and actual numbers of confirmed cases, and the differences between the transmission rates predicted by GBMs and those derived from the inverse method. The formulas of MAE and MAPE are given by
where is the ith component of the vector of actual values, is the i-th component of the vector of prediction values, and n is the total number of data instances. To obtain smaller MAE and MAPE, the GBMs were tuned with the number of trees, the distribution of response variable, the stochastic gradient descent, the depth of interaction, the learning rate, and the minimum number of observations allowed in the trees’ terminal nodes.
It is intriguing and important to know which predictors are more influential in training the GBM. We explored this by using the summary function in R which produces a bar plot showing the values and ranking of the relative influence of each predictor variable.
Results
The curves for the time-varying vaccination rates, the transmission rate obtained by the inverse method, and the death rate are shown in Figs. 3, 4, and 5, respectively. The GBMs based on the training and testing datasets perform better (i.e., lower MAE and MAPE) when the number of trees is 1000, the stochastic gradient descent parameter is 0.9, the depth of interaction is 30, the learning rate is 0.01, the minimum number of observations allowed in the trees’ terminal nodes is 10, and the response variable has a Gaussian distribution.
Fig. 3.

First and second dose vaccination rates from April 4, 2020, to April 5, 2021
Fig. 4.

Transmission rate obtained by inverse method and the fitting with notification data from April 4, 2020, to April 5, 2021
Fig. 5.
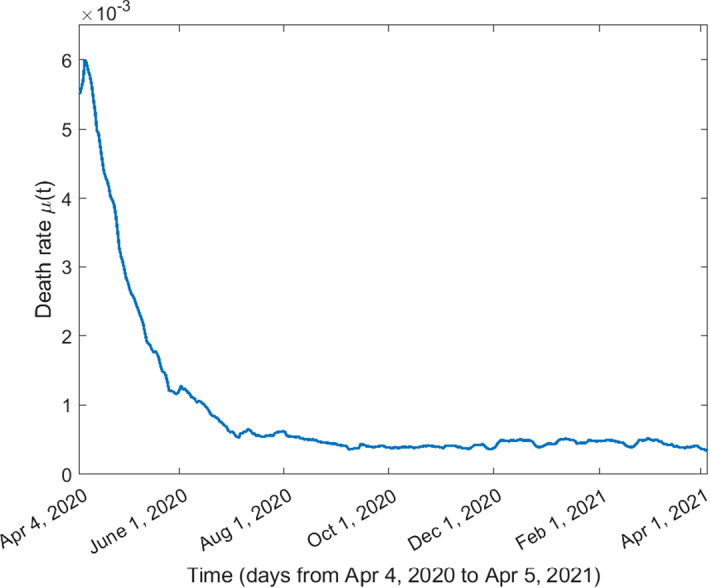
Death rate of symptomatic infected individuals from April 4, 2020, to April 5, 2021
The averaged MAE and MAPE for the predictions of daily confirmed cases corresponding to the three GBMs across all different training durations are given in Table 3. The MAE and MAPE corresponding to different training durations are presented in Table 4. The averaged MAE and MAPE of GBM with mobility only are higher than the other two GBMs involving policies as predictor variables. The lowest averaged MAE and MAPE are obtained for the GBM which has both mobility and some of the policies as predictors. However, as shown in Table 4, the MAE and MAPE for the model with mobility only are not always the largest, and the MAE and MAPE for the model with both mobility and policy variables are not always the smallest for some specific training duration. The best prediction result based on each GBM is shown in Fig. 6 (MAPE=), Fig. 8 (MAPE=), and Fig. 10 (MAPE=), respectively. Some other selected training and testing results about the transmission rates as well as the fittings with notification data of daily confirmed cases corresponding to the training durations are presented in supplementary Figs. 12 and 14 for the model with policy as the only predictors, in supplementary Figs. 16 and 18 for the model with mobility as the only predictors, and in supplementary Figs. 20, 22 and 24 for the model with both mobility and policy as predictors (see Appendix). We can see that the fittings with the transmission rate and the notification data of daily confirmed cases for the training part (orange curves in these figures) are almost perfect including the fitting with peaks and troughs. Although the MAPEs for the predictions of the transmission rates are not very small (greater than ), the MAPEs are quite small (smaller than ) for some predictions of notification data (see the yellow curves in Figs. 6, 8, 10 and supplementary Figs. 16, 18, 20). In Figs. 6, 8 and supplementary Figs. 16, 18, 20, even if the training is based on pre-vaccination data, the predictions for post-vaccination confirmed cases have very small MAPEs: , , , , , respectively. Besides, the yellow curves in the right panels of Fig. 6 and supplementary Figs. 16, 18, 20 replicate the trend of increasing to a local maximum and decreasing from the local maximum to a local minimum.
Table 3.
Averaged MAE and MAPE of the fittings with notification data
| Data used in GBM | Averaged MAE | Averaged MAPE |
|---|---|---|
| Policy data C1–C8, H1–H3, H6–H8 | 24145.99 | |
| Mobility data M1–M6 | 30197.89 | |
| Mobility data M1–M6 and policy data H2,H3,H6,H7 | 21200.27 |
Table 4.
MAE and MAPE of predictions of notification data based on model (1) and the three GBMs corresponding to different training durations. Predictors of GBM (1) are policy data C1–C8, H1–H3, H6–H8; predictors of GBM (2) are mobility data M1–M6; predictors of GBM (3) are M1–M6 and policy data H2, H3, H6, H7
| Train length | MAE | MAPE () | MAE | MAPE () | MAE | MAPE () |
|---|---|---|---|---|---|---|
| (days) | (GBM (1)) | (GBM (1)) | (GBM (2)) | (GBM (2)) | (GBM (3)) | (GBM (3)) |
| 231 | 16,775.81 | 8.81 | 7558.98 | 3.86 | 37,903.75 | 19.25 |
| 238 | 39,121.16 | 18.92 | 7940.10 | 3.88 | 21,292.99 | 10.34 |
| 245 | 11,119.65 | 5.20 | 12,486.68 | 5.76 | 13,201.03 | 6.34 |
| 252 | 15,666.32 | 7.14 | 27,702.48 | 12.06 | 17,616.34 | 7.91 |
| 259 | 16,553.15 | 7.83 | 40,843.63 | 18.27 | 23,160.27 | 10.29 |
| 266 | 38,330.93 | 17.20 | 53,833.27 | 25.63 | 29,354.85 | 13.26 |
| 273 | 27,784.70 | 17.40 | 46,699.11 | 23.69 | 27,895.73 | 13.20 |
| 280 | 53,712.31 | 39.54 | 43,941.16 | 31.98 | 59,095.39 | 41.29 |
| 287 | 56,065.08 | 51.07 | 46,847.77 | 43.36 | 41,337.25 | 35.89 |
| 294 | 16,798.04 | 20.42 | 34,895.04 | 41.16 | 8784.27 | 9.91 |
| 301 | 22,630.60 | 29.27 | 47,018.83 | 60.68 | 14,463.29 | 18.01 |
| 308 | 9951.52 | 14.81 | 33,929.37 | 49.92 | 6976.28 | 9.40 |
| 315 | 11,630.11 | 19.50 | 22,392.90 | 36.78 | 3279.74 | 4.99 |
| 322 | 8359.75 | 14.23 | 17,216.88 | 29.28 | 5595.17 | 9.21 |
| 329 | 17,690.73 | 30.86 | 9662.19 | 16.47 | 8047.69 | 13.95 |
Fig. 6.

Using policy data C1–C8, H1–H3, H6–H8, train 245 days from April 4, 2020, to December 4, 2020; test 35 days from December 5, 2020, to January 8, 2021
Fig. 8.

Using mobility data M1–M6, train 231 days from April 4, 2020, to November 20, 2020; test 35 days from November 21, 2020, to December 25, 2020
Fig. 10.

Using mobility data M1–M6 and policy data H2, H3, H6, H7, train 315 days from April 4, 2020, to February 12, 2021; test 35 days from February 13, 2021, to March 19, 2021
The relative influence of each policy variable in training the first GBM is shown in Fig. 7, supplementary Figs. 13, 15 when the model is trained for 245 days, 273 days, 308 days, respectively. From these figures we can see that restrictions on gatherings is the most influential policy when the model is trained for 245 days, which is consistent with the finding of our pre-vaccination paper (Wang et al. 2022). However, the most influential predictor variable is school closing when the model is trained for 273 days and becomes testing policies when the model is trained for 308 days. Note that in both these two cases, post-vaccination data are involved in the training and restrictions on gatherings is the second most influential predictor variable. When the model is trained for 245 days, the relative influence of the vaccination delivery policy H7 is 0 as the training set involves only pre-vaccination data in this case. The vaccination delivery policy H7 becomes increasingly important as the training involves more post-vaccination data, with the relative influence increasing from when trained for 273 days to when trained for 308 days (see supplementary Figs. 13, 15). The relative influence of the mobility variables in training the second GBM for 231 days, 238 days, and 245 days is given in Fig. 9, supplementary Figs. 17, 19, respectively. For all these training sets, human mobility in parks is always the most important variable, followed by retail and recreation and workplaces, whereas residential mobility has the least influence on training the model. The relative influence of the mobility variables M1–M6 and the policies H2, H3, H6, H7 in training the third GBM, corresponding to training durations of 315 days, 245 days, 294 days, 308 days, are presented in Fig. 11, supplementary Figs. 21, 23, 25, respectively. When mobility data and part of the policy data are put together for training, the leading influential variable is always testing policy H2 with a weight of around in relative influence when the GBM is trained for 315 days. Similar to the GBM with policy predictors only, the ranking of vaccination delivery policy H7 increases when more post-vaccination days are included in the training dataset. The rankings of the mobility variables also change when the model is trained for different lengths of days.
Fig. 7.
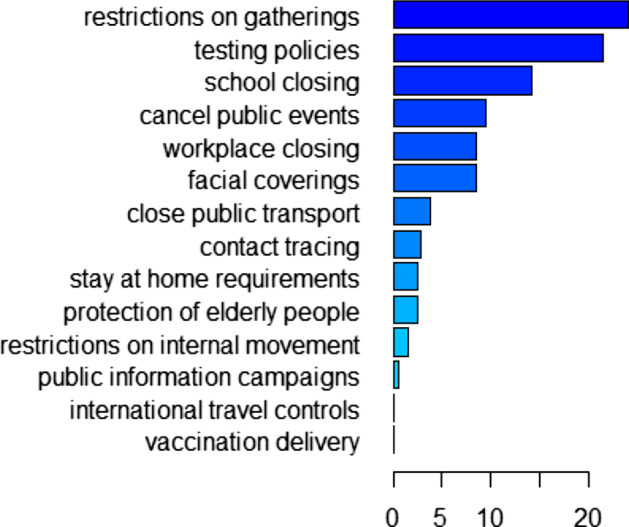
Relative influence of policy variables C1–C8, H1–H3, H6–H8 when trained for 245 days from April 4, 2020, to December 4, 2020
Fig. 9.
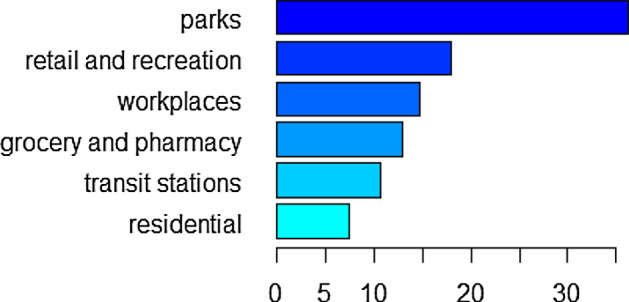
Relative influence of mobility variables M1–M6 when trained for 231 days from April 4, 2020, to November 20, 2020
Fig. 11.
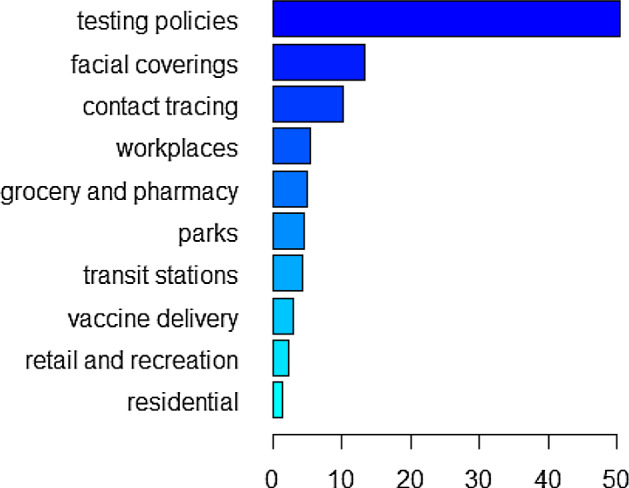
Relative influence of mobility variables M1–M6 and policy variables H2, H3, H6, H7 when trained for 315 days from April 4, 2020, to February 12, 2021
Discussion
In this paper, we constructed a hybrid model by combining an ODE model with a variable transmission rate, motivated by the mechanisms of COVID-19 transmission and vaccination dynamics, coupled to a GBM, which provides a machine learning algorithm to forecast the transmission rate based on policy and/or mobility data. In our mechanistic model, we considered both partially vaccinated and fully vaccinated compartments in addition to the susceptible, exposed, symptomatic infected, asymptomatic infected and recovered compartments. In particular, we incorporated incidence terms in the vaccinated compartment equations to directly model the fact that vaccinated individuals can still get infected, which has rarely been studied by previous mathematical models with vaccination (Brett and Rohani 2020; MacIntyre et al. 2021; Li et al. 2020). The key step to link the ODE and GBM models is to obtain the time-varying transmission rate by the inverse method that we created in Wang et al. (2022). This time-varying transmission rate can produce an almost perfect fit with the notification data of confirmed cases, which increases the chance of a good fitting using GBM. We trained the GBMs to fit the transmission rate obtained by the inverse method with policy and/or mobility data and predicted future transmission rate based on future policy and/or mobility data as well as the training experience. Then we used the trained and predicted transmission rate to plot solution curves of the mechanistic model to make predictions of the number of daily confirmed cases.
The prediction performance was evaluated by mean absolute error (MAE) and mean absolute percentage error (MAPE) measures. We found that the GBM trained on data on both mobility and some of the policies (testing, contact tracing, facial coverings, and vaccination delivery) is more efficient in establishing an association between the transmission rate and predictor variables than the GBM trained based on policy or mobility data only. The performance of the GBM with only mobility data performs the worst. Therefore, to model the impact of the preventive policies on the disease spread, mobility data appears to be insufficient. Other factors, such as facial covering, must be included.
We also investigated the importance of the predictor variables and found that restrictions on gatherings, testing policies and school closing are the most influential on training the GBM compared to other NPIs, which is consistent with their leading roles in training the pre-vaccination model (Wang et al. 2022). This further emphasizes the importance of these NPIs even under vaccination. For the GBM with both policy and mobility as predictors, the rankings of the relative influence of the three policy variables testing, facial coverings and contact tracing are the same for both pre- and post-vaccination cases (Wang et al. 2022) except when trained for 294 days where contact tracing is a little more important than facial coverings. For the GBM with mobility as the only predictors, mobility trend in parks is always the most influential factor regardless of the vaccination situation (Wang et al. 2022). For the pre-vaccination case, the second most influential variable is workplaces (Wang et al. 2022). For the post-vaccination case, the second most influential variable becomes retail and recreation.
The conclusions on the predictors are at the country scale. For example, mobility trend in parks may not be the most influential factor in every state of the US; however, when making predictions for the whole country—as in our model—the mean of the mobility trend in parks over all states becomes most influential. Indeed, different states have adopted different mitigation policies (Haratian et al. 2021), and this heterogeneity must be taken into account for state or even county-level analysis.
Since predictions are made based on the training experience, investigation of relative influence of predictor variables in training the model can help us get closer to the mechanisms behind predictions. Although our machine-learning compartment is correlation based, which prevents causal statements on the relationship between gatherings restrictions and the transmission rate, our finding highlights the possibility of such causal relationship and motivates future work in this direction. Indeed, some research works have already tried to estimate the effects of different control measures or mobility on COVID-19 transmission dynamics (see Badr et al. 2020; Chinazzi et al. 2020; Xue et al. 2021; Lai et al. 2020; Koo et al. 2020) and the references therein). Our relative influence results indicate that the vaccine delivery policy is not so important in training the model. However, there is no disparity regarding the importance of incorporating vaccination in a model (see, e.g., MacIntyre et al. 2021; Patel et al. 2021) because the vaccine delivery policy only describes the availability of vaccines such as to what extent or scale the vaccines are distributed or donated to a region (Ritchie et al. 2020). It may not represent how many people are actually getting vaccinated so it has no relation to either vaccination rate or cumulative vaccinated proportion.
For future work, it would be interesting to consider different infected compartments representing individuals infected with different strains of the virus. One can also study immunity waning cases where recovered and vaccinated individuals return to the susceptible compartment after a period of time. This aspect should be important in long-term forecasting. In addition to susceptible individuals, exposed and asymptomatic infected individuals who are unaware of their infections and recovered individuals can all get vaccinated, which will result in a new post-vaccination mechanistic model. Moreover, it is informative to compare the COVID-19 dynamics in different states of the US using fine-scale datasets (Haratian et al. 2021) or in other countries in the world. Parameter uncertainty and identifiability are also worth investigating for this novel inverse method plus machine learning approach. The methods used in this work could be applied in the study of some other infectious disease transmission dynamics as well, especially when vaccination is implemented.
Supplementary Information
Below is the link to the electronic supplementary material.
Acknowledgements
This work was funded by Alberta Innovates and Pfizer via project number RES0052027. XW gratefully acknowledges support from Research and Creative Activity (RCA) Grant awarded by College of Arts and Sciences at the University of Tennessee at Chattanooga. HW gratefully acknowledges support from Natural Sciences and Engineering Research Council of Canada (NSERC) Discovery Grant RGPIN-2020-03911 and NSERC Accelerator Grant RGPAS-2020-00090. KN gratefully acknowledges support from National Institute for Mathematical Sciences (NIMS) grant funded by the Korean Government (NIMS-B22910000). MAL gratefully acknowledges a Canada Research Chair in Mathematical Biology and support from an NSERC Discovery Grant.
Footnotes
Publisher's Note
Springer Nature remains neutral with regard to jurisdictional claims in published maps and institutional affiliations.
References
- Badr HS, Du H, Marshall M, Dong E, Squire MM, Gardner LM. Association between mobility patterns and COVID-19 transmission in the USA: a mathematical modelling study. Lancet Infect Dis. 2020;20(11):1247–1254. doi: 10.1016/S1473-3099(20)30553-3. [DOI] [PMC free article] [PubMed] [Google Scholar]
- Brett TS, Rohani P. Transmission dynamics reveal the impracticality of COVID-19 herd immunity strategies. Proc Natl Acad Sci. 2020;117(41):25897–25903. doi: 10.1073/pnas.2008087117. [DOI] [PMC free article] [PubMed] [Google Scholar]
- Bubar KM, Reinholt K, Kissler SM, Lipsitch M, Cobey S, Grad YH, Larremore DB. Model-informed COVID-19 vaccine prioritization strategies by age and serostatus. Science. 2021;371(6532):916–921. doi: 10.1126/science.abe6959. [DOI] [PMC free article] [PubMed] [Google Scholar]
- Buckner JH, Chowell G, Springborn MR. Dynamic prioritization of COVID-19 vaccines when social distancing is limited for essential workers. Proc Natl Acad Sci. 2021;118(16):e2025786118. doi: 10.1073/pnas.2025786118. [DOI] [PMC free article] [PubMed] [Google Scholar]
- Byrne AW, McEvoy D, Collins AB, et al. Inferred duration of infectious period of SARS-CoV-2: rapid scoping review and analysis of available evidence for asymptomatic and symptomatic COVID-19 cases. BMJ Open. 2020;10:e039856. doi: 10.1136/bmjopen-2020-039856. [DOI] [PMC free article] [PubMed] [Google Scholar]
- Chinazzi M, Davis JT, Ajelli M, et al. The effect of travel restrictions on the spread of the 2019 novel coronavirus (COVID-19) outbreak. Science. 2020;368(6489):395–400. doi: 10.1126/science.aba9757. [DOI] [PMC free article] [PubMed] [Google Scholar]
- Eichner M, Schwehm M, Eichner L, Gerlier L. Direct and indirect effects of influenza vaccination. BMC Infect Dis. 2017;17(1):1–8. doi: 10.1186/s12879-017-2399-4. [DOI] [PMC free article] [PubMed] [Google Scholar]
- Gao W, Lv J, Pang Y, Li L-M. Role of asymptomatic and pre-symptomatic infections in Covid-19 pandemic. BMJ. 2021;375:n2342. doi: 10.1136/bmj.n2342. [DOI] [PMC free article] [PubMed] [Google Scholar]
- Google Team (2021) Google COVID-19 community mobility reports. https://www.google.com/covid19/mobility/. Last Accessed 1 May 2021
- Halloran ME, Haber M, Longini IM, Jr, Struchiner CJ. Direct and indirect effects in vaccine efficacy and effectiveness. Am J Epidemiol. 1991;133(4):323–331. doi: 10.1093/oxfordjournals.aje.a115884. [DOI] [PubMed] [Google Scholar]
- Han S, Cai J, Yang J, Zhang J, Wu Q, Zheng W, Shi H, Ajelli M, Zhou X-H, Yu H. Time-varying optimization of COVID-19 vaccine prioritization in the context of limited vaccination capacity. Nat Commun. 2021;12(1):1–10. doi: 10.1038/s41467-020-20314-w. [DOI] [PMC free article] [PubMed] [Google Scholar]
- Haratian A, Fazelinia H, Maleki Z, Ramazi P, Wang H, Lewis MA, Greiner R, Wishart D. Dataset of COVID-19 outbreak and potential predictive features in the USA. Data Brief. 2021;38:107360. doi: 10.1016/j.dib.2021.107360. [DOI] [PMC free article] [PubMed] [Google Scholar]
- Kong JD, Jin C, Wang H. The inverse method for a childhood infectious disease model with its application to pre-vaccination and post-vaccination measles data. Bull Math Biol. 2015;77:2231–2263. doi: 10.1007/s11538-015-0121-5. [DOI] [PubMed] [Google Scholar]
- Koo JR, Cook AR, Park M. Interventions to mitigate early spread of SARS-CoV-2 in Singapore: a modelling study. Lancet Infect Dis. 2020;20(6):678–688. doi: 10.1016/S1473-3099(20)30162-6. [DOI] [PMC free article] [PubMed] [Google Scholar]
- Lai S, Ruktanonchai NW, Zhou L, Prosper O, Luo W, Floyd JR, Wesolowski A, Santillana M, Zhang C, Xiangjun D, Hongjie Yu, Tatem AJ. Effect of non-pharmaceutical interventions to contain COVID-19 in China. Nature. 2020;585(7825):410–413. doi: 10.1038/s41586-020-2293-x. [DOI] [PMC free article] [PubMed] [Google Scholar]
- Li Q, Tang B, Bragazzi NL, Xiao Y, Wu J. Modeling the impact of mass influenza vaccination and public health interventions on COVID-19 epidemics with limited detection capability. Math Biosci. 2020;325:108378. doi: 10.1016/j.mbs.2020.108378. [DOI] [PMC free article] [PubMed] [Google Scholar]
- Linton NM, Kobayashi T, Yang Y, et al. Incubation period and other epidemiological characteristics of 2019 novel coronavirus infections with right truncation: A statistical analysis of publicly available case data. J Clin Med. 2020;9(2):538. doi: 10.3390/jcm9020538. [DOI] [PMC free article] [PubMed] [Google Scholar]
- MacIntyre CR, Costantino V, Trent M (2021) Modelling of COVID-19 vaccination strategies and herd immunity, in scenarios of limited and full vaccine supply in NSW, Australia. Vaccine [DOI] [PMC free article] [PubMed]
- Matrajt L, Eaton J, Leung T, Brown ER. Vaccine optimization for COVID-19: who to vaccinate first? Sci Adv. 2021;7(6):eabf1374. doi: 10.1126/sciadv.abf1374. [DOI] [PMC free article] [PubMed] [Google Scholar]
- Olliaro P, Torreele E, Vaillant M (2021) COVID-19 vaccine efficacy and effectiveness-the elephant (not) in the room. Lancet Microbe [DOI] [PMC free article] [PubMed]
- Patel MD, Rosenstrom E, Ivy JS, et al. Association of simulated COVID-19 vaccination and nonpharmaceutical interventions with infections, hospitalizations, and mortality. JAMA Netw Open. 2021;4(6):e2110782. doi: 10.1001/jamanetworkopen.2021.10782. [DOI] [PMC free article] [PubMed] [Google Scholar]
- Pollicott M, Wang H, Weiss H. Extracting the time-dependent transmission rate from infection data via solution of an inverse ODE problem. J Biol Dyn. 2012;6(2):509–523. doi: 10.1080/17513758.2011.645510. [DOI] [PubMed] [Google Scholar]
- Ramazi P, Haratian A, Meghdadi M, Oriyad AM, Lewis MA, Maleki Z, Vega R, Wang H, Wishart DS, Greiner R. Accurate long-range forecasting of COVID-19 mortality in the USA. Sci Rep. 2021;11(1):1–11. doi: 10.1038/s41598-021-91365-2. [DOI] [PMC free article] [PubMed] [Google Scholar]
- Ramazi P, Kunegel-Lion M, Greiner R, Lewis MA. Predicting insect outbreaks using machine learning: a mountain pine beetle case study. Ecol Evol. 2021;11(19):13014–13028. doi: 10.1002/ece3.7921. [DOI] [PMC free article] [PubMed] [Google Scholar]
- Ritchie H, Ortiz-Ospina E, Beltekian D, Mathieu E, Hasell J, Macdonald B, Giattino C, Appel C, Rodés-Guirao L, Roser M (2020) Coronavirus pandemic (COVID-19). Our world in data. https://ourworldindata.org/coronavirus. Accessed 5 June 2021
- Saad-Roy CM, Wagner CE, Baker RE, Morris SE, Farrar J, Graham AL, Levin SA, Mina MJ, Jessica C, Metcalf E, Grenfell BT. Immune life history, vaccination, and the dynamics of SARS-CoV-2 over the next 5 years. Science. 2020;370(6518):811–818. doi: 10.1126/science.abd7343. [DOI] [PMC free article] [PubMed] [Google Scholar]
- Skowronski DM, De Serres G. Safety and efficacy of the BNT162b2 mRNA COVID-19 vaccine. N Engl J Med. 2021;384:1576–1578. doi: 10.1056/NEJMc2036242. [DOI] [PubMed] [Google Scholar]
- US Census Bureau (2021) Quick facts United States. https://www.census.gov/quickfacts/fact/table/US/PST045219. Accessed 15 May 2021
- Wang X, Wang H, Ramazi P, Nah K, Lewis M. A hypothesis-free bridging of disease dynamics and non-pharmaceutical policies. Bull Math Biol. 2022;84:57. doi: 10.1007/s11538-022-01012-8. [DOI] [PMC free article] [PubMed] [Google Scholar]
- Worldometers.info (2022) United States coronavirus cases, deaths, recovered. https://www.worldometers.info/coronavirus/country/us/. Accessed 12 April 2022
- Xue L, Jing S, Wang H. Evaluating the impacts of non-pharmaceutical interventions on the transmission dynamics of COVID-19 in Canada based on mobile network. PLoS ONE. 2021;16(12):e0261424. doi: 10.1371/journal.pone.0261424. [DOI] [PMC free article] [PubMed] [Google Scholar]
Associated Data
This section collects any data citations, data availability statements, or supplementary materials included in this article.