

Abstract
Systemic lupus erythematosus (SLE) is a heterogeneous autoimmune disease. Knowledge of circulating immune cell types and states associated with SLE remains incomplete. We profiled more than 1.2 million peripheral blood mononuclear cells (162 cases, 99 controls) with multiplexed single-cell RNA sequencing (mux-seq). Cases exhibited elevated expression of type 1 interferon–stimulated genes (ISGs) in monocytes, reduction of naïve CD4+ T cells that correlated with monocyte ISG expression, and expansion of repertoire-restricted cytotoxic GZMH+ CD8+ T cells. Cell type–specific expression features predicted case-control status and stratified patients into two molecular subtypes. We integrated dense genotyping data to map cell type–specific cis–expression quantitative trait loci and to link SLE-associated variants to cell type–specific expression. These results demonstrate mux-seq as a systematic approach to characterize cellular composition, identify transcriptional signatures, and annotate genetic variants associated with SLE.
INTRODUCTION:
Systemic lupus erythematosus (SLE) is a heterogeneous autoimmune disease with elevated prevalence in women and individuals of Asian, African, and Hispanic ancestry. Bulk transcriptomic profiling has implicated increased type 1 interferon signaling, dysregulated lymphocyte activation, and failure of apoptotic clearance as hallmarks of disease. Many genes participating in these processes are proximal to the ~100 loci associated with SLE. Despite this progress, a comprehensive census of circulating immune cells in SLE remains incomplete, and annotating the cell types and contexts that mediate genetic associations remains challenging.
RATIONALE:
Historically, flow cytometry and bulk transcriptomic analyses were used to profile the composition and gene expression of circulating immune cells in SLE. However, flow cytometry is biased by its use of a limited set of known markers, whereas bulk transcriptomic profiling does not have sufficient power to detect cell type–specific expression differences. Single-cell RNA sequencing (scRNA-seq) of peripheral blood mononuclear cells (PBMCs) holds potential as a comprehensive and unbiased approach to simultaneously profile the composition and transcriptional states of circulating immune cells. However, application of scRNA-seq to population cohorts has been limited by sample throughput, cost, and susceptibility to technical variability. To overcome these limitations, we previously developed multiplexed scRNA-seq (mux-seq) to enable systematic and cost-effective scRNA-seq of population cohorts.
RESULTS:
We used mux-seq to profile more than 1.2 million PBMCs from 162 SLE cases and 99 healthy controls of either Asian or European ancestry. SLE cases exhibited differences in both the composition and state of PBMCs. Analysis of lymphocyte composition revealed a reduction in naïve CD4+ T cells and an increase in repertoire-restricted GZMH+ CD8+ T cells. Analysis of transcriptomic profiles across eight cell types revealed that classical monocytes expressed the highest levels of both pan–cell type and myeloid-specific type 1 interferon-stimulated genes (ISGs). The expression of ISGs in monocytes was inversely correlated with naïve CD4+ T cell abundance. Cell type–specific expression features accurately predicted case-control status and stratified patients into molecular subtypes. By integrating genotyping data and using a novel matrix decomposition method, we mapped shared and cell type–specific cis–expression quantitative trait loci (cis-eQTLs) across eight cell types. Cell type–specific cis-eQTLs were enriched for regions of open chromatin specific to the same or related cell types. Joint analysis of cis-eQTLs and genome-wide association study results enabled identification of cell types relevant to immune-mediated diseases, fine-mapping of disease-associated loci, and discovery of novel SLE associations. Interaction analysis identified variants whose effects on gene expression are further modified by interferon activation across patients.
CONCLUSION:
SLE remains challenging to diagnose and treat. The heterogeneity of disease manifestations and treatment response highlight the need for improved molecular characterization. In a large multiethnic cohort, we demonstrate mux-seq as a systematic approach to characterize cellular composition, identify cell type–specific transcriptomic signatures, and annotate genetic variants associated with SLE.
Graphical Abstract
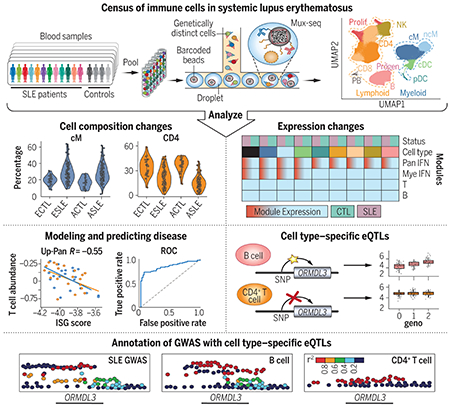
Detection of cellular and genetic correlates of SLE. Genetic multiplexing enabled single-cell profiling of hundreds of individuals with and without SLE. These profiles revealed that SLE patients exhibit changes in cell composition and cell type–specific gene expression, which were used to model disease status and severity. Additionally, cell type–specific cis-eQTL maps were produced and used to annotate and contextualize genetic loci associated with SLE.
Systemic lupus erythematosus (SLE) is a heterogeneous autoimmune disease affecting multiple organ systems, with elevated prevalence in women (1) and individuals of Asian, African, and Hispanic ancestries (2). Bulk transcriptomic profiling has implicated increased type 1 interferon signaling, dysregulated lymphocyte activation, and failure of apoptotic clearance as hallmarks of disease (3). Many genes participating in these immunological processes are proximal to the ~100 known genetic variants associated with SLE (4). Despite this progress, a comprehensive census of circulating immune cells in SLE remains incomplete, and annotating the cell types and cell contexts mediating genetic associations remains challenging.
Historically, different approaches have been used to characterize the role of circulating immune cells in SLE. Flow cytometry analyses, which quantify composition on the basis of known cell surface markers, reported B and T cell lymphopenia (5). Bulk transcriptomic analyses of peripheral blood mononuclear cells (PBMCs) universally found elevated expression of interferon-stimulated genes (ISGs) and molecularly stratified patients according to expression features (3, 6). However, flow cytometry is biased by its use of a limited set of markers, whereas bulk transcriptomic profiling does not have sufficient power to detect cell type–specific expression differences. Bulk transcriptomic analysis of sorted cell populations can identify cell type–specific expression signatures in SLE (7). However, it does not capture cell type frequencies, obscures heterogeneity within sorted populations, and is challenging to scale to well-powered cohorts for detecting subtle disease-associated differences in gene expression.
Single-cell RNA sequencing (scRNA-seq) of PBMCs holds potential as a comprehensive and unbiased approach to simultaneously profile the composition and cell type–specific transcriptional states of circulating immune cells. When integrated with dense genotyping data, there are further opportunities to fine-map disease-associated variants and identify the cell types and states where they exert their effects. Despite its potential, application of scRNA-seq to population cohorts has been limited by low sample throughput, high cost, and susceptibility to technical variability. To overcome these limitations, we previously developed multiplexed scRNA-seq (mux-seq) to enable systematic and cost-effective scRNA-seq of population cohorts (8).
A census of circulating immune cells in SLE
We used mux-seq (8) to profile more than 1.2 million PBMCs from 264 unique samples obtained from the California Lupus Epidemiology Study (CLUES) (9) and the ImmVar Consortium (10–12). The 264 samples corresponded to 162 SLE cases, including 19 disease flare cases and 10 matched samples post–flare treatment, along with 99 healthy controls (fig. S1A). Most samples were from women of either European or Asian ancestry. The 264 samples and 91 replicates were profiled in 23 pools across four batches (fig. S1B). Surface protein expression for cells from processing batches 3 (155,034 cells) and 4 (375,261 cells) were also profiled using 16 and 99 DNA-conjugated antibodies, respectively. After quality control and doublet removal using freemuxlet (8) (mean doublet rate 22.12%; fig. S1C), 1,444,450 cells remained. Additional removal of doublets using Scrublet (13) (67,969 droplets), contaminating platelets, and red blood cells (112,805 cells) yielded a total of 1,263,676 cells remaining in the final dataset (fig. S1C). Genotype-based sample demultiplexing resulted in an average of 3560 singlets (standard deviation, 1103) assigned to each sample (fig. S1D).
Compositional analysis reveals CD4+ T cell lymphopenia in SLE
Louvain clustering (14) of normalized and batch-corrected single-cell transcriptomic profiles identified 23 clusters, which were assigned to 11 cell types: CD14+ classical and CD16+ nonclassical monocytes (cM and ncM); conventional and plasmacytoid dendritic cells (cDC and pDC); CD4+ and CD8+ T cells (CD4 and CD8); natural killer cells (NK); B cells (B); plasmablasts (PB); proliferating T and NK cells (Prolif); and progenitor cells (Progen) (fig. S2A). Regions of the uniform manifold approximation and projection (UMAP) (15) were occupied by cells of different cell types (Fig. 1A), and to a lesser extent, different case-control status and ancestry (Fig. 1B and fig. S2B). Different pools and processing batches had no observable effects on the distribution of cells (fig. S2, C and D).
Fig. 1. Changes in composition of circulating immune cells in SLE.
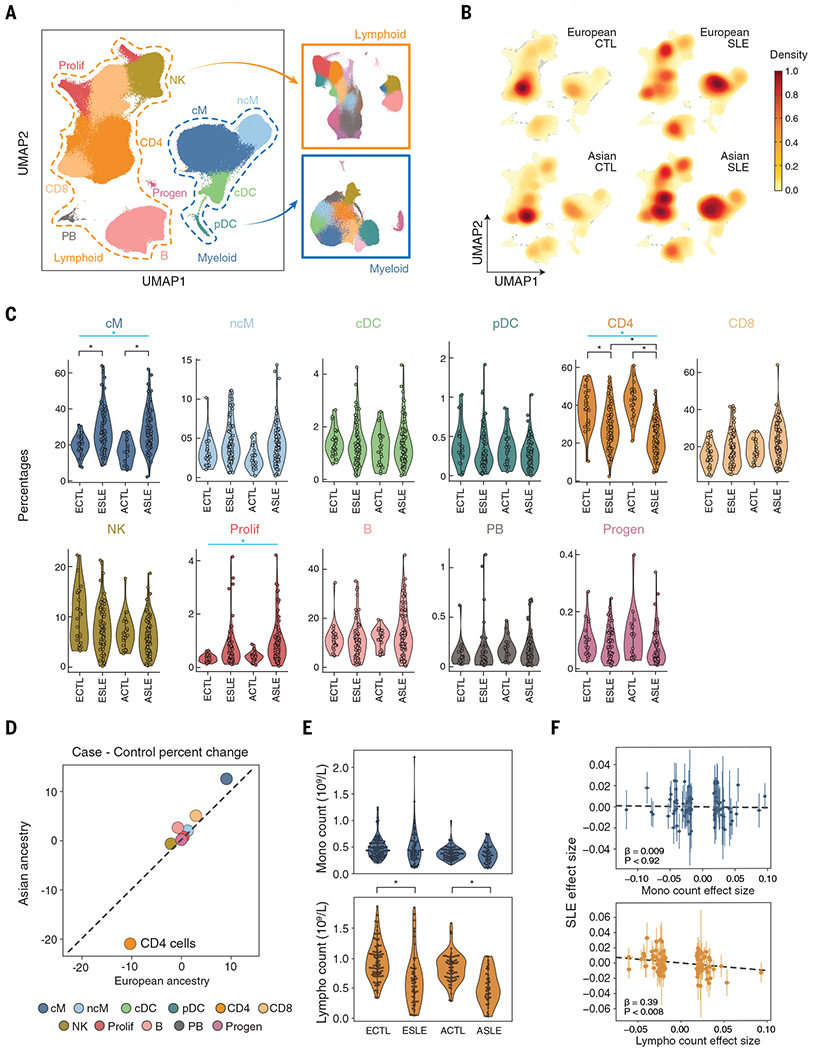
(A) UMAP and assignment of 1.2 million cells to 11 cell types: classical and nonclassical monocytes (cM and ncM); conventional and plasmacytoid dendritic cells (cDC and pDC); CD4+ and CD8+ T cells (CD4 and CD8); natural killer cells (NK); B cells (B); plasmablasts (PB); proliferating lymphocytes (Prolif); CD34+ progenitors (Progen). Subclustering of lymphoid (orange box) and myeloid (blue box) cell populations. (B) Cell density plots of cases and controls separated by ancestry. (C) Percentage (y axis) versus case-control status (x axis) for each cell type separated by ancestry. Cell types with significant percentage changes between cases and controls are highlighted. *Padjusted < 0.05 [weighted least squares (WLS)]; blue bar indicates significant meta-analysis by Fisher’s method. (D) Correlation in percentage change versus controls between European (x axis) and Asian (y axis) cases. Colors are the same as in (C). (E) Monocyte (top) and lymphocyte (bottom) abundances (y axes) versus case-control status (x axis) from the UCSF EHR. Significant differences between cases and controls are highlighted. *Padjusted < 0.05 (OLS). (F) Scatterplot of effect sizes on SLE status (y axis) versus effect sizes on monocyte (top) or lymphocyte (bottom) abundance (x axes) for genetic variants associated with both traits reported (4, 17). ECTL, European control; ESLE, European case; ACTL, Asian control; ASLE, Asian case.
We first assessed changes in cellular composition in SLE by comparing the frequencies of 11 cell types between cases and controls of Asian and European ancestry separately. Cell type percentage estimates from mux-seq were reproducible between biological replicates (median Pearson Rcases = 0.79 and Rcontrols = 0.85) (fig. S2E) and correlated with estimates obtained from surface protein profiling for batch 4 (median Spearman R = 0.88). Relative to controls, cases were most notably marked by a decrease in CD4 percentage [weighted least squares (WLS); Asian, −20.4%; European, −10.0%; Fisher’s method Pmeta:Fisher < 5.58 × 10⁻¹⁶] and an increase in cM (Asian, +11.9%; European, +8.8%; Pmeta:Fisher < 9.75 × 10⁻⁷) and Prolif percentages (Asian, +0.55%; European, +0.38%; Pmeta:Fisher < 1.93 × 10⁻³; Fig. 1C and table S1). Although most changes were correlated between ancestries (Pearson R = 0.97), Asian cases were marked by a greater reduction in CD4 percentage [log2(fold change) = −0.36, PWLS < 5.60 × 10⁻⁵; Fig. 1D]. Cases not receiving therapy (N = 21) exhibited changes in composition similar to cases receiving therapy (Pearson RAsian = 0.89 and REuropean = 0.92; fig. S2H). Relative to cases not receiving oral steroids (OS; N = 78), cases treated with OS (N = 82) exhibited an increase in CD8 percentage (Asian, +5.2%; European, +3.9%; Pmeta:Fisher < 4.23 × 10⁻³) and a decrease in ncM percentage (Asian, −1.3%; European, −1.0%; Pmeta:Fisher < 3.54 × 10⁻³; fig. S2F). Cases treated with azathioprine (AZ, N = 15) had a decrease in NK percentage (Asian, −4.3%; European, −7.7%; Pmeta:Fisher < 6.68 × 10⁻⁵) and an increase in PB percentage (Asian, +0.2%; European, +0.3%; Pmeta:Fisher < 1.36 × 10⁻³; fig. S2F) relative to cases not receiving AZ. Cases treated with mycophenolate mofetil (N = 54), hydroxychloroquine (N = 113), methotrexate (N = 13), or a calcineurin inhibitor (N = 10) did not exhibit significant differences in composition compared with cases not receiving each of these therapies. These results suggest that the decrease in CD4+ T cell percentages and increase in classical monocyte percentages in patients with SLE are not due to therapy.
We next assessed whether changes in CD4 and cM percentages were due to changes in the absolute abundance of either population. We analyzed lymphocyte and monocyte abundances reported in the UCSF electronic health record (EHR) complete blood count. Reported abundances in the EHR were highly correlated with the estimated abundances from mux-seq (Pearson Rlympho = 0.97 and Rmono = 0.87; fig. S2G). Comparing an additional 100 cases with 154 controls matched for self-reported ancestry, age, and sex, cases exhibited a significant reduction in lymphocyte abundance [ordinary least squares (OLS); Asian, −7.4 × 10⁸ cells/liter, POLS < 3.46 × 10⁻⁹; European, −5 × 10⁸ cells/liter, POLS < 1.07 × 10⁻⁶; Fig. 1E] but no difference in monocyte abundance (Asian, POLS = 0.61; European, POLS = 0.98). To assess whether a causal relationship exists between lymphocyte decrease and SLE, we performed generalized summary data–based Mendelian randomizations using summary statistics for genetic associations to immune cell composition (16, 17). The mediation effect of variants associated with lymphocyte abundance (βlympho→SLE = −.0.39, Plympho→SLE < 0.008) but not monocyte abundance (βmono→SLE = 0.009, Pmono→SLE < 0.92), was negative on SLE risk. A reverse causation analysis did not show mediation of SLE risk on lymphopenia (PSLE→lympho < 0.24, PSLE→mono < 0.20; Fig. 1F), although an alternative explanation of horizontal pleiotropy cannot be excluded.
Decrease of circulating naïve CD4+ T cells in SLE
Previous studies revealed impaired activation of T and B memory cells and elevated expression of ISGs in lymphocytes from patients with SLE (18). To characterize changes in frequencies and transcriptomic profiles of lymphoid populations in SLE, we reclustered lymphoid cells and assigned the resulting 26 clusters to 14 subpopulations (Fig. 2A). Within non-T cells, we identified two NK and four B cell subpopulations. The NK compartment consisted of NKBright cells expressing high levels of GNLY and moderate levels of NKG7 and NKDim cells expressing high levels of NKG7 and CD16 (FCGR3A) (Fig. 2B). The B cell compartment consisted of naïve cells expressing TCL1A (BNaïve), memory cells expressing BANK1 (BMem), plasma cells expressing MZB1 (BPlasma), and an atypical memory subpopulation expressing FCRL5, CD11c, and TBX21 and lacking expression of CD21 (BAtypical; Fig. 2B). Atypical B cells may also contain age-associated B cells that share some (CD11c+, TBX21+, CD21−) but not all of the expression markers [FCRL5 (19)]. As a percentage of lymphocytes, neither NK nor B cell subpopulations significantly differed by case-control status.
Fig. 2. Reduction of naïve CD4+ and expansion of cytotoxic CD8+ T cells in SLE.
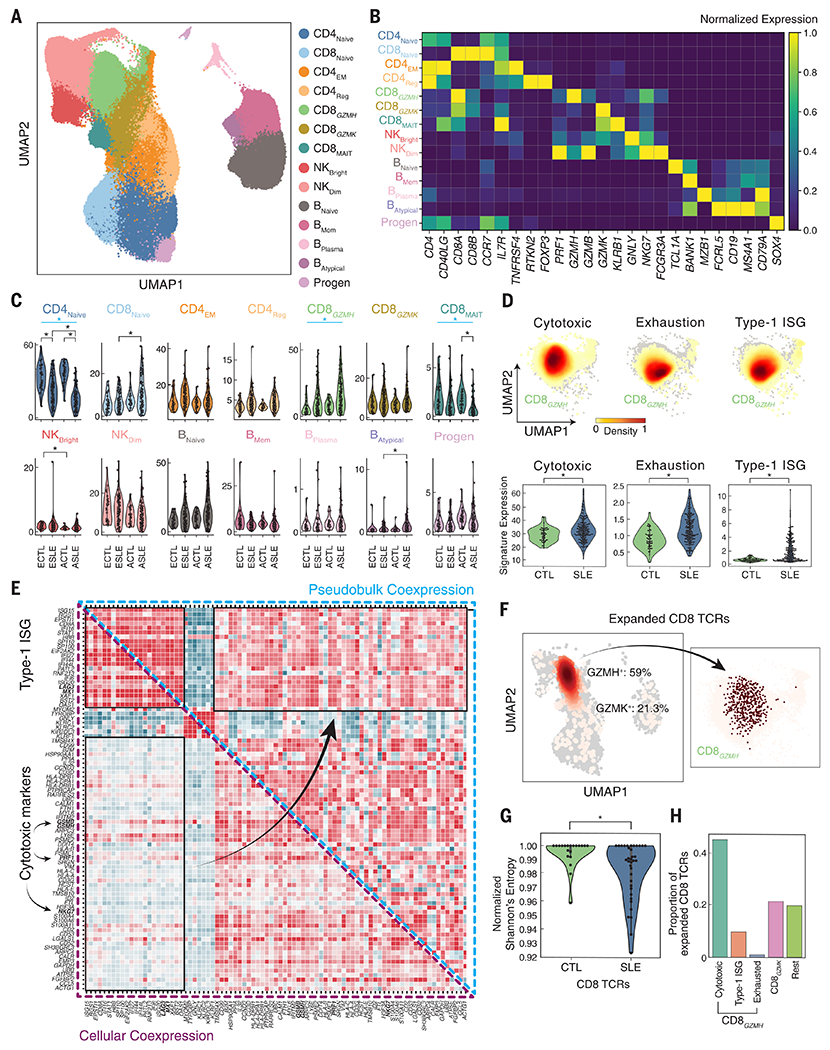
(A) UMAP of lymphoid cells reclustered into 14 subpopulations: naïve, effector memory, and regulatory CD4+ T cells (CD4Naïve, CD4EM, CD4Reg); naïve, GZMH+ cytotoxic, GZMK+ cytotoxic, and mucosal-associated invariant CD8+ T cells (CD8Naïve, CD8GZMH, CD8GZMK, CD8MAIT); CD56bright and CD56dim natural killer cells (NKBright, NKDim); naïve, memory, plasma, and atypical B cells (BNaïve, BMem, BPlasma, BAtypical); and CD34+ progenitors (Progen). (B) Expression of marker genes (columns) used to annotate each subpopulation (rows) colored by normalized expression level. (C) Percentage (y axis) versus case-control status (x axis) for each lymphoid subpopulation separated by ancestry. Subpopulations with significant percentage changes between cases and controls are highlighted. *Padjusted < 0.05 (WLS); blue bar indicates significant meta-analysis by Fisher’s method. (D) Density plot showing average expression of cytotoxic, exhaustion, and type 1 interferon–stimulated gene (ISG) signatures in CD8GZMH cells (top) and across individuals (bottom) separated by case-control status and ancestry. *P < 0.05 (WLS). (E) Coexpression of top 300 differentially expressed genes between cases and controls in CD8GZMH cells computed across single cells (lower triangular matrix) or across donor-specific pseudobulk expression profiles (upper triangular matrix). (F) All (light pink) and expanded (red) TCR sequences detected shown on UMAP of all cells (left) and GZMH+ cells (right). (G) Normalized Shannon’s entropies of CD8+ TCR repertoire diversity (y axis) in cases and controls (x axis). *P < 0.05 (WLS). (H) Percentage of expanded CD8+ TCRs identified as GZMH+ cells expressing cytotoxic, ISG, and exhaustion signatures, GZMK+ cells (GZMK), and all other cells (Rest). ECTL, European control; ESLE, European case; ACTL, Asian control; ASLE, Asian case.
In the CD4+ T cell compartment, we identified canonical subpopulations of naïve cells expressing CCR7 (CD4Naïve), effector memory cells lacking CCR7 expression while expressing OX40 receptor (TNFRSF4) and IL7R (CD4EM), and regulatory cells expressing the canonical transcription factor FOXP3 and its direct target RTKN2 (20) (CD4Reg; Fig. 2, A and B). Relative to controls, the most pronounced difference in cases was a reduction of CD4Naïve percentage (WLS; Asian, −21.7%; European, −11.8%; Fisher’s method Pmeta:Fisher < 8.63 × 10⁻²¹; Fig. 2C and table S2), with Asian cases exhibiting significantly more reduction than European cases (PWLS < 5.20 × 10⁻⁵). No significant association between CD4Naïve percentage and age (Spearman P = 0.76; fig. S3A) or treatment (fig. S3B) was detected. Cases not on therapy (N = 21) exhibited a similar decrease in CD4Naïve percentage relative to controls (Asian, −25.6%; European, −9.7%; Pmeta:Fisher < 2.66 × 10⁻⁷; fig. S3E).
Clonal expansion of cytotoxic GZMH+ T cells in SLE
Within the CD8+ T cell compartment, we identified naïve cells expressing CCR7 (CD8Naïve) and three effector memory subpopulations, including mucosal-associated invariant T cells expressing KLRB1 and GZMK (CD8MAIT) and two clusters lacking expression of KLRB1 and expressing the chemokine CCL5, effector molecule PRF1, and exhaustion marker LAG3 (Fig. 2, A and B). The two non-MAIT clusters could be distinguished by the expression of granzymes (CD8GZMH, GZMH and GZMB; CD8GZMK GZMK) and mirrored the NK subpopulations (NKDim, GZMH and GZMB; NKBright, GZMK) (Fig. 2B and fig. S3C). Within the CD8GZMH population, 6% were CD4+CD8− cells according to CD4 surface expression in the subset of samples that were also profiled using DNA-conjugated antibodies. Relative to controls, the CD8GZMH percentage was significantly increased in cases (Asian, +8.6%; European, +6.0%; Pmeta:Fisher < 3.43 × 10⁻⁴; Fig. 2C and table S2) and was observed at similar percentages in flaring and untreated cases (fig. S3, C to E). Additionally, we observed a reduction in CD8MAIT percentage in cases (Asian, −1.1%; European, −0.7%; Pmeta:Fisher < 6.93 × 10⁻⁶; Fig. 2C and table S2).
In addition to increased frequency within lymphocytes, CD8GZMH cells were a transcriptionally heterogeneous population with elevated expression of cytotoxic, exhaustion, and ISG signatures in SLE cases relative to controls (Fig. 2D). The expression of these signatures was not associated with treatment (fig. S3F). Additionally, only the ISG signature was inversely correlated with age (Pearson R = −0.39, P < 6.57 × 10⁻⁷). Across cells, the correlation between cytotoxic and ISG signature genes (mean RPearson = 0.16) and between cytotoxic and exhaustion signature genes (mean RPearson = 0.10) were generally low (Fig. 2E). Thus, in cases, these pathways are unlikely to be jointly activated in the same cells. This was in stark contrast to the high correlation between signature genes calculated across CD8GZMH pseudobulk expression profiles from different individuals, highlighting the limitation of bulk analysis in uncovering additional heterogeneity within a seemingly homogeneous population (Fig. 2E).
To further investigate the clonality of the CD8GZMH and CD8GZMK populations, we amplified and sequenced the CDR3 region of the T cell receptor (TCR), recovering paired TCRA and TCRB sequences from 10.2% of CD4 and 8.7% of CD8 cells with no differences in the number of unique TCRs detected between cases (N = 83) and controls (N = 20) (PWilcoxon = 0.72). Of the expanded CD8 clones, 59% were from CD8GZMH cells and 21% from CD8GZMK cells (Fig. 2F). Relative to controls, cases exhibited a restricted repertoire in CD8 cells (PWilcoxon < 0.01; Fig. 2G) but not CD4 cells (PWilcoxon = 0.91; fig. S3, G and H). Within the CD8GZMH subpopulation, cells expressing the cytotoxic signature were expanded at a ~4:1 ratio to cells expressing the ISG signature (44.8% versus 9.7%, Fig. 2H). As a positive control, clones expressing the invariant TRAV1-2 and TRAJ33 chains were enriched within the CD8MAIT cluster relative to other cell types (Tukey’s HSD P < 0.001; fig. S3I).
Expression changes across 11 peripheral immune cell types in SLE
Bulk transcriptomic analyses of PBMCs have consistently reported the association between SLE and elevated expression of ISGs, which is normally observed during acute viral infections (21). Longitudinal bulk analysis of 158 pediatric cases confirmed elevated expression of ISGs in patients with more severe acute presentations and increased renal and neurological involvement (3). However, bulk analysis has limited power to pinpoint the cell types producing the ISG signature or to identify additional cell type–specific signatures. Recent analysis of 33 pediatric cases demonstrated the potential of scRNA-seq to assign cell type specificity to previously identified ISGs from bulk analysis (6).
Transcriptional differences were characterized for each of 11 circulating immune cell types between SLE cases and controls. We found that 302 genes were differentially expressed (DE) in at least one cell type between cases and controls of either Asian or European ancestry, not confounded by medication [|log(fold change)| > 0.5; Padjusted < 0.05; table S3 and fig. S4, A and G]. Hierarchical clustering of pseudobulk expression profiles of these DE genes across cell types resulted in six modules (Fig. 3A). Relative to controls, cases up-regulated the expression of a module of ISGs across all cell types (Panup) and a myeloid-specific module (Myeup) containing IFITM1/3, IFITM3, APOBEC3A, RNASE2, and IFIT2. Both modules were enriched for type 1 interferon signaling and innate immune pathways (Fig. 3B). Additionally, we identified a down-regulated module across all cell types enriched for the interaction between lymphoid and non-lymphoid cells (Pandown), a myeloid-specific down-regulated module (Myedown) enriched for hedgehog signaling, a T cell–specific up-regulated module (Tup) enriched for leukocyte activation, and a B cell–specific up-regulated module (Bup) enriched for AP-1 transcriptional response and Toll-like receptor signaling (Fig. 3B).
Fig. 3. Type 1 interferon–stimulated gene expression of myeloid cells in SLE.
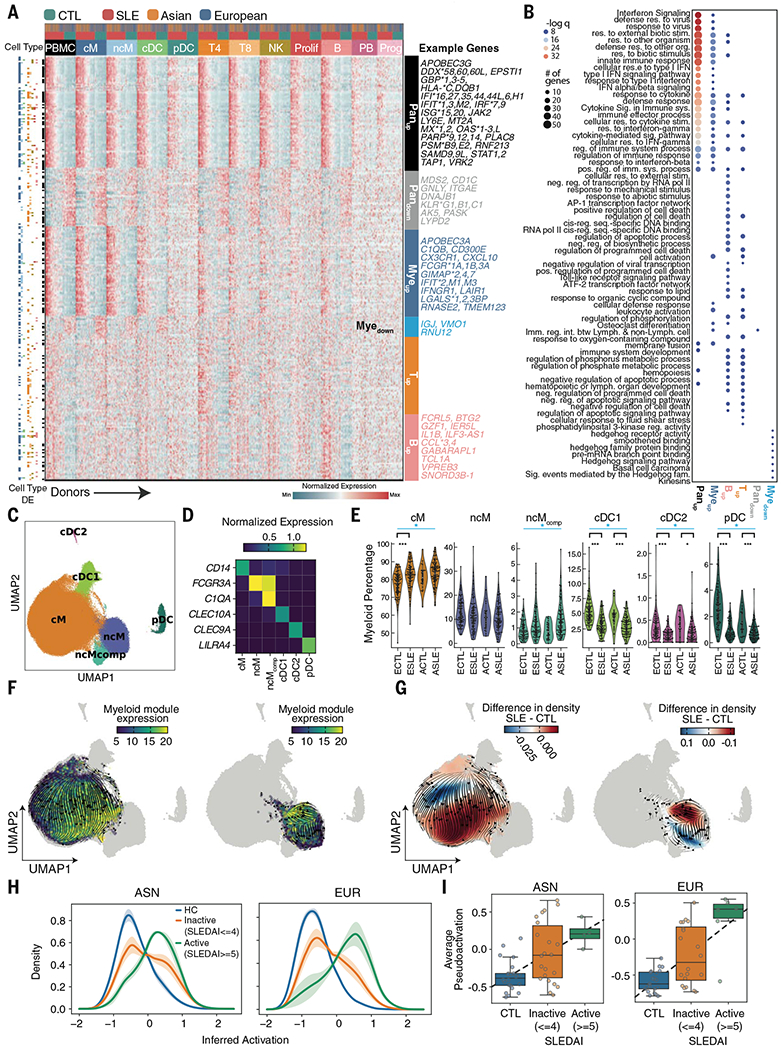
(A) Heatmap of pseudobulk gene expression profiles of 302 differentially expressed genes detected in at least one of 11 cell types. For each gene, colored row bars indicate cell types in which it was differentially expressed. Colored columns indicate cell type, case-control status, and ancestry. Labeled modules were identified using hierarchical clustering. (B) Top GSEA (gene set enrichment analysis) pathway enrichment results for each module. Each dot color represents the −log(q) value; dot size represents the number of genes overlapping with the gene ontology. (C) Identification of six myeloid cell types including classical, nonclassical, and complement-expressing nonclassical monocytes (cM, ncM, ncMcomp), conventional type 1, conventional type 2, and plasmacytoid dendritic cells (cDC1, cDC2, pDC). (D) Marker genes used for annotating each cell type. (E) Percentages of myeloid cells (y axis) versus case-control status and ancestry (x axis) for each myeloid sub-population. Myeloid subpopulations with significant percentage changes between cases and controls are highlighted. *P < 0.01, ***P < 0.0001 (WLS); blue bar indicates significant meta-analysis by Fisher’s method. (F and G) RNA velocity stream plots for cM (right UMAP) and ncM and ncMcomp (left UMAP) subpopulations colored by the average expression of Myeup genes enriched for type 1 ISGs (F) and the relative density of cells from SLE cases versus healthy controls (G). (H) Distribution of the degree of inferred activation for individuals across disease activities (HC, healthy controls; inactive, SLEDAI between 0 and 4; active, SLEDAI of 5 or more). (I) Average inferred activation across cells per sample (y axis) versus disease activity (x axis) for Asian (left) and European (right) samples separately. ECTL, European control; ESLE, European case; ACTL, Asian control; ASLE, Asian case.
Our results were validated by single-cell transcriptomic analyses of PBMCs activated in vitro by recombinant interferon-β (rIFNB1) (8) and from pediatric patients with SLE (6). For each cell type, particularly myeloid populations, expression fold changes between cases and controls were highly correlated with fold changes between rIFNB1-stimulated and unstimulated cells (fig. S4B). Of the 100 ISGs previously identified from bulk analysis and analyzed in pediatric SLE (6), 64 were DE in at least one cell type and mainly resided in the Panup (46/79) and Myeup (8/64) modules. Interestingly, 11 genes were DE only across PBMC pseudobulks, illustrating a likely confounding effect of bulk analysis due to differences in cellular composition between cases and controls (table S4). The large sample size of our cohort resulted in the identification of 238 previously undescribed DE genes in adult SLE, 56 of which were myeloid-specific.
Pronounced type 1 interferon response in classical monocytes
Myeloid cells exhibited the most DE genes between cases and controls, consisting of known and novel genes associated with SLE. To further investigate their heterogeneity, we reclustered myeloid cells into six clusters differentiating the monocyte lineage (cM, CD14+ classical; ncM, FCGR3A+ nonclassical; ncMcomp, C1QA+/FCGR3A+ complement-expressing nonclassical) and the dendritic cell lineage (cDC1, CLEC10A+ conventional type 1; cDC2, CLEC9A+ conventional type 2; pDC, IRF7+ plasmacytoid; Fig. 3, C and D, and fig. S4, C and D). Although pDCs can derive from either myeloid or lymphoid progenitors, their expression profiles were more similar to, and thus jointly analyzed with, other myeloid populations (22). We also detected AXL+ dendritic cells within both cDC1s and pDCs, consistent with their suggested distribution as a transitioning population between cDCs and pDCs (23) (fig. S4E). As a percentage of myeloid cells relative to controls, cases exhibited reduced percentages of pDCs (WLS; Asian, −0.6%; European, −1.8%; Fisher’s method Pmeta:Fisher < 2.33 × 10⁻²⁴), cDC1s (Asian, −2.0%; European, −1.9%; Pmeta:Fisher < 2.65 × 10⁻¹⁴), and cDC2s (Asian, −0.2%; European, −0.1%; Pmeta:Fisher < 2.51 × 10⁻⁷) and increased percentages of cMs (Asian, +3.6%; European, +3.7%; Pmeta:Fisher < 1.78 × 10⁻⁵) and ncMcompS (Asian: +0.5%; European, +0.2%; Pmeta:Fisher < 1.67 × 10⁻³; Fig. 3E and table S5).
Next, we used RNA velocity to assess the transcriptional heterogeneity of each myeloid cell type along a trajectory of inferred activation (24, 25). In cMs, ncMs, and ncMcompS, velocity analysis of DE genes revealed that inferred activation largely reflected the degree of average ISG expression (Myeup; Fig. 3F) with regions of high activation enriched for cells from SLE cases (Fig. 3G). These results were similar in cDC populations (fig. S4F). Ordering cMs along inferred activation showed higher activation from cases with higher SLE Disease Activity Index (SLEDAI) (26) defined using clinical features (t test; Asian, P < 5 × 10⁻⁴; European, P < 3.2 × 10⁻⁷; Fig. 3H). The average inferred activation was better correlated with SLEDAI in European(RPearson = 0.66) than in Asian cases (RPearson = 0.52; Fig. 3I). A wide range of average inferred activations were observed in patients of either ancestry with lower disease activity (SLEDAI between 0 and 4), which suggests that clinical measures underlying SLEDAI do not fully capture the molecular heterogeneity of SLE.
Expression modules enable clinical prediction and patient stratification
Previous work in mouse models has shown that type 1 interferons up-regulate the expression of CD69, thereby inhibiting lymphocyte egress from lymphoid tissue (27). We hypothesized that the pleiotropic effects of type 1 interferons in patients with SLE may underlie the monocyte-dominant expression of ISGs and inhibit CD4+ T cells from exiting lymphoid tissue, resulting in the observed decrease of circulating naïve CD4+ T cells. Consistent with this hypothesis, both the Panup and Myeup gene module scores were highly correlated with CD4Naïve abundance (Asian, Pearson RPanup = −0.52; European, RPanup = −0.57; Pmeta:Fisher < 1.04 × 10⁻³; Asian, RMyeup = −0.35; European, RMyeup = −0.48; Pmeta:Fisher < 0.02; Fig. 4A and fig. S5A).
Fig. 4. Prediction of disease status and molecular stratification of SLE.
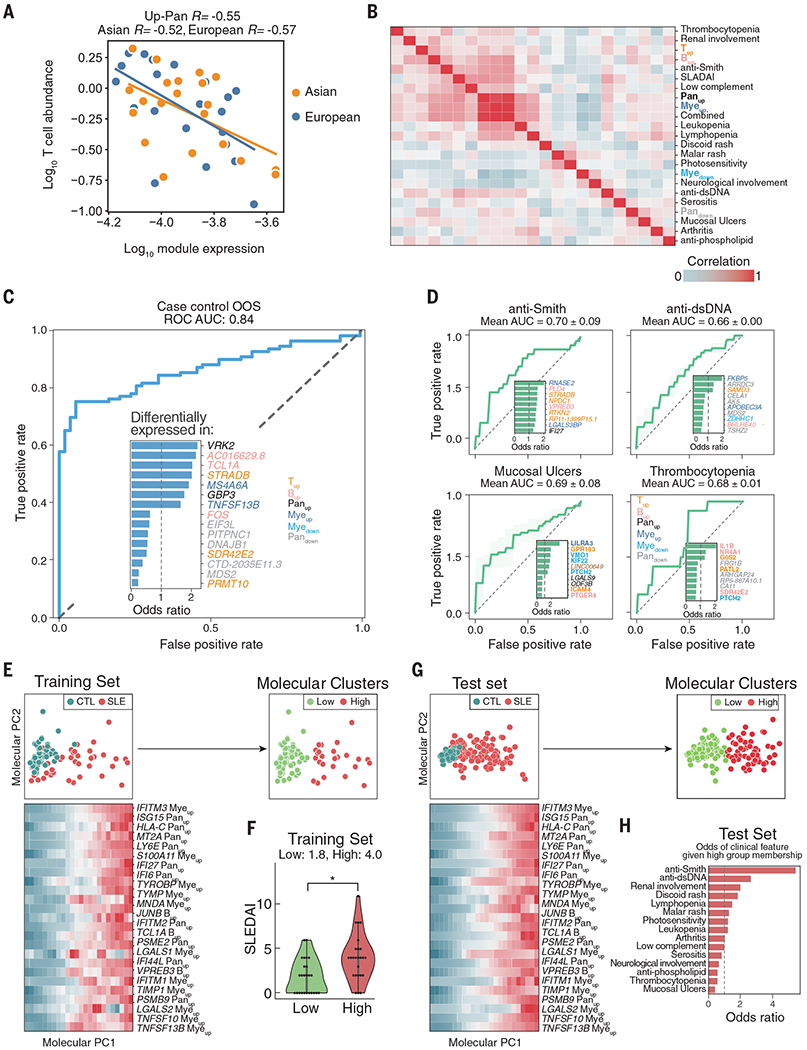
(A) Correlation between log10(expression of Panup) (x axis) and log10(abundance of CD4Naïve cells) in processing batch 4 cases only. (B) Correlation matrix between average expression of each of six gene modules and clinical features. (C and D) Receiver operating curve for out-of-sample (OOS) prediction of case-control status (C) and individual clinical variables (D) using a logistic regression model trained on 302 expression features. Inset depicts the most important molecular features inferred by the model, colored by the module to which each feature belongs. (E) Principal components analysis of training set based on 302 expression features. Green, control; red, case. Heatmap shows the top 25 most correlated expression features to molecular principal component PC1. Expression was binned and averaged across 24 equal steps across molecular PC1. K-means clustering of samples based on principal components yielded two molecular subphenotypes (Low, High). (F) Distribution of SLEDAI scores (y axis) for each molecular subphenotype (x axis) in the training cases. *P < 0.05 (Wilcoxon rank-sum test). (G) Projection of OOS test set onto molecular PC1 and PC2 and colored by case-control status (left) and molecular cluster membership (right). Heatmap shows the top 25 most correlated expression features to molecular PC1 in the test set. (H) Odds ratio of having a clinical feature given membership in the High molecular cluster versus the Low molecular cluster.
One of the diagnostic difficulties of SLE is the extensive heterogeneity in disease manifestations. Consistent with this heterogeneity, individual clinical features weakly correlated with module scores (Fig. 4B). We therefore used the expression of individual module genes over pseudobulks of the relevant cell types as features for clinical prediction and molecular stratification of SLE. Although the 302 expression features had good out-of-sample predictive power for case-control status [area under the curve (AUC) = 0.84; Fig. 4C], they had only modest predictive power for individual clinical features, reflective of the modest correlation between clinical features and module scores (Fig. 4D and fig. S5B). To molecularly stratify cases, we performed principal components analysis (PCA) of expression features followed by K-means clustering to identify two clusters that broadly separated donors by case-control status (Fig. 4E), severity of SLEDAI score (Fig. 4F), and along principal component 1 (PC1). Cases in the High cluster had significantly higher inferred activation of monocytes relative to cases in the Low cluster (PWilcoxon < 6.20 × 10⁻⁹; fig. S5C). PC1 correlated most with genes in the Panup, Myeup, and Bup modules, including the myeloid-specific expression of IFITM3, a gene previously described to stratify pediatric SLE cases (3) (Fig. 4E). To assess the correspondence between molecular clusters and clinical features, we projected 94 held-out cases each to a molecular cluster on the basis of expression features (Fig. 4G). Cases assigned to the High cluster were enriched for disease flare (15/19 flare cases, fig. S5D) and portended a factor of 5 increase in the odds of having anti-Smith antibodies (Padjusted:Fisher < 0.05; Fig. 4H). These results show that cell type–specific expression profiles obtained using mux-seq can be used to link cell-intrinsic states with changes in composition, predict case-control status, and molecularly stratify patients with SLE.
Identification of cell type–specific cis-eQTLs across eight immune cell types
We next integrated mux-seq data with genotyping data to map cell type– and cell context–specific cis–expression quantitative trait loci (cis-eQTLs) that may mediate SLE disease associations. Across the eight most abundant cell types, linear regression followed by meta-analysis (28, 29) of three cohorts (92 CLUES Europeans, 98 CLUES Asians, 46 ImmVar Europeans) identified 3331 genes with at least one cis-eQTL in a cell type [false discovery rate (FDR) < 0.05], which we termed cell type–by–cell type cis-eQTLs (CBC-eQTLs) (table S6). Analysis of the genetic architecture of gene expression (30) resulted in estimates of average cis heritability ranging from 0.03 to 0.09 per cell type and average cis genetic correlations (rG) ranging from 0.25 to 0.75 for pairs of cell types. Because cells were simultaneously processed, we also estimated shared residual effects (rE) between cell types (e.g., shared environmental and trans-genetic effects) ranging from 0.03 to 0.12. Clustering of rG and rE reflected known lineages between circulating immune cell types (Fig. 5A).
Fig. 5. Cell type–specific genetic determinants of gene expression.
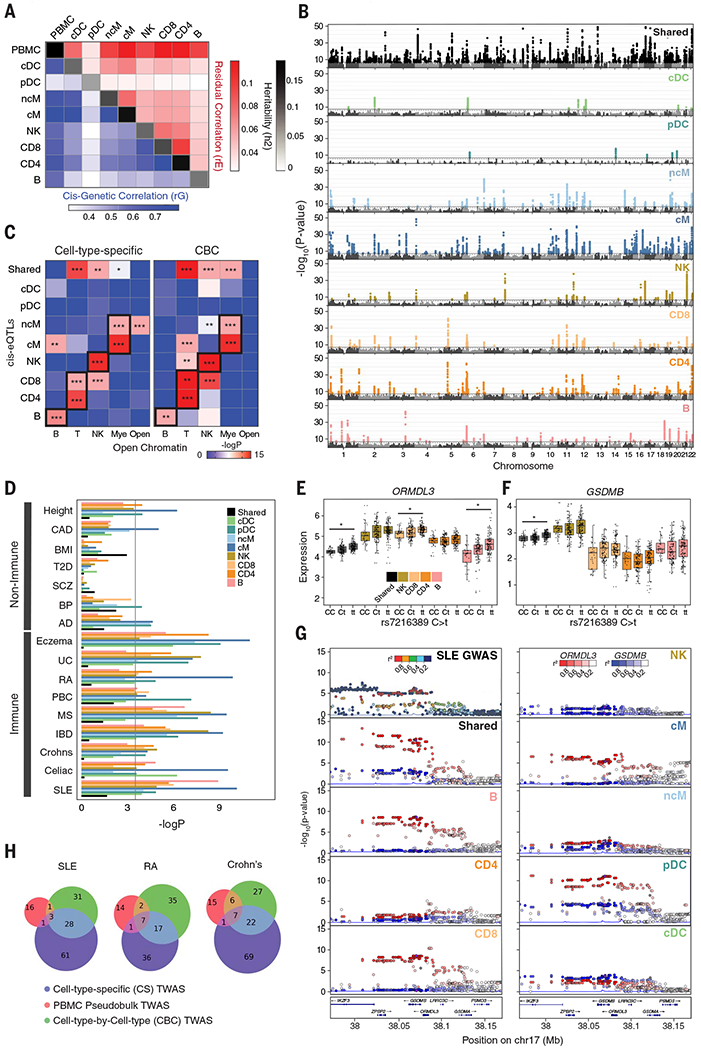
(A) Cis-genetic correlation (rG; lower triangular plot), shared residual correlation (rE; upper triangular plot), and heritability (h2; diagonal) of eight cell types and PBMCs. Cis is defined 100 kb within the transcription start site. (B) Manhattan plots of shared eQTLs (sh-eQTLs; black) and cell type–specific cis-eQTLs (cs-eQTLs; colored) determined by mapping cis-eQTLs associated with shared and cell type–specific expression components from decomposition analysis. Associations are reported as −log10(P value) (y axis) ordered by chromosomes (x axis). (C) Enrichment of cs-eQTLs (left) and cell type–by–cell type eQTLs (CBC-eQTLs; right) for disjoint sets of cell type–specific regions of open chromatin. *P < 0.01, **P < 0.001, ***P < 0.0001 (Mann-Whitney test). (D) Enrichment of shared or cs-eQTLs among GWAS associations for seven non–immune-mediated (CAD, coronary artery disease; BMI, body mass index; T2D, type 2 diabetes; SCZ, schizophrenia; BP, bipolar disease; AD, Alzheimer’s disease) and nine immune-mediated diseases or traits (UC, ulcerative colitis; RA, rheumatoid arthritis; PBC, primary biliary cirrhosis; MS, multiple sclerosis; IBD, inflammatory bowel disease; SLE, systemic lupus erythematosus). The Bonferroni corrected significance threshold is shown as a black line. (E and F) Boxplots of decomposed shared and cell type–specific expression of ORMDL3 (E) and GSDMB (F) in all individuals grouped by genotype for rs7216389. *COLOC posterior probability > 0.7. (G) LocusZoom plots of SLE GWAS, sh-eQTLs, and cs-eQTLs associated with ORMDL3 (red) and GSDMB (blue) expression. (H) Number of associations identified by a modified transcriptome-wide association analysis (TWAS) using decomposed shared and cell type–specific expression matrices (blue), CBC expression matrices (green), or pseudobulk PBMCs (red).
The rG and rE estimates suggest that pleiotropic genetic and shared residual effects are common across immune cell types, which may confound the ability to detect cell type–specific signals among CBC-eQTLs. To account for pleiotropy, we decomposed per–cell type expression profiles into a shared component across all cell types and eight cell type–specific components, then mapped cis-eQTLs associated with each component (31). We identified 535 genes with at least one cell type–specific cis-eQTL (cs-eQTL) (FDR < 0.05) and 1207 shared cis-eQTLs (sh-eQTLs) (Fig. 5B and table S7). The effect sizes of CBC-, sh-, and cs-eQTLs were correlated between individuals of European and Asian ancestries (fig. S6, A and B), which separated by genotype principal components (fig. S6C). Relative to CBC-eQTLs, cs-eQTLs for each cell type were significantly and specifically enriched for regions of chromatin accessibility in the same or closely related cell types (32), which suggests that decomposition analysis is more likely to identify cis-eQTLs overlapping cell type–specific cis-regulatory elements (Fig. 5C).
Identification and annotation of cell type–specific SLE-associated loci
We next integrated GWAS summary statistics from nine immune-mediated and seven non–immune-mediated traits/diseases to identify cell types where cs-eQTLs harbored the most GWAS associations. Linkage disequilibrium (LD) score regression (33) revealed enrichment of disease heritability for relevant cell types across autoimmune diseases (Fig. 5D). The highest enrichment for SLE variants was in cMs and B cells, consistent with our finding that cMs are the highest expressers of type 1 ISGs and with previous work demonstrating that activated B cells produce autoantibodies and secrete cytokines related to disease pathogenesis (34, 35) (Fig. 5D).
We next performed Bayesian genetic colocalization analyses using sh- and cs-eQTLs to fine-map 43 loci associated with SLE (4, 36). Among the five loci colocalized with sh-eQTLs [posterior probability (PP) > 0.6] was the UBE2L3 locus. Previously identified UBE2L3 cis-eQTLs in lymphoblastoid cell lines, B cells, and monocytes were replicated by colocalization analysis using CBC-eQTLs (B, cM, ncM; PP > 50%). However, analysis using sh- and cs-eQTLs predicted colocalization of the SLE association and an UBEL2L3 sh-eQTL (PP = 88.5%), which suggests that this association is shared across cell types (fig. S6D).
Among the seven SLE-associated loci colocalizing with cs-eQTLs was 17q21, a locus associated with asthma (37), Crohn’s disease (38), and type 1 diabetes (39). This locus has been difficult to dissect as it encompasses three genes, IKZF3, GSDMB, and ORMDL3, implicated in lymphocyte development (40), pyroptosis (41), and inflammation (42). ORMDL3, a regulator of sphingolipid biosynthesis, is linked to the autophagy pathway associated with multiple autoimmune diseases (43) and is implicated in the development and differentiation of lymphocytes in SLE pathogenesis (44). ORMDL3 was ubiquitously expressed across cell types with the highest expression in lymphoid populations (Fig. 5, E and F). Colocalization was predicted between SLE associations and both ORMDL3 sh-eQTLs (PP > 88%) and cs-eQTLs in Bs, CD8s, and pDCs (PP > 96.1%, 92.0%, and 92.1%, respectively) (Fig. 5G). Although GSDMB and IKZF3 were also expressed in most cell types (Fig. 5F), neither gene had a cs-eQTL and the highest posterior probability of colocalization was observed between SLE associations and GSDMB sh-eQTLs at 63.8%. Further, conditional analysis (45) confirmed that the SLE associations observed near IKZF3 (Fig. 5G) were independent of the GSDMB and ORMDL3 associations, and that the conditioned SLE associations still colocalized with the ORMDL3 cs- and sh-eQTLs. The minor allele (T) of rs7216389, a tagging variant in the locus associated with asthma and SLE (P < 6.09 × 10⁻⁷) (4), conferred an increase of GSDMB and ORMDL3 expression across all cell types, but an additional increase of ORMDL3 expression in CD8s and Bs that suggested cell type–specific genetic effects in these cell types was not observed for GSDMB (Fig. 5G). These results are consistent with previous observations in CD8s and Bs where SNPs in high LD with rs7216389 impacted regulatory elements affecting ORMDL3 expression (46).
We further used expression decomposition to perform a modified transcriptome-wide association study (TWAS) using CONTENT (47). Across SLE, Crohn’s disease, and rheumatoid arthritis, joint modeling of shared and cell type–specific gene expression identified 93 genes associated with SLE (73 novel), more than twice the number identified by CBC approaches (Fig. 5H). Results were significantly enriched for known SLE associations where 51% of candidate genes, defined as the most proximal gene to each SLE association (6), were replicated in the TWAS with P < 0.05 (PEnrichment < 1.2 × 10⁻²⁴). Both the joint and CBC analyses enabled by mux-seq significantly outperformed a standard TWAS using pseudobulk PBMC transcriptomic profiles. These analyses highlight the advantage of leveraging cell type–specific cis-eQTLs to annotate GWAS associations, detangle GWAS signals in gene-dense loci, and power TWAS analysis to identify novel associations.
Modification of genetic effects on gene expression by interferon activation
We next assessed whether variable type 1 interferon activation observed in patients with SLE could modify genetic effects on gene expression in vivo, consistent with our previous in vitro work (11, 48). In SLE cases, we identified 35 genes with a cis-eQTL interacting with the Panup ISG signature, a proxy for type 1 interferon activation, which we call IFN-eQTL (FDR < 0.1). IFN-eQTL effect size estimates correlated between samples of Asian and European ancestries (fig. S7). Previous interferon response cis-eQTLs (reQTLs) identified in monocyte-derived dendritic cells in vitro (48) were significant in cMs but not in other cell types (Fig. 6A).
Fig. 6. Interferon modifies cell type–specific genetic effects on gene expression.
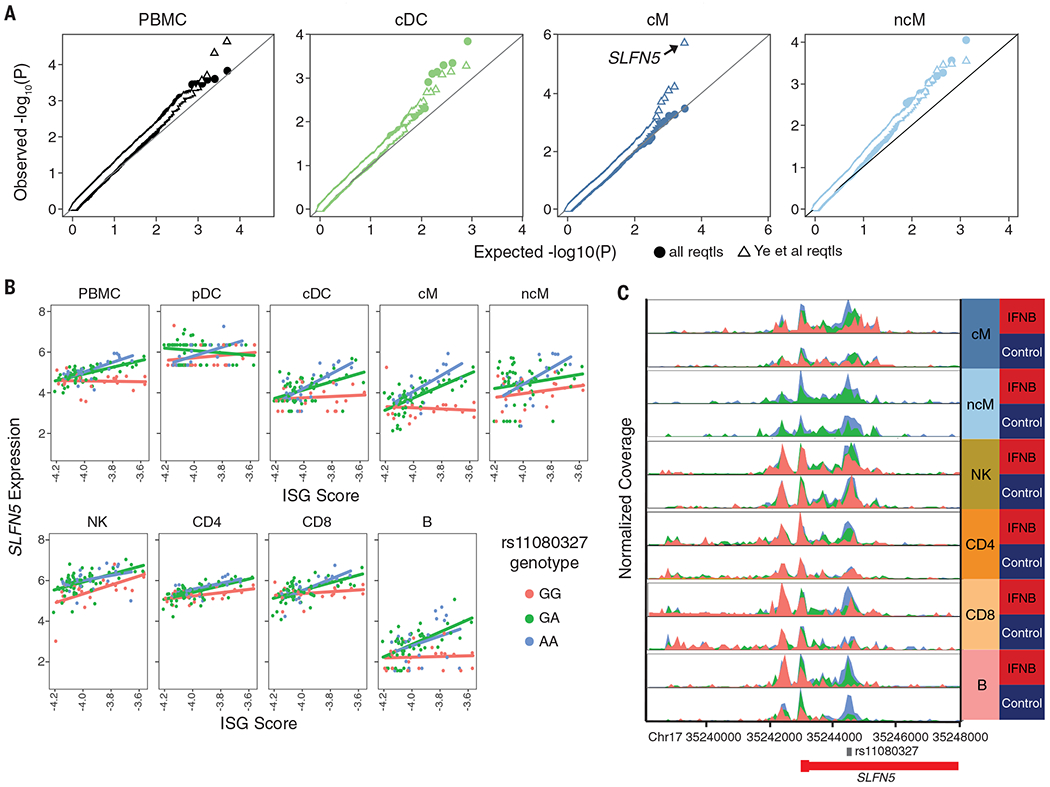
(A) Quantile-quantile plot of expected −log10(P value) (x axis) versus observed −log10(P value) (y axis) of cis-IFN-QTLs (solid circles). Previously identified (48) response-QTLs (reQTLs) from monocyte-derived dendritic cells are highlighted (open triangles). (B) Normalized expression of SLFN5 expression (y axis) versus ISG score (x axis) separated by rs11080327 genotype (color). Line indicates best linear regression fit for each genotype. (C) Gene locus plot of SLFN5 scATAC-seq peaks for six peripheral immune cell types in unstimulated and rIFNB1-stimulated conditions, separated by genotype. Location of rs11080327 is indicated.
Among the IFN-eQTLs, we replicated rs11080327 (A>G) as an IFN-eQTL for SLFN5 in myeloid (cM, P < 2.5× 10⁻¹⁰; ncM, P < 0.001) and B cells (P < 5.8 × 10⁻⁶) but not in NK or T cells (Fig. 6B). These results are consistent with the identification of rs11080327 as a cis-eQTL in lymphoblastoid cell lines (49) and as a cis-reQTL in monocyte-derived dendritic cells stimulated with rIFNB1 (11). We then performed multiplexed single-cell ATAC-seq of PBMCs from five healthy donors either unstimulated or stimulated with rIFNB1. In most cell types, we observed less accessibility in genomic regions near rs11080327 at baseline and a genotype-dependent increase of accessibility after stimulation (Fig. 6C). This was most pronounced in cMs, where the strongest IFN-eQTL was observed. These results are consistent with luciferase reporter assays that reveal the region overlapping rs11080327 to be harboring a cis-regulatory element that is activated in response to type 1 interferon (11). Overall, our findings illustrate that variability in cell activation in vivo could modify genetic effects on gene expression, which in turn suggests that genetic differences may not only predispose individuals to SLE but may also affect an individual’s response to a disease state.
Discussion
SLE remains a challenging autoimmune disease to diagnose and treat. The paucity of targeted therapies, in conjunction with the heterogeneity of disease manifestations and treatment response, highlight the need for improved molecular characterization. In a large ancestrally diverse cohort, we demonstrated the use of mux-seq as a systematic approach to characterize changes in cell type composition and cell type–specific gene expression in adult SLE. We further showed how integration of population genetics with single-cell RNA sequencing could be used to annotate genetic variants with cell type–specific effects on gene expression associated with SLE and other autoimmune diseases.
Using mux-seq, we linked compositional changes to variation in immune cell transcriptional states in SLE. Compositionally, the decrease of naïve CD4+ T cells in cases, particularly those of Asian ancestry, appears to explain the known lymphopenia observed in patients with SLE and importantly was not associated with immunosuppressant treatment, consistent with reports suggesting that mycophenolate mofetil, hydroxychloroquine, and steroids have either no or transient effects on the composition of white blood cells (50). Transcriptionally, cMs and ncMs produced the most prominent type 1 ISG signature, including genes specific to myeloid cells, consistent with observations in pediatric SLE (6). This finding justifies further investigation into the heterogeneity of type 1 interferon response across leukocyte subsets, particularly in SLE patients being treated with antagonists against the type 1 interferon receptors that have shown mixed results in clinical trials (51). Although both cDCs and pDCs also express ISGs, their scarcity in circulation limited their contribution to the overall ISG signature. We did not detect IFNB1 or IFNA transcripts in pDCs or other myeloid cell types; thus, the source of type 1 interferons in SLE remains elusive and is likely not among circulating immune cells (52). The inverse correlation between naïve CD4+ T cell abundance and monocyte ISG expression suggests the following model of the pleiotropic effects of type 1 interferons in vivo: ISGs are produced through the interferon signaling cascade and T cells are sequestered at sites of inflammation through the regulation of CD69 and S1PR1 (27). Whereas age was inversely correlated with the ISG signature, consistent with previous reports, naïve CD4 T cell abundance was not correlated with age and remains inversely correlated to the ISG signature after adjusting for age (53). Thus, age is likely not a primary factor for causing SLE, consistent with healthy female first-degree relatives showing a similar inverse correlation between age and serum IFN-α (7). Matched profiling of cells from disease-damaged tissue and blood in cases could further shed light on the source of type 1 interferons and confirm the role of lymphocyte trafficking in SLE.
A striking observation from our data is the expansion of GZMH+ but not GZMK+ cytotoxic CD8+ T cells in SLE, in some cases consisting of ~50% of all lymphocytes. Two cytotoxic CD8+ T cell populations were also observed in pediatric SLE (6), but the frequency of GZMH+ CD8+ T cells was not reported to be significantly increased despite elevated expression of GZMB and PRF1, which may originate from both GZMH+ CD8+ T and NKdim cells. Although GZMB and PRF1 have been described as markers for CD8+ T cell subsets enriched in SLE (54), GZMH was higher expressed, more ubiquitous, and more differentially expressed between cases and controls. The function of granzyme-H is not well characterized, but previous work demonstrated its divergent roles in initiating caspase-dependent apoptosis in T cells while initiating caspase-independent apoptosis in NK cells (55, 56). The significant clonal expansion of GZMH+ CD8+ T cells, specifically within the cytotoxic subpopulation, suggests a pathogenic role for these cells in SLE and is consistent with independent work (54). One model for the initiation and exacerbation of SLE suggested by these results is an adaptive immune response initiated by foreign and autoantigens followed by chronic exposure to antigens in damaged tissue, resulting in “epitope spreading,” where new autoantigens are introduced to the immune system and become future targets of the autoimmune response (57). Analysis of immune repertoires of both B and T cells and matching analysis of their antigenic specificity of SLE patients longitudinally would be instructive for deciphering the role of cell-mediated immunity in pathogenesis.
Integrating measurements of cellular composition and cell type–specific expression with genotyping provided an opportunity to assess the genetic determinants of cell type– and cell context–specific gene expression and ascribe functionality to SLE-associated variants. In the presence of pleiotropic effects, mux-seq enabled the decomposition of gene expression into shared and cell type–specific components and mapping of cis-eQTLs associated with these components. Enrichment analyses of orthogonal functional genomic datasets supported the annotation of cell type–specific cis-eQTLs. Integrated analysis of GWAS data and cell type–specific cis-eQTLs provided insight into immune cell types that mediate disease associations; for individual loci, it enabled the fine-mapping and annotation of disease-associated variants. Using decomposed expression components also significantly improved our ability to identify novel disease-associated genes using TWAS compared to using pseudobulk expression profiles over PBMCs or individual cell types. Finally, using quantitative measures of interferon activation from mux-seq, we identified cis-eQTLs whose effects on gene expression could be modified by elevated interferon levels, a critical disease environment in SLE. These results highlight the importance of cellular context for the interpretation of genetic variants associated with disease risk and perhaps disease heterogeneity.
Mux-seq is a cost-effective and systematic approach for enabling cellular phenotyping of large population cohorts. Genetic analysis of cohorts across populations is important for understanding the differences in SLE risk between ancestries and the involvement of environmental triggers. Longitudinal profiling of SLE cases, particularly patients in remission or active flare, could reveal new insights into the initiation of disease, variation in disease activity, new homeostatic states in patients, and response to treatment. Although we examined and controlled for treatment-associated differences in cellular composition and cell type–specific expression between SLE and healthy controls, we did observe notable effects of treatment including the depletion of NK cells in patients treated with azathioprine. Because mux-seq leverages natural genetic variation as sample barcodes, it is compatible with multimodal single-cell profiling of chromatin state and cell surface protein abundance. The integration of richer epigenetic and cellular phenotypes along with improvements to current transcriptomic workflows will undoubtedly improve molecular subphenotyping of SLE, the power to detect cell type–specific and cell context–specific molecular QTLs, and the resolution for annotating SLE associations.
Methods summary
Detailed materials and methods can be found in the supplementary materials. Briefly, we collected PBMCs from SLE cases in the California Lupus Epidemiological Study (CLUES) cohort, matching healthy controls from the UCSF Rheumatology Clinic, and additional controls from the Immune Variation Project (ImmVar). Presence of clinical features important to SLE were recorded.
Antibody-stained or unstained PBMCs were pooled and profiled using 10x Genomics’ Chromium Single Cell 3′ V2 chemistry and processed using the 10x Cell Ranger pipeline. Freemuxlet was used to assign cells to their donor of origin and, along with Scrublet (13), remove doublets. Platelets, megakaryocytes, and red blood cells were removed using gene markers. Technical variation was removed using COMBAT and regressing out nUMIs, and mitochondrial percent. Standard approaches in Scanpy version 1.6 were used to filter cells, perform dimensionality reduction, cluster using Louvain, and project cells using UMAP (58). Cell types were annotated using canonical marker genes and confirmed in cells with antibody staining.
For each cell type, percentage is calculated as the number of cells divided by the total number of cells assigned to the sample. Differences in percentages were compared using weighted least squares. UCSF electronic health record queries compared individuals with multiple heathy encounters and cases with a M32.* ICD-10 code. Mendelian randomization was performed using the GSMR package version 1.91.5beta on UK Biobank cell count QTLs and a separate SLE study (4). To examine changes in expression, pseudobulk expression profiles were computed for each cell type and individual using EdgeR EdgeR was used to perform differential expression analysis (59). CD8GZMH signature scores were calculated using Scanpy score_genes on canonical markers. Module scores per individual were calculated by the mean pseudobulk expression for genes in each module. Coexpression analysis was performed on the top 300 DE genes, and clustered by Spearman correlation. Expression modules were recovered by hierarchical clustering of DE genes, revealing six modules. ToppGene was used to find enrichment of modules in pathways (60). Molecular clusters were defined using PCA. RNA velocity was performed on cM using the scVelo package. Sklearn’s Logistic Regression function was used for all prediction models.
TCR sequencing was performed by amplifying TRA and TRB CDR3 sequences from cDNA and processed with the Cell Ranger pipeline. Only cells with paired TRA and TRB were used. TCRs were analyzed with the singleTCR package. Expanded clonotypes, defined as a TCR sequence detected in at least two cells, were identified using normalized Shannon’s entropy.
Samples collected at UCSF were genotyped using the Affymetrix World LAT array. ImmVar samples were genotyped on the OmniExpressExome54 chip. Data were processed using Axiom Best Practices or by previously published methods for the ImmVar cohort. Samples were evaluated for call rate, missingness, and heterozygosity, then imputed using the Michigan Imputation Server with the Haplotype Reference Consortium version 1.1 reference set. Only SNPs with Rsq > 0.3 and minor allele frequency > 10% were retained. Heritability was calculated with the GCTA package’s Bivariate GREML function. Cis-eQTLs were mapped ±100 kb of each gene using the MatrixEQTL package accounting for genotype PCs, expression PCs, age, sex, SLE status, and batch as covariates in the linear model. Cell type–specific eQTLs were mapped using the fastGxC method (31). CLUES Asian, CLUES European, and ImmVar samples were analyzed separately, then meta-analyzed using the METASOFT package. Empirical P values and FDRs were calculated with the qvalue package. LocusZoom was used to visualize loci. SLE cases were analyzed for reQTLs with MatrixEQTL using the ISG score as an interaction term and accounting for genotype PCs, age, sex, and batch.
ATAC-seq enrichment was calculated using a Mann-Whitney test and previously published ATAC-seq peaks from sorted cell types. GWAS enrichment was calculated using LDscore regression (33). TWAS analyses were performed using CONTENT (47). Colocalization analyses were performed with COLOC (36).
The 10x Chromium scATAC-seq kit was used to process PBMCs from five healthy individuals incubated for 8 hours with IFNB or culture media alone. Sequencing data were processed with CellRanger and demultiplexed with Free-muxlet. The ArchR package and Scanpy were used for downstream processing (61).
Supplementary Material
Analyzing immune system gene expression.
Diseases involving the immune system are heritable, but it is unknown how genetic variation contributes to different diseases. To identify how implicated loci affect gene expression in immune cells from individuals from different populations, two groups performed single-cell RNA sequencing of immune cells, with each study investigating hundreds of individuals and more than 1 million immune cells (see the Perspective by Sumida and Hafler). These studies examined both proximal (cis) and distal (trans) genetic variants affecting gene expression in 14 different immune cell types. Perez et al. studied healthy individuals of both European and Asian descent, as well as individuals diagnosed with systemic lupus erythematosus. Yazar et al. performed a population-based study investigating how segregating alleles contribute to variation in immune function. Integrating these data with autoimmune disease cohorts identifies causal effects for more than 160 loci. Both studies observe how gene expression patterns are cell-type and context specific and can explain observed variation in immune cell function among individuals. Both studies also identify causal links between genome-wide analyses and expression quantitative trait loci, identifying potential mechanisms underlying autoimmune diseases. —LMZ
ACKNOWLEDGMENTS
We thank all members of the Ye lab for discussions.
Funding:
Supported by NIH grant P30AR070155 (C.J.Y., L.A.C., and J.Y.); NIH grants R01AR071522, U01HG012192, R21AI133337, and CZI P0535277 (C.J.Y.); CDC grant U01DP005120 (L.A.C. and J.Y.); the Lupus Research Alliance (L.A.C.); NIH grants K25HL121295, U01HG009080, R01HG006399, R01CA227237, and R03DE025665 and DoD grant W81XWH-16-2-0018 (N.Z.); NIH grants R01CA194511 and R01CA223484 (L.F.); the Manton Foundation, Klarman Cell Observatory, and Howard Hughes Medical Institute (A.R.); NIH grant 1F31HG011007 (M.G.G.); NSF grant GRFP 1650113 (G.C.H.); and NIH grant T32HG002536 (M.T.).
Competing interests:
A.R. is a co-founder and equity holder of Celsius Therapeutics, an equity holder in Immunitas, and was an SAB member of ThermoFisher Scientific, Syros Pharmaceuticals, Neogene Therapeutics, and Asimov until 31 July 2020. From 1 August 2020, A.R. is an employee of Genentech. O.R.R. is a co-inventor on patent applications filed at the Broad related to single-cell genomics. O.R.R. has given numerous lectures about single-cell genomics to a wide variety of audiences and, in some cases, has received remuneration to cover time and costs. C.J.Y. is a SAB member for and holds equity in Related Sciences and ImmunAI, is a consultant for and holds equity in Maze Therapeutics, and is a consultant for Trex Bio. C.J.Y. has received research support from Chan Zuckerberg Initiative, Chan Zuckerberg Biohub, and Genentech.
Footnotes
SUPPLEMENTARY MATERIALS
Data and materials availability:
All data are available in the Human Cell Atlas Data Coordination Platform and at GEO accession number GSE174188. Genotypes are available at dbGap accession number phs002812.v1.p1. Code is available at 10.5281/zenodo.4724043 (62).
REFERENCES AND NOTES
- 1.Carter EE, Barr SG, Clarke AE, The global burden of SLE: Prevalence, health disparities and socioeconomic impact. Nat. Rev. Rheumatol 12, 605–620 (2016). doi: 10.1038/nrrheum.2016.137 [DOI] [PubMed] [Google Scholar]
- 2.Kaul A et al. , Systemic lupus erythematosus. Nat. Rev. Dis. Primers 2, 16039 (2016). doi: 10.1038/nrdp.2016.39; [DOI] [PubMed] [Google Scholar]
- 3.Banchereau R et al. , Personalized Immunomonitoring Uncovers Molecular Networks that Stratify Lupus Patients. Cell 165, 551–565 (2016). doi: 10.1016/j.cell.2016.03.008; [DOI] [PMC free article] [PubMed] [Google Scholar]
- 4.Bentham J et al. , Genetic association analyses implicate aberrant regulation of innate and adaptive immunity genes in the pathogenesis of systemic lupus erythematosus. Nat. Genet 47, 1457–1464 (2015). doi: 10.1038/ng.3434 [DOI] [PMC free article] [PubMed] [Google Scholar]
- 5.Banchereau J, Pascual V, Type I interferon in systemic lupus erythematosus and other autoimmune diseases. Immunity 25, 383–392 (2006). doi: 10.1016/j.immuni.2006.08.010 [DOI] [PubMed] [Google Scholar]
- 6.Nehar-Belaid D et al. , Mapping systemic lupus erythematosus heterogeneity at the single-cell level. Nat. Immunol 21, 1094–1106 (2020). doi: 10.1038/s41590-020-0743-0 [DOI] [PMC free article] [PubMed] [Google Scholar]
- 7.Sharma S et al. , Widely divergent transcriptional patterns between SLE patients of different ancestral backgrounds in sorted immune cell populations. J. Autoimmun 60, 51–58 (2015). doi: 10.1016/j.jaut.2015.04.002 [DOI] [PMC free article] [PubMed] [Google Scholar]
- 8.Kang HM et al. , Multiplexed droplet single-cell RNA-sequencing using natural genetic variation. Nat. Biotechnol 36, 89–94 (2018). doi: 10.1038/nbt.4042 [DOI] [PMC free article] [PubMed] [Google Scholar]
- 9.Lanata CM et al. , Genetic contributions to lupus nephritis in a multi-ethnic cohort of systemic lupus erythematous patients. PLOS ONE 13, e0199003 (2018). doi: 10.1371/journal.pone.0199003 [DOI] [PMC free article] [PubMed] [Google Scholar]
- 10.Raj T et al. , Polarization of the effects of autoimmune and neurodegenerative risk alleles in leukocytes. Science 344, 519–523 (2014). doi: 10.1126/science.1249547 [DOI] [PMC free article] [PubMed] [Google Scholar]
- 11.Lee MN et al. , Common genetic variants modulate pathogen-sensing responses in human dendritic cells. Science 343, 1246980 (2014). doi: 10.1126/science.1246980 [DOI] [PMC free article] [PubMed] [Google Scholar]
- 12.Ye CJ et al. , Intersection of population variation and autoimmunity genetics in human T cell activation. Science 345, 1254665 (2014). doi: 10.1126/science.1254665 [DOI] [PMC free article] [PubMed] [Google Scholar]
- 13.Wolock SL, Lopez R, Klein AM, Scrublet: Computational identification of cell Doublets in Single-cell transcriptomic data. Cell Syst. 8, 281–291.e9 (2019). doi: 10.1016/j.cels.2018.11.005 [DOI] [PMC free article] [PubMed] [Google Scholar]
- 14.Traag VA, Waltman L, van Eck NJ, From Louvain to Leiden: Guaranteeing well-connected communities. Sci. Rep 9, 5233 (2019). doi: 10.1038/s41598-019-41695-z [DOI] [PMC free article] [PubMed] [Google Scholar]
- 15.McInnes L, Healy J, Melville J, UMAP: Uniform Manifold Approximation and Projection for Dimension Reduction. arXiv 1802.03426 (2018). [Google Scholar]
- 16.Zhu Z et al. , Causal associations between risk factors and common diseases inferred from GWAS summary data. Nat. Commun 9, 224 (2018). doi: 10.1038/s41467-017-02317-2 [DOI] [PMC free article] [PubMed] [Google Scholar]
- 17.Bycroft C et al. , The UK Biobank resource with deep phenotyping and genomic data. Nature 562, 203–209 (2018). doi: 10.1038/s41586-018-0579-z [DOI] [PMC free article] [PubMed] [Google Scholar]
- 18.Moulton VR et al. , Pathogenesis of human systemic lupus erythematosus: A cellular perspective. Trends Mol. Med 23, 615–635 (2017). doi: 10.1016/j.molmed.2017.05.006 [DOI] [PMC free article] [PubMed] [Google Scholar]
- 19.Rubtsova K, Rubtsov AV, Cancro MP, Marrack P, Age-Associated B Cells: A T-bet-Dependent Effector with Roles in Protective and Pathogenic Immunity. J. Immunol 195, 1933–1937 (2015). doi: 10.4049/jimmunol.1501209 [DOI] [PMC free article] [PubMed] [Google Scholar]
- 20.Ferraro A et al. , Interindividual variation in human T regulatory cells. Proc. Natl. Acad. Sci. U.S.A 111, E1111–E1120 (2014). doi: 10.1073/pnas.1401343111 [DOI] [PMC free article] [PubMed] [Google Scholar]
- 21.Kotliarov Y et al. , Broad immune activation underlies shared set point signatures for vaccine responsiveness in healthy individuals and disease activity in patients with lupus. Nat. Med 26, 618–629 (2020). doi: 10.1038/s41591-020-0769-8 [DOI] [PMC free article] [PubMed] [Google Scholar]
- 22.Shigematsu H et al. , Plasmacytoid dendritic cells activate lymphoid-specific genetic programs irrespective of their cellular origin. Immunity 21, 43–53 (2004). doi: 10.1016/j.immuni.2004.06.011 [DOI] [PubMed] [Google Scholar]
- 23.Villani A-C et al. , Single-cell RNA-seq reveals new types of human blood dendritic cells, monocytes, and progenitors. Science 356, eaah4573 (2017). doi: 10.1126/science.aah4573 [DOI] [PMC free article] [PubMed] [Google Scholar]
- 24.Bergen V, Lange M, Peidli S, Wolf FA, Theis FJ, Generalizing RNA velocity to transient cell states through dynamical modeling. Nat. Biotechnol 38, 1408–1414 (2020). doi: 10.1038/s41587-020-0591-3 [DOI] [PubMed] [Google Scholar]
- 25.La Manno G et al. , RNA velocity of single cells. Nature 560, 494–498 (2018). doi: 10.1038/s41586-018-0414-6 [DOI] [PMC free article] [PubMed] [Google Scholar]
- 26.Buyon JP et al. , The effect of combined estrogen and progesterone hormone replacement therapy on disease activity in systemic lupus erythematosus: A randomized trial. Ann. Intern. Med 142, 953–962 (2005). doi: 10.7326/0003-4819-142-12_Part_1-200506210-00004 [DOI] [PubMed] [Google Scholar]
- 27.Shiow LR et al. , CD69 acts downstream of interferon-α/β to inhibit S1P1 and lymphocyte egress from lymphoid organs. Nature 440, 540–544 (2006). doi: 10.1038/nature04606 [DOI] [PubMed] [Google Scholar]
- 28.Han B, Eskin E, Random-effects model aimed at discovering associations in meta-analysis of genome-wide association studies. Am. J. Hum. Genet 88, 586–598 (2011). doi: 10.1016/j.ajhg.2011.04.014 [DOI] [PMC free article] [PubMed] [Google Scholar]
- 29.Shabalin AA, Matrix eQTL: Ultra fast eQTL analysis via large matrix operations. Bioinformatics 28, 1353–1358 (2012). doi: 10.1093/bioinformatics/bts163 [DOI] [PMC free article] [PubMed] [Google Scholar]
- 30.Yang J, Lee SH, Goddard ME, Visscher PM, GCTA: A tool for genome-wide complex trait analysis. Am. J. Hum. Genet 88, 76–82 (2011). doi: 10.1016/j.ajhg.2010.11.011 [DOI] [PMC free article] [PubMed] [Google Scholar]
- 31.Lu A et al. , Fast and powerful statistical method for context-specific QTL mapping in multi-context genomic studies. bioRxiv 448889 (2021). doi: 10.1101/2021.06.17.448889 [DOI] [Google Scholar]
- 32.Calderon D et al. , Landscape of stimulation-responsive chromatin across diverse human immune cells. Nat. Genet 51, 1494–1505 (2019). doi: 10.1038/s41588-019-0505-9 [DOI] [PMC free article] [PubMed] [Google Scholar]
- 33.Finucane HK et al. , Heritability enrichment of specifically expressed genes identifies disease-relevant tissues and cell types. Nat. Genet 50, 621–629 (2018). doi: 10.1038/s41588-018-0081-4 [DOI] [PMC free article] [PubMed] [Google Scholar]
- 34.Nashi E, Wang Y, Diamond B, The role of B cells in lupus pathogenesis. Int. J. Biochem. Cell Biol 42, 543–550 (2010). doi: 10.1016/j.biocel.2009.10.011 [DOI] [PMC free article] [PubMed] [Google Scholar]
- 35.Hu X et al. , Integrating autoimmune risk loci with gene-expression data identifies specific pathogenic immune cell subsets. Am. J. Hum. Genet 89, 496–506 (2011). doi: 10.1016/j.ajhg.2011.09.002 [DOI] [PMC free article] [PubMed] [Google Scholar]
- 36.Giambartolomei C et al. , 0 CommonMind Consortium, A Bayesian framework for multiple trait colocalization from summary association statistics. Bioinformatics 34, 2538–2545 (2018). doi: 10.1093/bioinformatics/bty147 [DOI] [PMC free article] [PubMed] [Google Scholar]
- 37.Moffatt MF et al. , Genetic variants regulating ORMDL3 expression contribute to the risk of childhood asthma. Nature 448, 470–473 (2007). doi: 10.1038/nature06014 [DOI] [PubMed] [Google Scholar]
- 38.Jostins L et al. , Host-microbe interactions have shaped the genetic architecture of inflammatory bowel disease. Nature 491, 119–124 (2012). doi: 10.1038/nature11582 [DOI] [PMC free article] [PubMed] [Google Scholar]
- 39.Barrett JC et al. , Genome-wide association study and meta-analysis find that over 40 loci affect risk of type 1 diabetes. Nat. Genet 41, 703–707 (2009). doi: 10.1038/ng.381 [DOI] [PMC free article] [PubMed] [Google Scholar]
- 40.Morgan B et al. , Aiolos, a lymphoid restricted transcription factor that interacts with Ikaros to regulate lymphocyte differentiation. EMBO J. 16, 2004–2013 (1997). doi: 10.1093/emboj/16.8.2004 [DOI] [PMC free article] [PubMed] [Google Scholar]
- 41.Li L, Li Y, Bai Y, Role of GSDMB in Pyroptosis and Cancer. Cancer Manag. Res 12, 3033–3043 (2020). doi: 10.2147/CMAR.S246948 [DOI] [PMC free article] [PubMed] [Google Scholar]
- 42.Zhang Y et al. , The ORMDL3 Asthma Gene Regulates ICAM1 and Has Multiple Effects on Cellular Inflammation. Am. J. Respir. Crit. Care Med 199, 478–488 (2019). doi: 10.1164/rccm.201803-0438)C [DOI] [PMC free article] [PubMed] [Google Scholar]
- 43.James B, Milstien S, Spiegel S, ORMDL3 and allergic asthma: From physiology to pathology. J. Allergy Clin. Immunol 144, 634–640 (2019). doi: 10.1016/j.jaci.2019.07.023 [DOI] [PMC free article] [PubMed] [Google Scholar]
- 44.Dang J et al. , ORMDL3 facilitates the survival of splenic B cells via an ATF6α-endoplasmic reticulum stress-Beclin1 autophagy regulatory pathway. J. Immunol 199, 1647–1659 (2017). doi: 10.4049/jimmunol.1602124 [DOI] [PubMed] [Google Scholar]
- 45.Yang J et al. , Conditional and joint multiple-SNP analysis of GWAS summary statistics identifies additional variants influencing complex traits. Nat. Genet 44, 369–375 (2012). doi: 10.1038/ng.2213 [DOI] [PMC free article] [PubMed] [Google Scholar]
- 46.Schmiedel BJ et al. , 17q21 asthma-risk variants switch CTCF binding and regulate IL-2 production by T cells. Nat. Commun 7, 13426 (2016). doi: 10.1038/ncomms13426 [DOI] [PMC free article] [PubMed] [Google Scholar]
- 47.Thompson M et al. , Multi-context genetic modeling of transcriptional regulation resolves novel disease loci. bioRxiv 461579 (2021). doi: 10.1101/2021.09.23.461579 [DOI] [PMC free article] [PubMed] [Google Scholar]
- 48.Ye CJ et al. , Genetic analysis of isoform usage in the human anti-viral response reveals influenza-specific regulation of ERAP2 transcripts under balancing selection. Genome Res. 28, 1812–1825 (2018). doi: 10.1101/gr.240390.118 [DOI] [PMC free article] [PubMed] [Google Scholar]
- 49.Degner JF et al. , DNase I sensitivity QTLs are a major determinant of human expression variation. Nature 482, 390–394 (2012). doi: 10.1038/nature10808 [DOI] [PMC free article] [PubMed] [Google Scholar]
- 50.Rivero SJ, Díaz-Jouanen E, Alarcón-Segovia D, Lymphopenia in systemic lupus erythematosus: Clinical, diagnostic, and prognostic significance. Arthritis Rheum. 21, 295–305 (1978). doi: 10.1002/art.1780210302 [DOI] [PubMed] [Google Scholar]
- 51.Morand EF et al. , Trial of anifrolumab in active systemic lupus erythematosus. N. Engl. J. Med 382, 211–221 (2020). doi: 10.1056/NEJMoa1912196 [DOI] [PubMed] [Google Scholar]
- 52.Cella M et al. , Plasmacytoid monocytes migrate to inflamed lymph nodes and produce large amounts of type I interferon. Nat. Med 5, 919–923 (1999). doi: 10.1038/11360 [DOI] [PubMed] [Google Scholar]
- 53.Niewold TB et al. , Age- and sex-related patterns of serum interferon-α activity in lupus families. Arthritis Rheum. 58, 2113–2119 (2008). doi: 10.1002/art.23619 [DOI] [PMC free article] [PubMed] [Google Scholar]
- 54.Blanco P et al. , Increase in activated CD8+ T lymphocytes expressing perforin and granzyme B correlates with disease activity in patients with systemic lupus erythematosus. Arthritis Rheum. 52, 201–211 (2005). doi: 10.1002/art.20745 [DOI] [PubMed] [Google Scholar]
- 55.Casciola-Rosen L, Andrade F, Ulanet D, Wong WB, Rosen A, Cleavage by granzyme B is strongly predictive of autoantigen status: Implications for initiation of autoimmunity. J. Exp. Med 190, 815–826 (1999). doi: 10.1084/jem.190.6.815 [DOI] [PMC free article] [PubMed] [Google Scholar]
- 56.Faroudi M et al. , Lytic versus stimulatory synapse in cytotoxic T lymphocyte/target cell interaction: Manifestation of a dual activation threshold. Proc. Natl. Acad. Sci. U.S.A 100, 14145–14150 (2003). doi: 10.1073/pnas.2334336100 [DOI] [PMC free article] [PubMed] [Google Scholar]
- 57.Vanderlugt CL, Miller SD, Epitope spreading in immune-mediated diseases: Implications for immunotherapy. Nat. Rev. Immunol 2, 85–95 (2002). doi: 10.1038/nri724 [DOI] [PubMed] [Google Scholar]
- 58.Wolf FA, Angerer P, Theis FJ, SCANPY: Large-scale single-cell gene expression data analysis. Genome Biol. 19,15 (2018). doi: 10.1186/s13059-017-1382-0 [DOI] [PMC free article] [PubMed] [Google Scholar]
- 59.Robinson MD, McCarthy DJ, Smyth GK, edgeR: A Bioconductor package for differential expression analysis of digital gene expression data. Bioinformatics 26, 139–140 (2010). doi: 10.1093/bioinformatics/btp616 [DOI] [PMC free article] [PubMed] [Google Scholar]
- 60.Chen J, Bardes EE, Aronow BJ, Jegga AG, ToppGene Suite for gene list enrichment analysis and candidate gene prioritization. Nucleic Acids Res. 37, W305–W311 (2009). doi: 10.1093/nar/gkp427 [DOI] [PMC free article] [PubMed] [Google Scholar]
- 61.Granja JM et al. , Author Correction: ArchR is a scalable software package for integrative single-cell chromatin accessibility analysis. Nat. Genet 53, 935 (2021). doi: 10.1038/s41588-021-00850-x [DOI] [PMC free article] [PubMed] [Google Scholar]
- 62.Perez RK et al. , Multiplexed scRNA-seq reveals the cellular and genetic correlates of systemic lupus erythematosus Analysis Code (2021), doi: 10.5281/zenodo.4724043. [DOI] [Google Scholar]
Associated Data
This section collects any data citations, data availability statements, or supplementary materials included in this article.
Supplementary Materials
Data Availability Statement
All data are available in the Human Cell Atlas Data Coordination Platform and at GEO accession number GSE174188. Genotypes are available at dbGap accession number phs002812.v1.p1. Code is available at 10.5281/zenodo.4724043 (62).