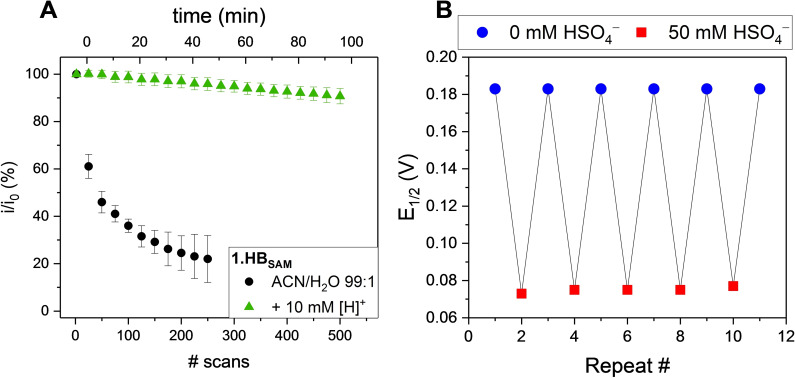
Figure 2.
A) Redox signal stability, as assessed by the relative decrease in peak current ( ), of 1.HBSAM upon repeated SWV cycling in ACN/H2O 99 : 1, 100 mM TBAClO4 in the presence (green triangles) and absence (black circles) of 10 mM HClO4. The measurements in the absence of acid were terminated after 250 scans. The stability at intermediate acid concentrations is shown in Figure S2.1. B) Potential response of 1.HBSAM in ACN/H2O 99 : 1, 10 mM HClO4 in the alternating absence and presence of 0 or 50 mM HSO4 −.

